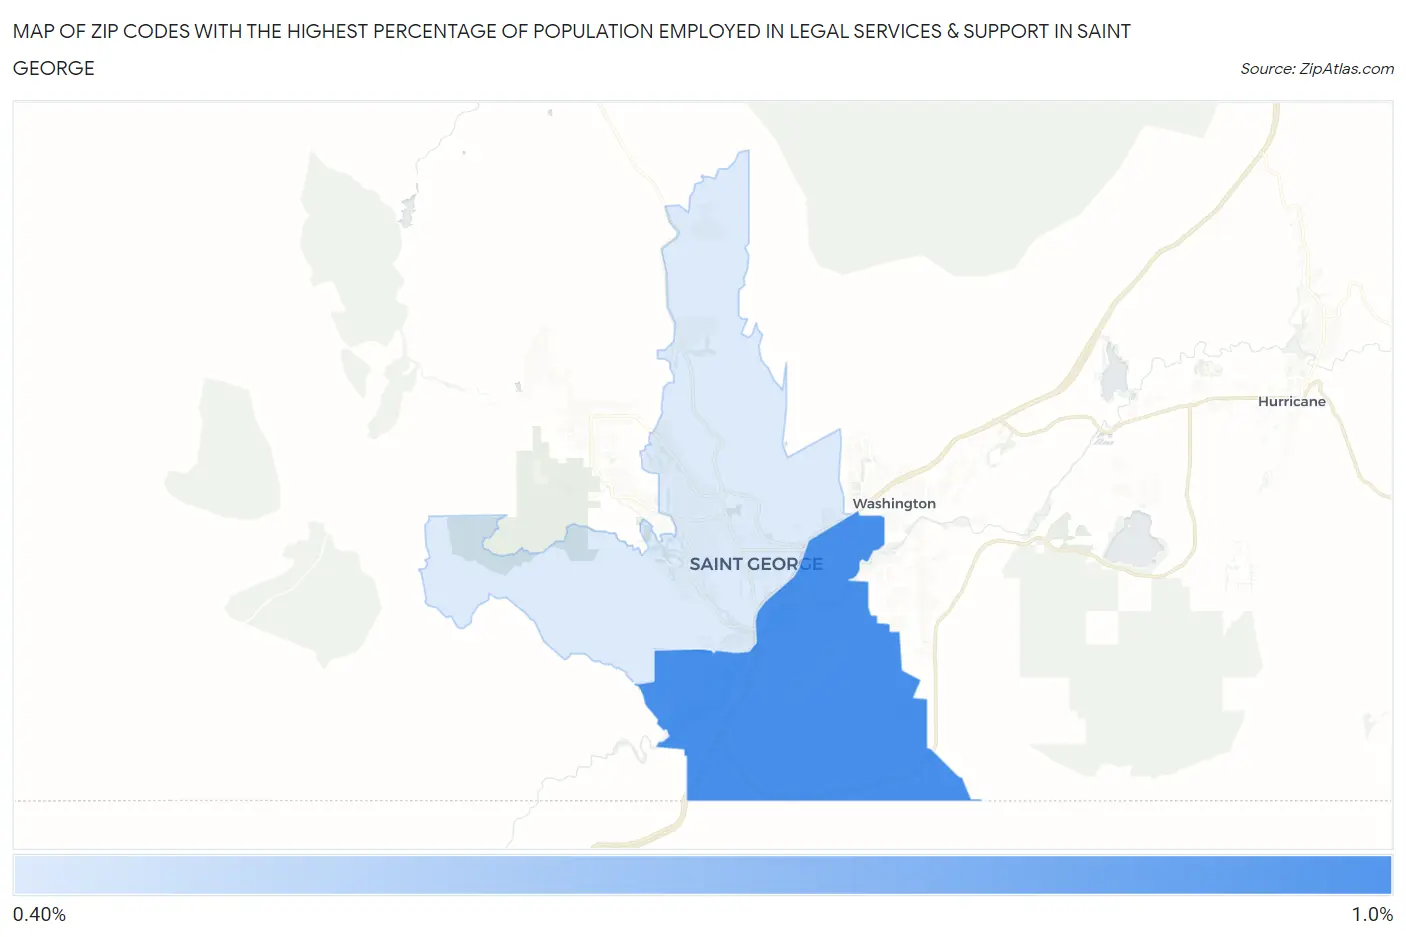
Zip Codes with the Highest Percentage of Population Employed in Legal Services & Support in Saint George, UT
RELATED REPORTS & OPTIONS
Legal Services & Support
Saint George
Compare Zip Codes
Map of Zip Codes with the Highest Percentage of Population Employed in Legal Services & Support in Saint George
0.45%
0.91%
Zip Codes with the Highest Percentage of Population Employed in Legal Services & Support in Saint George, UT
| Zip Code | % Employed | vs State | vs National | |
| 1. | 84790 | 0.91% | 0.86%(+0.054)#63 | 1.2%(-0.274)#8,512 |
| 2. | 84770 | 0.45% | 0.86%(-0.410)#99 | 1.2%(-0.738)#13,294 |
1
Common Questions
What are the Top Zip Codes with the Highest Percentage of Population Employed in Legal Services & Support in Saint George, UT?
Top Zip Codes with the Highest Percentage of Population Employed in Legal Services & Support in Saint George, UT are:
What zip code has the Highest Percentage of Population Employed in Legal Services & Support in Saint George, UT?
84790 has the Highest Percentage of Population Employed in Legal Services & Support in Saint George, UT with 0.91%.
What is the Percentage of Population Employed in Legal Services & Support in Utah?
Percentage of Population Employed in Legal Services & Support in Utah is 0.86%.
What is the Percentage of Population Employed in Legal Services & Support in the United States?
Percentage of Population Employed in Legal Services & Support in the United States is 1.2%.