Zip Codes with the Highest Percentage of Population Employed in Legal Services & Support in Salt Lake City, UT
RELATED REPORTS & OPTIONS
Legal Services & Support
Salt Lake City
Compare Zip Codes
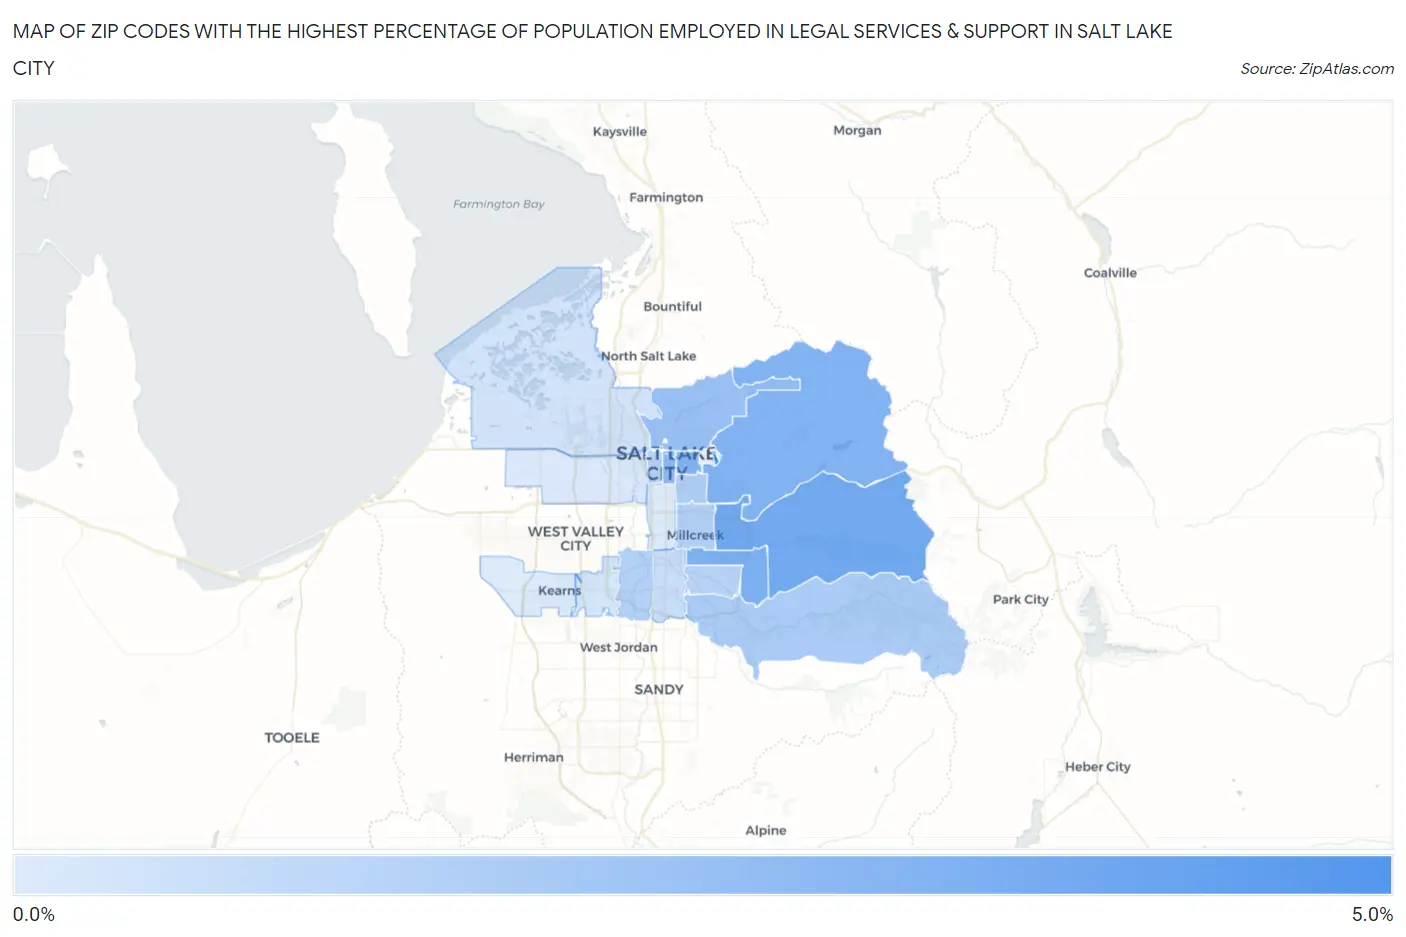
Map of Zip Codes with the Highest Percentage of Population Employed in Legal Services & Support in Salt Lake City
0.21%
4.1%
Zip Codes with the Highest Percentage of Population Employed in Legal Services & Support in Salt Lake City, UT
| Zip Code | % Employed | vs State | vs National | |
| 1. | 84113 | 4.1% | 0.86%(+3.25)#2 | 1.2%(+2.93)#1,071 |
| 2. | 84109 | 3.0% | 0.86%(+2.11)#3 | 1.2%(+1.78)#1,889 |
| 3. | 84124 | 2.7% | 0.86%(+1.83)#4 | 1.2%(+1.51)#2,222 |
| 4. | 84108 | 2.6% | 0.86%(+1.75)#8 | 1.2%(+1.42)#2,344 |
| 5. | 84102 | 2.5% | 0.86%(+1.61)#12 | 1.2%(+1.29)#2,569 |
| 6. | 84111 | 2.2% | 0.86%(+1.35)#13 | 1.2%(+1.02)#3,038 |
| 7. | 84103 | 2.0% | 0.86%(+1.15)#16 | 1.2%(+0.824)#3,461 |
| 8. | 84121 | 1.5% | 0.86%(+0.682)#26 | 1.2%(+0.354)#4,894 |
| 9. | 84105 | 1.3% | 0.86%(+0.451)#38 | 1.2%(+0.122)#5,908 |
| 10. | 84101 | 1.3% | 0.86%(+0.425)#39 | 1.2%(+0.097)#6,037 |
| 11. | 84106 | 1.3% | 0.86%(+0.419)#40 | 1.2%(+0.091)#6,070 |
| 12. | 84123 | 1.2% | 0.86%(+0.391)#44 | 1.2%(+0.063)#6,230 |
| 13. | 84117 | 1.2% | 0.86%(+0.297)#52 | 1.2%(-0.031)#6,805 |
| 14. | 84107 | 0.75% | 0.86%(-0.104)#73 | 1.2%(-0.432)#9,906 |
| 15. | 84116 | 0.52% | 0.86%(-0.336)#93 | 1.2%(-0.664)#12,379 |
| 16. | 84129 | 0.44% | 0.86%(-0.411)#101 | 1.2%(-0.739)#13,309 |
| 17. | 84104 | 0.28% | 0.86%(-0.572)#120 | 1.2%(-0.900)#15,205 |
| 18. | 84115 | 0.22% | 0.86%(-0.639)#123 | 1.2%(-0.967)#16,014 |
| 19. | 84118 | 0.21% | 0.86%(-0.646)#125 | 1.2%(-0.974)#16,095 |
1
Common Questions
What are the Top 10 Zip Codes with the Highest Percentage of Population Employed in Legal Services & Support in Salt Lake City, UT?
Top 10 Zip Codes with the Highest Percentage of Population Employed in Legal Services & Support in Salt Lake City, UT are:
What zip code has the Highest Percentage of Population Employed in Legal Services & Support in Salt Lake City, UT?
84113 has the Highest Percentage of Population Employed in Legal Services & Support in Salt Lake City, UT with 4.1%.
What is the Percentage of Population Employed in Legal Services & Support in Salt Lake City, UT?
Percentage of Population Employed in Legal Services & Support in Salt Lake City is 1.4%.
What is the Percentage of Population Employed in Legal Services & Support in Utah?
Percentage of Population Employed in Legal Services & Support in Utah is 0.86%.
What is the Percentage of Population Employed in Legal Services & Support in the United States?
Percentage of Population Employed in Legal Services & Support in the United States is 1.2%.