Zip Codes with the Highest Percentage of Population Employed in Legal Services & Support in West Jordan, UT
RELATED REPORTS & OPTIONS
Legal Services & Support
West Jordan
Compare Zip Codes
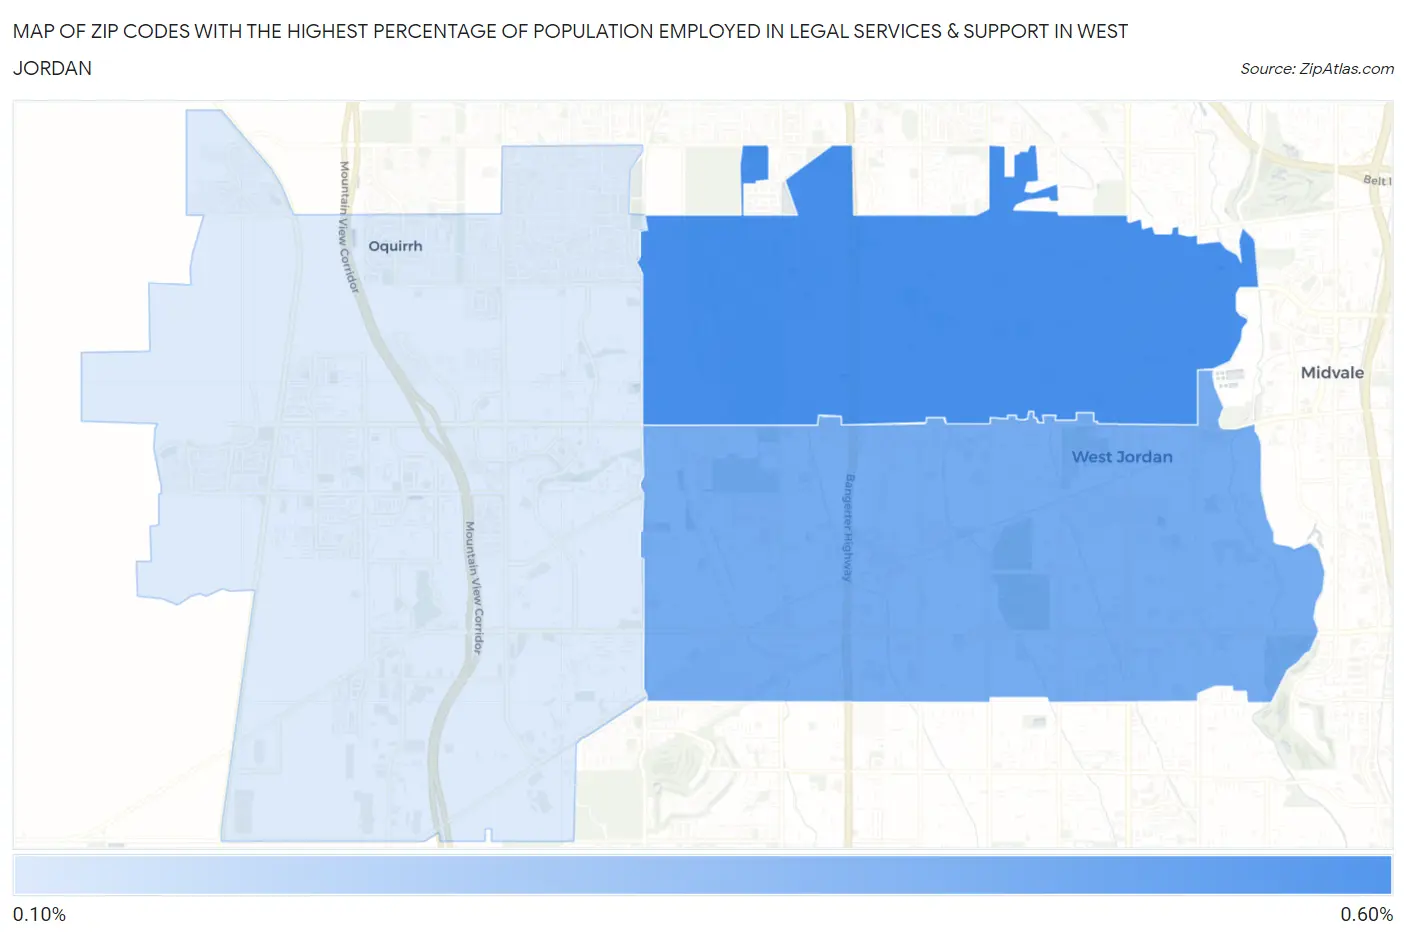
Map of Zip Codes with the Highest Percentage of Population Employed in Legal Services & Support in West Jordan
0.17%
0.53%
Zip Codes with the Highest Percentage of Population Employed in Legal Services & Support in West Jordan, UT
| Zip Code | % Employed | vs State | vs National | |
| 1. | 84084 | 0.53% | 0.86%(-0.324)#90 | 1.2%(-0.652)#12,240 |
| 2. | 84088 | 0.42% | 0.86%(-0.432)#103 | 1.2%(-0.760)#13,561 |
| 3. | 84081 | 0.17% | 0.86%(-0.681)#130 | 1.2%(-1.01)#16,456 |
1
Common Questions
What are the Top Zip Codes with the Highest Percentage of Population Employed in Legal Services & Support in West Jordan, UT?
Top Zip Codes with the Highest Percentage of Population Employed in Legal Services & Support in West Jordan, UT are:
What zip code has the Highest Percentage of Population Employed in Legal Services & Support in West Jordan, UT?
84084 has the Highest Percentage of Population Employed in Legal Services & Support in West Jordan, UT with 0.53%.
What is the Percentage of Population Employed in Legal Services & Support in West Jordan, UT?
Percentage of Population Employed in Legal Services & Support in West Jordan is 0.30%.
What is the Percentage of Population Employed in Legal Services & Support in Utah?
Percentage of Population Employed in Legal Services & Support in Utah is 0.86%.
What is the Percentage of Population Employed in Legal Services & Support in the United States?
Percentage of Population Employed in Legal Services & Support in the United States is 1.2%.