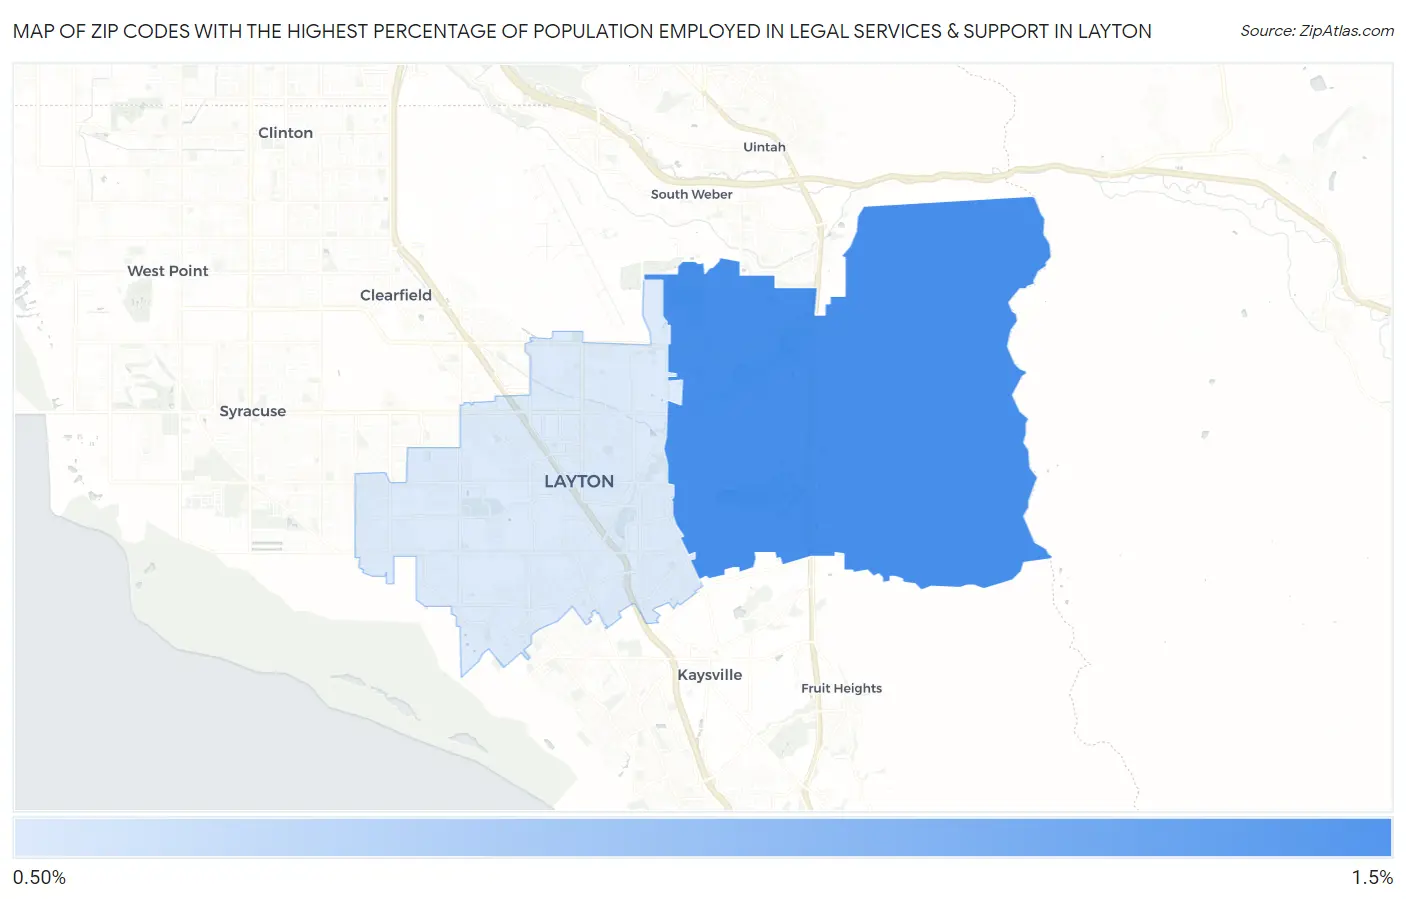
Zip Codes with the Highest Percentage of Population Employed in Legal Services & Support in Layton, UT
RELATED REPORTS & OPTIONS
Legal Services & Support
Layton
Compare Zip Codes
Map of Zip Codes with the Highest Percentage of Population Employed in Legal Services & Support in Layton
0.83%
1.2%
Zip Codes with the Highest Percentage of Population Employed in Legal Services & Support in Layton, UT
| Zip Code | % Employed | vs State | vs National | |
| 1. | 84040 | 1.2% | 0.86%(+0.384)#45 | 1.2%(+0.056)#6,267 |
| 2. | 84041 | 0.83% | 0.86%(-0.023)#69 | 1.2%(-0.351)#9,167 |
1
Common Questions
What are the Top Zip Codes with the Highest Percentage of Population Employed in Legal Services & Support in Layton, UT?
Top Zip Codes with the Highest Percentage of Population Employed in Legal Services & Support in Layton, UT are:
What zip code has the Highest Percentage of Population Employed in Legal Services & Support in Layton, UT?
84040 has the Highest Percentage of Population Employed in Legal Services & Support in Layton, UT with 1.2%.
What is the Percentage of Population Employed in Legal Services & Support in Layton, UT?
Percentage of Population Employed in Legal Services & Support in Layton is 0.97%.
What is the Percentage of Population Employed in Legal Services & Support in Utah?
Percentage of Population Employed in Legal Services & Support in Utah is 0.86%.
What is the Percentage of Population Employed in Legal Services & Support in the United States?
Percentage of Population Employed in Legal Services & Support in the United States is 1.2%.