Zip Codes with the Highest Percentage of Population Employed in Administrative & Support Services in West Jordan, UT
RELATED REPORTS & OPTIONS
Administrative & Support Services
West Jordan
Compare Zip Codes
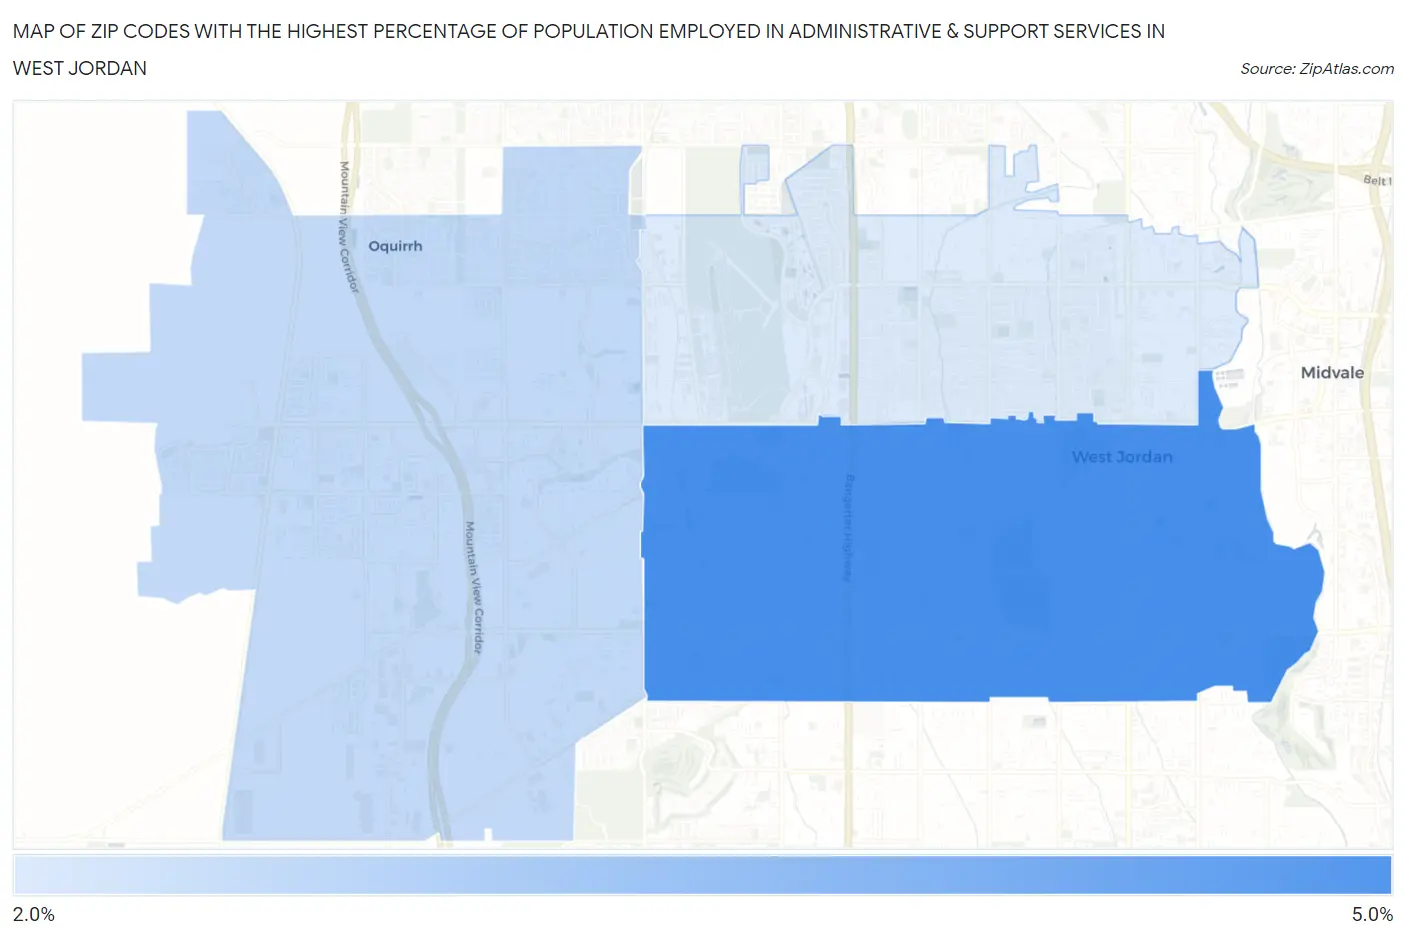
Map of Zip Codes with the Highest Percentage of Population Employed in Administrative & Support Services in West Jordan
2.9%
4.6%
Zip Codes with the Highest Percentage of Population Employed in Administrative & Support Services in West Jordan, UT
| Zip Code | % Employed | vs State | vs National | |
| 1. | 84088 | 4.6% | 4.3%(+0.310)#74 | 4.1%(+0.452)#8,374 |
| 2. | 84081 | 3.2% | 4.3%(-1.06)#131 | 4.1%(-0.920)#14,304 |
| 3. | 84084 | 2.9% | 4.3%(-1.37)#146 | 4.1%(-1.22)#15,863 |
1
Common Questions
What are the Top Zip Codes with the Highest Percentage of Population Employed in Administrative & Support Services in West Jordan, UT?
Top Zip Codes with the Highest Percentage of Population Employed in Administrative & Support Services in West Jordan, UT are:
What zip code has the Highest Percentage of Population Employed in Administrative & Support Services in West Jordan, UT?
84088 has the Highest Percentage of Population Employed in Administrative & Support Services in West Jordan, UT with 4.6%.
What is the Percentage of Population Employed in Administrative & Support Services in West Jordan, UT?
Percentage of Population Employed in Administrative & Support Services in West Jordan is 3.7%.
What is the Percentage of Population Employed in Administrative & Support Services in Utah?
Percentage of Population Employed in Administrative & Support Services in Utah is 4.3%.
What is the Percentage of Population Employed in Administrative & Support Services in the United States?
Percentage of Population Employed in Administrative & Support Services in the United States is 4.1%.