Barton Creek, TX Map & Demographics
Barton Creek Map
Barton Creek Overview
$184,151
PER CAPITA INCOME
$250,001
AVG FAMILY INCOME
$230,556
AVG HOUSEHOLD INCOME
65.7%
WAGE / INCOME GAP [ % ]
34.3¢/ $1
WAGE / INCOME GAP [ $ ]
$6,298
FAMILY INCOME DEFICIT
0.55
INEQUALITY / GINI INDEX
3,234
TOTAL POPULATION
1,513
MALE POPULATION
1,721
FEMALE POPULATION
87.91
MALES / 100 FEMALES
113.75
FEMALES / 100 MALES
55.4
MEDIAN AGE
2.6
AVG FAMILY SIZE
2.1
AVG HOUSEHOLD SIZE
1,413
LABOR FORCE [ PEOPLE ]
50.1%
PERCENT IN LABOR FORCE
2.1%
UNEMPLOYMENT RATE
Income in Barton Creek
Income Overview in Barton Creek
Per Capita Income in Barton Creek is $184,151, while median incomes of families and households are $250,001 and $230,556 respectively.
| Characteristic | Number | Measure |
| Per Capita Income | 3,234 | $184,151 |
| Median Family Income | 966 | $250,001 |
| Mean Family Income | 966 | $519,993 |
| Median Household Income | 1,434 | $230,556 |
| Mean Household Income | 1,434 | $401,024 |
| Income Deficit | 966 | $6,298 |
| Wage / Income Gap (%) | 3,234 | 65.68% |
| Wage / Income Gap ($) | 3,234 | 34.32¢ per $1 |
| Gini / Inequality Index | 3,234 | 0.55 |
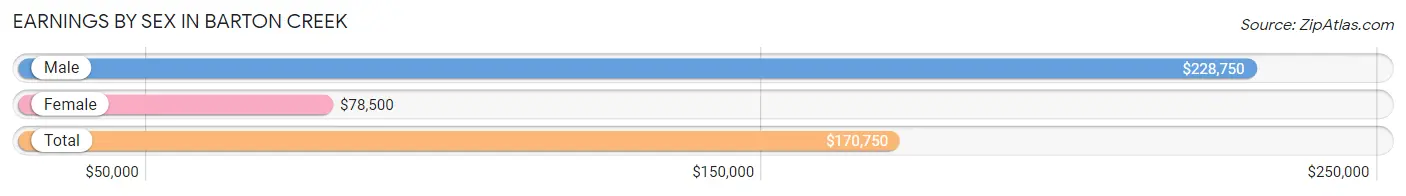
Earnings by Sex in Barton Creek
Average Earnings in Barton Creek are $170,750, $228,750 for men and $78,500 for women, a difference of 65.7%.
| Sex | Number | Average Earnings |
| Male | 996 (68.1%) | $228,750 |
| Female | 466 (31.9%) | $78,500 |
| Total | 1,462 (100.0%) | $170,750 |
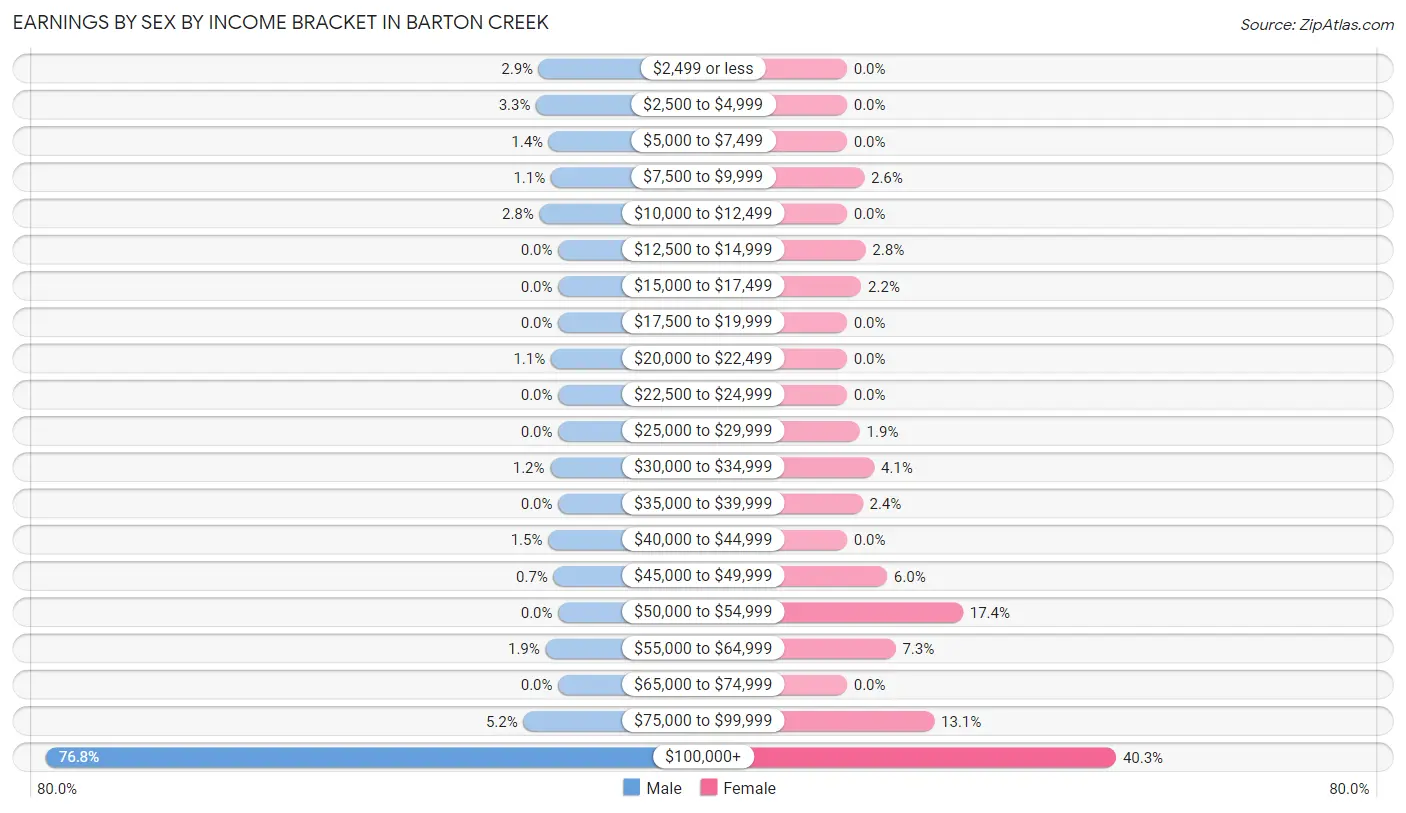
Earnings by Sex by Income Bracket in Barton Creek
The most common earnings brackets in Barton Creek are $100,000+ for men (765 | 76.8%) and $100,000+ for women (188 | 40.3%).
| Income | Male | Female |
| $2,499 or less | 29 (2.9%) | 0 (0.0%) |
| $2,500 to $4,999 | 33 (3.3%) | 0 (0.0%) |
| $5,000 to $7,499 | 14 (1.4%) | 0 (0.0%) |
| $7,500 to $9,999 | 11 (1.1%) | 12 (2.6%) |
| $10,000 to $12,499 | 28 (2.8%) | 0 (0.0%) |
| $12,500 to $14,999 | 0 (0.0%) | 13 (2.8%) |
| $15,000 to $17,499 | 0 (0.0%) | 10 (2.1%) |
| $17,500 to $19,999 | 0 (0.0%) | 0 (0.0%) |
| $20,000 to $22,499 | 11 (1.1%) | 0 (0.0%) |
| $22,500 to $24,999 | 0 (0.0%) | 0 (0.0%) |
| $25,000 to $29,999 | 0 (0.0%) | 9 (1.9%) |
| $30,000 to $34,999 | 12 (1.2%) | 19 (4.1%) |
| $35,000 to $39,999 | 0 (0.0%) | 11 (2.4%) |
| $40,000 to $44,999 | 15 (1.5%) | 0 (0.0%) |
| $45,000 to $49,999 | 7 (0.7%) | 28 (6.0%) |
| $50,000 to $54,999 | 0 (0.0%) | 81 (17.4%) |
| $55,000 to $64,999 | 19 (1.9%) | 34 (7.3%) |
| $65,000 to $74,999 | 0 (0.0%) | 0 (0.0%) |
| $75,000 to $99,999 | 52 (5.2%) | 61 (13.1%) |
| $100,000+ | 765 (76.8%) | 188 (40.3%) |
| Total | 996 (100.0%) | 466 (100.0%) |
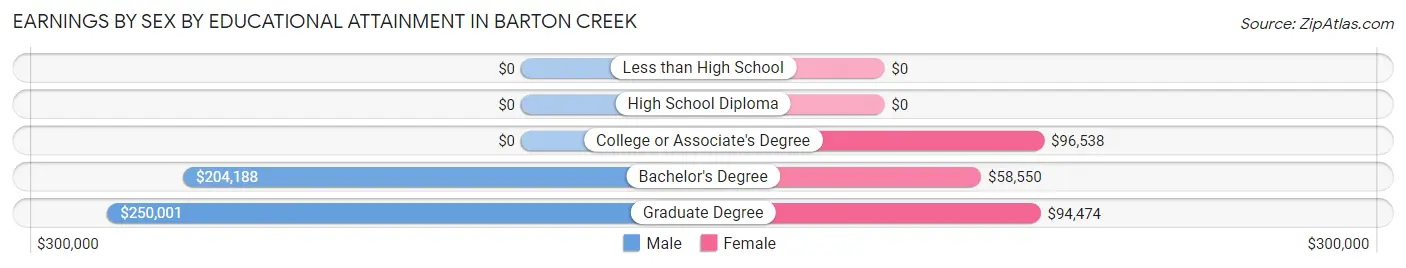
Earnings by Sex by Educational Attainment in Barton Creek
Average earnings in Barton Creek are $249,934 for men and $78,500 for women, a difference of 68.6%. Men with an educational attainment of graduate degree enjoy the highest average annual earnings of $250,001, while those with bachelor's degree education earn the least with $204,188. Women with an educational attainment of college or associate's degree earn the most with the average annual earnings of $96,538, while those with bachelor's degree education have the smallest earnings of $58,550.
| Educational Attainment | Male Income | Female Income |
| Less than High School | - | - |
| High School Diploma | - | - |
| College or Associate's Degree | - | - |
| Bachelor's Degree | $204,188 | $58,550 |
| Graduate Degree | $250,001 | $94,474 |
| Total | $249,934 | $78,500 |
Family Income in Barton Creek
Family Income Brackets in Barton Creek
According to the Barton Creek family income data, there are 632 families falling into the $200,000+ income range, which is the most common income bracket and makes up 65.4% of all families.
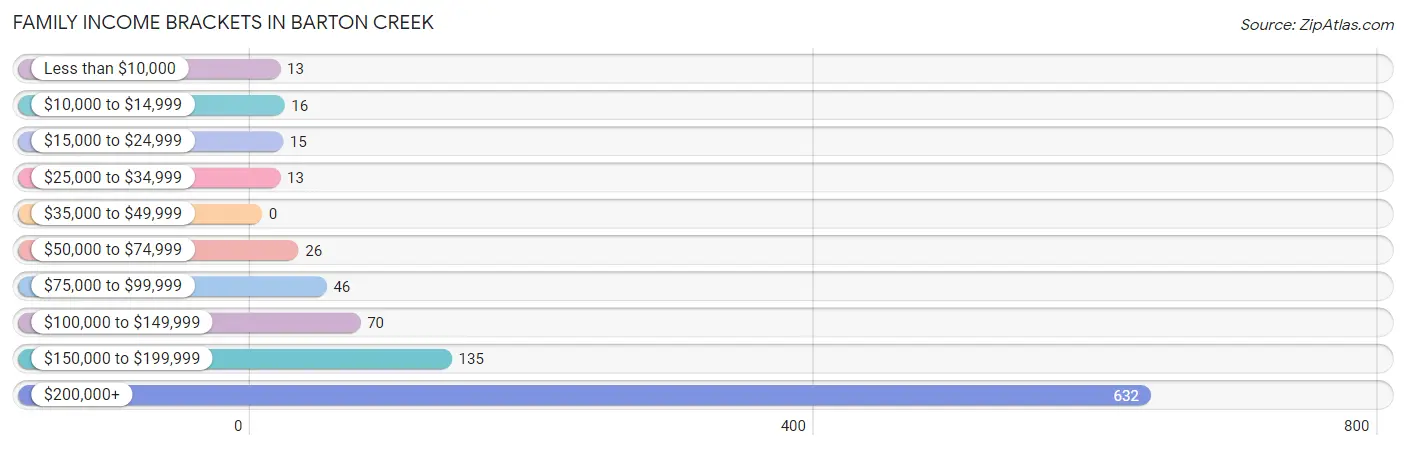
| Income Bracket | # Families | % Families |
| Less than $10,000 | 13 | 1.3% |
| $10,000 to $14,999 | 16 | 1.7% |
| $15,000 to $24,999 | 15 | 1.6% |
| $25,000 to $34,999 | 13 | 1.3% |
| $35,000 to $49,999 | 0 | 0.0% |
| $50,000 to $74,999 | 26 | 2.7% |
| $75,000 to $99,999 | 46 | 4.8% |
| $100,000 to $149,999 | 70 | 7.2% |
| $150,000 to $199,999 | 135 | 14.0% |
| $200,000+ | 632 | 65.4% |
Family Income by Famaliy Size in Barton Creek
3-person families (237 | 24.5%) account for the highest median family income in Barton Creek with $250,001 per family, while 2-person families (545 | 56.4%) have the highest median income of $108,490 per family member.
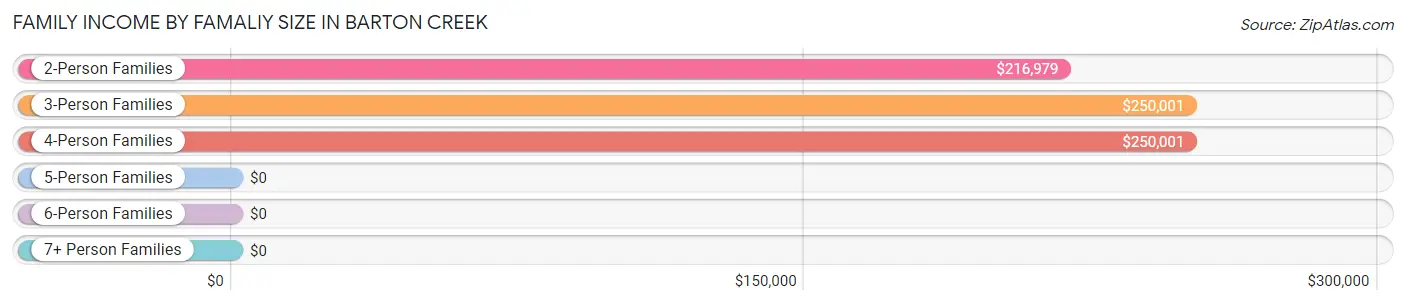
| Income Bracket | # Families | Median Income |
| 2-Person Families | 545 (56.4%) | $216,979 |
| 3-Person Families | 237 (24.5%) | $250,001 |
| 4-Person Families | 156 (16.2%) | $250,001 |
| 5-Person Families | 0 (0.0%) | $0 |
| 6-Person Families | 16 (1.7%) | $0 |
| 7+ Person Families | 12 (1.2%) | $0 |
| Total | 966 (100.0%) | $250,001 |
Family Income by Number of Earners in Barton Creek
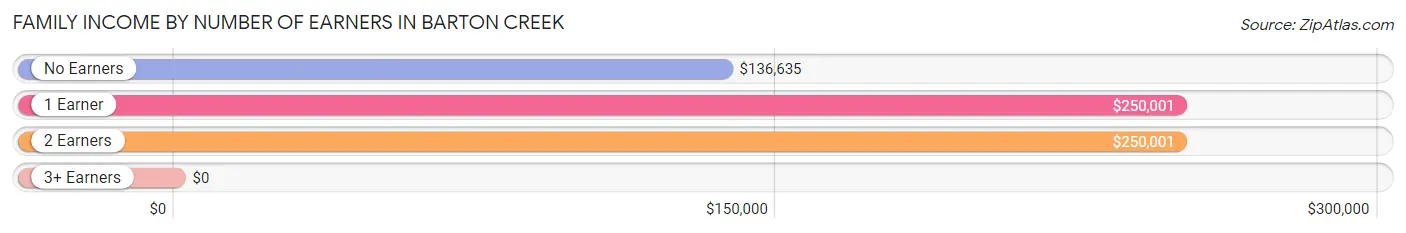
| Number of Earners | # Families | Median Income |
| No Earners | 167 (17.3%) | $136,635 |
| 1 Earner | 392 (40.6%) | $250,001 |
| 2 Earners | 407 (42.1%) | $250,001 |
| 3+ Earners | 0 (0.0%) | $0 |
| Total | 966 (100.0%) | $250,001 |
Household Income in Barton Creek
Household Income Brackets in Barton Creek
With 761 households falling in the category, the $200,000+ income range is the most frequent in Barton Creek, accounting for 53.1% of all households. In contrast, only 26 households (1.8%) fall into the $10,000 to $14,999 income bracket, making it the least populous group.
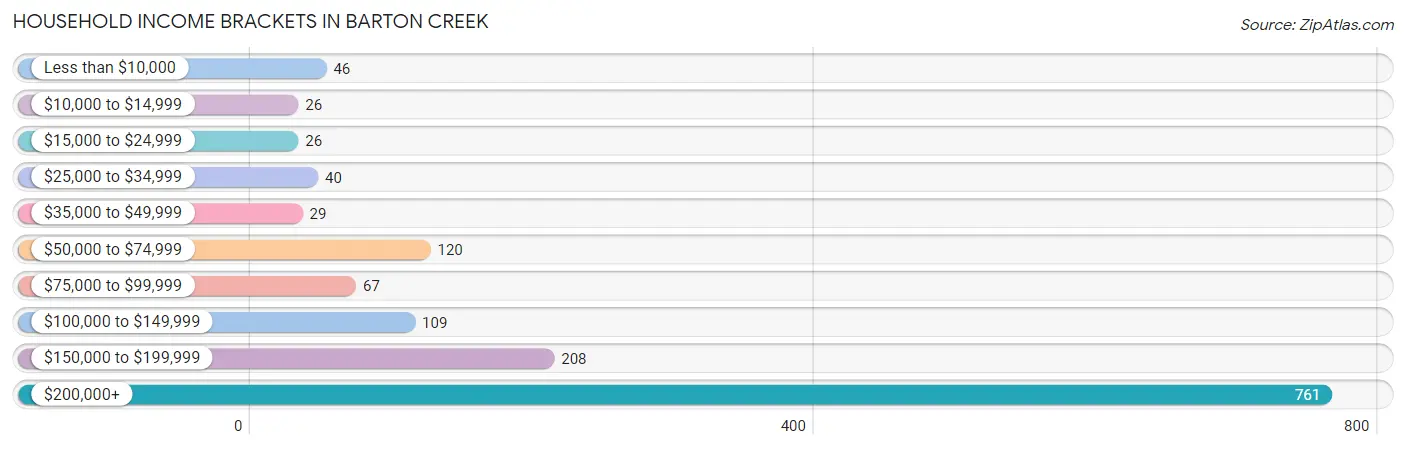
| Income Bracket | # Households | % Households |
| Less than $10,000 | 46 | 3.2% |
| $10,000 to $14,999 | 26 | 1.8% |
| $15,000 to $24,999 | 26 | 1.8% |
| $25,000 to $34,999 | 40 | 2.8% |
| $35,000 to $49,999 | 29 | 2.0% |
| $50,000 to $74,999 | 120 | 8.4% |
| $75,000 to $99,999 | 67 | 4.7% |
| $100,000 to $149,999 | 109 | 7.6% |
| $150,000 to $199,999 | 208 | 14.5% |
| $200,000+ | 761 | 53.1% |
Household Income by Householder Age in Barton Creek
The median household income in Barton Creek is $230,556, with the highest median household income of $250,001 found in the 25 to 44 years age bracket for the primary householder. A total of 189 households (13.2%) fall into this category. Meanwhile, the 15 to 24 years age bracket for the primary householder has the lowest median household income of $0, with 10 households (0.7%) in this group.
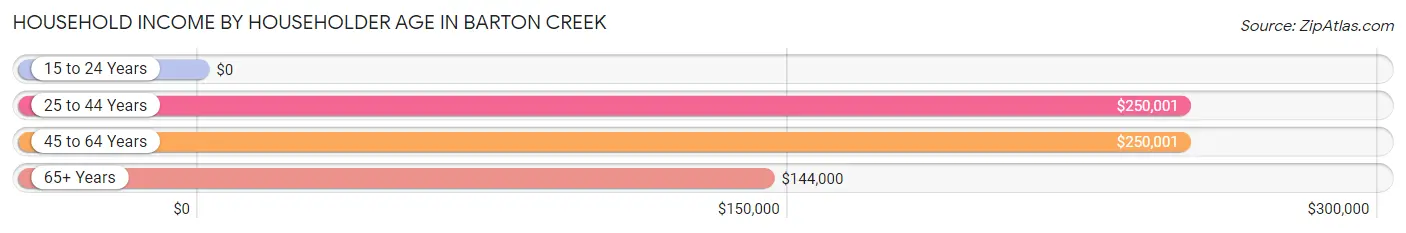
| Income Bracket | # Households | Median Income |
| 15 to 24 Years | 10 (0.7%) | $0 |
| 25 to 44 Years | 189 (13.2%) | $250,001 |
| 45 to 64 Years | 691 (48.2%) | $250,001 |
| 65+ Years | 544 (37.9%) | $144,000 |
| Total | 1,434 (100.0%) | $230,556 |
Poverty in Barton Creek
Income Below Poverty by Sex and Age in Barton Creek
With 4.4% poverty level for males and 4.9% for females among the residents of Barton Creek, 18 to 24 year old males and 55 to 64 year old females are the most vulnerable to poverty, with 21 males (20.2%) and 26 females (9.9%) in their respective age groups living below the poverty level.
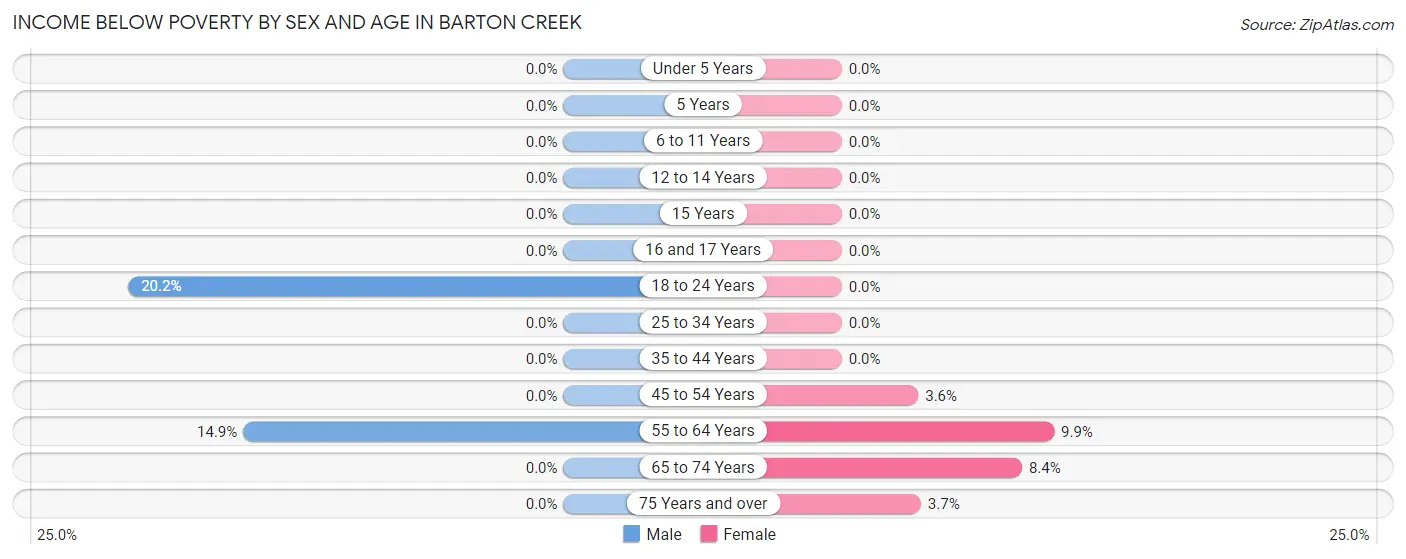
| Age Bracket | Male | Female |
| Under 5 Years | 0 (0.0%) | 0 (0.0%) |
| 5 Years | 0 (0.0%) | 0 (0.0%) |
| 6 to 11 Years | 0 (0.0%) | 0 (0.0%) |
| 12 to 14 Years | 0 (0.0%) | 0 (0.0%) |
| 15 Years | 0 (0.0%) | 0 (0.0%) |
| 16 and 17 Years | 0 (0.0%) | 0 (0.0%) |
| 18 to 24 Years | 21 (20.2%) | 0 (0.0%) |
| 25 to 34 Years | 0 (0.0%) | 0 (0.0%) |
| 35 to 44 Years | 0 (0.0%) | 0 (0.0%) |
| 45 to 54 Years | 0 (0.0%) | 15 (3.5%) |
| 55 to 64 Years | 44 (14.9%) | 26 (9.9%) |
| 65 to 74 Years | 0 (0.0%) | 27 (8.4%) |
| 75 Years and over | 0 (0.0%) | 8 (3.7%) |
| Total | 65 (4.4%) | 76 (4.9%) |
Income Above Poverty by Sex and Age in Barton Creek
According to the poverty statistics in Barton Creek, males aged under 5 years and females aged 6 to 11 years are the age groups that are most secure financially, with 100.0% of males and 100.0% of females in these age groups living above the poverty line.
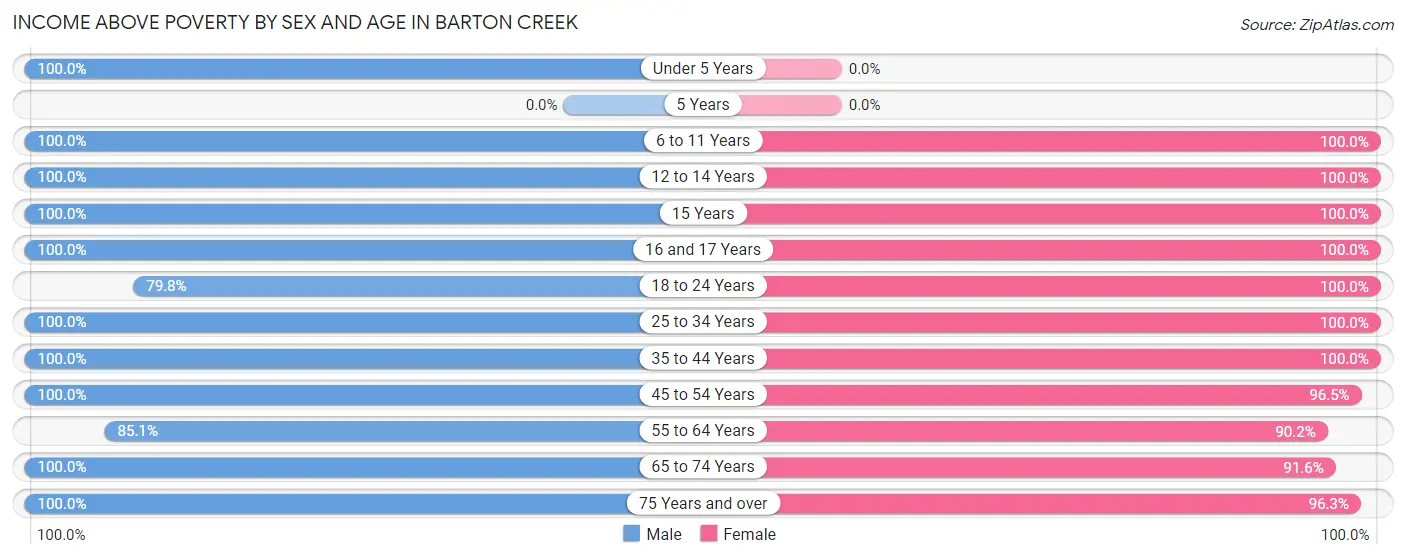
| Age Bracket | Male | Female |
| Under 5 Years | 87 (100.0%) | 0 (0.0%) |
| 5 Years | 0 (0.0%) | 0 (0.0%) |
| 6 to 11 Years | 54 (100.0%) | 118 (100.0%) |
| 12 to 14 Years | 64 (100.0%) | 24 (100.0%) |
| 15 Years | 55 (100.0%) | 12 (100.0%) |
| 16 and 17 Years | 52 (100.0%) | 58 (100.0%) |
| 18 to 24 Years | 83 (79.8%) | 29 (100.0%) |
| 25 to 34 Years | 92 (100.0%) | 82 (100.0%) |
| 35 to 44 Years | 97 (100.0%) | 15 (100.0%) |
| 45 to 54 Years | 241 (100.0%) | 408 (96.5%) |
| 55 to 64 Years | 252 (85.1%) | 238 (90.1%) |
| 65 to 74 Years | 261 (100.0%) | 296 (91.6%) |
| 75 Years and over | 81 (100.0%) | 210 (96.3%) |
| Total | 1,419 (95.6%) | 1,490 (95.2%) |
Income Below Poverty Among Married-Couple Families in Barton Creek
The poverty statistics for married-couple families in Barton Creek show that 4.9% or 44 of the total 897 families live below the poverty line. Families with no children have the highest poverty rate of 8.0%, comprising of 44 families. On the other hand, families with 1 or 2 children have the lowest poverty rate of 0.0%, which includes 0 families.
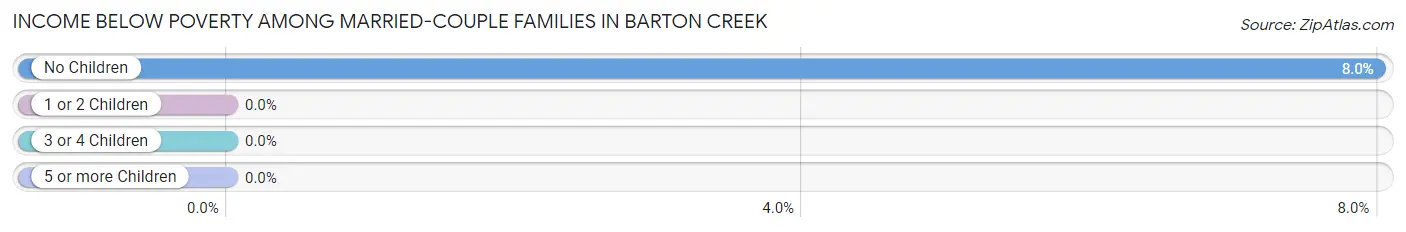
| Children | Above Poverty | Below Poverty |
| No Children | 507 (92.0%) | 44 (8.0%) |
| 1 or 2 Children | 334 (100.0%) | 0 (0.0%) |
| 3 or 4 Children | 0 (0.0%) | 0 (0.0%) |
| 5 or more Children | 12 (100.0%) | 0 (0.0%) |
| Total | 853 (95.1%) | 44 (4.9%) |
Income Below Poverty Among Single-Parent Households in Barton Creek
| Children | Single Father | Single Mother |
| No Children | 0 (0.0%) | 0 (0.0%) |
| 1 or 2 Children | 0 (0.0%) | 0 (0.0%) |
| 3 or 4 Children | 0 (0.0%) | 0 (0.0%) |
| 5 or more Children | 0 (0.0%) | 0 (0.0%) |
| Total | 0 (0.0%) | 0 (0.0%) |
Income Below Poverty Among Married-Couple vs Single-Parent Households in Barton Creek
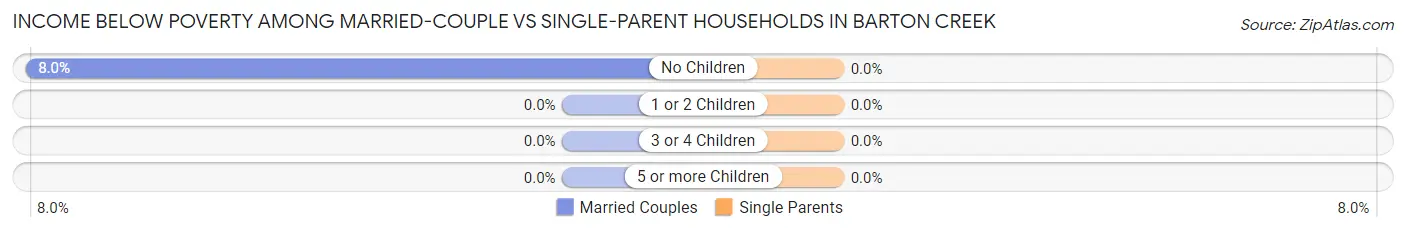
| Children | Married-Couple Families | Single-Parent Households |
| No Children | 44 (8.0%) | 0 (0.0%) |
| 1 or 2 Children | 0 (0.0%) | 0 (0.0%) |
| 3 or 4 Children | 0 (0.0%) | 0 (0.0%) |
| 5 or more Children | 0 (0.0%) | 0 (0.0%) |
| Total | 44 (4.9%) | 0 (0.0%) |
Race in Barton Creek
The most populous races in Barton Creek are White / Caucasian (3,103 | 96.0%), Hispanic or Latino (110 | 3.4%), and Asian (77 | 2.4%).
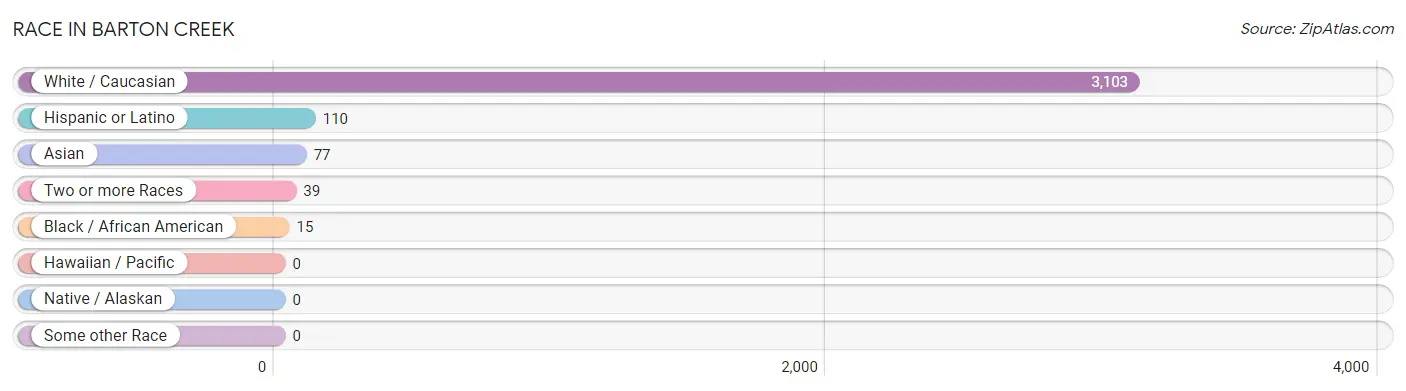
| Race | # Population | % Population |
| Asian | 77 | 2.4% |
| Black / African American | 15 | 0.5% |
| Hawaiian / Pacific | 0 | 0.0% |
| Hispanic or Latino | 110 | 3.4% |
| Native / Alaskan | 0 | 0.0% |
| White / Caucasian | 3,103 | 96.0% |
| Two or more Races | 39 | 1.2% |
| Some other Race | 0 | 0.0% |
| Total | 3,234 | 100.0% |
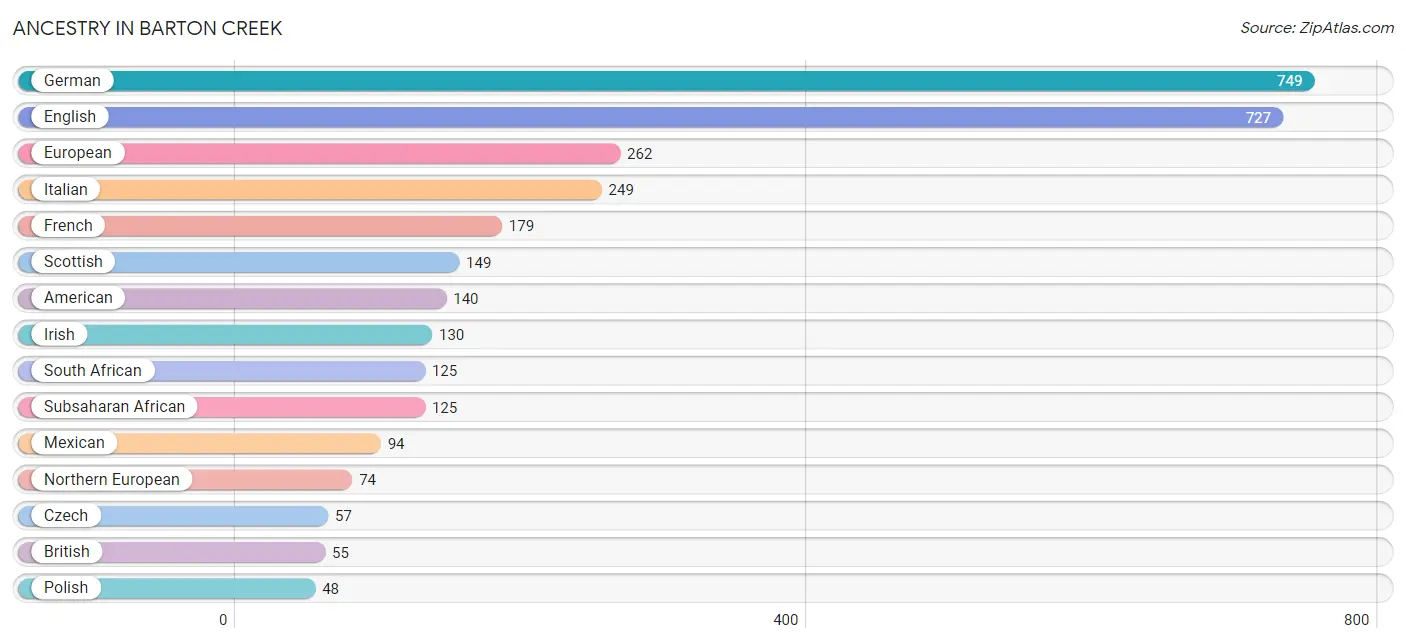
Ancestry in Barton Creek
The most populous ancestries reported in Barton Creek are German (749 | 23.2%), English (727 | 22.5%), European (262 | 8.1%), Italian (249 | 7.7%), and French (179 | 5.5%), together accounting for 67.0% of all Barton Creek residents.
| Ancestry | # Population | % Population |
| American | 140 | 4.3% |
| Arab | 8 | 0.3% |
| Argentinean | 16 | 0.5% |
| Belgian | 36 | 1.1% |
| Bhutanese | 17 | 0.5% |
| British | 55 | 1.7% |
| Crow | 3 | 0.1% |
| Czech | 57 | 1.8% |
| Eastern European | 37 | 1.1% |
| English | 727 | 22.5% |
| European | 262 | 8.1% |
| Finnish | 27 | 0.8% |
| French | 179 | 5.5% |
| German | 749 | 23.2% |
| Greek | 21 | 0.6% |
| Hungarian | 21 | 0.6% |
| Indian (Asian) | 24 | 0.7% |
| Irish | 130 | 4.0% |
| Italian | 249 | 7.7% |
| Korean | 42 | 1.3% |
| Latvian | 13 | 0.4% |
| Lebanese | 8 | 0.3% |
| Mexican | 94 | 2.9% |
| Northern European | 74 | 2.3% |
| Polish | 48 | 1.5% |
| Portuguese | 41 | 1.3% |
| Russian | 44 | 1.4% |
| Scotch-Irish | 42 | 1.3% |
| Scottish | 149 | 4.6% |
| Slovak | 15 | 0.5% |
| Slovene | 12 | 0.4% |
| South African | 125 | 3.9% |
| South American | 16 | 0.5% |
| Subsaharan African | 125 | 3.9% |
| Swedish | 37 | 1.1% |
| Swiss | 9 | 0.3% |
| Thai | 11 | 0.3% |
| Welsh | 29 | 0.9% | View All 38 Rows |
Immigrants in Barton Creek
The most numerous immigrant groups reported in Barton Creek came from Europe (140 | 4.3%), Northern Europe (68 | 2.1%), Africa (65 | 2.0%), South Africa (65 | 2.0%), and Western Europe (59 | 1.8%), together accounting for 12.3% of all Barton Creek residents.
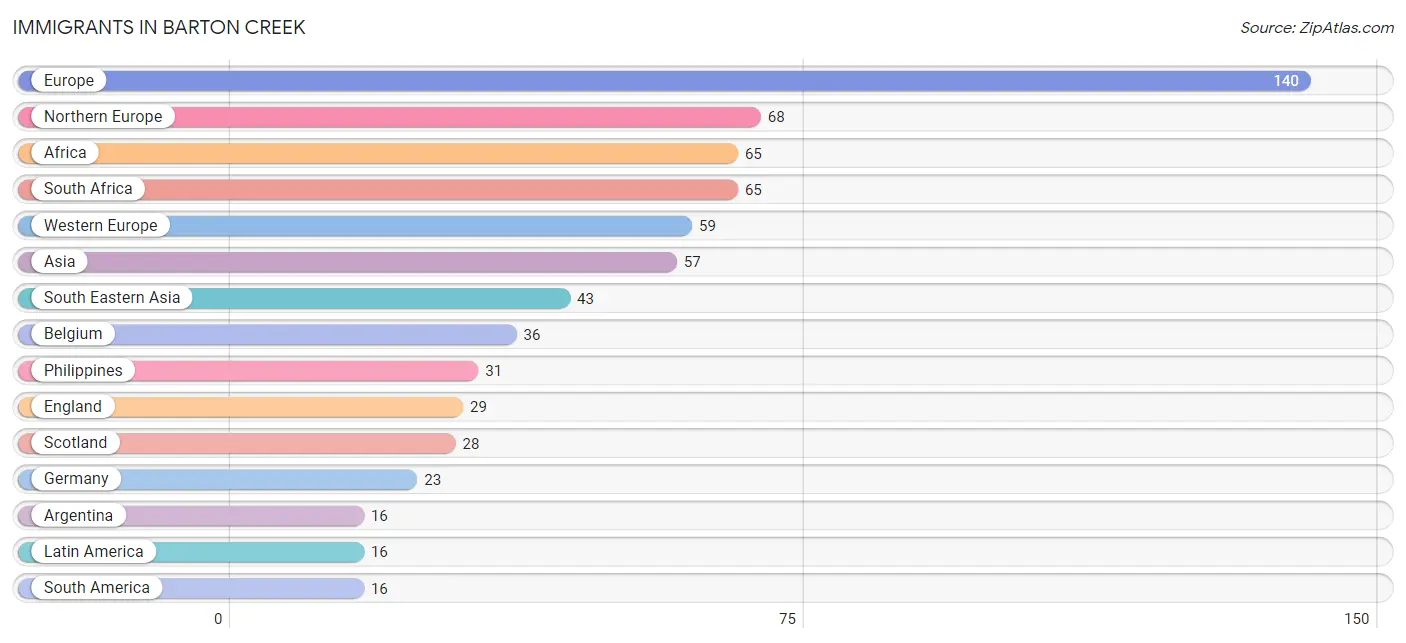
| Immigration Origin | # Population | % Population |
| Africa | 65 | 2.0% |
| Argentina | 16 | 0.5% |
| Asia | 57 | 1.8% |
| Belgium | 36 | 1.1% |
| Canada | 9 | 0.3% |
| Eastern Europe | 13 | 0.4% |
| England | 29 | 0.9% |
| Europe | 140 | 4.3% |
| Germany | 23 | 0.7% |
| India | 14 | 0.4% |
| Latin America | 16 | 0.5% |
| Malaysia | 12 | 0.4% |
| Northern Europe | 68 | 2.1% |
| Philippines | 31 | 1.0% |
| Poland | 13 | 0.4% |
| Scotland | 28 | 0.9% |
| South Africa | 65 | 2.0% |
| South America | 16 | 0.5% |
| South Central Asia | 14 | 0.4% |
| South Eastern Asia | 43 | 1.3% |
| Western Europe | 59 | 1.8% | View All 21 Rows |
Sex and Age in Barton Creek
Sex and Age in Barton Creek
The most populous age groups in Barton Creek are 55 to 59 Years (203 | 13.4%) for men and 50 to 54 Years (229 | 13.3%) for women.
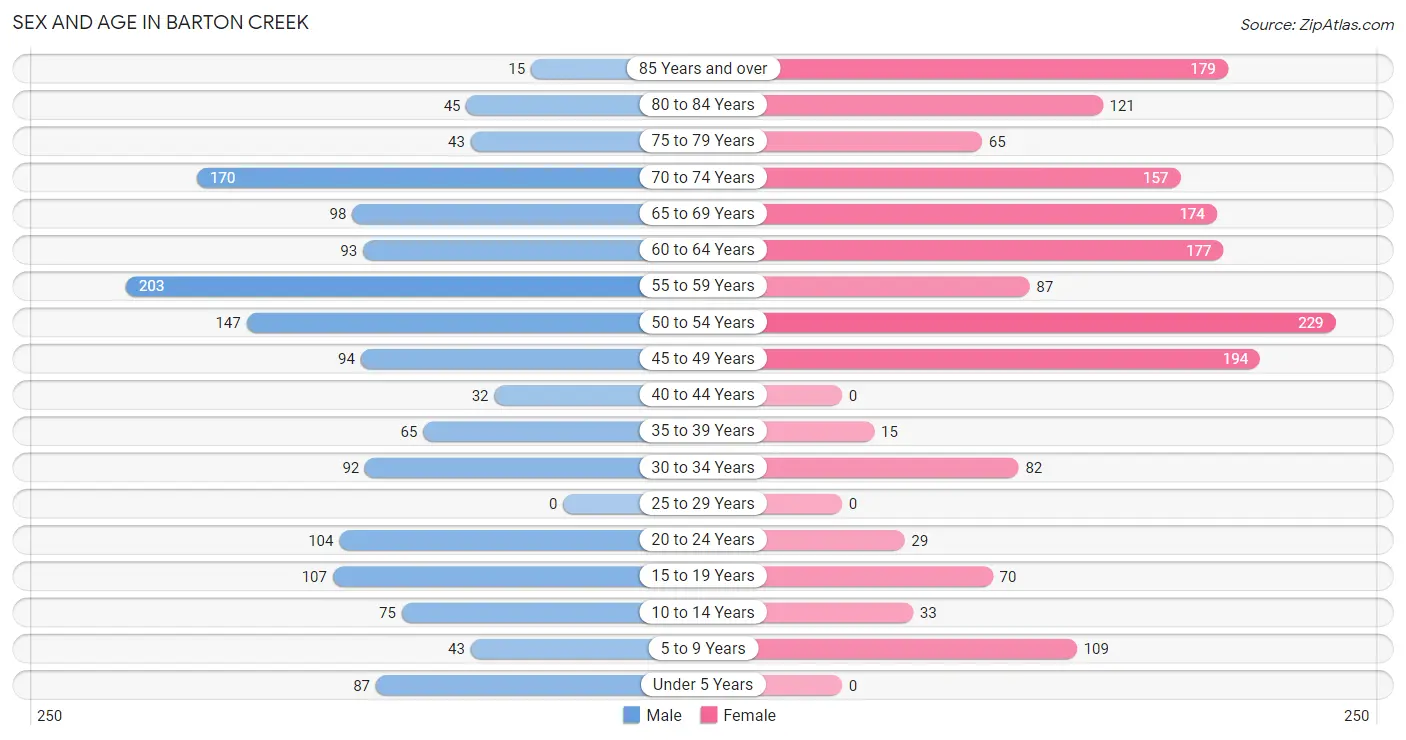
| Age Bracket | Male | Female |
| Under 5 Years | 87 (5.8%) | 0 (0.0%) |
| 5 to 9 Years | 43 (2.8%) | 109 (6.3%) |
| 10 to 14 Years | 75 (5.0%) | 33 (1.9%) |
| 15 to 19 Years | 107 (7.1%) | 70 (4.1%) |
| 20 to 24 Years | 104 (6.9%) | 29 (1.7%) |
| 25 to 29 Years | 0 (0.0%) | 0 (0.0%) |
| 30 to 34 Years | 92 (6.1%) | 82 (4.8%) |
| 35 to 39 Years | 65 (4.3%) | 15 (0.9%) |
| 40 to 44 Years | 32 (2.1%) | 0 (0.0%) |
| 45 to 49 Years | 94 (6.2%) | 194 (11.3%) |
| 50 to 54 Years | 147 (9.7%) | 229 (13.3%) |
| 55 to 59 Years | 203 (13.4%) | 87 (5.1%) |
| 60 to 64 Years | 93 (6.1%) | 177 (10.3%) |
| 65 to 69 Years | 98 (6.5%) | 174 (10.1%) |
| 70 to 74 Years | 170 (11.2%) | 157 (9.1%) |
| 75 to 79 Years | 43 (2.8%) | 65 (3.8%) |
| 80 to 84 Years | 45 (3.0%) | 121 (7.0%) |
| 85 Years and over | 15 (1.0%) | 179 (10.4%) |
| Total | 1,513 (100.0%) | 1,721 (100.0%) |
Families and Households in Barton Creek
Median Family Size in Barton Creek
The median family size in Barton Creek is 2.64 persons per family, with married-couple families (897 | 92.9%) accounting for the largest median family size of 2.68 persons per family. On the other hand, single male/father families (33 | 3.4%) represent the smallest median family size with 1.82 persons per family.
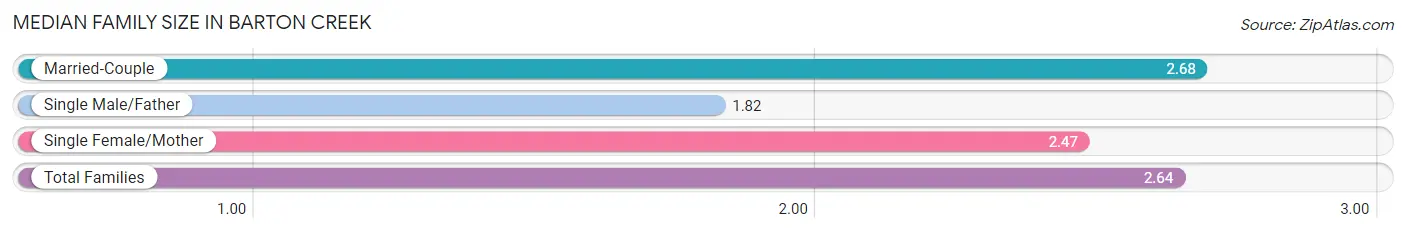
| Family Type | # Families | Family Size |
| Married-Couple | 897 (92.9%) | 2.68 |
| Single Male/Father | 33 (3.4%) | 1.82 |
| Single Female/Mother | 36 (3.7%) | 2.47 |
| Total Families | 966 (100.0%) | 2.64 |
Median Household Size in Barton Creek
The median household size in Barton Creek is 2.13 persons per household, with married-couple households (897 | 62.5%) accounting for the largest median household size of 2.68 persons per household. non-family households (468 | 32.6%) represent the smallest median household size with 1.07 persons per household.
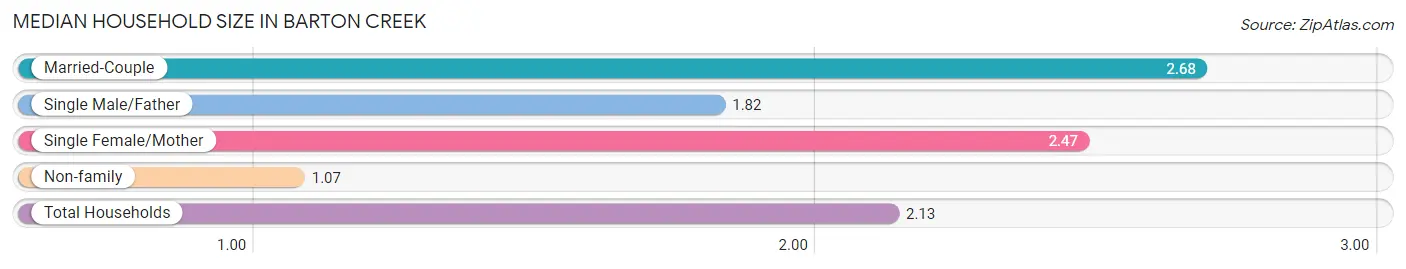
| Household Type | # Households | Household Size |
| Married-Couple | 897 (62.5%) | 2.68 |
| Single Male/Father | 33 (2.3%) | 1.82 |
| Single Female/Mother | 36 (2.5%) | 2.47 |
| Non-family | 468 (32.6%) | 1.07 |
| Total Households | 1,434 (100.0%) | 2.13 |
Household Size by Marriage Status in Barton Creek
Out of a total of 1,434 households in Barton Creek, 966 (67.4%) are family households, while 468 (32.6%) are nonfamily households. The most numerous type of family households are 2-person households, comprising 545, and the most common type of nonfamily households are 1-person households, comprising 458.
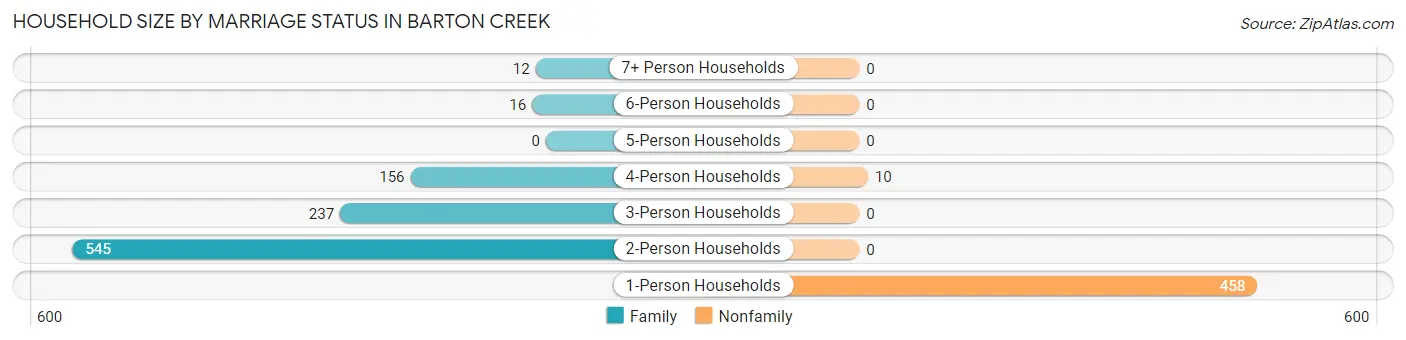
| Household Size | Family Households | Nonfamily Households |
| 1-Person Households | - | 458 (31.9%) |
| 2-Person Households | 545 (38.0%) | 0 (0.0%) |
| 3-Person Households | 237 (16.5%) | 0 (0.0%) |
| 4-Person Households | 156 (10.9%) | 10 (0.7%) |
| 5-Person Households | 0 (0.0%) | 0 (0.0%) |
| 6-Person Households | 16 (1.1%) | 0 (0.0%) |
| 7+ Person Households | 12 (0.8%) | 0 (0.0%) |
| Total | 966 (67.4%) | 468 (32.6%) |
Female Fertility in Barton Creek
Fertility by Age in Barton Creek
| Age Bracket | Women with Births | Births / 1,000 Women |
| 15 to 19 years | 0 (0.0%) | 0.0 |
| 20 to 34 years | 0 (0.0%) | 0.0 |
| 35 to 50 years | 0 (0.0%) | 0.0 |
| Total | 0 (0.0%) | 0.0 |
Fertility by Age by Marriage Status in Barton Creek
| Age Bracket | Married | Unmarried |
| 15 to 19 years | 0 (0.0%) | 0 (0.0%) |
| 20 to 34 years | 0 (0.0%) | 0 (0.0%) |
| 35 to 50 years | 0 (0.0%) | 0 (0.0%) |
| Total | 0 (0.0%) | 0 (0.0%) |
Fertility by Education in Barton Creek
| Educational Attainment | Women with Births | Births / 1,000 Women |
| Less than High School | 0 (0.0%) | 0.0 |
| High School Diploma | 0 (0.0%) | 0.0 |
| College or Associate's Degree | 0 (0.0%) | 0.0 |
| Bachelor's Degree | 0 (0.0%) | 0.0 |
| Graduate Degree | 0 (0.0%) | 0.0 |
| Total | 0 (0.0%) | 0.0 |
Fertility by Education by Marriage Status in Barton Creek
| Educational Attainment | Married | Unmarried |
| Less than High School | 0 (0.0%) | 0 (0.0%) |
| High School Diploma | 0 (0.0%) | 0 (0.0%) |
| College or Associate's Degree | 0 (0.0%) | 0 (0.0%) |
| Bachelor's Degree | 0 (0.0%) | 0 (0.0%) |
| Graduate Degree | 0 (0.0%) | 0 (0.0%) |
| Total | 0 (0.0%) | 0 (0.0%) |
Employment Characteristics in Barton Creek
Employment by Class of Employer in Barton Creek
Among the 1,384 employed individuals in Barton Creek, private company employees (892 | 64.4%), self-employed (incorporated) (320 | 23.1%), and state government employees (77 | 5.6%) make up the most common classes of employment.
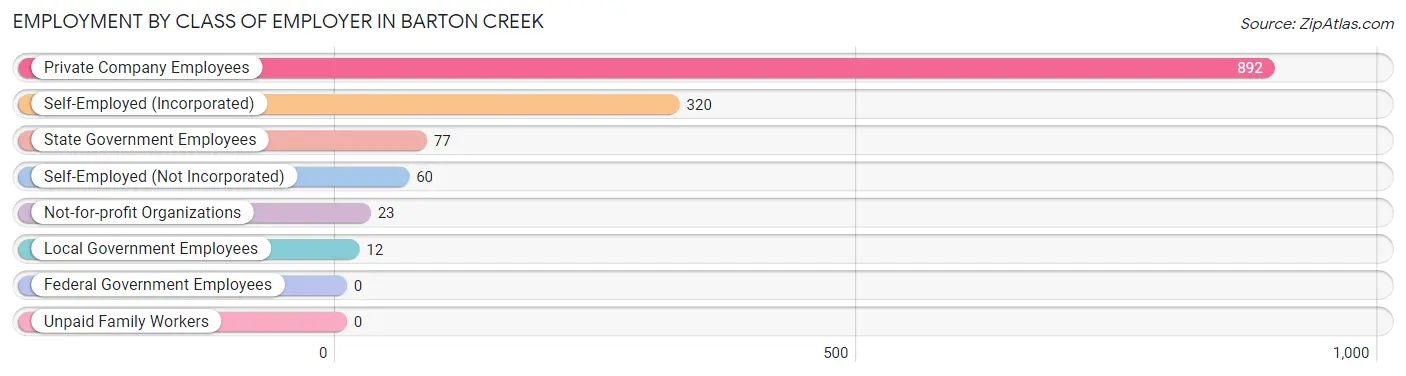
| Employer Class | # Employees | % Employees |
| Private Company Employees | 892 | 64.4% |
| Self-Employed (Incorporated) | 320 | 23.1% |
| Self-Employed (Not Incorporated) | 60 | 4.3% |
| Not-for-profit Organizations | 23 | 1.7% |
| Local Government Employees | 12 | 0.9% |
| State Government Employees | 77 | 5.6% |
| Federal Government Employees | 0 | 0.0% |
| Unpaid Family Workers | 0 | 0.0% |
| Total | 1,384 | 100.0% |
Employment Status by Age in Barton Creek
According to the labor force statistics for Barton Creek, out of the total population over 16 years of age (2,820), 50.1% or 1,413 individuals are in the labor force, with 2.1% or 30 of them unemployed. The age group with the highest labor force participation rate is 30 to 34 years, with 90.2% or 157 individuals in the labor force. Within the labor force, the 20 to 24 years age range has the highest percentage of unemployed individuals, with 15.7% or 14 of them being unemployed.
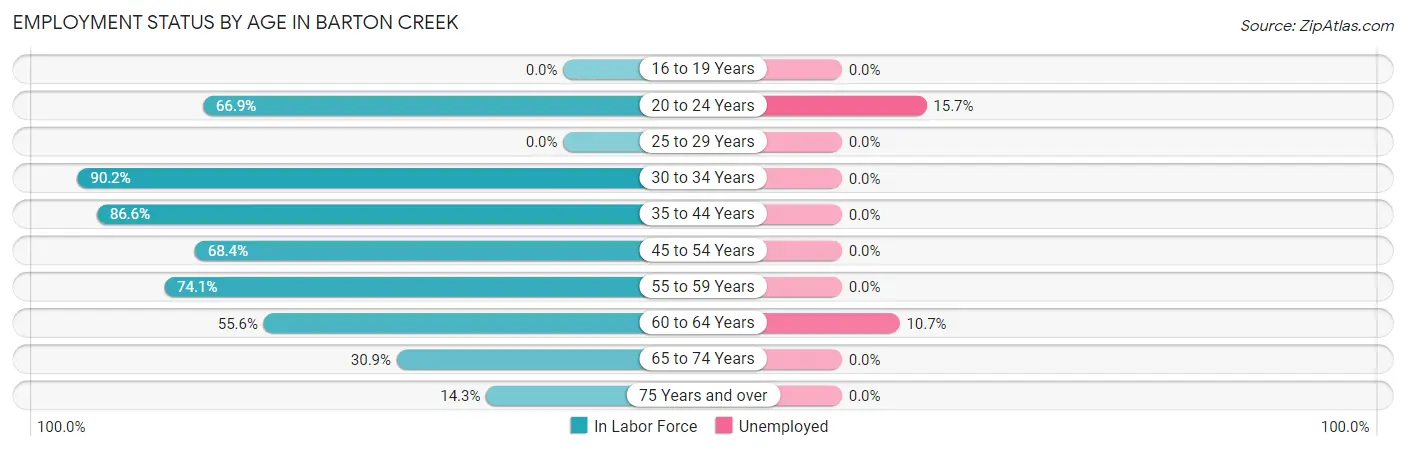
| Age Bracket | In Labor Force | Unemployed |
| 16 to 19 Years | 0 (0.0%) | 0 (0.0%) |
| 20 to 24 Years | 89 (66.9%) | 14 (15.7%) |
| 25 to 29 Years | 0 (0.0%) | 0 (0.0%) |
| 30 to 34 Years | 157 (90.2%) | 0 (0.0%) |
| 35 to 44 Years | 97 (86.6%) | 0 (0.0%) |
| 45 to 54 Years | 454 (68.4%) | 0 (0.0%) |
| 55 to 59 Years | 215 (74.1%) | 0 (0.0%) |
| 60 to 64 Years | 150 (55.6%) | 16 (10.7%) |
| 65 to 74 Years | 185 (30.9%) | 0 (0.0%) |
| 75 Years and over | 67 (14.3%) | 0 (0.0%) |
| Total | 1,413 (50.1%) | 30 (2.1%) |
Employment Status by Educational Attainment in Barton Creek
According to labor force statistics for Barton Creek, 71.1% of individuals (1,074) out of the total population between 25 and 64 years of age (1,510) are in the labor force, with 1.5% or 16 of them being unemployed. The group with the highest labor force participation rate are those with the educational attainment of less than high school, with 100.0% or 19 individuals in the labor force. Within the labor force, individuals with bachelor's degree or higher education have the highest percentage of unemployment, with 1.6% or 16 of them being unemployed.
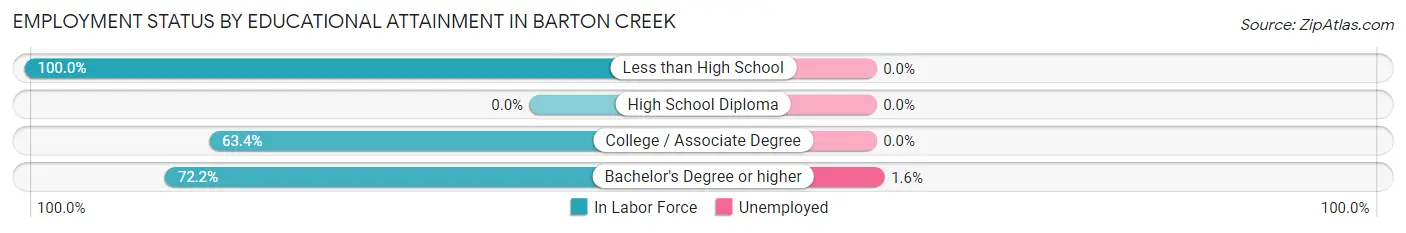
| Educational Attainment | In Labor Force | Unemployed |
| Less than High School | 19 (100.0%) | 0 (0.0%) |
| High School Diploma | 0 (0.0%) | 0 (0.0%) |
| College / Associate Degree | 64 (63.4%) | 0 (0.0%) |
| Bachelor's Degree or higher | 990 (72.2%) | 22 (1.6%) |
| Total | 1,074 (71.1%) | 23 (1.5%) |
Employment Occupations by Sex in Barton Creek
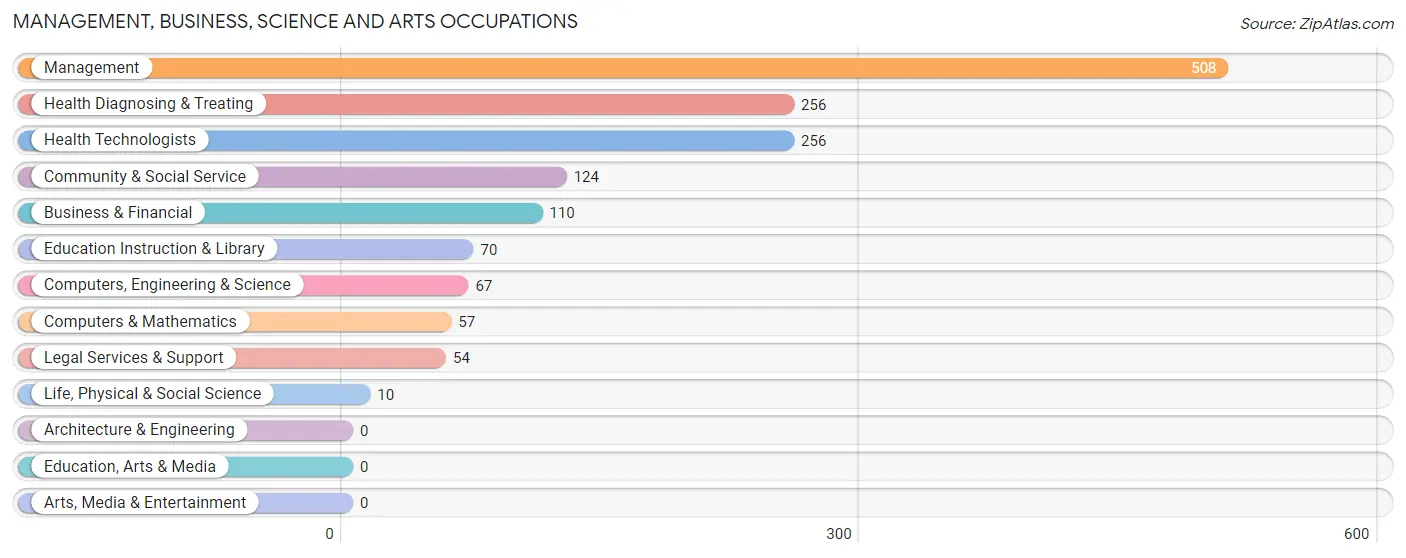
Management, Business, Science and Arts Occupations
The most common Management, Business, Science and Arts occupations in Barton Creek are Management (508 | 36.7%), Health Diagnosing & Treating (256 | 18.5%), Health Technologists (256 | 18.5%), Community & Social Service (124 | 9.0%), and Business & Financial (110 | 8.0%).
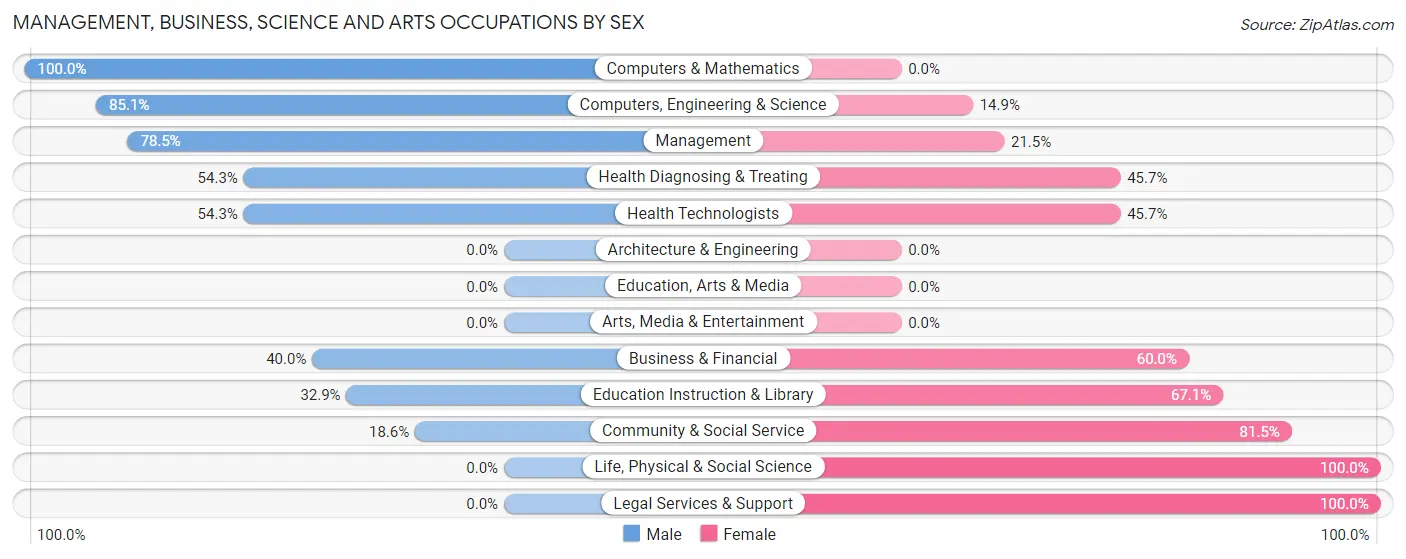
Management, Business, Science and Arts Occupations by Sex
Within the Management, Business, Science and Arts occupations in Barton Creek, the most male-oriented occupations are Computers & Mathematics (100.0%), Computers, Engineering & Science (85.1%), and Management (78.5%), while the most female-oriented occupations are Life, Physical & Social Science (100.0%), Legal Services & Support (100.0%), and Community & Social Service (81.5%).
| Occupation | Male | Female |
| Management | 399 (78.5%) | 109 (21.5%) |
| Business & Financial | 44 (40.0%) | 66 (60.0%) |
| Computers, Engineering & Science | 57 (85.1%) | 10 (14.9%) |
| Computers & Mathematics | 57 (100.0%) | 0 (0.0%) |
| Architecture & Engineering | 0 (0.0%) | 0 (0.0%) |
| Life, Physical & Social Science | 0 (0.0%) | 10 (100.0%) |
| Community & Social Service | 23 (18.5%) | 101 (81.5%) |
| Education, Arts & Media | 0 (0.0%) | 0 (0.0%) |
| Legal Services & Support | 0 (0.0%) | 54 (100.0%) |
| Education Instruction & Library | 23 (32.9%) | 47 (67.1%) |
| Arts, Media & Entertainment | 0 (0.0%) | 0 (0.0%) |
| Health Diagnosing & Treating | 139 (54.3%) | 117 (45.7%) |
| Health Technologists | 139 (54.3%) | 117 (45.7%) |
| Total (Category) | 662 (62.2%) | 403 (37.8%) |
| Total (Overall) | 918 (66.3%) | 466 (33.7%) |
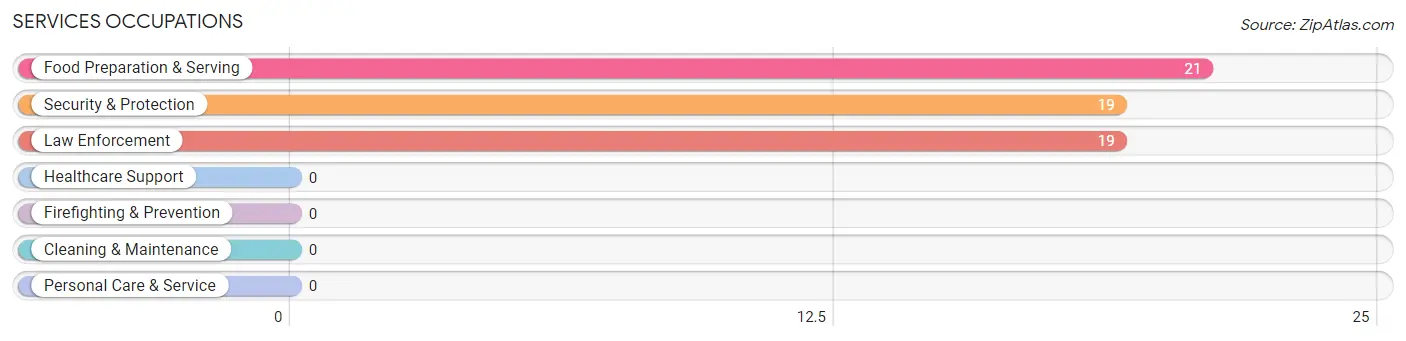
Services Occupations
The most common Services occupations in Barton Creek are Food Preparation & Serving (21 | 1.5%), Security & Protection (19 | 1.4%), and Law Enforcement (19 | 1.4%).
Services Occupations by Sex
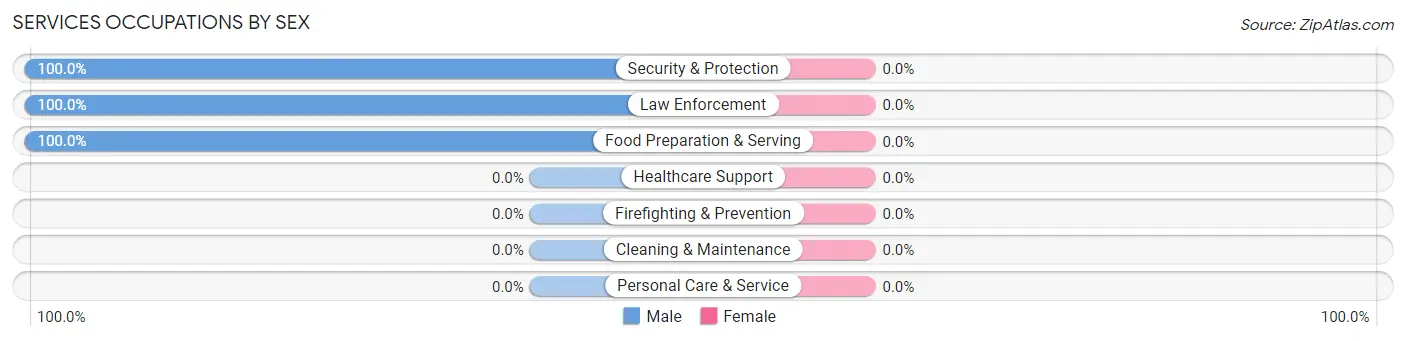
| Occupation | Male | Female |
| Healthcare Support | 0 (0.0%) | 0 (0.0%) |
| Security & Protection | 19 (100.0%) | 0 (0.0%) |
| Firefighting & Prevention | 0 (0.0%) | 0 (0.0%) |
| Law Enforcement | 19 (100.0%) | 0 (0.0%) |
| Food Preparation & Serving | 21 (100.0%) | 0 (0.0%) |
| Cleaning & Maintenance | 0 (0.0%) | 0 (0.0%) |
| Personal Care & Service | 0 (0.0%) | 0 (0.0%) |
| Total (Category) | 40 (100.0%) | 0 (0.0%) |
| Total (Overall) | 918 (66.3%) | 466 (33.7%) |
Sales and Office Occupations
The most common Sales and Office occupations in Barton Creek are Sales & Related (180 | 13.0%), and Office & Administration (80 | 5.8%).
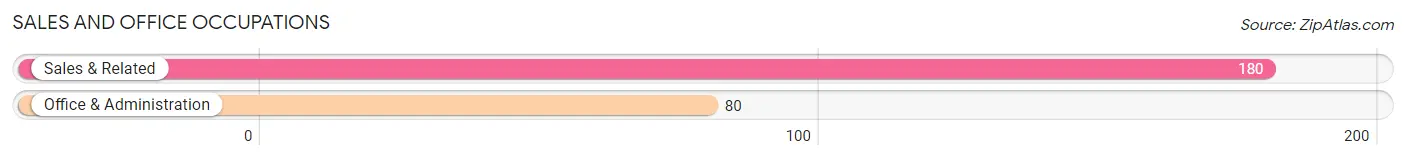
Sales and Office Occupations by Sex

| Occupation | Male | Female |
| Sales & Related | 145 (80.6%) | 35 (19.4%) |
| Office & Administration | 71 (88.7%) | 9 (11.3%) |
| Total (Category) | 216 (83.1%) | 44 (16.9%) |
| Total (Overall) | 918 (66.3%) | 466 (33.7%) |
Natural Resources, Construction and Maintenance Occupations
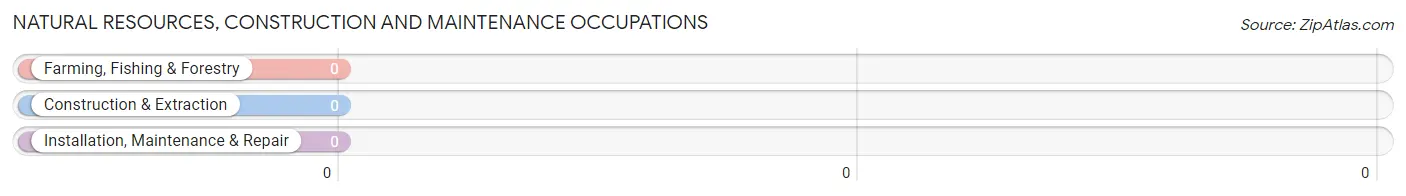
Natural Resources, Construction and Maintenance Occupations by Sex
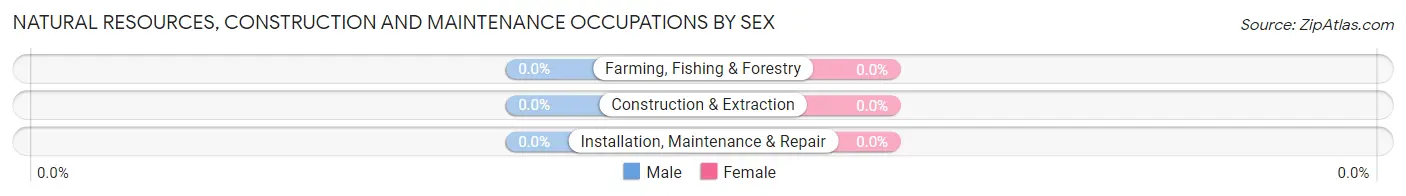
| Occupation | Male | Female |
| Farming, Fishing & Forestry | 0 (0.0%) | 0 (0.0%) |
| Construction & Extraction | 0 (0.0%) | 0 (0.0%) |
| Installation, Maintenance & Repair | 0 (0.0%) | 0 (0.0%) |
| Total (Category) | 0 (0.0%) | 0 (0.0%) |
| Total (Overall) | 918 (66.3%) | 466 (33.7%) |
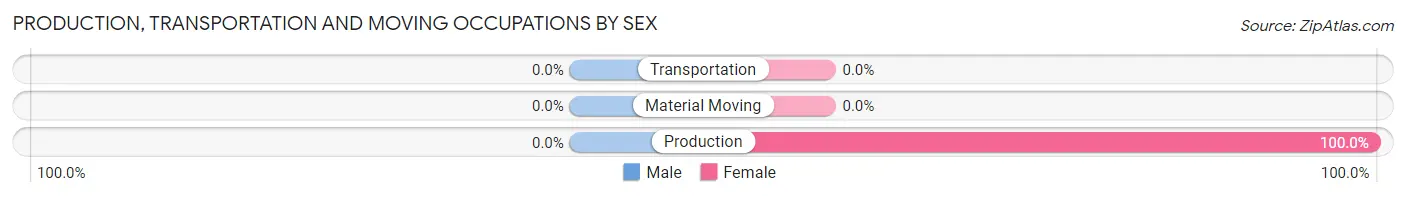
Production, Transportation and Moving Occupations
The most common Production, Transportation and Moving occupations in Barton Creek are , and Production (19 | 1.4%).
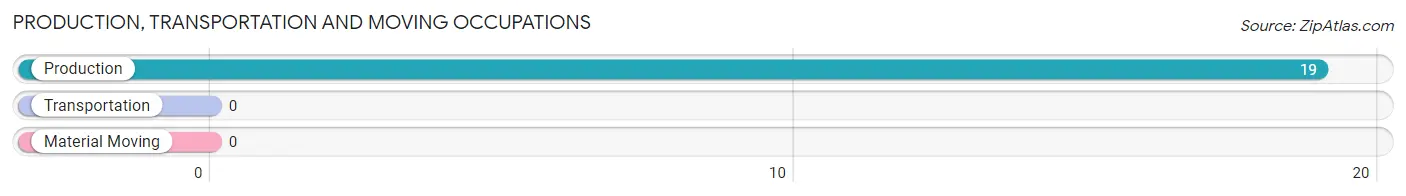
Production, Transportation and Moving Occupations by Sex
| Occupation | Male | Female |
| Production | 0 (0.0%) | 19 (100.0%) |
| Transportation | 0 (0.0%) | 0 (0.0%) |
| Material Moving | 0 (0.0%) | 0 (0.0%) |
| Total (Category) | 0 (0.0%) | 19 (100.0%) |
| Total (Overall) | 918 (66.3%) | 466 (33.7%) |
Employment Industries by Sex in Barton Creek
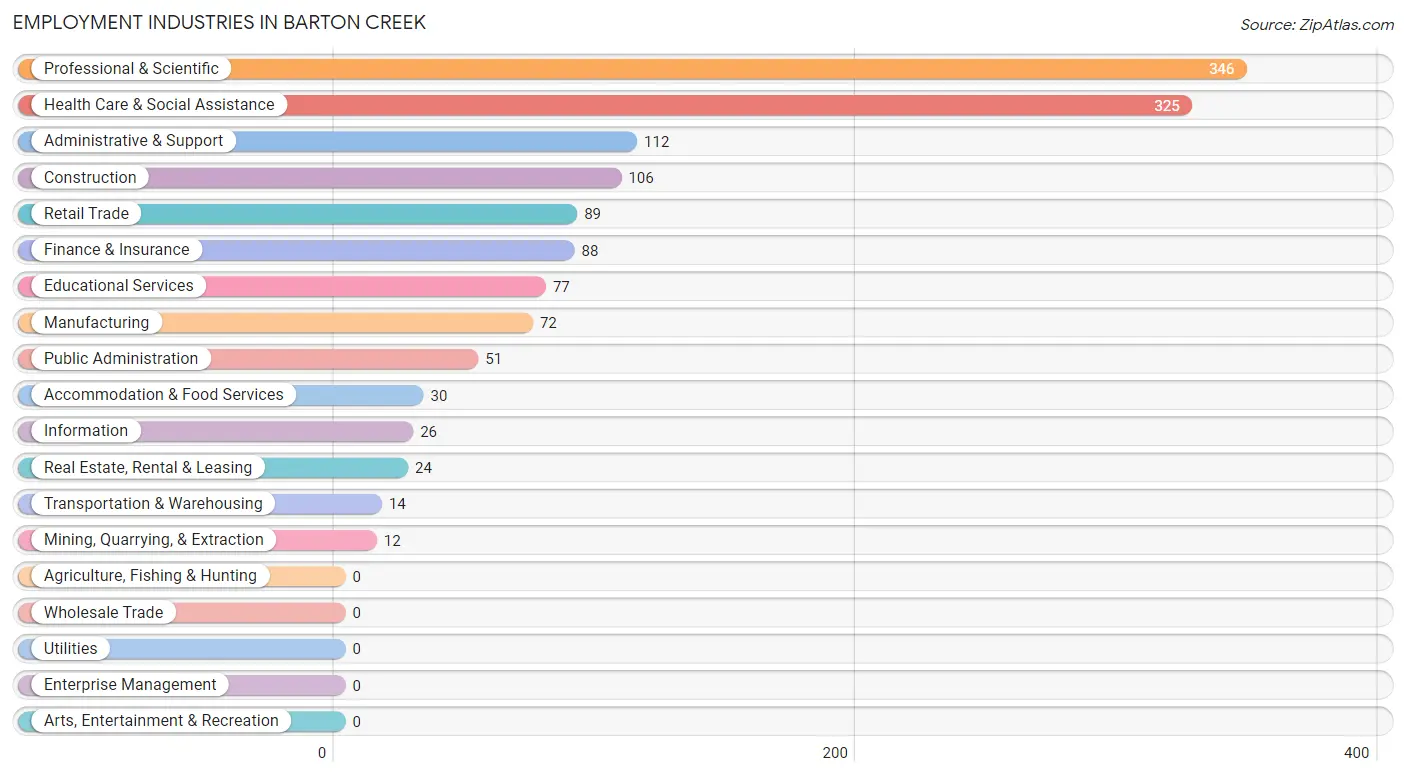
Employment Industries in Barton Creek
The major employment industries in Barton Creek include Professional & Scientific (346 | 25.0%), Health Care & Social Assistance (325 | 23.5%), Administrative & Support (112 | 8.1%), Construction (106 | 7.7%), and Retail Trade (89 | 6.4%).
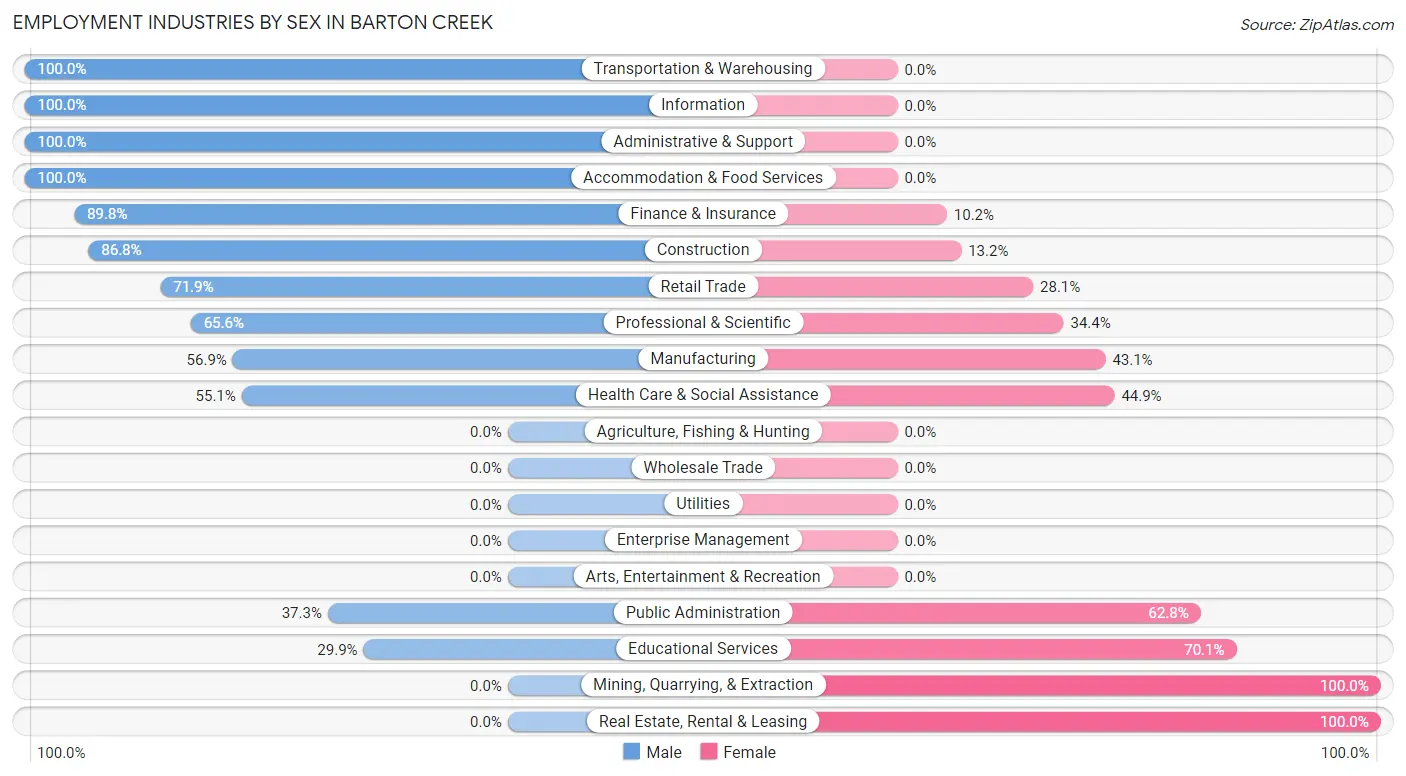
Employment Industries by Sex in Barton Creek
The Barton Creek industries that see more men than women are Transportation & Warehousing (100.0%), Information (100.0%), and Administrative & Support (100.0%), whereas the industries that tend to have a higher number of women are Mining, Quarrying, & Extraction (100.0%), Real Estate, Rental & Leasing (100.0%), and Educational Services (70.1%).
| Industry | Male | Female |
| Agriculture, Fishing & Hunting | 0 (0.0%) | 0 (0.0%) |
| Mining, Quarrying, & Extraction | 0 (0.0%) | 12 (100.0%) |
| Construction | 92 (86.8%) | 14 (13.2%) |
| Manufacturing | 41 (56.9%) | 31 (43.1%) |
| Wholesale Trade | 0 (0.0%) | 0 (0.0%) |
| Retail Trade | 64 (71.9%) | 25 (28.1%) |
| Transportation & Warehousing | 14 (100.0%) | 0 (0.0%) |
| Utilities | 0 (0.0%) | 0 (0.0%) |
| Information | 26 (100.0%) | 0 (0.0%) |
| Finance & Insurance | 79 (89.8%) | 9 (10.2%) |
| Real Estate, Rental & Leasing | 0 (0.0%) | 24 (100.0%) |
| Professional & Scientific | 227 (65.6%) | 119 (34.4%) |
| Enterprise Management | 0 (0.0%) | 0 (0.0%) |
| Administrative & Support | 112 (100.0%) | 0 (0.0%) |
| Educational Services | 23 (29.9%) | 54 (70.1%) |
| Health Care & Social Assistance | 179 (55.1%) | 146 (44.9%) |
| Arts, Entertainment & Recreation | 0 (0.0%) | 0 (0.0%) |
| Accommodation & Food Services | 30 (100.0%) | 0 (0.0%) |
| Public Administration | 19 (37.2%) | 32 (62.7%) |
| Total | 918 (66.3%) | 466 (33.7%) |
Education in Barton Creek
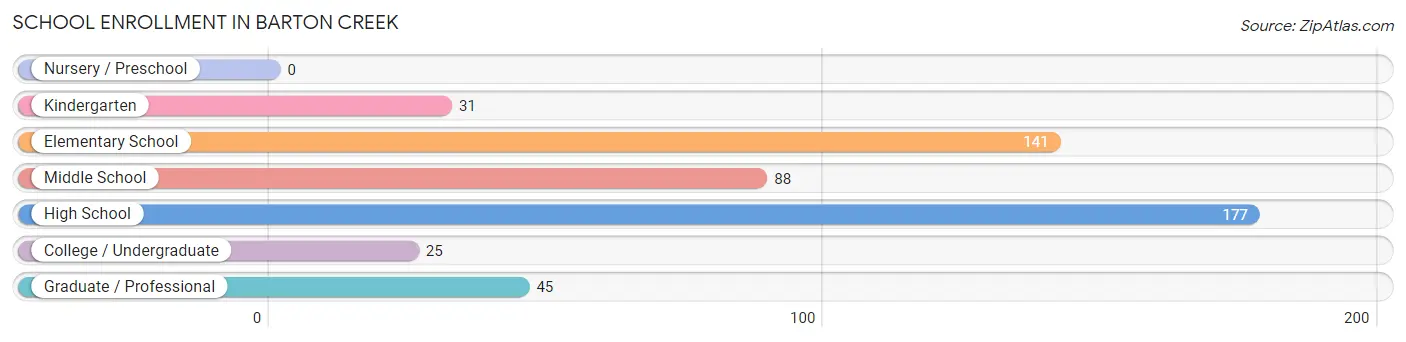
School Enrollment in Barton Creek
The most common levels of schooling among the 507 students in Barton Creek are high school (177 | 34.9%), elementary school (141 | 27.8%), and middle school (88 | 17.4%).
| School Level | # Students | % Students |
| Nursery / Preschool | 0 | 0.0% |
| Kindergarten | 31 | 6.1% |
| Elementary School | 141 | 27.8% |
| Middle School | 88 | 17.4% |
| High School | 177 | 34.9% |
| College / Undergraduate | 25 | 4.9% |
| Graduate / Professional | 45 | 8.9% |
| Total | 507 | 100.0% |
School Enrollment by Age by Funding Source in Barton Creek
Out of a total of 507 students who are enrolled in schools in Barton Creek, 361 (71.2%) attend a private institution, while the remaining 146 (28.8%) are enrolled in public schools. The age group of 5 to 9 year old has the highest likelihood of being enrolled in private schools, with 152 (100.0% in the age bracket) enrolled. Conversely, the age group of 35 years and over has the lowest likelihood of being enrolled in a private school, with 9 (100.0% in the age bracket) attending a public institution.
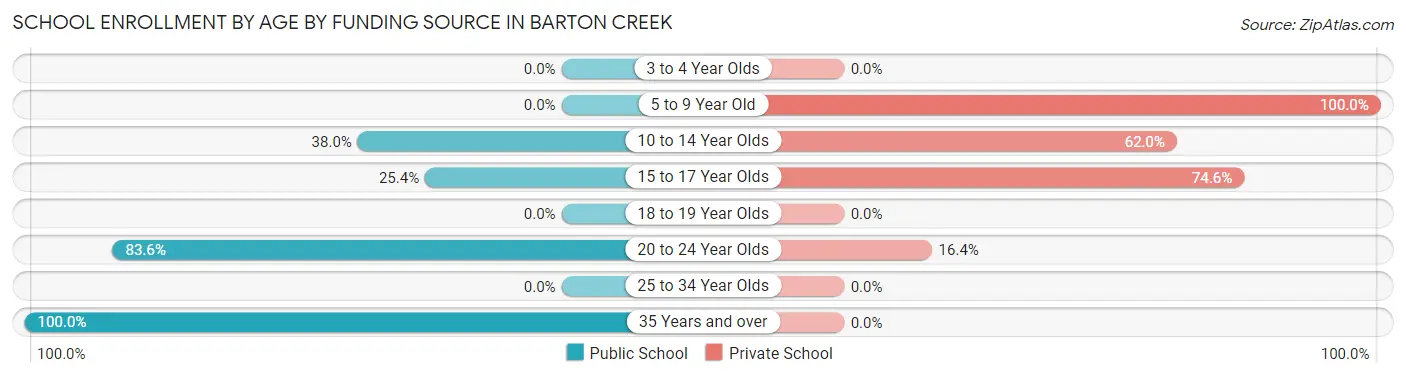
| Age Bracket | Public School | Private School |
| 3 to 4 Year Olds | 0 (0.0%) | 0 (0.0%) |
| 5 to 9 Year Old | 0 (0.0%) | 152 (100.0%) |
| 10 to 14 Year Olds | 41 (38.0%) | 67 (62.0%) |
| 15 to 17 Year Olds | 45 (25.4%) | 132 (74.6%) |
| 18 to 19 Year Olds | 0 (0.0%) | 0 (0.0%) |
| 20 to 24 Year Olds | 51 (83.6%) | 10 (16.4%) |
| 25 to 34 Year Olds | 0 (0.0%) | 0 (0.0%) |
| 35 Years and over | 9 (100.0%) | 0 (0.0%) |
| Total | 146 (28.8%) | 361 (71.2%) |
Educational Attainment by Field of Study in Barton Creek
Business (494 | 22.8%), education (280 | 12.9%), engineering (268 | 12.4%), social sciences (250 | 11.5%), and communications (184 | 8.5%) are the most common fields of study among 2,168 individuals in Barton Creek who have obtained a bachelor's degree or higher.
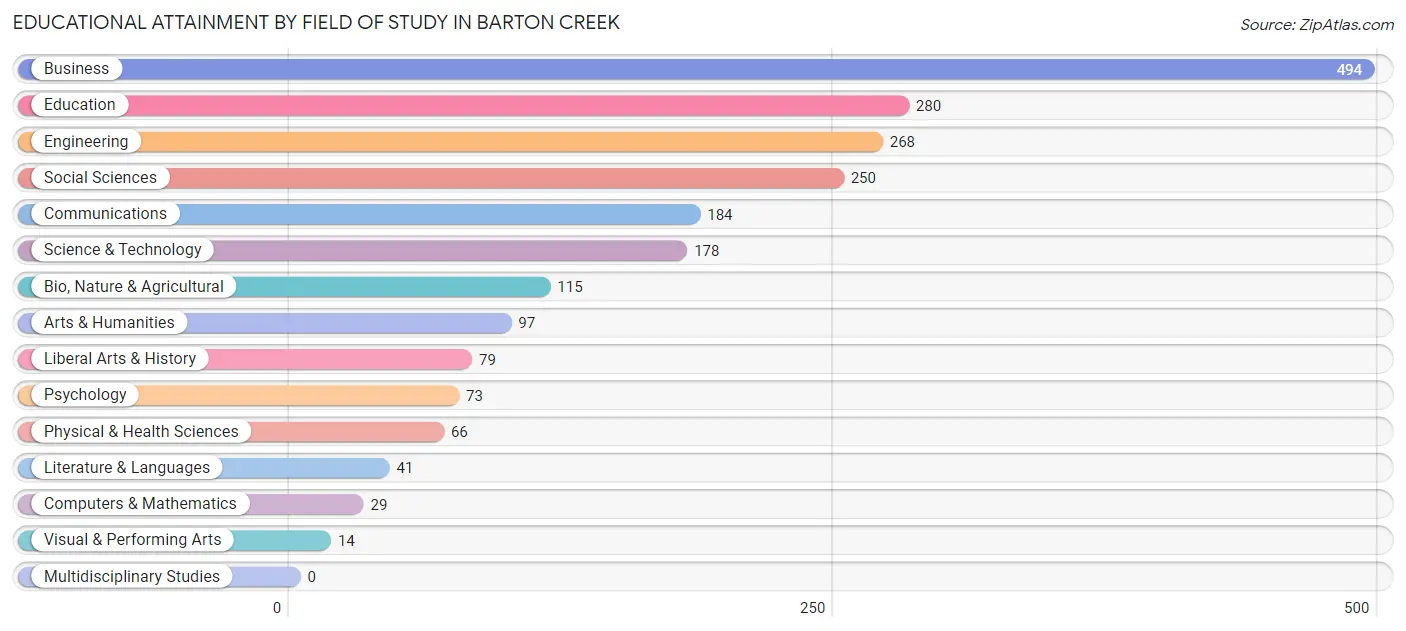
| Field of Study | # Graduates | % Graduates |
| Computers & Mathematics | 29 | 1.3% |
| Bio, Nature & Agricultural | 115 | 5.3% |
| Physical & Health Sciences | 66 | 3.0% |
| Psychology | 73 | 3.4% |
| Social Sciences | 250 | 11.5% |
| Engineering | 268 | 12.4% |
| Multidisciplinary Studies | 0 | 0.0% |
| Science & Technology | 178 | 8.2% |
| Business | 494 | 22.8% |
| Education | 280 | 12.9% |
| Literature & Languages | 41 | 1.9% |
| Liberal Arts & History | 79 | 3.6% |
| Visual & Performing Arts | 14 | 0.6% |
| Communications | 184 | 8.5% |
| Arts & Humanities | 97 | 4.5% |
| Total | 2,168 | 100.0% |
Transportation & Commute in Barton Creek
Vehicle Availability by Sex in Barton Creek
The most prevalent vehicle ownership categories in Barton Creek are males with 2 vehicles (366, accounting for 39.9%) and females with 2 vehicles (182, making up 78.5%).
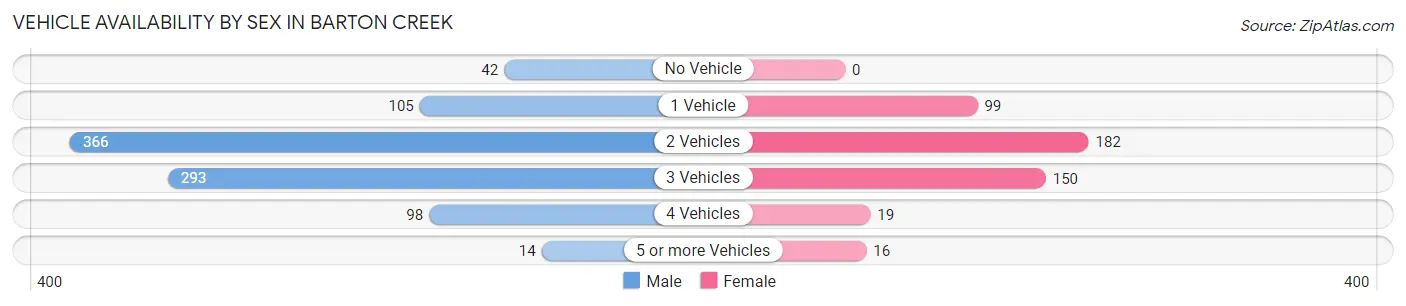
| Vehicles Available | Male | Female |
| No Vehicle | 42 (4.6%) | 0 (0.0%) |
| 1 Vehicle | 105 (11.4%) | 99 (21.2%) |
| 2 Vehicles | 366 (39.9%) | 182 (39.1%) |
| 3 Vehicles | 293 (31.9%) | 150 (32.2%) |
| 4 Vehicles | 98 (10.7%) | 19 (4.1%) |
| 5 or more Vehicles | 14 (1.5%) | 16 (3.4%) |
| Total | 918 (100.0%) | 466 (100.0%) |
Commute Time in Barton Creek
The most frequently occuring commute durations in Barton Creek are 20 to 24 minutes (305 commuters, 29.1%), 15 to 19 minutes (196 commuters, 18.7%), and 25 to 29 minutes (152 commuters, 14.5%).
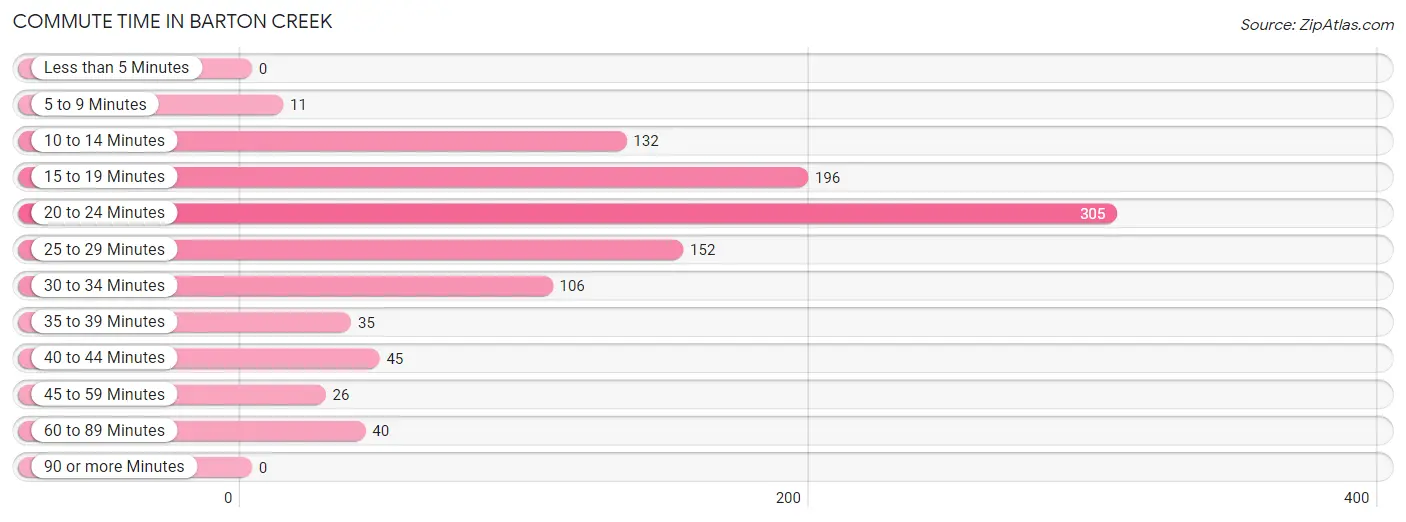
| Commute Time | # Commuters | % Commuters |
| Less than 5 Minutes | 0 | 0.0% |
| 5 to 9 Minutes | 11 | 1.1% |
| 10 to 14 Minutes | 132 | 12.6% |
| 15 to 19 Minutes | 196 | 18.7% |
| 20 to 24 Minutes | 305 | 29.1% |
| 25 to 29 Minutes | 152 | 14.5% |
| 30 to 34 Minutes | 106 | 10.1% |
| 35 to 39 Minutes | 35 | 3.3% |
| 40 to 44 Minutes | 45 | 4.3% |
| 45 to 59 Minutes | 26 | 2.5% |
| 60 to 89 Minutes | 40 | 3.8% |
| 90 or more Minutes | 0 | 0.0% |
Commute Time by Sex in Barton Creek
The most common commute times in Barton Creek are 20 to 24 minutes (164 commuters, 21.7%) for males and 20 to 24 minutes (141 commuters, 48.3%) for females.
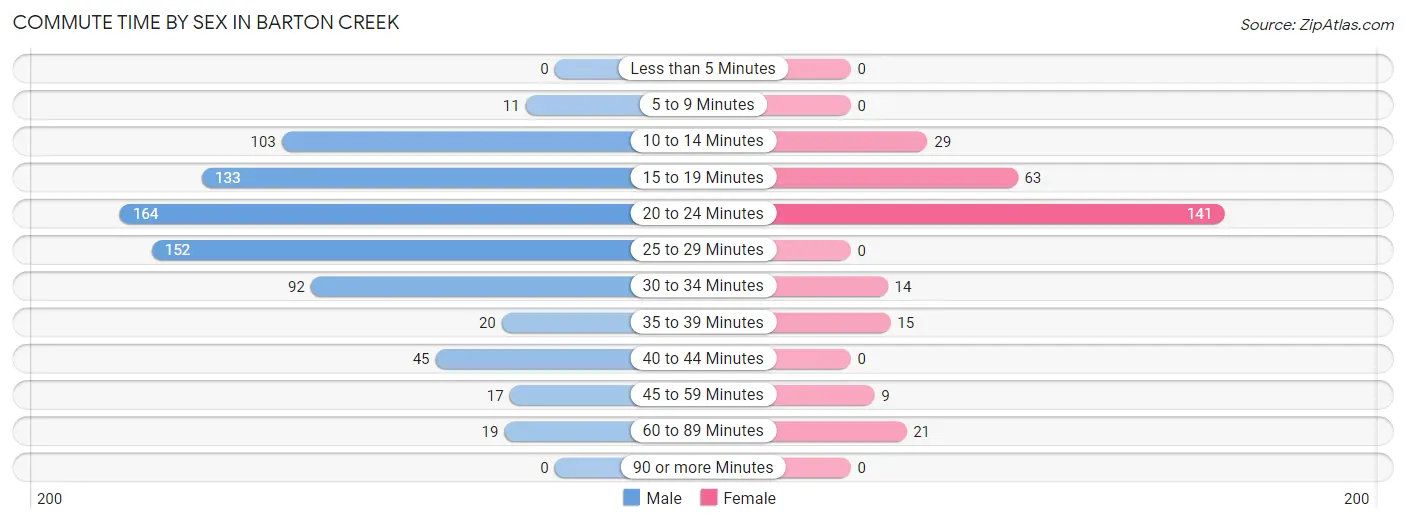
| Commute Time | Male | Female |
| Less than 5 Minutes | 0 (0.0%) | 0 (0.0%) |
| 5 to 9 Minutes | 11 (1.5%) | 0 (0.0%) |
| 10 to 14 Minutes | 103 (13.6%) | 29 (9.9%) |
| 15 to 19 Minutes | 133 (17.6%) | 63 (21.6%) |
| 20 to 24 Minutes | 164 (21.7%) | 141 (48.3%) |
| 25 to 29 Minutes | 152 (20.1%) | 0 (0.0%) |
| 30 to 34 Minutes | 92 (12.2%) | 14 (4.8%) |
| 35 to 39 Minutes | 20 (2.6%) | 15 (5.1%) |
| 40 to 44 Minutes | 45 (5.9%) | 0 (0.0%) |
| 45 to 59 Minutes | 17 (2.2%) | 9 (3.1%) |
| 60 to 89 Minutes | 19 (2.5%) | 21 (7.2%) |
| 90 or more Minutes | 0 (0.0%) | 0 (0.0%) |
Time of Departure to Work by Sex in Barton Creek
The most frequent times of departure to work in Barton Creek are 8:00 AM to 8:29 AM (221, 29.2%) for males and 9:00 AM to 9:59 AM (105, 36.0%) for females.
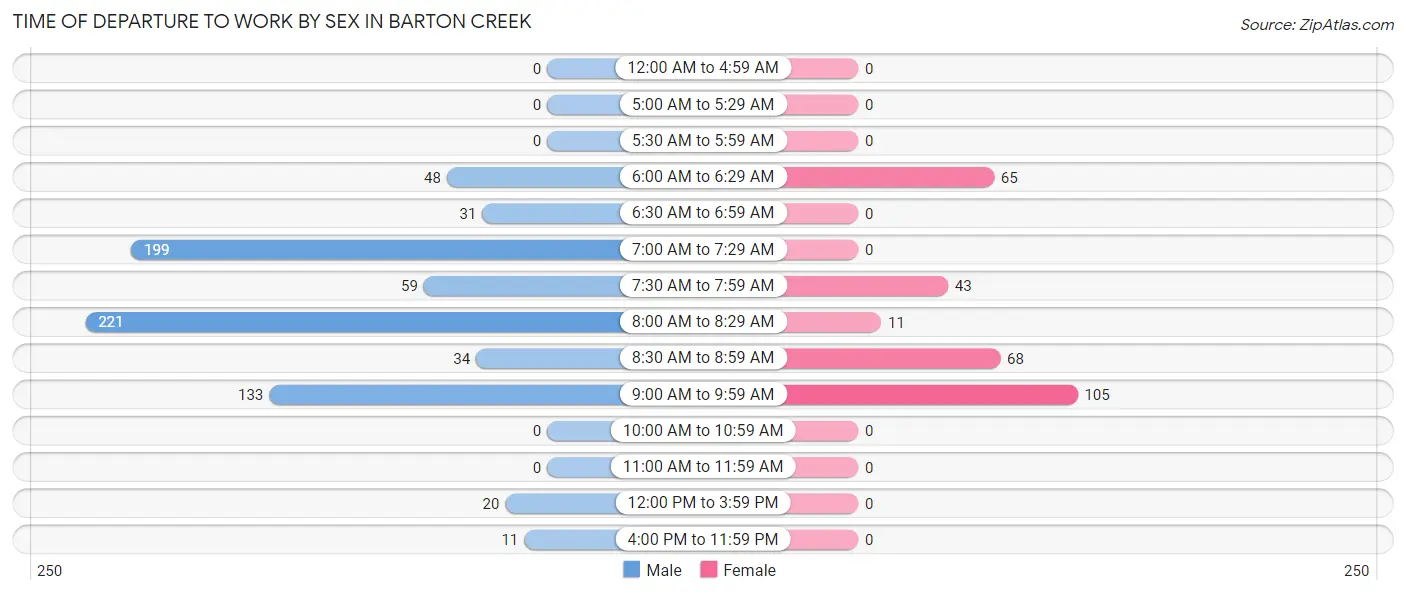
| Time of Departure | Male | Female |
| 12:00 AM to 4:59 AM | 0 (0.0%) | 0 (0.0%) |
| 5:00 AM to 5:29 AM | 0 (0.0%) | 0 (0.0%) |
| 5:30 AM to 5:59 AM | 0 (0.0%) | 0 (0.0%) |
| 6:00 AM to 6:29 AM | 48 (6.4%) | 65 (22.3%) |
| 6:30 AM to 6:59 AM | 31 (4.1%) | 0 (0.0%) |
| 7:00 AM to 7:29 AM | 199 (26.3%) | 0 (0.0%) |
| 7:30 AM to 7:59 AM | 59 (7.8%) | 43 (14.7%) |
| 8:00 AM to 8:29 AM | 221 (29.2%) | 11 (3.8%) |
| 8:30 AM to 8:59 AM | 34 (4.5%) | 68 (23.3%) |
| 9:00 AM to 9:59 AM | 133 (17.6%) | 105 (36.0%) |
| 10:00 AM to 10:59 AM | 0 (0.0%) | 0 (0.0%) |
| 11:00 AM to 11:59 AM | 0 (0.0%) | 0 (0.0%) |
| 12:00 PM to 3:59 PM | 20 (2.6%) | 0 (0.0%) |
| 4:00 PM to 11:59 PM | 11 (1.5%) | 0 (0.0%) |
| Total | 756 (100.0%) | 292 (100.0%) |
Housing Occupancy in Barton Creek
Occupancy by Ownership in Barton Creek
Of the total 1,434 dwellings in Barton Creek, owner-occupied units account for 1,133 (79.0%), while renter-occupied units make up 301 (21.0%).
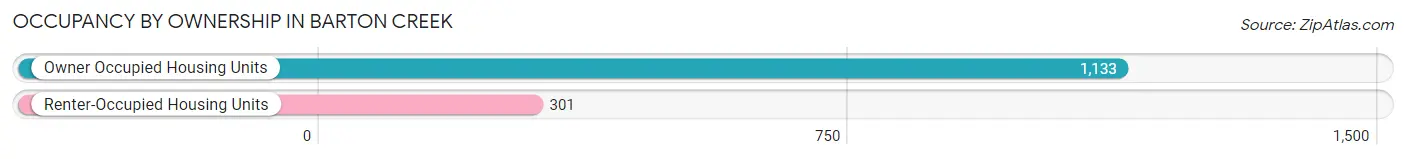
| Occupancy | # Housing Units | % Housing Units |
| Owner Occupied Housing Units | 1,133 | 79.0% |
| Renter-Occupied Housing Units | 301 | 21.0% |
| Total Occupied Housing Units | 1,434 | 100.0% |
Occupancy by Household Size in Barton Creek
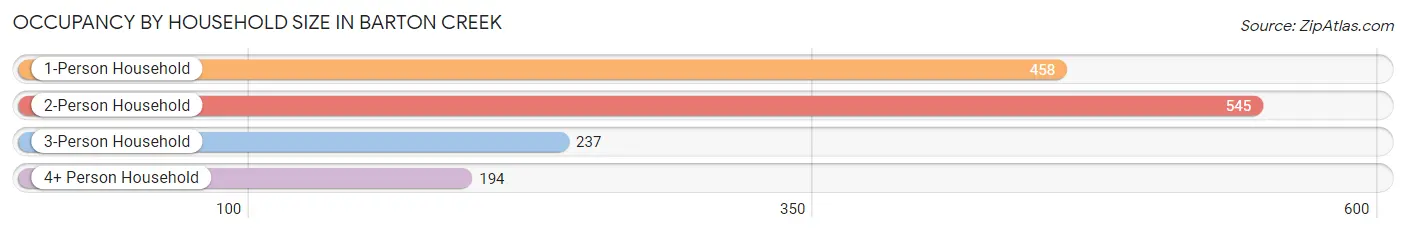
| Household Size | # Housing Units | % Housing Units |
| 1-Person Household | 458 | 31.9% |
| 2-Person Household | 545 | 38.0% |
| 3-Person Household | 237 | 16.5% |
| 4+ Person Household | 194 | 13.5% |
| Total Housing Units | 1,434 | 100.0% |
Occupancy by Ownership by Household Size in Barton Creek
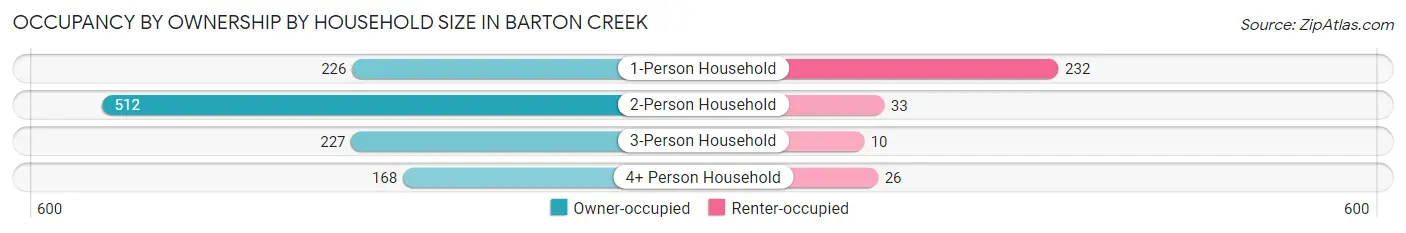
| Household Size | Owner-occupied | Renter-occupied |
| 1-Person Household | 226 (49.3%) | 232 (50.7%) |
| 2-Person Household | 512 (93.9%) | 33 (6.1%) |
| 3-Person Household | 227 (95.8%) | 10 (4.2%) |
| 4+ Person Household | 168 (86.6%) | 26 (13.4%) |
| Total Housing Units | 1,133 (79.0%) | 301 (21.0%) |
Occupancy by Educational Attainment in Barton Creek
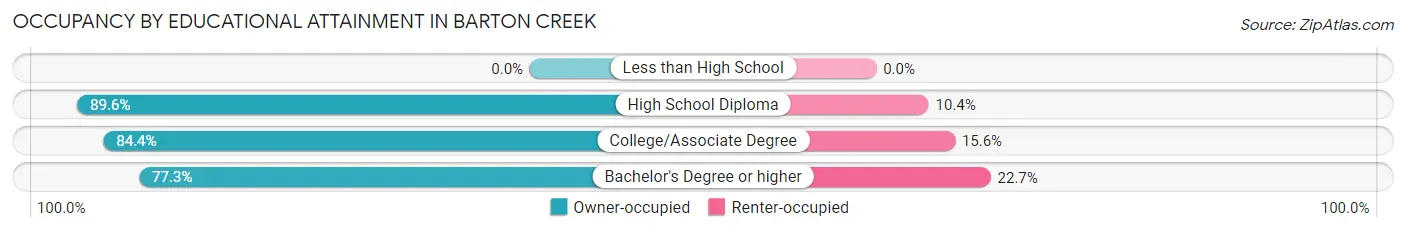
| Household Size | Owner-occupied | Renter-occupied |
| Less than High School | 0 (0.0%) | 0 (0.0%) |
| High School Diploma | 112 (89.6%) | 13 (10.4%) |
| College/Associate Degree | 108 (84.4%) | 20 (15.6%) |
| Bachelor's Degree or higher | 913 (77.3%) | 268 (22.7%) |
Occupancy by Age of Householder in Barton Creek
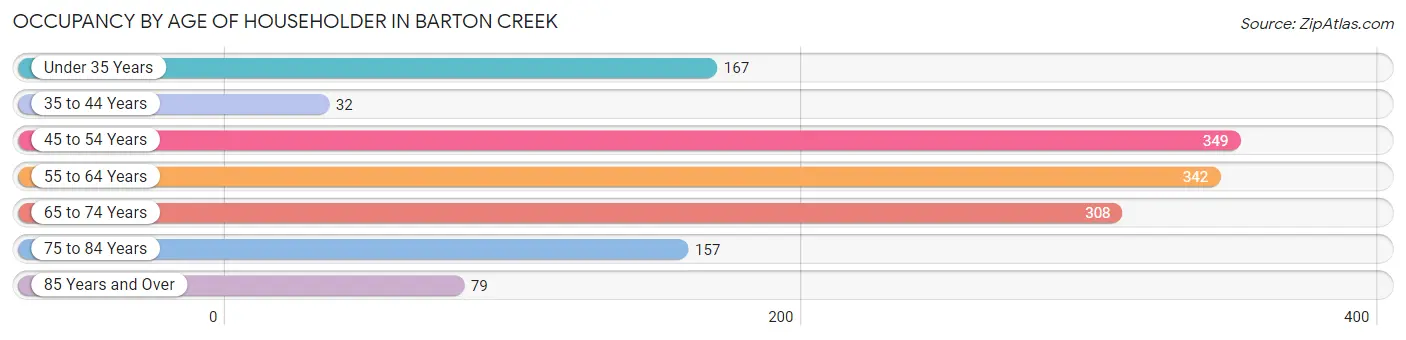
| Age Bracket | # Households | % Households |
| Under 35 Years | 167 | 11.7% |
| 35 to 44 Years | 32 | 2.2% |
| 45 to 54 Years | 349 | 24.3% |
| 55 to 64 Years | 342 | 23.8% |
| 65 to 74 Years | 308 | 21.5% |
| 75 to 84 Years | 157 | 11.0% |
| 85 Years and Over | 79 | 5.5% |
| Total | 1,434 | 100.0% |
Housing Finances in Barton Creek
Median Income by Occupancy in Barton Creek
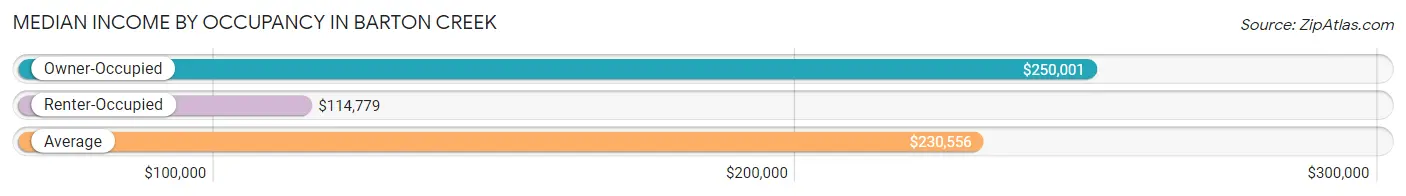
| Occupancy Type | # Households | Median Income |
| Owner-Occupied | 1,133 (79.0%) | $250,001 |
| Renter-Occupied | 301 (21.0%) | $114,779 |
| Average | 1,434 (100.0%) | $230,556 |
Occupancy by Householder Income Bracket in Barton Creek
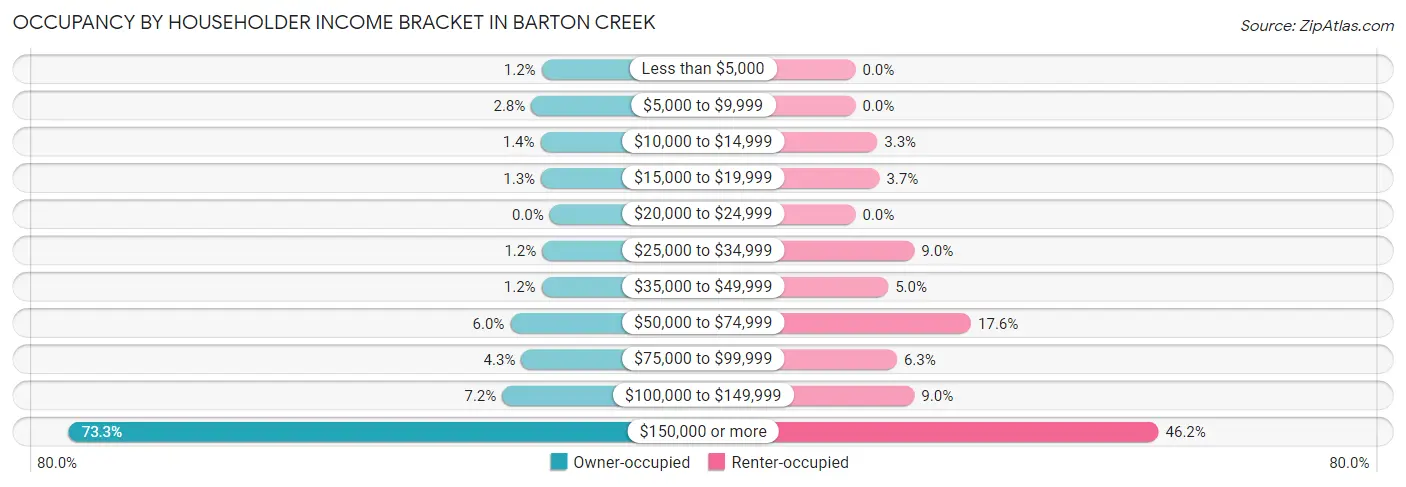
| Income Bracket | Owner-occupied | Renter-occupied |
| Less than $5,000 | 14 (1.2%) | 0 (0.0%) |
| $5,000 to $9,999 | 32 (2.8%) | 0 (0.0%) |
| $10,000 to $14,999 | 16 (1.4%) | 10 (3.3%) |
| $15,000 to $19,999 | 15 (1.3%) | 11 (3.6%) |
| $20,000 to $24,999 | 0 (0.0%) | 0 (0.0%) |
| $25,000 to $34,999 | 13 (1.1%) | 27 (9.0%) |
| $35,000 to $49,999 | 14 (1.2%) | 15 (5.0%) |
| $50,000 to $74,999 | 68 (6.0%) | 53 (17.6%) |
| $75,000 to $99,999 | 49 (4.3%) | 19 (6.3%) |
| $100,000 to $149,999 | 82 (7.2%) | 27 (9.0%) |
| $150,000 or more | 830 (73.3%) | 139 (46.2%) |
| Total | 1,133 (100.0%) | 301 (100.0%) |
Monthly Housing Cost Tiers in Barton Creek
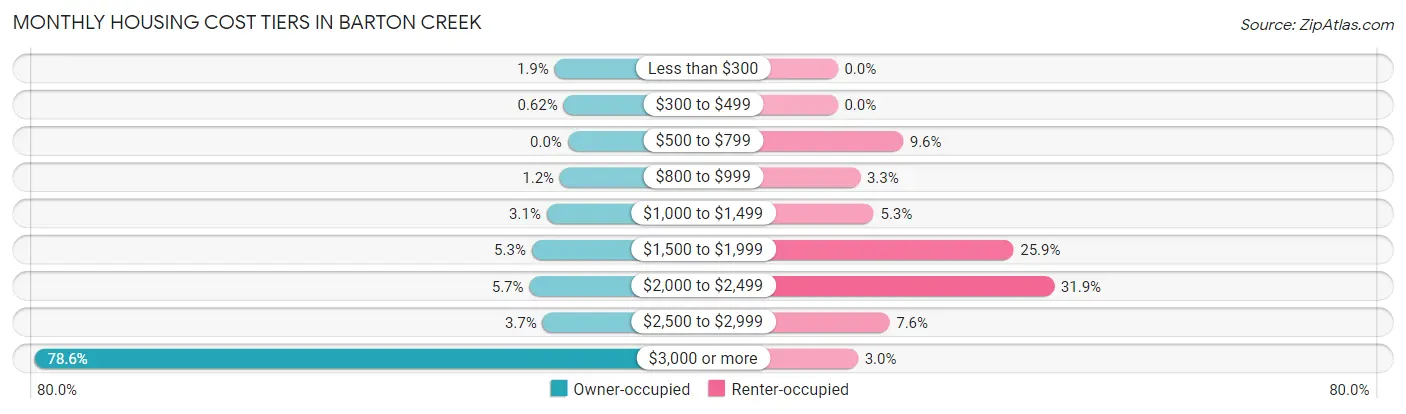
| Monthly Cost | Owner-occupied | Renter-occupied |
| Less than $300 | 22 (1.9%) | 0 (0.0%) |
| $300 to $499 | 7 (0.6%) | 0 (0.0%) |
| $500 to $799 | 0 (0.0%) | 29 (9.6%) |
| $800 to $999 | 13 (1.1%) | 10 (3.3%) |
| $1,000 to $1,499 | 35 (3.1%) | 16 (5.3%) |
| $1,500 to $1,999 | 60 (5.3%) | 78 (25.9%) |
| $2,000 to $2,499 | 64 (5.7%) | 96 (31.9%) |
| $2,500 to $2,999 | 42 (3.7%) | 23 (7.6%) |
| $3,000 or more | 890 (78.5%) | 9 (3.0%) |
| Total | 1,133 (100.0%) | 301 (100.0%) |
Physical Housing Characteristics in Barton Creek
Housing Structures in Barton Creek
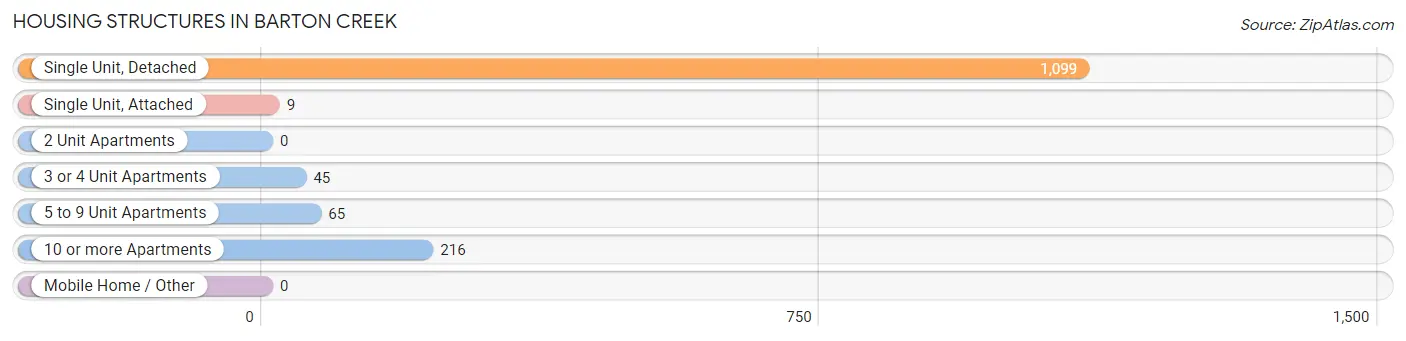
| Structure Type | # Housing Units | % Housing Units |
| Single Unit, Detached | 1,099 | 76.6% |
| Single Unit, Attached | 9 | 0.6% |
| 2 Unit Apartments | 0 | 0.0% |
| 3 or 4 Unit Apartments | 45 | 3.1% |
| 5 to 9 Unit Apartments | 65 | 4.5% |
| 10 or more Apartments | 216 | 15.1% |
| Mobile Home / Other | 0 | 0.0% |
| Total | 1,434 | 100.0% |
Housing Structures by Occupancy in Barton Creek
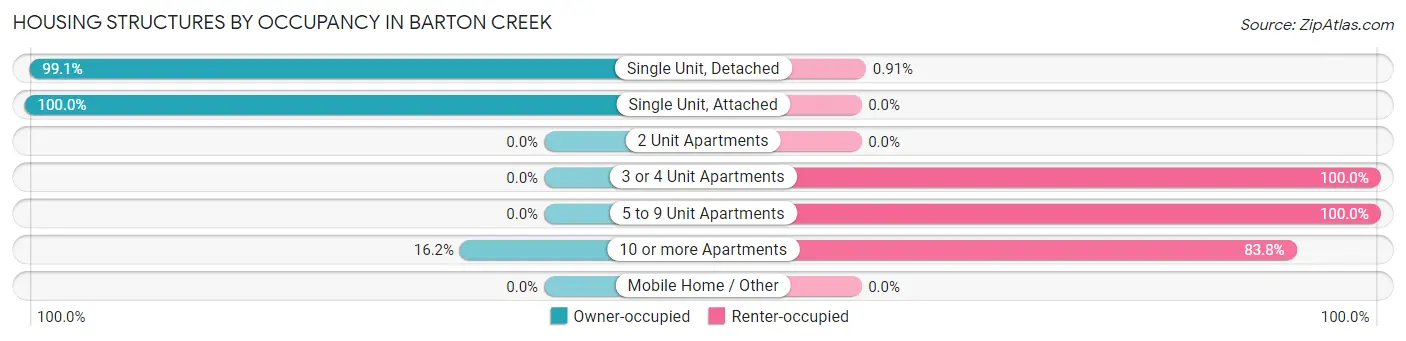
| Structure Type | Owner-occupied | Renter-occupied |
| Single Unit, Detached | 1,089 (99.1%) | 10 (0.9%) |
| Single Unit, Attached | 9 (100.0%) | 0 (0.0%) |
| 2 Unit Apartments | 0 (0.0%) | 0 (0.0%) |
| 3 or 4 Unit Apartments | 0 (0.0%) | 45 (100.0%) |
| 5 to 9 Unit Apartments | 0 (0.0%) | 65 (100.0%) |
| 10 or more Apartments | 35 (16.2%) | 181 (83.8%) |
| Mobile Home / Other | 0 (0.0%) | 0 (0.0%) |
| Total | 1,133 (79.0%) | 301 (21.0%) |
Housing Structures by Number of Rooms in Barton Creek

| Number of Rooms | Owner-occupied | Renter-occupied |
| 1 Room | 0 (0.0%) | 0 (0.0%) |
| 2 or 3 Rooms | 8 (0.7%) | 58 (19.3%) |
| 4 or 5 Rooms | 42 (3.7%) | 174 (57.8%) |
| 6 or 7 Rooms | 167 (14.7%) | 59 (19.6%) |
| 8 or more Rooms | 916 (80.8%) | 10 (3.3%) |
| Total | 1,133 (100.0%) | 301 (100.0%) |
Housing Structure by Heating Type in Barton Creek
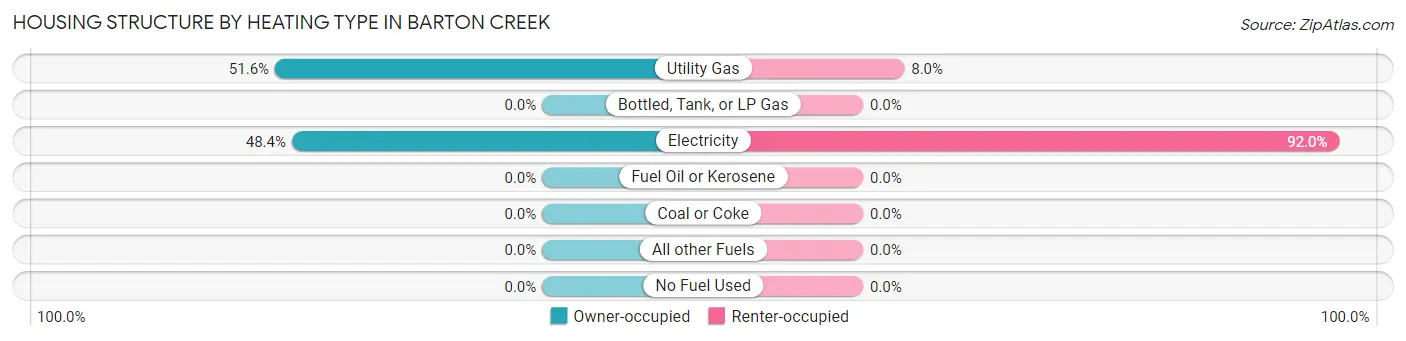
| Heating Type | Owner-occupied | Renter-occupied |
| Utility Gas | 585 (51.6%) | 24 (8.0%) |
| Bottled, Tank, or LP Gas | 0 (0.0%) | 0 (0.0%) |
| Electricity | 548 (48.4%) | 277 (92.0%) |
| Fuel Oil or Kerosene | 0 (0.0%) | 0 (0.0%) |
| Coal or Coke | 0 (0.0%) | 0 (0.0%) |
| All other Fuels | 0 (0.0%) | 0 (0.0%) |
| No Fuel Used | 0 (0.0%) | 0 (0.0%) |
| Total | 1,133 (100.0%) | 301 (100.0%) |
Household Vehicle Usage in Barton Creek
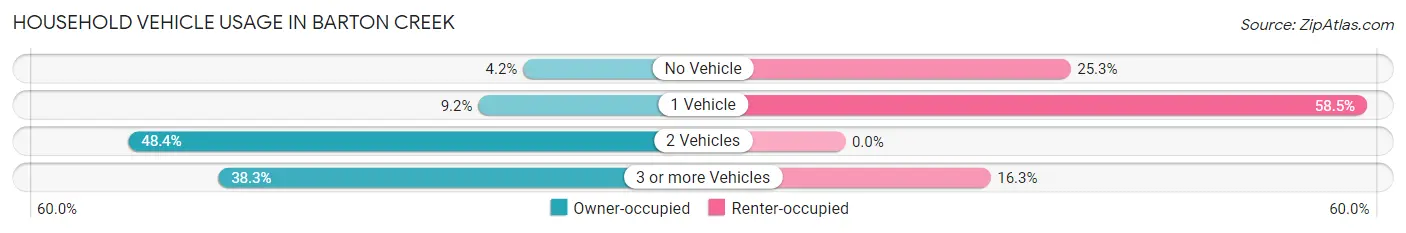
| Vehicles per Household | Owner-occupied | Renter-occupied |
| No Vehicle | 47 (4.2%) | 76 (25.3%) |
| 1 Vehicle | 104 (9.2%) | 176 (58.5%) |
| 2 Vehicles | 548 (48.4%) | 0 (0.0%) |
| 3 or more Vehicles | 434 (38.3%) | 49 (16.3%) |
| Total | 1,133 (100.0%) | 301 (100.0%) |
Real Estate & Mortgages in Barton Creek
Real Estate and Mortgage Overview in Barton Creek
| Characteristic | Without Mortgage | With Mortgage |
| Housing Units | 333 | 800 |
| Median Property Value | $1,238,000 | $1,742,300 |
| Median Household Income | $144,083 | $669 |
| Monthly Housing Costs | $1,501 | $756 |
| Real Estate Taxes | $10,001 | $0 |
Property Value by Mortgage Status in Barton Creek
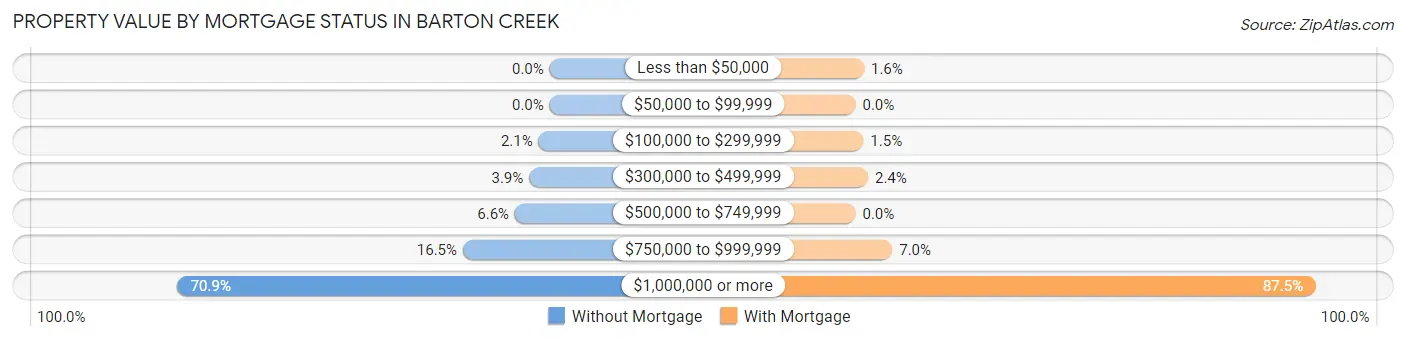
| Property Value | Without Mortgage | With Mortgage |
| Less than $50,000 | 0 (0.0%) | 13 (1.6%) |
| $50,000 to $99,999 | 0 (0.0%) | 0 (0.0%) |
| $100,000 to $299,999 | 7 (2.1%) | 12 (1.5%) |
| $300,000 to $499,999 | 13 (3.9%) | 19 (2.4%) |
| $500,000 to $749,999 | 22 (6.6%) | 0 (0.0%) |
| $750,000 to $999,999 | 55 (16.5%) | 56 (7.0%) |
| $1,000,000 or more | 236 (70.9%) | 700 (87.5%) |
| Total | 333 (100.0%) | 800 (100.0%) |
Household Income by Mortgage Status in Barton Creek
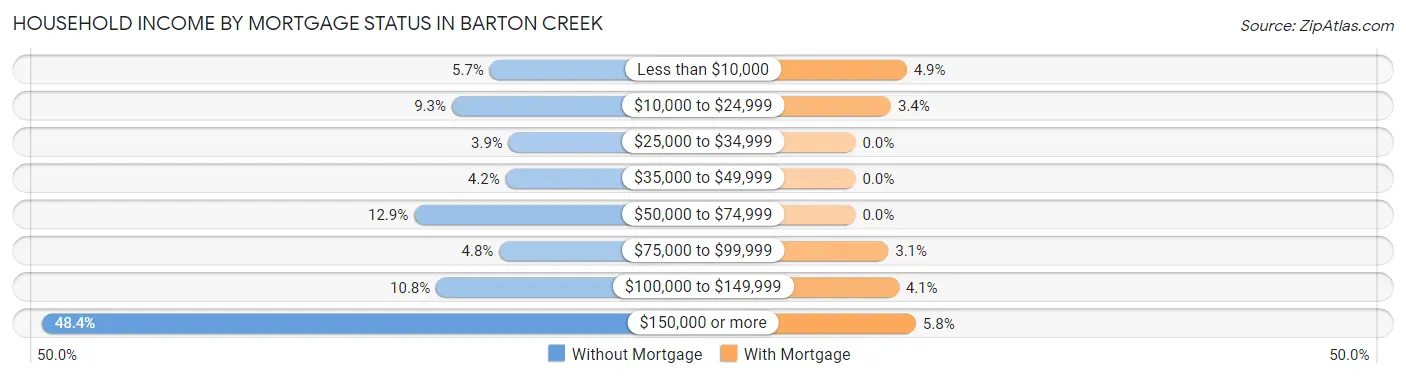
| Household Income | Without Mortgage | With Mortgage |
| Less than $10,000 | 19 (5.7%) | 39 (4.9%) |
| $10,000 to $24,999 | 31 (9.3%) | 27 (3.4%) |
| $25,000 to $34,999 | 13 (3.9%) | 0 (0.0%) |
| $35,000 to $49,999 | 14 (4.2%) | 0 (0.0%) |
| $50,000 to $74,999 | 43 (12.9%) | 0 (0.0%) |
| $75,000 to $99,999 | 16 (4.8%) | 25 (3.1%) |
| $100,000 to $149,999 | 36 (10.8%) | 33 (4.1%) |
| $150,000 or more | 161 (48.3%) | 46 (5.8%) |
| Total | 333 (100.0%) | 800 (100.0%) |
Property Value to Household Income Ratio in Barton Creek
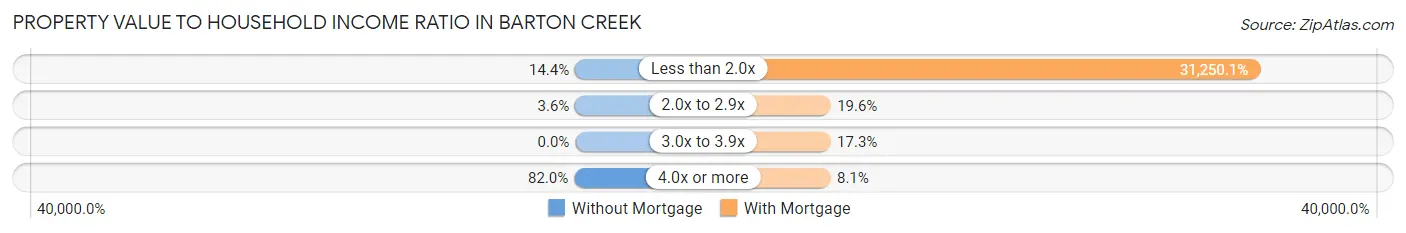
| Value-to-Income Ratio | Without Mortgage | With Mortgage |
| Less than 2.0x | 48 (14.4%) | 250,001 (31,250.1%) |
| 2.0x to 2.9x | 12 (3.6%) | 157 (19.6%) |
| 3.0x to 3.9x | 0 (0.0%) | 138 (17.2%) |
| 4.0x or more | 273 (82.0%) | 65 (8.1%) |
| Total | 333 (100.0%) | 800 (100.0%) |
Real Estate Taxes by Mortgage Status in Barton Creek

| Property Taxes | Without Mortgage | With Mortgage |
| Less than $800 | 0 (0.0%) | 14 (1.8%) |
| $800 to $1,499 | 7 (2.1%) | 13 (1.6%) |
| $800 to $1,499 | 304 (91.3%) | 12 (1.5%) |
| Total | 333 (100.0%) | 800 (100.0%) |
Health & Disability in Barton Creek
Health Insurance Coverage by Age in Barton Creek
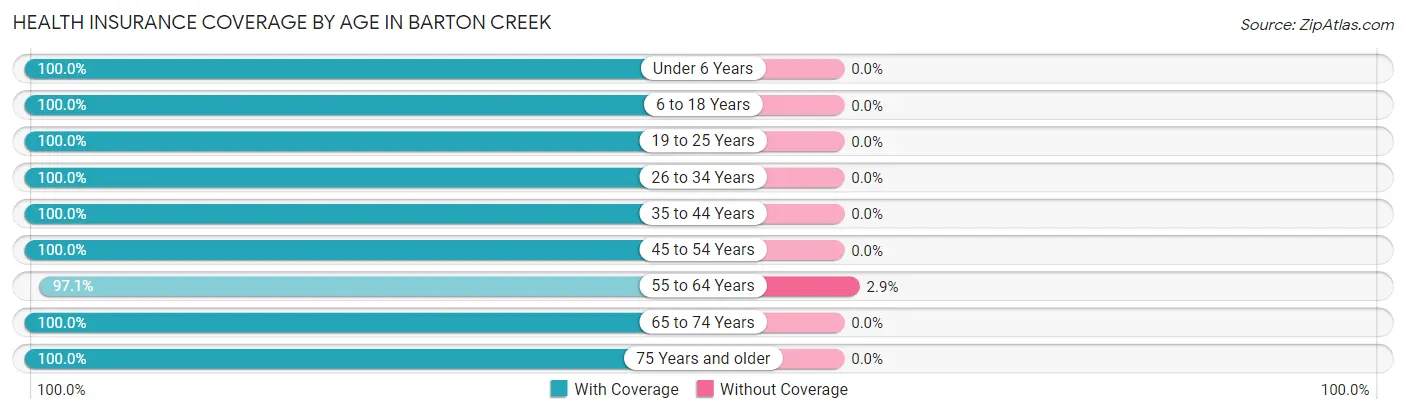
| Age Bracket | With Coverage | Without Coverage |
| Under 6 Years | 87 (100.0%) | 0 (0.0%) |
| 6 to 18 Years | 437 (100.0%) | 0 (0.0%) |
| 19 to 25 Years | 133 (100.0%) | 0 (0.0%) |
| 26 to 34 Years | 174 (100.0%) | 0 (0.0%) |
| 35 to 44 Years | 112 (100.0%) | 0 (0.0%) |
| 45 to 54 Years | 664 (100.0%) | 0 (0.0%) |
| 55 to 64 Years | 544 (97.1%) | 16 (2.9%) |
| 65 to 74 Years | 584 (100.0%) | 0 (0.0%) |
| 75 Years and older | 299 (100.0%) | 0 (0.0%) |
| Total | 3,034 (99.5%) | 16 (0.5%) |
Health Insurance Coverage by Citizenship Status in Barton Creek

| Citizenship Status | With Coverage | Without Coverage |
| Native Born | 87 (100.0%) | 0 (0.0%) |
| Foreign Born, Citizen | 437 (100.0%) | 0 (0.0%) |
| Foreign Born, not a Citizen | 133 (100.0%) | 0 (0.0%) |
Health Insurance Coverage by Household Income in Barton Creek
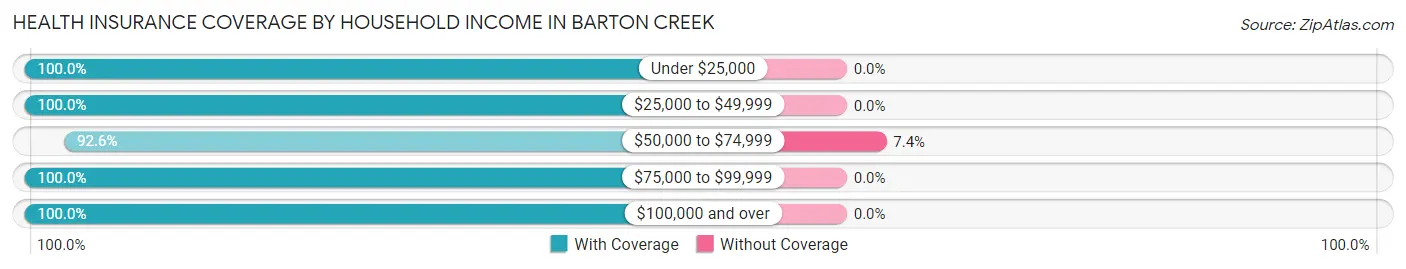
| Household Income | With Coverage | Without Coverage |
| Under $25,000 | 141 (100.0%) | 0 (0.0%) |
| $25,000 to $49,999 | 81 (100.0%) | 0 (0.0%) |
| $50,000 to $74,999 | 200 (92.6%) | 16 (7.4%) |
| $75,000 to $99,999 | 120 (100.0%) | 0 (0.0%) |
| $100,000 and over | 2,492 (100.0%) | 0 (0.0%) |
Public vs Private Health Insurance Coverage by Age in Barton Creek
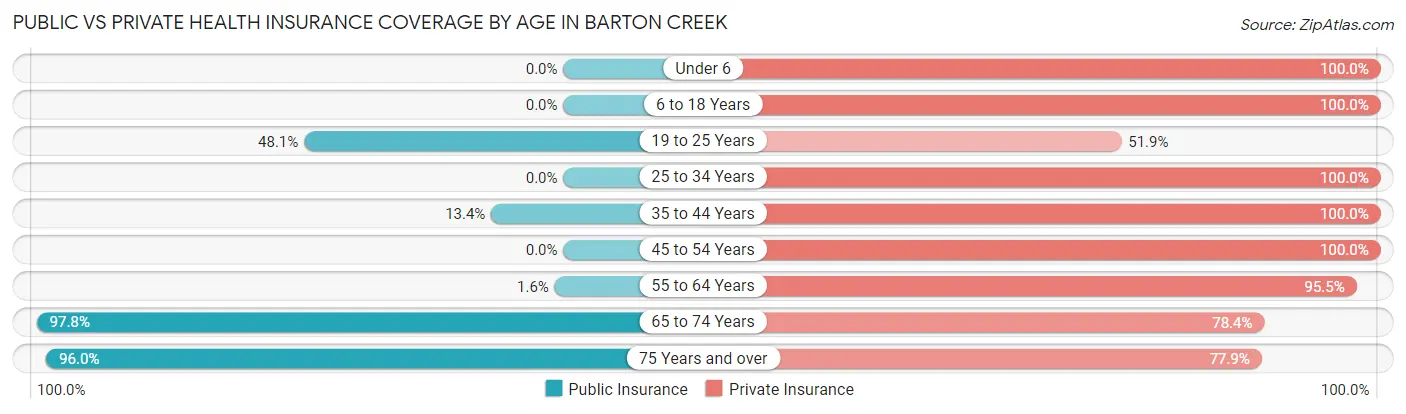
| Age Bracket | Public Insurance | Private Insurance |
| Under 6 | 0 (0.0%) | 87 (100.0%) |
| 6 to 18 Years | 0 (0.0%) | 437 (100.0%) |
| 19 to 25 Years | 64 (48.1%) | 69 (51.9%) |
| 25 to 34 Years | 0 (0.0%) | 174 (100.0%) |
| 35 to 44 Years | 15 (13.4%) | 112 (100.0%) |
| 45 to 54 Years | 0 (0.0%) | 664 (100.0%) |
| 55 to 64 Years | 9 (1.6%) | 535 (95.5%) |
| 65 to 74 Years | 571 (97.8%) | 458 (78.4%) |
| 75 Years and over | 287 (96.0%) | 233 (77.9%) |
| Total | 946 (31.0%) | 2,769 (90.8%) |
Disability Status by Sex by Age in Barton Creek
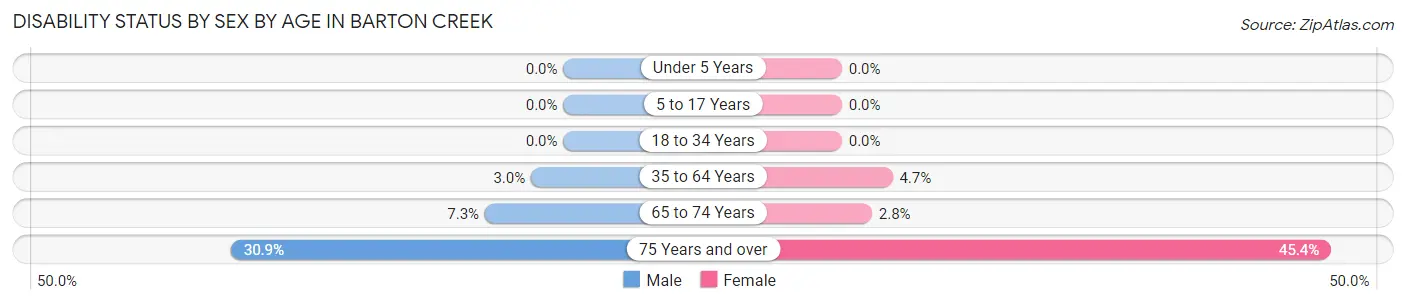
| Age Bracket | Male | Female |
| Under 5 Years | 0 (0.0%) | 0 (0.0%) |
| 5 to 17 Years | 0 (0.0%) | 0 (0.0%) |
| 18 to 34 Years | 0 (0.0%) | 0 (0.0%) |
| 35 to 64 Years | 19 (3.0%) | 33 (4.7%) |
| 65 to 74 Years | 19 (7.3%) | 9 (2.8%) |
| 75 Years and over | 25 (30.9%) | 99 (45.4%) |
Disability Class by Sex by Age in Barton Creek
Disability Class: Hearing Difficulty
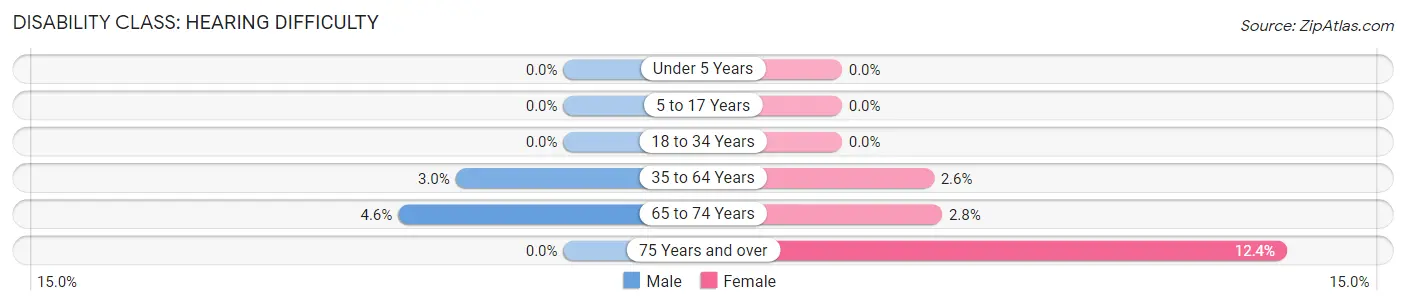
| Age Bracket | Male | Female |
| Under 5 Years | 0 (0.0%) | 0 (0.0%) |
| 5 to 17 Years | 0 (0.0%) | 0 (0.0%) |
| 18 to 34 Years | 0 (0.0%) | 0 (0.0%) |
| 35 to 64 Years | 19 (3.0%) | 18 (2.6%) |
| 65 to 74 Years | 12 (4.6%) | 9 (2.8%) |
| 75 Years and over | 0 (0.0%) | 27 (12.4%) |
Disability Class: Vision Difficulty
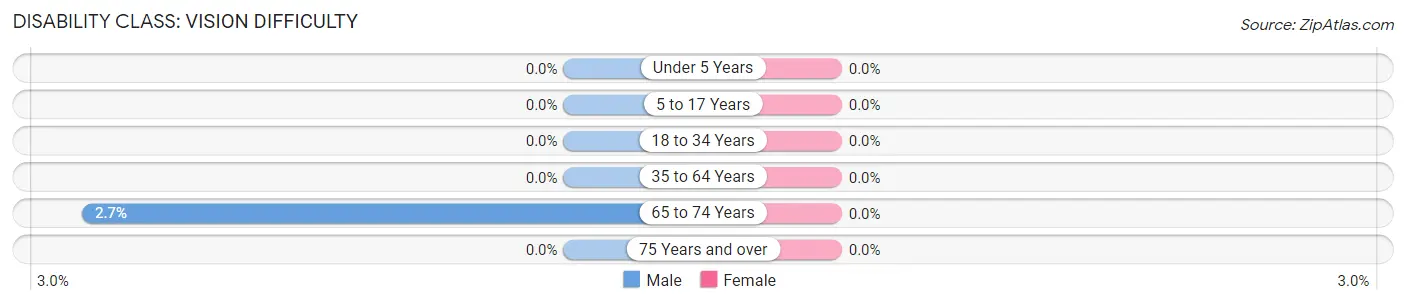
| Age Bracket | Male | Female |
| Under 5 Years | 0 (0.0%) | 0 (0.0%) |
| 5 to 17 Years | 0 (0.0%) | 0 (0.0%) |
| 18 to 34 Years | 0 (0.0%) | 0 (0.0%) |
| 35 to 64 Years | 0 (0.0%) | 0 (0.0%) |
| 65 to 74 Years | 7 (2.7%) | 0 (0.0%) |
| 75 Years and over | 0 (0.0%) | 0 (0.0%) |
Disability Class: Cognitive Difficulty
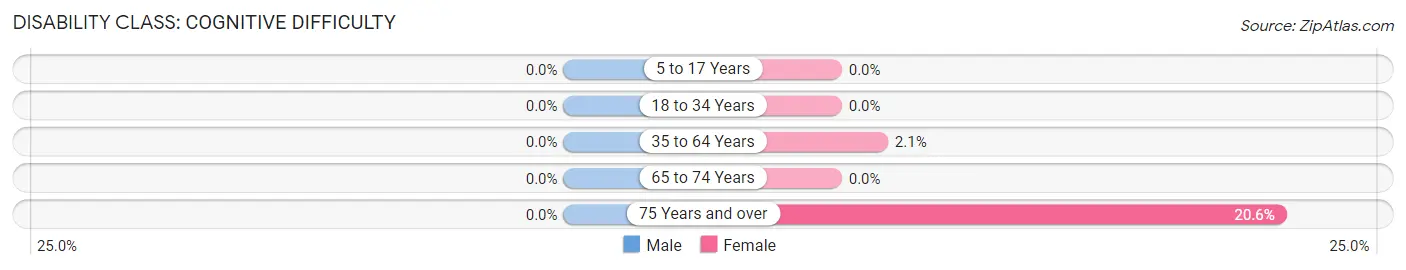
| Age Bracket | Male | Female |
| 5 to 17 Years | 0 (0.0%) | 0 (0.0%) |
| 18 to 34 Years | 0 (0.0%) | 0 (0.0%) |
| 35 to 64 Years | 0 (0.0%) | 15 (2.1%) |
| 65 to 74 Years | 0 (0.0%) | 0 (0.0%) |
| 75 Years and over | 0 (0.0%) | 45 (20.6%) |
Disability Class: Ambulatory Difficulty
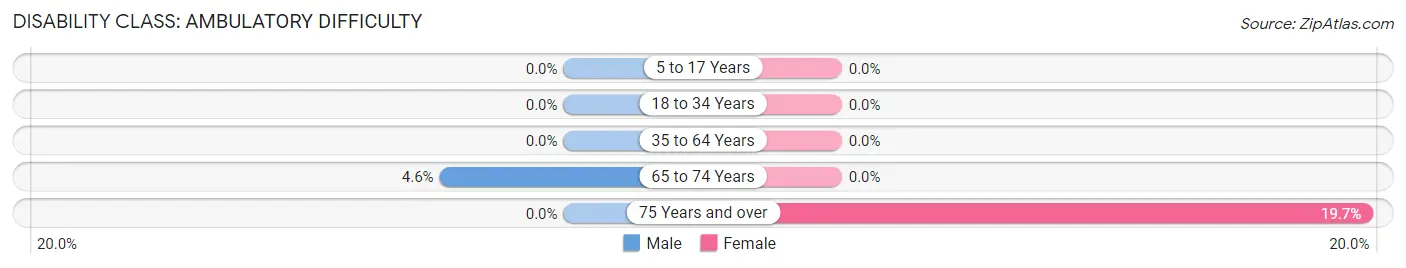
| Age Bracket | Male | Female |
| 5 to 17 Years | 0 (0.0%) | 0 (0.0%) |
| 18 to 34 Years | 0 (0.0%) | 0 (0.0%) |
| 35 to 64 Years | 0 (0.0%) | 0 (0.0%) |
| 65 to 74 Years | 12 (4.6%) | 0 (0.0%) |
| 75 Years and over | 0 (0.0%) | 43 (19.7%) |
Disability Class: Self-Care Difficulty
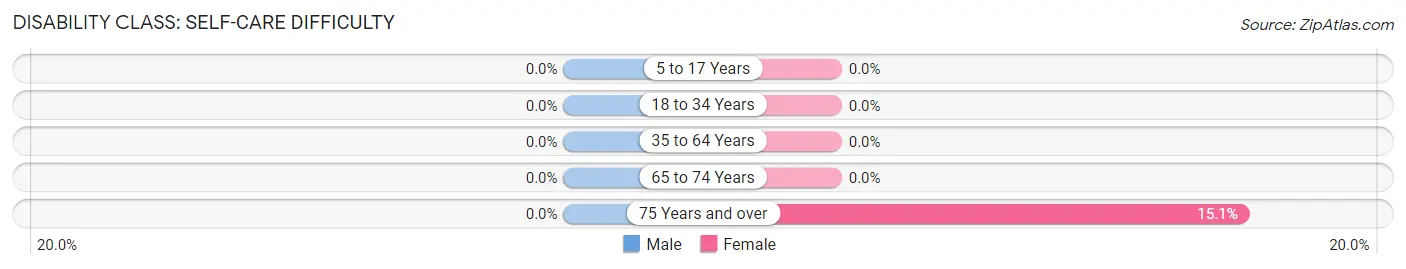
| Age Bracket | Male | Female |
| 5 to 17 Years | 0 (0.0%) | 0 (0.0%) |
| 18 to 34 Years | 0 (0.0%) | 0 (0.0%) |
| 35 to 64 Years | 0 (0.0%) | 0 (0.0%) |
| 65 to 74 Years | 0 (0.0%) | 0 (0.0%) |
| 75 Years and over | 0 (0.0%) | 33 (15.1%) |
Technology Access in Barton Creek
Computing Device Access in Barton Creek
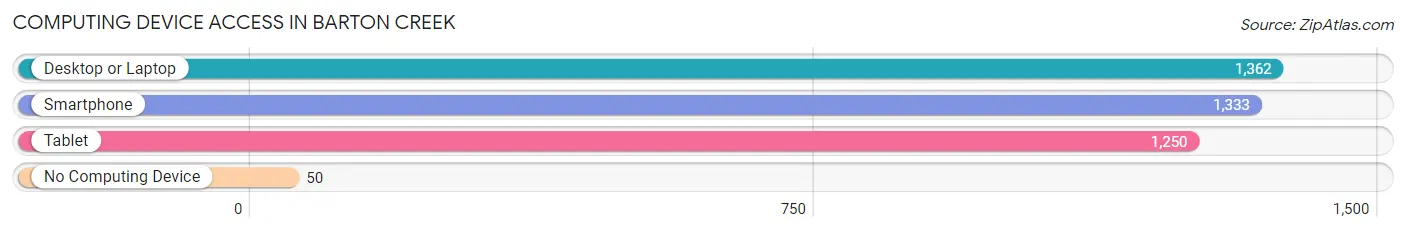
| Device Type | # Households | % Households |
| Desktop or Laptop | 1,362 | 95.0% |
| Smartphone | 1,333 | 93.0% |
| Tablet | 1,250 | 87.2% |
| No Computing Device | 50 | 3.5% |
| Total | 1,434 | 100.0% |
Internet Access in Barton Creek
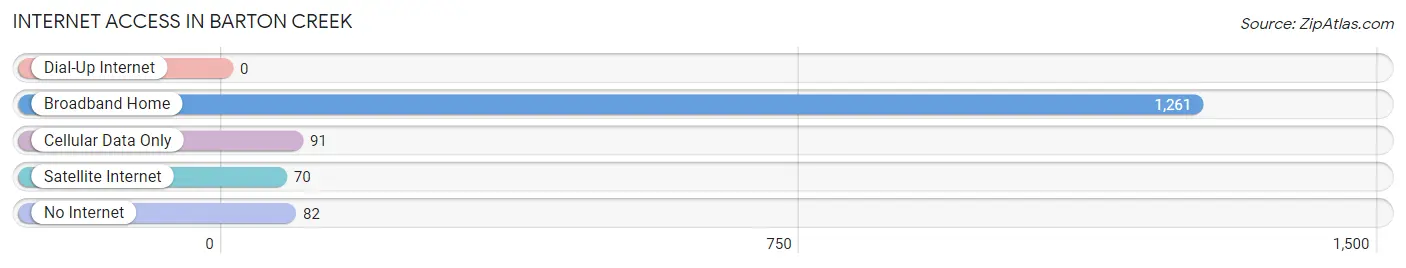
| Internet Type | # Households | % Households |
| Dial-Up Internet | 0 | 0.0% |
| Broadband Home | 1,261 | 87.9% |
| Cellular Data Only | 91 | 6.4% |
| Satellite Internet | 70 | 4.9% |
| No Internet | 82 | 5.7% |
| Total | 1,434 | 100.0% |
Barton Creek Summary
Barton Creek is a small unincorporated community located in Travis County, Texas, United States. It is situated in the Hill Country region of Central Texas, approximately 20 miles west of Austin. The community is named after Barton Creek, a tributary of the Colorado River, which flows through the area.
History
The area that is now Barton Creek was originally inhabited by the Tonkawa and Comanche Native American tribes. The first European settlers arrived in the area in the early 1800s, and the community was officially established in 1845. The area was originally known as Barton Springs, named after the natural springs in the area. The name was later changed to Barton Creek.
In the late 1800s, the area was home to several small farms and ranches. The community was also home to a number of businesses, including a general store, a blacksmith shop, and a cotton gin.
Geography
Barton Creek is located in the Hill Country region of Central Texas, approximately 20 miles west of Austin. The community is situated along Barton Creek, a tributary of the Colorado River. The area is characterized by rolling hills, limestone outcroppings, and cedar and oak trees.
The climate in Barton Creek is generally mild, with hot summers and mild winters. The average annual temperature is 68°F, and the average annual precipitation is 33 inches.
Economy
The economy of Barton Creek is largely based on agriculture and tourism. The area is home to several small farms and ranches, which produce a variety of crops, including corn, wheat, hay, and cotton. The area is also home to several wineries and vineyards, which produce a variety of wines.
Tourism is also an important part of the local economy. The area is home to several popular attractions, including Barton Creek Greenbelt, a 7.9-mile hiking and biking trail, and the Barton Creek Cave, a limestone cave system.
Demographics
As of the 2010 census, the population of Barton Creek was 1,845. The racial makeup of the community was 94.3% White, 1.2% African American, 0.7% Native American, 0.5% Asian, 0.1% Pacific Islander, and 2.2% from other races. The median household income was $50,000, and the median home value was $250,000.
Conclusion
Barton Creek is a small unincorporated community located in Travis County, Texas, United States. It is situated in the Hill Country region of Central Texas, approximately 20 miles west of Austin. The community is named after Barton Creek, a tributary of the Colorado River, which flows through the area. The economy of Barton Creek is largely based on agriculture and tourism, and the area is home to several popular attractions, including Barton Creek Greenbelt and the Barton Creek Cave. As of the 2010 census, the population of Barton Creek was 1,845. The racial makeup of the community was 94.3% White, 1.2% African American, 0.7% Native American, 0.5% Asian, 0.1% Pacific Islander, and 2.2% from other races. The median household income was $50,000, and the median home value was $250,000.
Common Questions
What is Per Capita Income in Barton Creek?
Per Capita income in Barton Creek is $184,151.
What is the Median Family Income in Barton Creek?
Median Family Income in Barton Creek is $250,001.
What is the Median Household income in Barton Creek?
Median Household Income in Barton Creek is $230,556.
What is Income or Wage Gap in Barton Creek?
Income or Wage Gap in Barton Creek is 65.7%.
Women in Barton Creek earn 34.3 cents for every dollar earned by a man.
What is Family Income Deficit in Barton Creek?
Family Income Deficit in Barton Creek is $6,298.
Families that are below poverty line in Barton Creek earn $6,298 less on average than the poverty threshold level.
What is Inequality or Gini Index in Barton Creek?
Inequality or Gini Index in Barton Creek is 0.55.
What is the Total Population of Barton Creek?
Total Population of Barton Creek is 3,234.
What is the Total Male Population of Barton Creek?
Total Male Population of Barton Creek is 1,513.
What is the Total Female Population of Barton Creek?
Total Female Population of Barton Creek is 1,721.
What is the Ratio of Males per 100 Females in Barton Creek?
There are 87.91 Males per 100 Females in Barton Creek.
What is the Ratio of Females per 100 Males in Barton Creek?
There are 113.75 Females per 100 Males in Barton Creek.
What is the Median Population Age in Barton Creek?
Median Population Age in Barton Creek is 55.4 Years.
What is the Average Family Size in Barton Creek
Average Family Size in Barton Creek is 2.6 People.
What is the Average Household Size in Barton Creek
Average Household Size in Barton Creek is 2.1 People.
How Large is the Labor Force in Barton Creek?
There are 1,413 People in the Labor Forcein in Barton Creek.
What is the Percentage of People in the Labor Force in Barton Creek?
50.1% of People are in the Labor Force in Barton Creek.
What is the Unemployment Rate in Barton Creek?
Unemployment Rate in Barton Creek is 2.1%.