Hollywood Park, TX Map & Demographics
Hollywood Park Map
Hollywood Park Overview
$70,828
PER CAPITA INCOME
$142,593
AVG FAMILY INCOME
$137,411
AVG HOUSEHOLD INCOME
68.5%
WAGE / INCOME GAP [ % ]
31.5¢/ $1
WAGE / INCOME GAP [ $ ]
0.47
INEQUALITY / GINI INDEX
3,123
TOTAL POPULATION
1,436
MALE POPULATION
1,687
FEMALE POPULATION
85.12
MALES / 100 FEMALES
117.48
FEMALES / 100 MALES
44.0
MEDIAN AGE
3.2
AVG FAMILY SIZE
2.8
AVG HOUSEHOLD SIZE
1,426
LABOR FORCE [ PEOPLE ]
60.1%
PERCENT IN LABOR FORCE
Hollywood Park Area Codes
Income in Hollywood Park
Income Overview in Hollywood Park
Per Capita Income in Hollywood Park is $70,828, while median incomes of families and households are $142,593 and $137,411 respectively.
| Characteristic | Number | Measure |
| Per Capita Income | 3,123 | $70,828 |
| Median Family Income | 888 | $142,593 |
| Mean Family Income | 888 | $224,856 |
| Median Household Income | 1,109 | $137,411 |
| Mean Household Income | 1,109 | $196,224 |
| Income Deficit | 888 | $0 |
| Wage / Income Gap (%) | 3,123 | 68.49% |
| Wage / Income Gap ($) | 3,123 | 31.51¢ per $1 |
| Gini / Inequality Index | 3,123 | 0.47 |
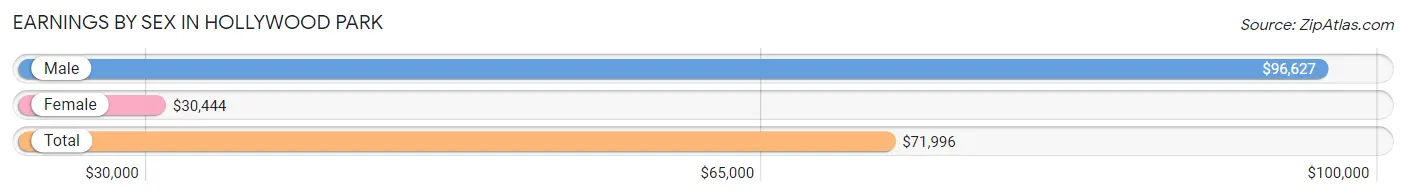
Earnings by Sex in Hollywood Park
Average Earnings in Hollywood Park are $71,996, $96,627 for men and $30,444 for women, a difference of 68.5%.
| Sex | Number | Average Earnings |
| Male | 891 (58.3%) | $96,627 |
| Female | 638 (41.7%) | $30,444 |
| Total | 1,529 (100.0%) | $71,996 |
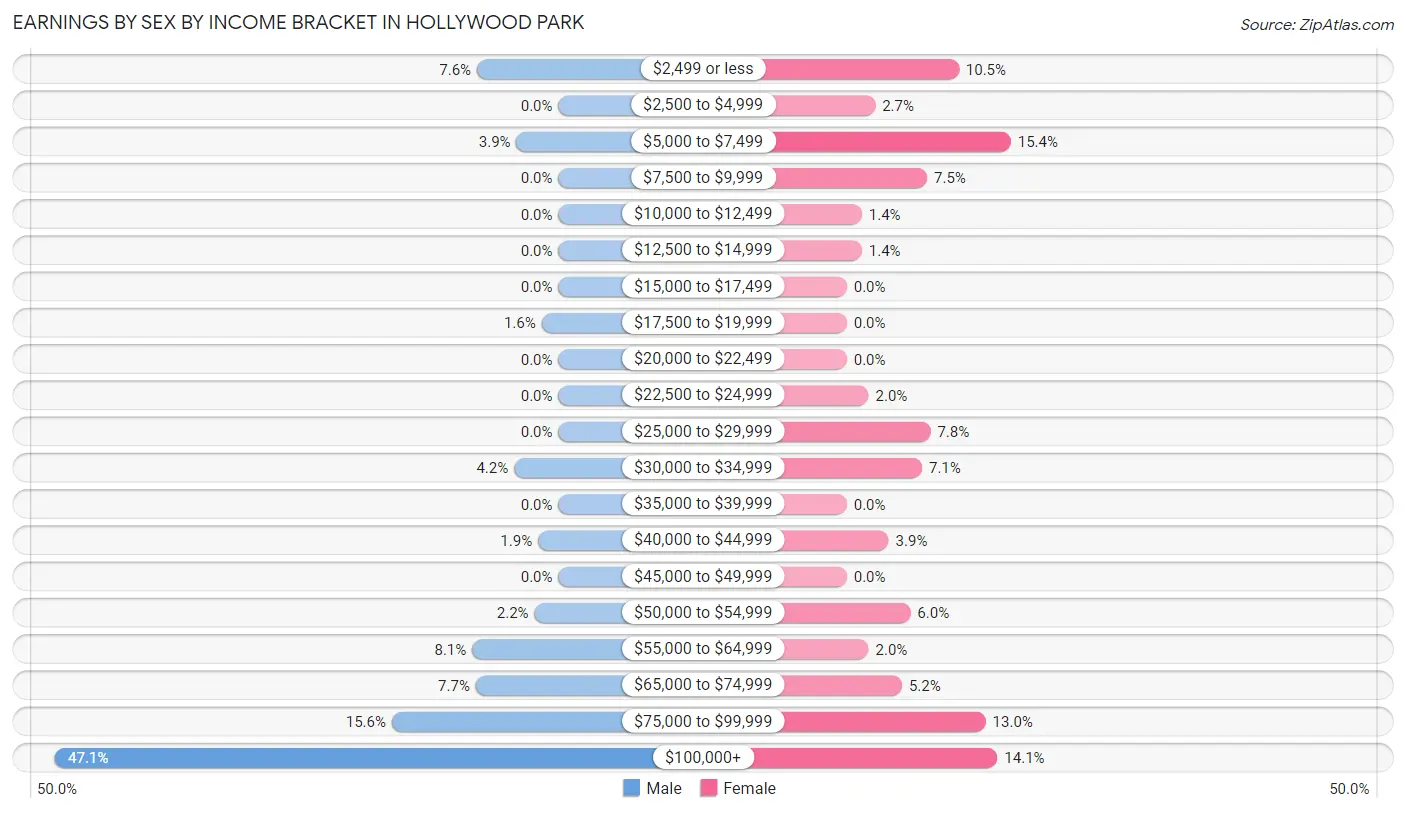
Earnings by Sex by Income Bracket in Hollywood Park
The most common earnings brackets in Hollywood Park are $100,000+ for men (420 | 47.1%) and $5,000 to $7,499 for women (98 | 15.4%).
| Income | Male | Female |
| $2,499 or less | 68 (7.6%) | 67 (10.5%) |
| $2,500 to $4,999 | 0 (0.0%) | 17 (2.7%) |
| $5,000 to $7,499 | 35 (3.9%) | 98 (15.4%) |
| $7,500 to $9,999 | 0 (0.0%) | 48 (7.5%) |
| $10,000 to $12,499 | 0 (0.0%) | 9 (1.4%) |
| $12,500 to $14,999 | 0 (0.0%) | 9 (1.4%) |
| $15,000 to $17,499 | 0 (0.0%) | 0 (0.0%) |
| $17,500 to $19,999 | 14 (1.6%) | 0 (0.0%) |
| $20,000 to $22,499 | 0 (0.0%) | 0 (0.0%) |
| $22,500 to $24,999 | 0 (0.0%) | 13 (2.0%) |
| $25,000 to $29,999 | 0 (0.0%) | 50 (7.8%) |
| $30,000 to $34,999 | 37 (4.2%) | 45 (7.0%) |
| $35,000 to $39,999 | 0 (0.0%) | 0 (0.0%) |
| $40,000 to $44,999 | 17 (1.9%) | 25 (3.9%) |
| $45,000 to $49,999 | 0 (0.0%) | 0 (0.0%) |
| $50,000 to $54,999 | 20 (2.2%) | 38 (6.0%) |
| $55,000 to $64,999 | 72 (8.1%) | 13 (2.0%) |
| $65,000 to $74,999 | 69 (7.7%) | 33 (5.2%) |
| $75,000 to $99,999 | 139 (15.6%) | 83 (13.0%) |
| $100,000+ | 420 (47.1%) | 90 (14.1%) |
| Total | 891 (100.0%) | 638 (100.0%) |
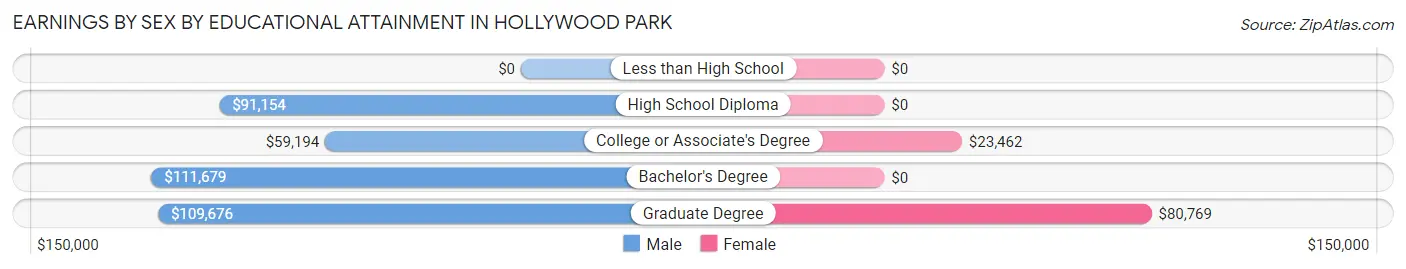
Earnings by Sex by Educational Attainment in Hollywood Park
Average earnings in Hollywood Park are $104,821 for men and $41,375 for women, a difference of 60.5%. Men with an educational attainment of bachelor's degree enjoy the highest average annual earnings of $111,679, while those with college or associate's degree education earn the least with $59,194. Women with an educational attainment of graduate degree earn the most with the average annual earnings of $80,769, while those with college or associate's degree education have the smallest earnings of $23,462.
| Educational Attainment | Male Income | Female Income |
| Less than High School | - | - |
| High School Diploma | $91,154 | $0 |
| College or Associate's Degree | $59,194 | $23,462 |
| Bachelor's Degree | $111,679 | $0 |
| Graduate Degree | $109,676 | $80,769 |
| Total | $104,821 | $41,375 |
Family Income in Hollywood Park
Family Income Brackets in Hollywood Park
According to the Hollywood Park family income data, there are 330 families falling into the $100,000 to $149,999 income range, which is the most common income bracket and makes up 37.2% of all families.
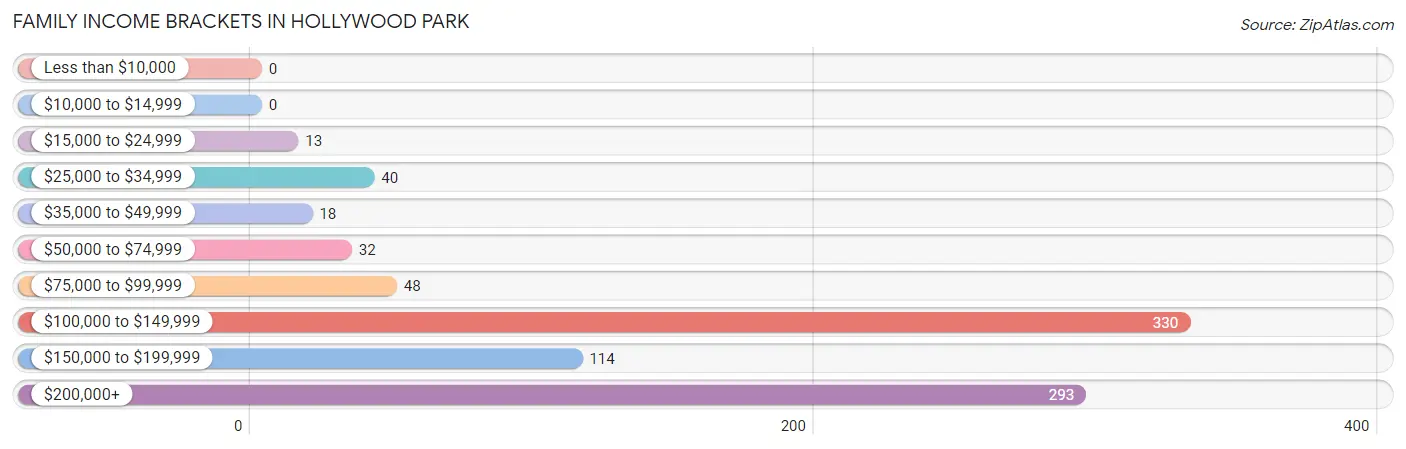
| Income Bracket | # Families | % Families |
| Less than $10,000 | 0 | 0.0% |
| $10,000 to $14,999 | 0 | 0.0% |
| $15,000 to $24,999 | 13 | 1.5% |
| $25,000 to $34,999 | 40 | 4.5% |
| $35,000 to $49,999 | 18 | 2.0% |
| $50,000 to $74,999 | 32 | 3.6% |
| $75,000 to $99,999 | 48 | 5.4% |
| $100,000 to $149,999 | 330 | 37.2% |
| $150,000 to $199,999 | 114 | 12.8% |
| $200,000+ | 293 | 33.0% |
Family Income by Famaliy Size in Hollywood Park
4-person families (143 | 16.1%) account for the highest median family income in Hollywood Park with $212,188 per family, while 2-person families (385 | 43.4%) have the highest median income of $71,782 per family member.
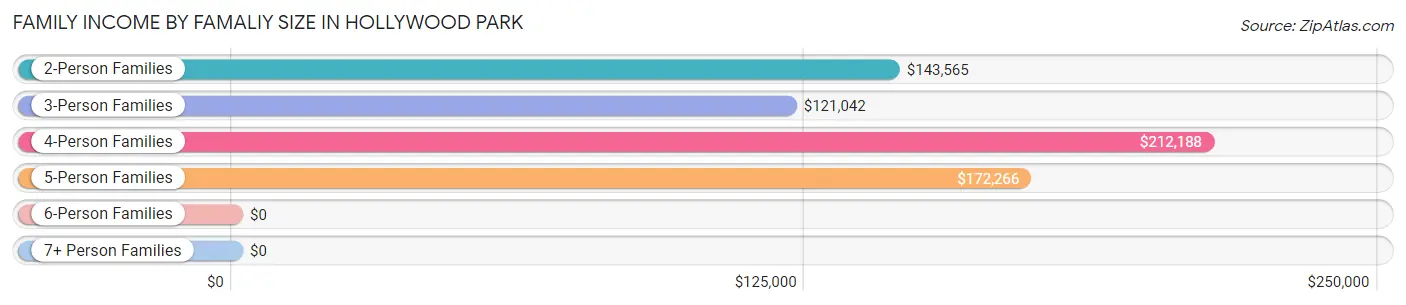
| Income Bracket | # Families | Median Income |
| 2-Person Families | 385 (43.4%) | $143,565 |
| 3-Person Families | 224 (25.2%) | $121,042 |
| 4-Person Families | 143 (16.1%) | $212,188 |
| 5-Person Families | 111 (12.5%) | $172,266 |
| 6-Person Families | 25 (2.8%) | $0 |
| 7+ Person Families | 0 (0.0%) | $0 |
| Total | 888 (100.0%) | $142,593 |
Family Income by Number of Earners in Hollywood Park
The median family income in Hollywood Park is $142,593, with families comprising 2 earners (310) having the highest median family income of $176,000, while families with no earners (119) have the lowest median family income of $70,750, accounting for 34.9% and 13.4% of families, respectively.
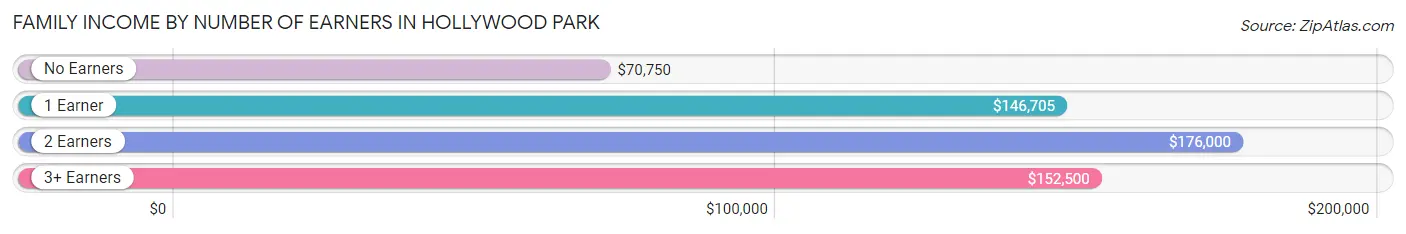
| Number of Earners | # Families | Median Income |
| No Earners | 119 (13.4%) | $70,750 |
| 1 Earner | 321 (36.1%) | $146,705 |
| 2 Earners | 310 (34.9%) | $176,000 |
| 3+ Earners | 138 (15.5%) | $152,500 |
| Total | 888 (100.0%) | $142,593 |
Household Income in Hollywood Park
Household Income Brackets in Hollywood Park
With 374 households falling in the category, the $100,000 to $149,999 income range is the most frequent in Hollywood Park, accounting for 33.7% of all households.
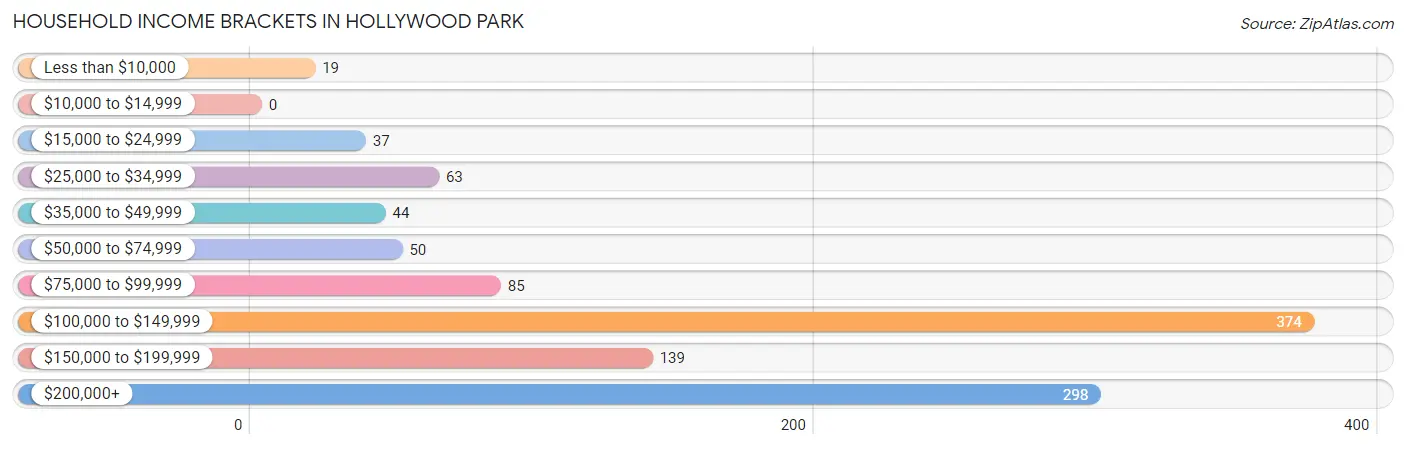
| Income Bracket | # Households | % Households |
| Less than $10,000 | 19 | 1.7% |
| $10,000 to $14,999 | 0 | 0.0% |
| $15,000 to $24,999 | 37 | 3.3% |
| $25,000 to $34,999 | 63 | 5.7% |
| $35,000 to $49,999 | 44 | 4.0% |
| $50,000 to $74,999 | 50 | 4.5% |
| $75,000 to $99,999 | 85 | 7.7% |
| $100,000 to $149,999 | 374 | 33.7% |
| $150,000 to $199,999 | 139 | 12.5% |
| $200,000+ | 298 | 26.9% |
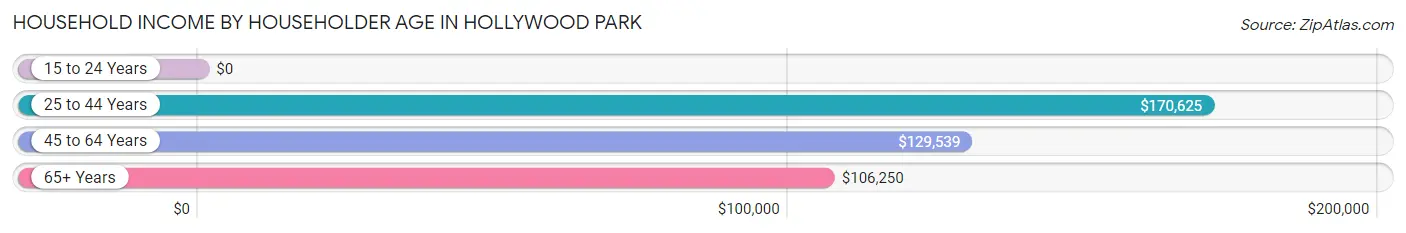
Household Income by Householder Age in Hollywood Park
The median household income in Hollywood Park is $137,411, with the highest median household income of $170,625 found in the 25 to 44 years age bracket for the primary householder. A total of 254 households (22.9%) fall into this category. Meanwhile, the 15 to 24 years age bracket for the primary householder has the lowest median household income of $0, with 5 households (0.4%) in this group.
| Income Bracket | # Households | Median Income |
| 15 to 24 Years | 5 (0.4%) | $0 |
| 25 to 44 Years | 254 (22.9%) | $170,625 |
| 45 to 64 Years | 444 (40.0%) | $129,539 |
| 65+ Years | 406 (36.6%) | $106,250 |
| Total | 1,109 (100.0%) | $137,411 |
Poverty in Hollywood Park
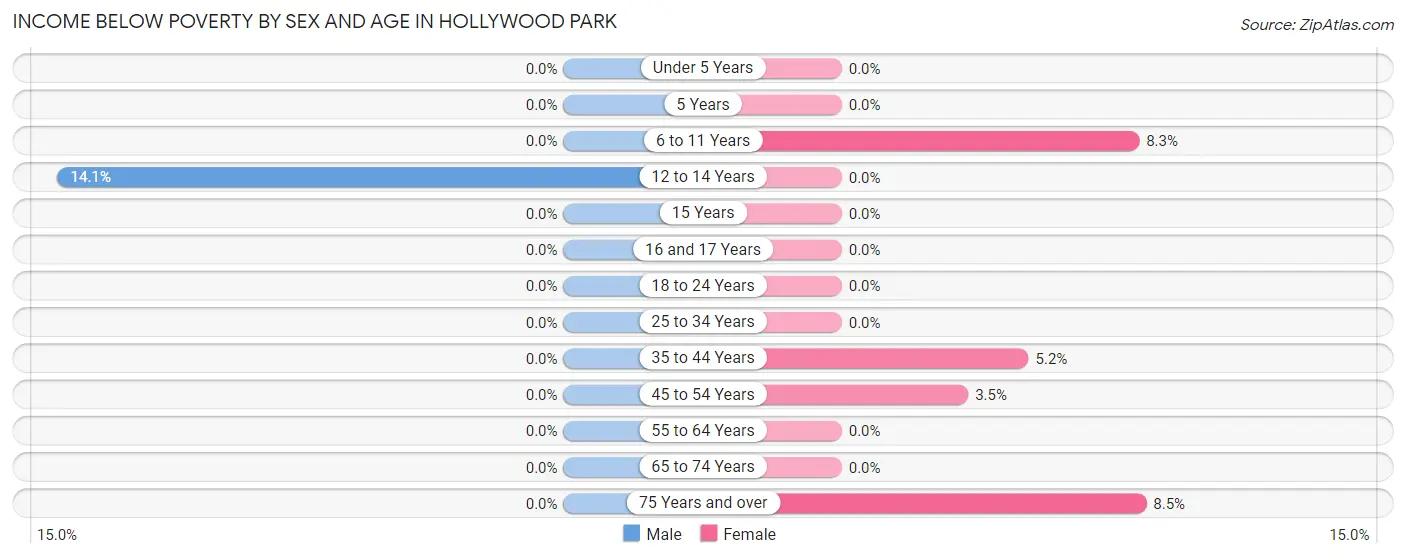
Income Below Poverty by Sex and Age in Hollywood Park
With 0.7% poverty level for males and 3.1% for females among the residents of Hollywood Park, 12 to 14 year old males and 75 year old and over females are the most vulnerable to poverty, with 10 males (14.1%) and 19 females (8.5%) in their respective age groups living below the poverty level.
| Age Bracket | Male | Female |
| Under 5 Years | 0 (0.0%) | 0 (0.0%) |
| 5 Years | 0 (0.0%) | 0 (0.0%) |
| 6 to 11 Years | 0 (0.0%) | 13 (8.3%) |
| 12 to 14 Years | 10 (14.1%) | 0 (0.0%) |
| 15 Years | 0 (0.0%) | 0 (0.0%) |
| 16 and 17 Years | 0 (0.0%) | 0 (0.0%) |
| 18 to 24 Years | 0 (0.0%) | 0 (0.0%) |
| 25 to 34 Years | 0 (0.0%) | 0 (0.0%) |
| 35 to 44 Years | 0 (0.0%) | 13 (5.2%) |
| 45 to 54 Years | 0 (0.0%) | 7 (3.5%) |
| 55 to 64 Years | 0 (0.0%) | 0 (0.0%) |
| 65 to 74 Years | 0 (0.0%) | 0 (0.0%) |
| 75 Years and over | 0 (0.0%) | 19 (8.5%) |
| Total | 10 (0.7%) | 52 (3.1%) |
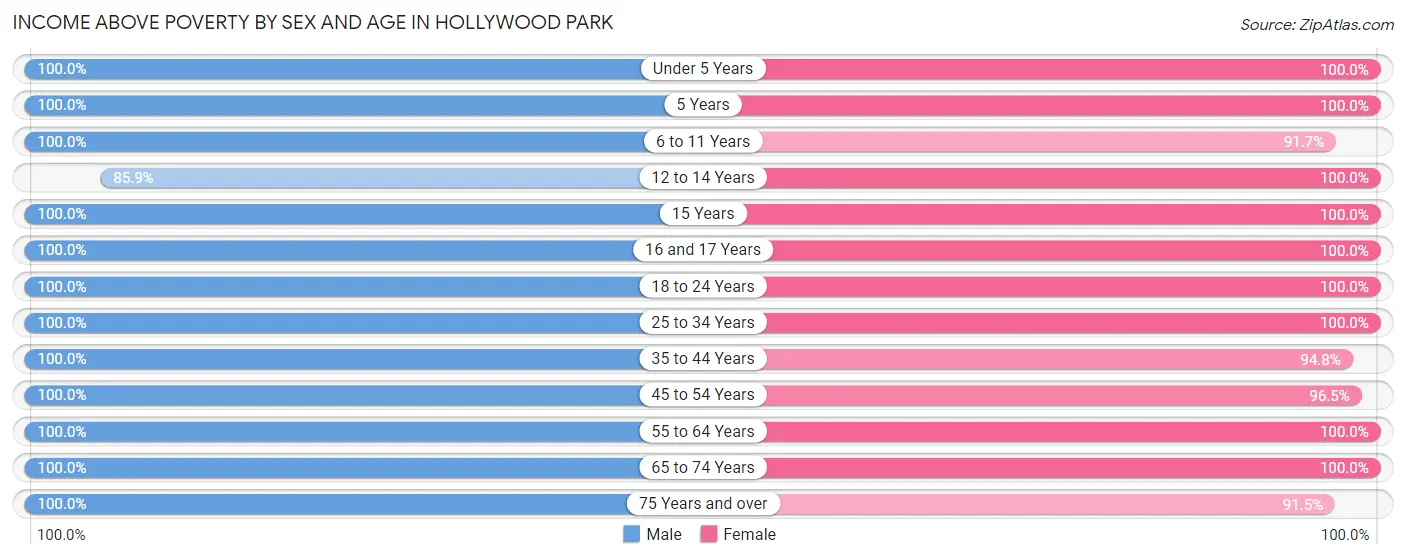
Income Above Poverty by Sex and Age in Hollywood Park
According to the poverty statistics in Hollywood Park, males aged under 5 years and females aged under 5 years are the age groups that are most secure financially, with 100.0% of males and 100.0% of females in these age groups living above the poverty line.
| Age Bracket | Male | Female |
| Under 5 Years | 85 (100.0%) | 164 (100.0%) |
| 5 Years | 45 (100.0%) | 27 (100.0%) |
| 6 to 11 Years | 74 (100.0%) | 144 (91.7%) |
| 12 to 14 Years | 61 (85.9%) | 63 (100.0%) |
| 15 Years | 50 (100.0%) | 14 (100.0%) |
| 16 and 17 Years | 6 (100.0%) | 28 (100.0%) |
| 18 to 24 Years | 127 (100.0%) | 121 (100.0%) |
| 25 to 34 Years | 69 (100.0%) | 93 (100.0%) |
| 35 to 44 Years | 180 (100.0%) | 237 (94.8%) |
| 45 to 54 Years | 195 (100.0%) | 192 (96.5%) |
| 55 to 64 Years | 234 (100.0%) | 182 (100.0%) |
| 65 to 74 Years | 175 (100.0%) | 165 (100.0%) |
| 75 Years and over | 125 (100.0%) | 205 (91.5%) |
| Total | 1,426 (99.3%) | 1,635 (96.9%) |
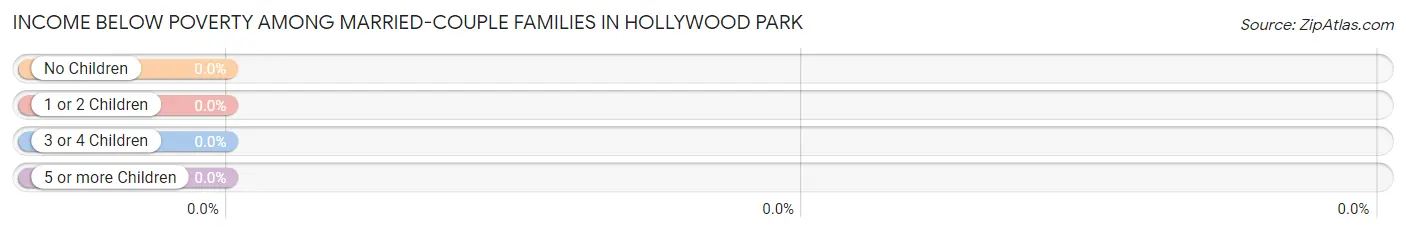
Income Below Poverty Among Married-Couple Families in Hollywood Park
| Children | Above Poverty | Below Poverty |
| No Children | 529 (100.0%) | 0 (0.0%) |
| 1 or 2 Children | 225 (100.0%) | 0 (0.0%) |
| 3 or 4 Children | 96 (100.0%) | 0 (0.0%) |
| 5 or more Children | 0 (0.0%) | 0 (0.0%) |
| Total | 850 (100.0%) | 0 (0.0%) |
Income Below Poverty Among Single-Parent Households in Hollywood Park
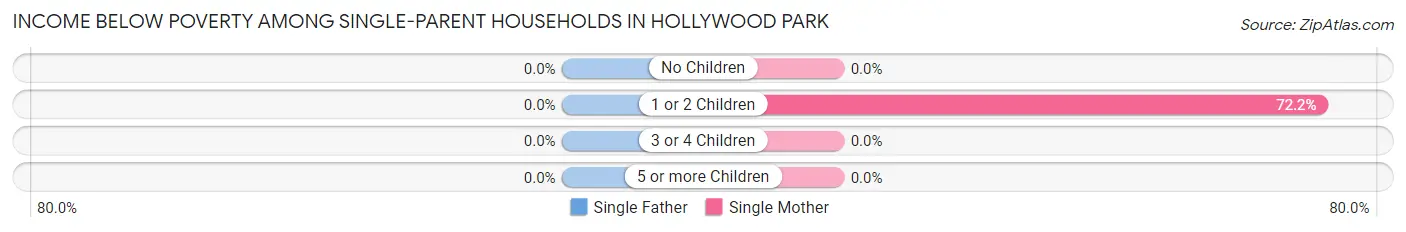
| Children | Single Father | Single Mother |
| No Children | 0 (0.0%) | 0 (0.0%) |
| 1 or 2 Children | 0 (0.0%) | 13 (72.2%) |
| 3 or 4 Children | 0 (0.0%) | 0 (0.0%) |
| 5 or more Children | 0 (0.0%) | 0 (0.0%) |
| Total | 0 (0.0%) | 13 (59.1%) |
Income Below Poverty Among Married-Couple vs Single-Parent Households in Hollywood Park
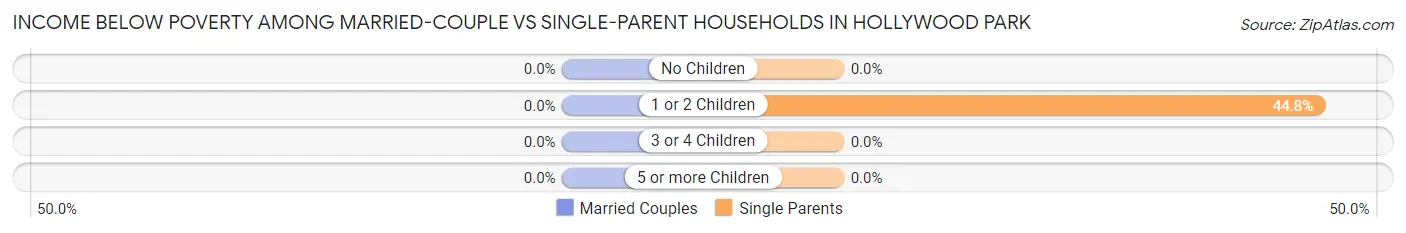
| Children | Married-Couple Families | Single-Parent Households |
| No Children | 0 (0.0%) | 0 (0.0%) |
| 1 or 2 Children | 0 (0.0%) | 13 (44.8%) |
| 3 or 4 Children | 0 (0.0%) | 0 (0.0%) |
| 5 or more Children | 0 (0.0%) | 0 (0.0%) |
| Total | 0 (0.0%) | 13 (34.2%) |
Race in Hollywood Park
The most populous races in Hollywood Park are White / Caucasian (2,765 | 88.5%), Hispanic or Latino (372 | 11.9%), and Two or more Races (183 | 5.9%).
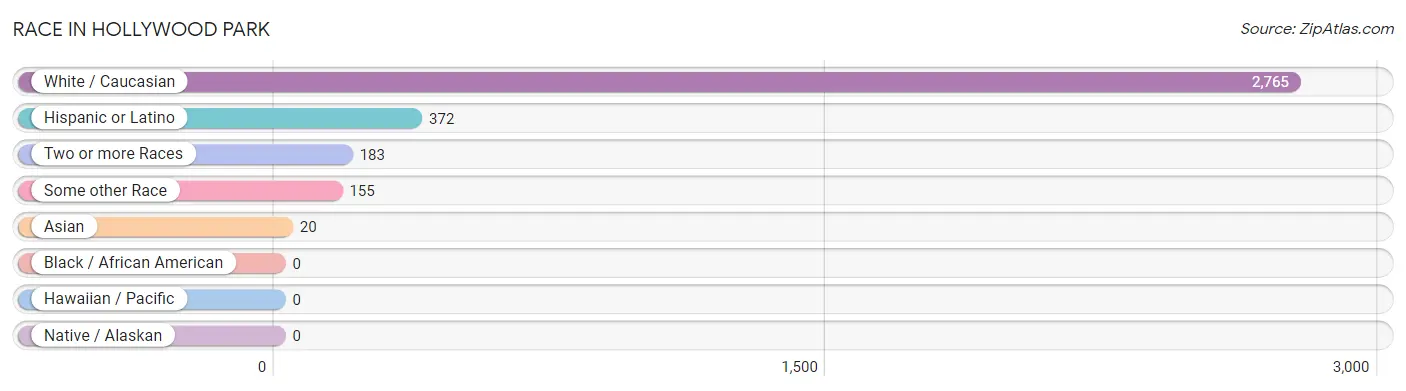
| Race | # Population | % Population |
| Asian | 20 | 0.6% |
| Black / African American | 0 | 0.0% |
| Hawaiian / Pacific | 0 | 0.0% |
| Hispanic or Latino | 372 | 11.9% |
| Native / Alaskan | 0 | 0.0% |
| White / Caucasian | 2,765 | 88.5% |
| Two or more Races | 183 | 5.9% |
| Some other Race | 155 | 5.0% |
| Total | 3,123 | 100.0% |
Ancestry in Hollywood Park
The most populous ancestries reported in Hollywood Park are German (677 | 21.7%), English (592 | 19.0%), Irish (378 | 12.1%), Mexican (321 | 10.3%), and American (215 | 6.9%), together accounting for 69.9% of all Hollywood Park residents.
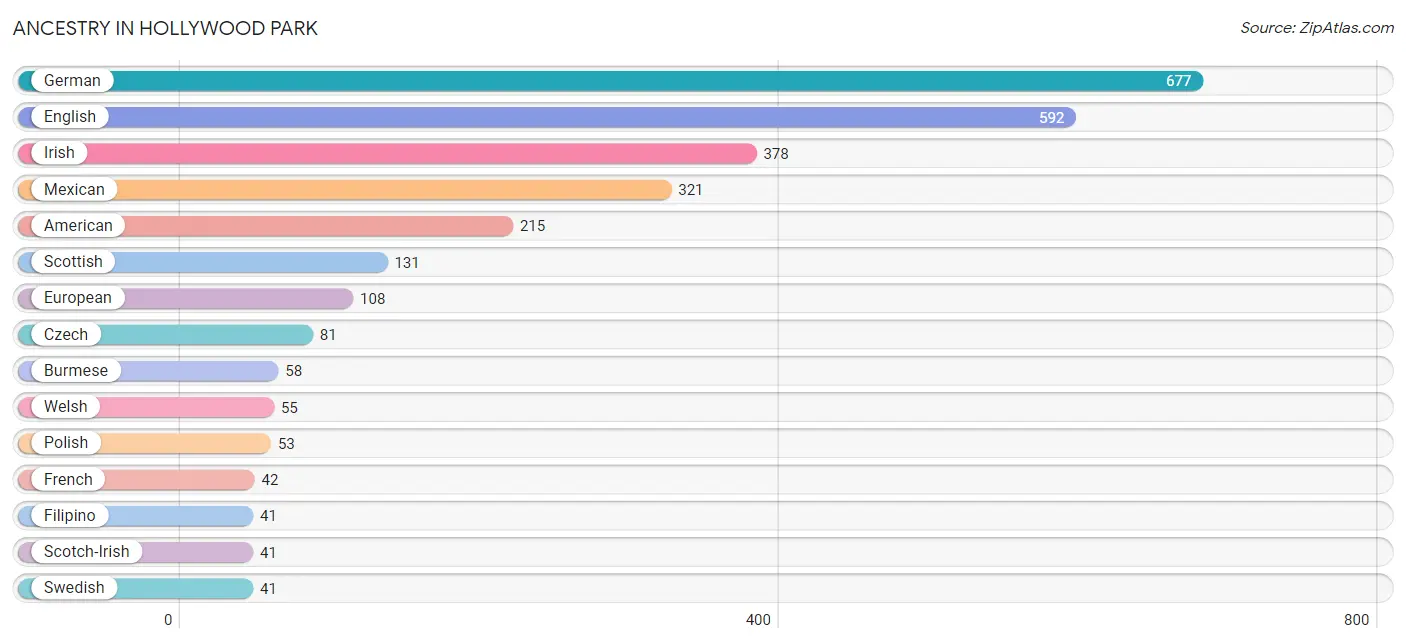
| Ancestry | # Population | % Population |
| American | 215 | 6.9% |
| Argentinean | 10 | 0.3% |
| Australian | 14 | 0.4% |
| Belgian | 12 | 0.4% |
| Bhutanese | 22 | 0.7% |
| Burmese | 58 | 1.9% |
| Czech | 81 | 2.6% |
| Czechoslovakian | 14 | 0.4% |
| English | 592 | 19.0% |
| European | 108 | 3.5% |
| Filipino | 41 | 1.3% |
| French | 42 | 1.3% |
| German | 677 | 21.7% |
| Greek | 35 | 1.1% |
| Indian (Asian) | 12 | 0.4% |
| Irish | 378 | 12.1% |
| Italian | 25 | 0.8% |
| Korean | 22 | 0.7% |
| Mexican | 321 | 10.3% |
| Mexican American Indian | 36 | 1.1% |
| Northern European | 9 | 0.3% |
| Norwegian | 10 | 0.3% |
| Polish | 53 | 1.7% |
| Portuguese | 13 | 0.4% |
| Puerto Rican | 17 | 0.5% |
| Scandinavian | 33 | 1.1% |
| Scotch-Irish | 41 | 1.3% |
| Scottish | 131 | 4.2% |
| South American | 10 | 0.3% |
| Sri Lankan | 18 | 0.6% |
| Swedish | 41 | 1.3% |
| Swiss | 15 | 0.5% |
| Ukrainian | 5 | 0.2% |
| Welsh | 55 | 1.8% | View All 34 Rows |
Immigrants in Hollywood Park
The most numerous immigrant groups reported in Hollywood Park came from Latin America (54 | 1.7%), Central America (44 | 1.4%), Mexico (44 | 1.4%), Asia (20 | 0.6%), and South Eastern Asia (20 | 0.6%), together accounting for 5.8% of all Hollywood Park residents.
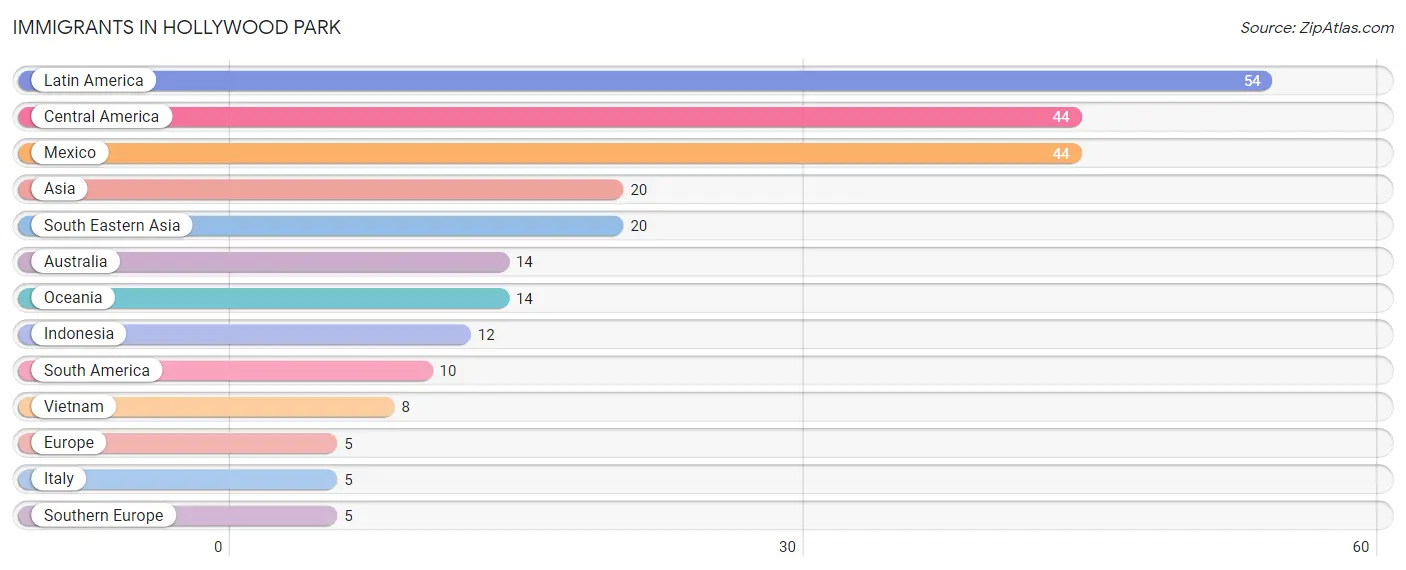
| Immigration Origin | # Population | % Population |
| Asia | 20 | 0.6% |
| Australia | 14 | 0.4% |
| Central America | 44 | 1.4% |
| Europe | 5 | 0.2% |
| Indonesia | 12 | 0.4% |
| Italy | 5 | 0.2% |
| Latin America | 54 | 1.7% |
| Mexico | 44 | 1.4% |
| Oceania | 14 | 0.4% |
| South America | 10 | 0.3% |
| South Eastern Asia | 20 | 0.6% |
| Southern Europe | 5 | 0.2% |
| Vietnam | 8 | 0.3% | View All 13 Rows |
Sex and Age in Hollywood Park
Sex and Age in Hollywood Park
The most populous age groups in Hollywood Park are 15 to 19 Years (125 | 8.7%) for men and Under 5 Years (164 | 9.7%) for women.
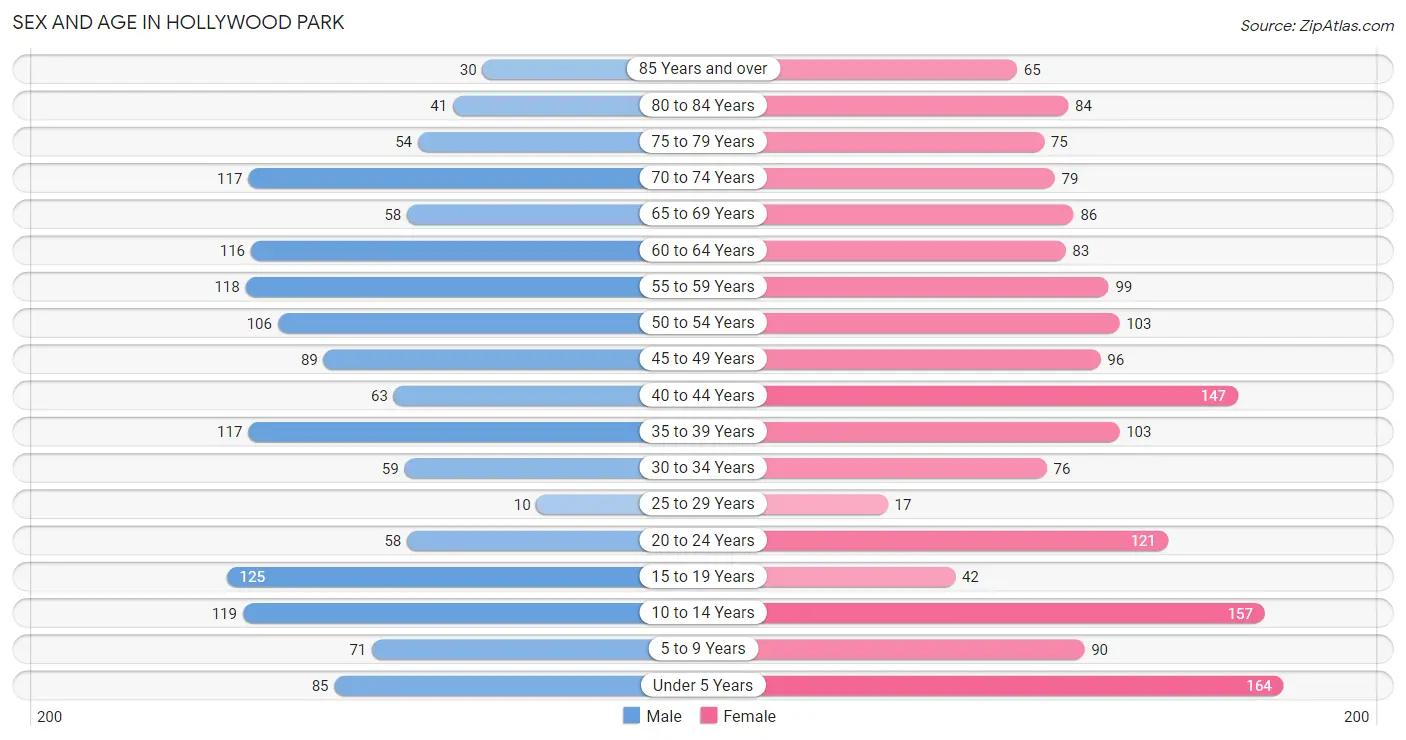
| Age Bracket | Male | Female |
| Under 5 Years | 85 (5.9%) | 164 (9.7%) |
| 5 to 9 Years | 71 (4.9%) | 90 (5.3%) |
| 10 to 14 Years | 119 (8.3%) | 157 (9.3%) |
| 15 to 19 Years | 125 (8.7%) | 42 (2.5%) |
| 20 to 24 Years | 58 (4.0%) | 121 (7.2%) |
| 25 to 29 Years | 10 (0.7%) | 17 (1.0%) |
| 30 to 34 Years | 59 (4.1%) | 76 (4.5%) |
| 35 to 39 Years | 117 (8.2%) | 103 (6.1%) |
| 40 to 44 Years | 63 (4.4%) | 147 (8.7%) |
| 45 to 49 Years | 89 (6.2%) | 96 (5.7%) |
| 50 to 54 Years | 106 (7.4%) | 103 (6.1%) |
| 55 to 59 Years | 118 (8.2%) | 99 (5.9%) |
| 60 to 64 Years | 116 (8.1%) | 83 (4.9%) |
| 65 to 69 Years | 58 (4.0%) | 86 (5.1%) |
| 70 to 74 Years | 117 (8.2%) | 79 (4.7%) |
| 75 to 79 Years | 54 (3.8%) | 75 (4.4%) |
| 80 to 84 Years | 41 (2.9%) | 84 (5.0%) |
| 85 Years and over | 30 (2.1%) | 65 (3.8%) |
| Total | 1,436 (100.0%) | 1,687 (100.0%) |
Families and Households in Hollywood Park
Median Family Size in Hollywood Park
The median family size in Hollywood Park is 3.25 persons per family, with married-couple families (850 | 95.7%) accounting for the largest median family size of 3.27 persons per family. On the other hand, single male/father families (16 | 1.8%) represent the smallest median family size with 2.69 persons per family.
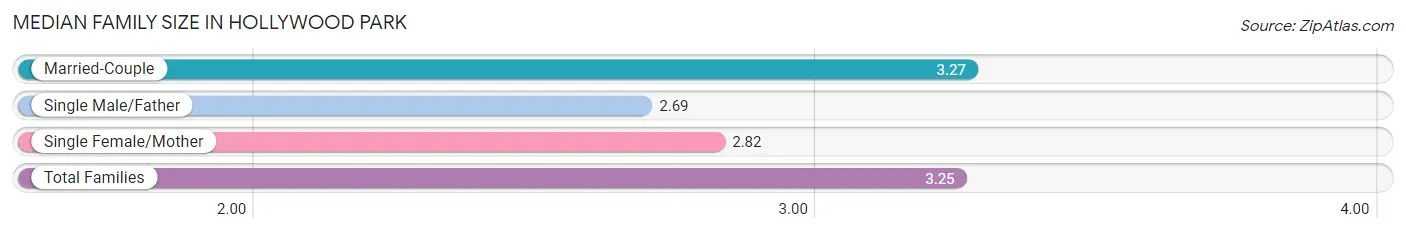
| Family Type | # Families | Family Size |
| Married-Couple | 850 (95.7%) | 3.27 |
| Single Male/Father | 16 (1.8%) | 2.69 |
| Single Female/Mother | 22 (2.5%) | 2.82 |
| Total Families | 888 (100.0%) | 3.25 |
Median Household Size in Hollywood Park
The median household size in Hollywood Park is 2.82 persons per household, with married-couple households (850 | 76.6%) accounting for the largest median household size of 3.27 persons per household. non-family households (221 | 19.9%) represent the smallest median household size with 1.08 persons per household.
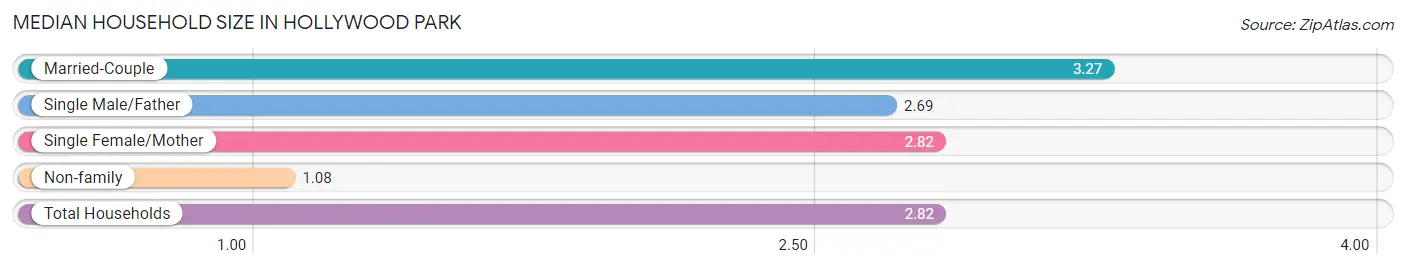
| Household Type | # Households | Household Size |
| Married-Couple | 850 (76.6%) | 3.27 |
| Single Male/Father | 16 (1.4%) | 2.69 |
| Single Female/Mother | 22 (2.0%) | 2.82 |
| Non-family | 221 (19.9%) | 1.08 |
| Total Households | 1,109 (100.0%) | 2.82 |
Household Size by Marriage Status in Hollywood Park
Out of a total of 1,109 households in Hollywood Park, 888 (80.1%) are family households, while 221 (19.9%) are nonfamily households. The most numerous type of family households are 2-person households, comprising 385, and the most common type of nonfamily households are 1-person households, comprising 202.
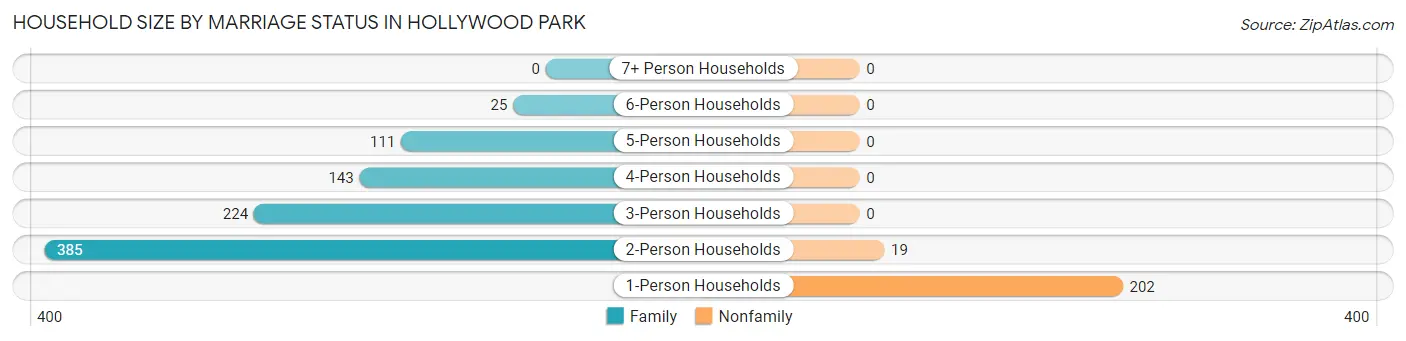
| Household Size | Family Households | Nonfamily Households |
| 1-Person Households | - | 202 (18.2%) |
| 2-Person Households | 385 (34.7%) | 19 (1.7%) |
| 3-Person Households | 224 (20.2%) | 0 (0.0%) |
| 4-Person Households | 143 (12.9%) | 0 (0.0%) |
| 5-Person Households | 111 (10.0%) | 0 (0.0%) |
| 6-Person Households | 25 (2.2%) | 0 (0.0%) |
| 7+ Person Households | 0 (0.0%) | 0 (0.0%) |
| Total | 888 (80.1%) | 221 (19.9%) |
Female Fertility in Hollywood Park
Fertility by Age in Hollywood Park
Average fertility rate in Hollywood Park is 124.0 births per 1,000 women. Women in the age bracket of 20 to 34 years have the highest fertility rate with 215.0 births per 1,000 women. Women in the age bracket of 20 to 34 years acount for 60.5% of all women with births.
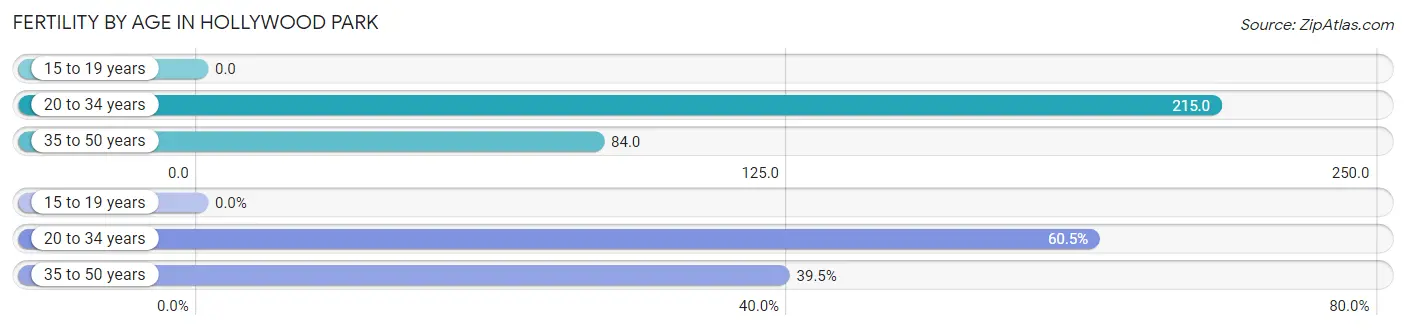
| Age Bracket | Women with Births | Births / 1,000 Women |
| 15 to 19 years | 0 (0.0%) | 0.0 |
| 20 to 34 years | 46 (60.5%) | 215.0 |
| 35 to 50 years | 30 (39.5%) | 84.0 |
| Total | 76 (100.0%) | 124.0 |
Fertility by Age by Marriage Status in Hollywood Park
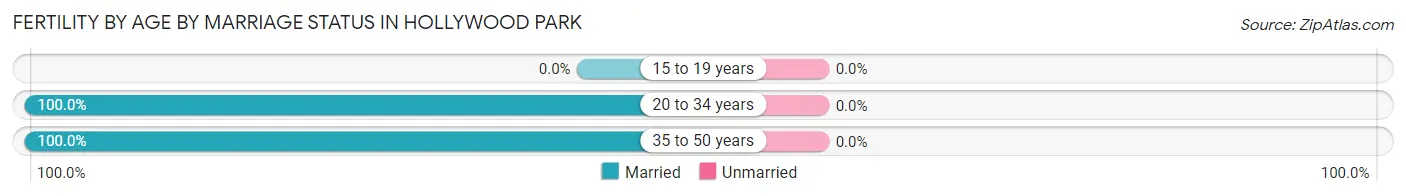
| Age Bracket | Married | Unmarried |
| 15 to 19 years | 0 (0.0%) | 0 (0.0%) |
| 20 to 34 years | 46 (100.0%) | 0 (0.0%) |
| 35 to 50 years | 30 (100.0%) | 0 (0.0%) |
| Total | 76 (100.0%) | 0 (0.0%) |
Fertility by Education in Hollywood Park
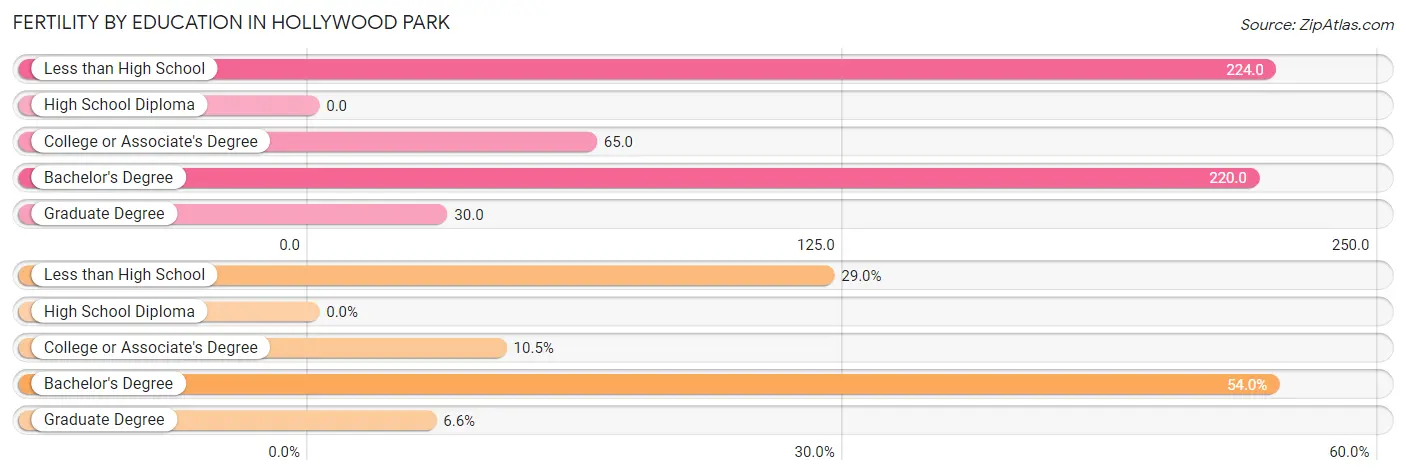
| Educational Attainment | Women with Births | Births / 1,000 Women |
| Less than High School | 22 (28.9%) | 224.0 |
| High School Diploma | 0 (0.0%) | 0.0 |
| College or Associate's Degree | 8 (10.5%) | 65.0 |
| Bachelor's Degree | 41 (53.9%) | 220.0 |
| Graduate Degree | 5 (6.6%) | 30.0 |
| Total | 76 (100.0%) | 124.0 |
Fertility by Education by Marriage Status in Hollywood Park
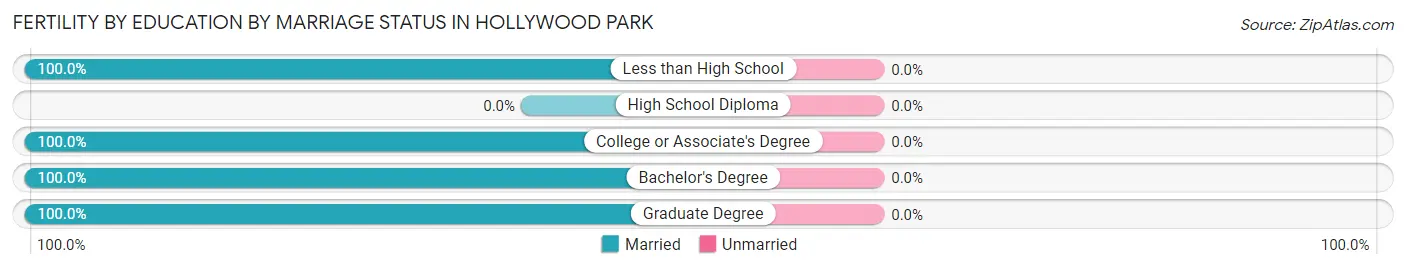
| Educational Attainment | Married | Unmarried |
| Less than High School | 22 (100.0%) | 0 (0.0%) |
| High School Diploma | 0 (0.0%) | 0 (0.0%) |
| College or Associate's Degree | 8 (100.0%) | 0 (0.0%) |
| Bachelor's Degree | 41 (100.0%) | 0 (0.0%) |
| Graduate Degree | 5 (100.0%) | 0 (0.0%) |
| Total | 76 (100.0%) | 0 (0.0%) |
Employment Characteristics in Hollywood Park
Employment by Class of Employer in Hollywood Park
Among the 1,421 employed individuals in Hollywood Park, private company employees (817 | 57.5%), self-employed (not incorporated) (252 | 17.7%), and not-for-profit organizations (118 | 8.3%) make up the most common classes of employment.
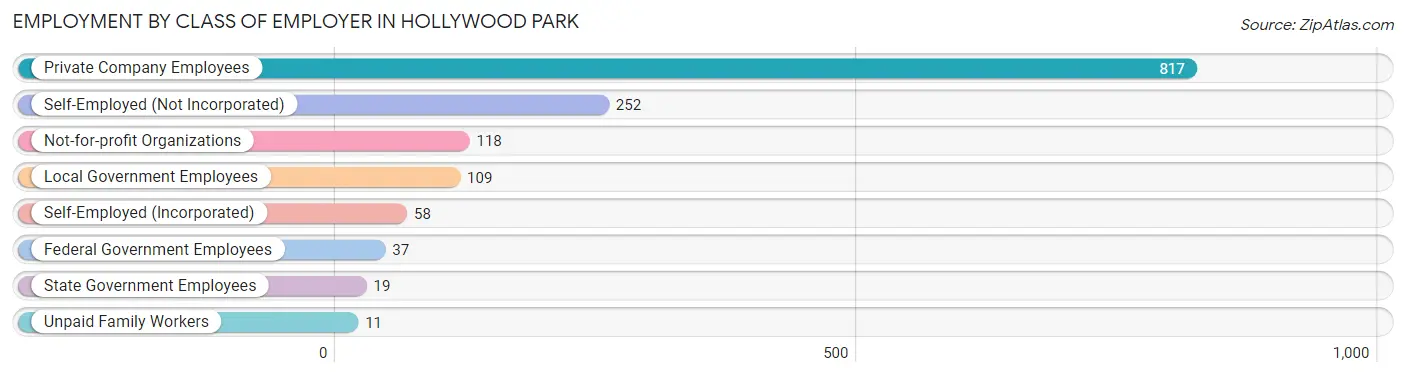
| Employer Class | # Employees | % Employees |
| Private Company Employees | 817 | 57.5% |
| Self-Employed (Incorporated) | 58 | 4.1% |
| Self-Employed (Not Incorporated) | 252 | 17.7% |
| Not-for-profit Organizations | 118 | 8.3% |
| Local Government Employees | 109 | 7.7% |
| State Government Employees | 19 | 1.3% |
| Federal Government Employees | 37 | 2.6% |
| Unpaid Family Workers | 11 | 0.8% |
| Total | 1,421 | 100.0% |
Employment Status by Age in Hollywood Park
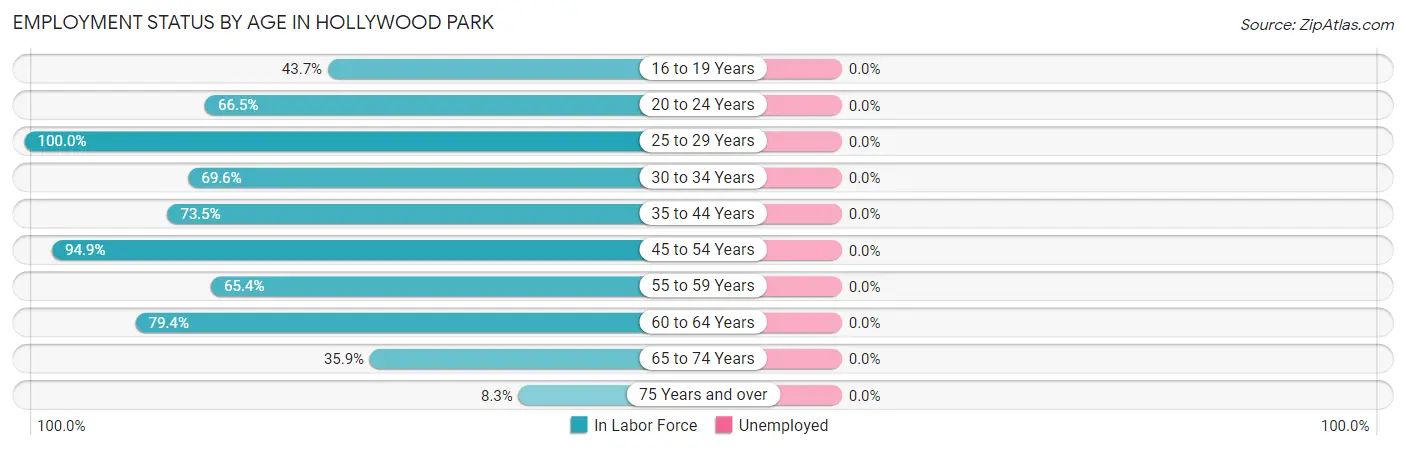
| Age Bracket | In Labor Force | Unemployed |
| 16 to 19 Years | 45 (43.7%) | 0 (0.0%) |
| 20 to 24 Years | 119 (66.5%) | 0 (0.0%) |
| 25 to 29 Years | 27 (100.0%) | 0 (0.0%) |
| 30 to 34 Years | 94 (69.6%) | 0 (0.0%) |
| 35 to 44 Years | 316 (73.5%) | 0 (0.0%) |
| 45 to 54 Years | 374 (94.9%) | 0 (0.0%) |
| 55 to 59 Years | 142 (65.4%) | 0 (0.0%) |
| 60 to 64 Years | 158 (79.4%) | 0 (0.0%) |
| 65 to 74 Years | 122 (35.9%) | 0 (0.0%) |
| 75 Years and over | 29 (8.3%) | 0 (0.0%) |
| Total | 1,426 (60.1%) | 0 (0.0%) |
Employment Status by Educational Attainment in Hollywood Park
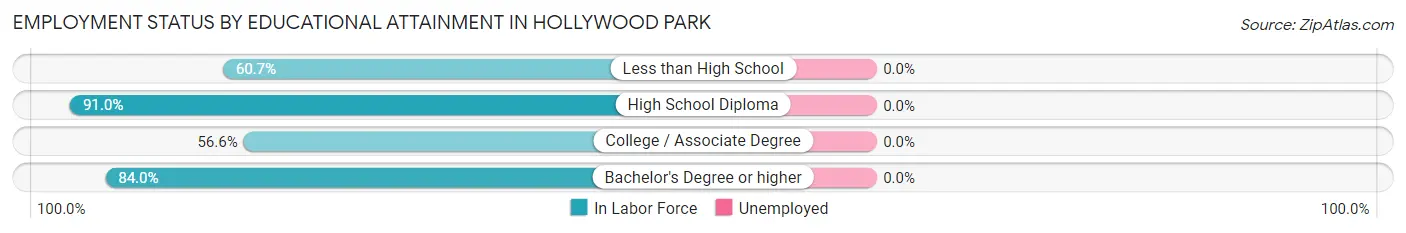
| Educational Attainment | In Labor Force | Unemployed |
| Less than High School | 34 (60.7%) | 0 (0.0%) |
| High School Diploma | 111 (91.0%) | 0 (0.0%) |
| College / Associate Degree | 128 (56.6%) | 0 (0.0%) |
| Bachelor's Degree or higher | 838 (84.0%) | 0 (0.0%) |
| Total | 1,110 (79.2%) | 0 (0.0%) |
Employment Occupations by Sex in Hollywood Park
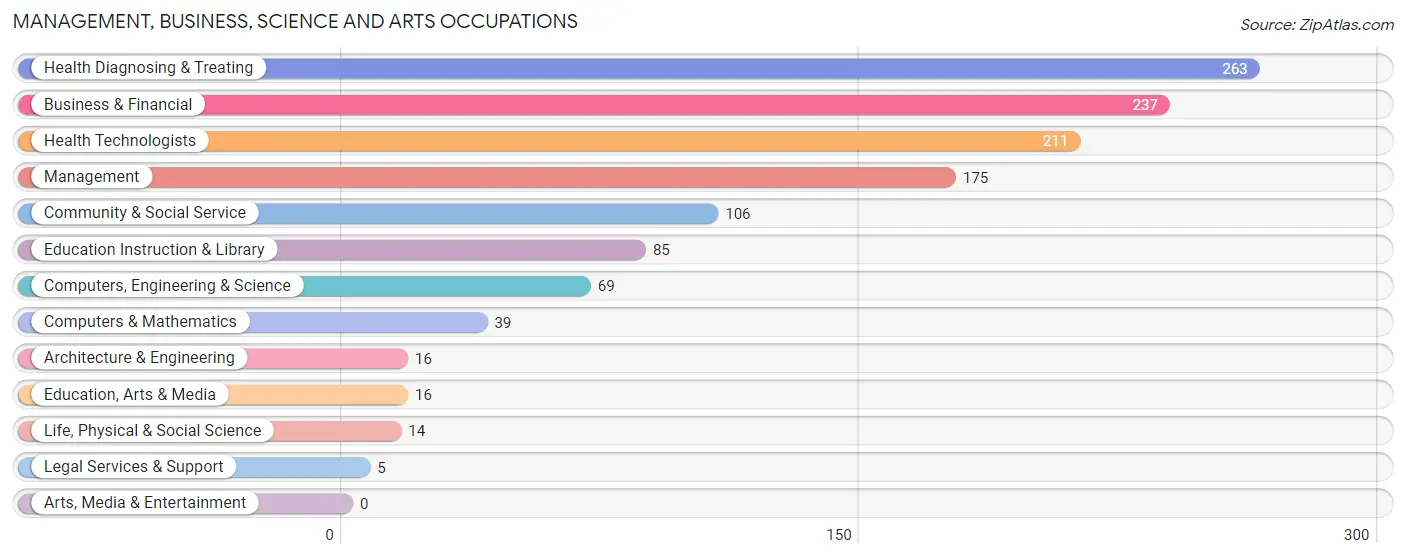
Management, Business, Science and Arts Occupations
The most common Management, Business, Science and Arts occupations in Hollywood Park are Health Diagnosing & Treating (263 | 18.7%), Business & Financial (237 | 16.8%), Health Technologists (211 | 15.0%), Management (175 | 12.4%), and Community & Social Service (106 | 7.5%).
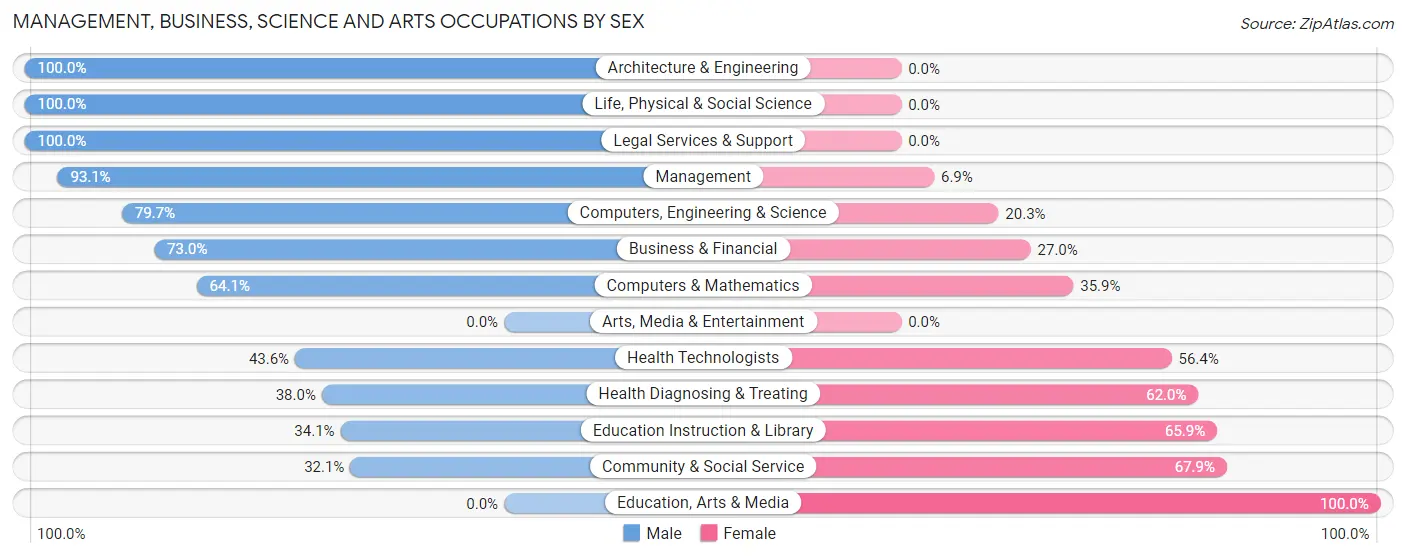
Management, Business, Science and Arts Occupations by Sex
Within the Management, Business, Science and Arts occupations in Hollywood Park, the most male-oriented occupations are Architecture & Engineering (100.0%), Life, Physical & Social Science (100.0%), and Legal Services & Support (100.0%), while the most female-oriented occupations are Education, Arts & Media (100.0%), Community & Social Service (67.9%), and Education Instruction & Library (65.9%).
| Occupation | Male | Female |
| Management | 163 (93.1%) | 12 (6.9%) |
| Business & Financial | 173 (73.0%) | 64 (27.0%) |
| Computers, Engineering & Science | 55 (79.7%) | 14 (20.3%) |
| Computers & Mathematics | 25 (64.1%) | 14 (35.9%) |
| Architecture & Engineering | 16 (100.0%) | 0 (0.0%) |
| Life, Physical & Social Science | 14 (100.0%) | 0 (0.0%) |
| Community & Social Service | 34 (32.1%) | 72 (67.9%) |
| Education, Arts & Media | 0 (0.0%) | 16 (100.0%) |
| Legal Services & Support | 5 (100.0%) | 0 (0.0%) |
| Education Instruction & Library | 29 (34.1%) | 56 (65.9%) |
| Arts, Media & Entertainment | 0 (0.0%) | 0 (0.0%) |
| Health Diagnosing & Treating | 100 (38.0%) | 163 (62.0%) |
| Health Technologists | 92 (43.6%) | 119 (56.4%) |
| Total (Category) | 525 (61.8%) | 325 (38.2%) |
| Total (Overall) | 799 (56.8%) | 609 (43.2%) |
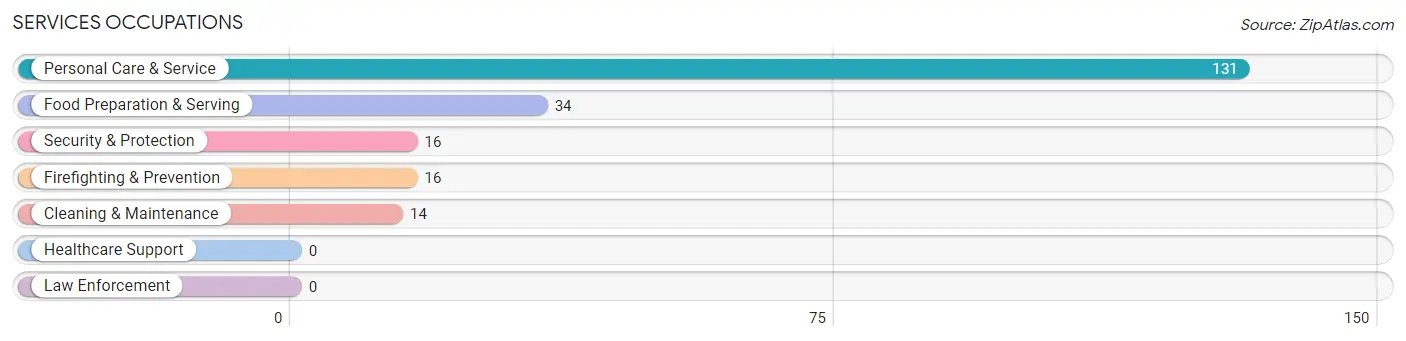
Services Occupations
The most common Services occupations in Hollywood Park are Personal Care & Service (131 | 9.3%), Food Preparation & Serving (34 | 2.4%), Security & Protection (16 | 1.1%), Firefighting & Prevention (16 | 1.1%), and Cleaning & Maintenance (14 | 1.0%).
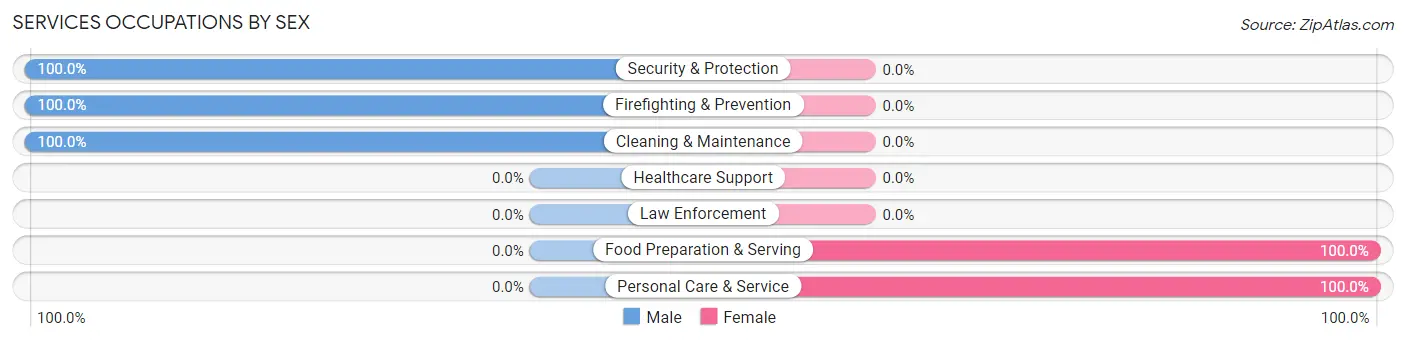
Services Occupations by Sex
Within the Services occupations in Hollywood Park, the most male-oriented occupations are Security & Protection (100.0%), Firefighting & Prevention (100.0%), and Cleaning & Maintenance (100.0%), while the most female-oriented occupations are Food Preparation & Serving (100.0%), and Personal Care & Service (100.0%).
| Occupation | Male | Female |
| Healthcare Support | 0 (0.0%) | 0 (0.0%) |
| Security & Protection | 16 (100.0%) | 0 (0.0%) |
| Firefighting & Prevention | 16 (100.0%) | 0 (0.0%) |
| Law Enforcement | 0 (0.0%) | 0 (0.0%) |
| Food Preparation & Serving | 0 (0.0%) | 34 (100.0%) |
| Cleaning & Maintenance | 14 (100.0%) | 0 (0.0%) |
| Personal Care & Service | 0 (0.0%) | 131 (100.0%) |
| Total (Category) | 30 (15.4%) | 165 (84.6%) |
| Total (Overall) | 799 (56.8%) | 609 (43.2%) |
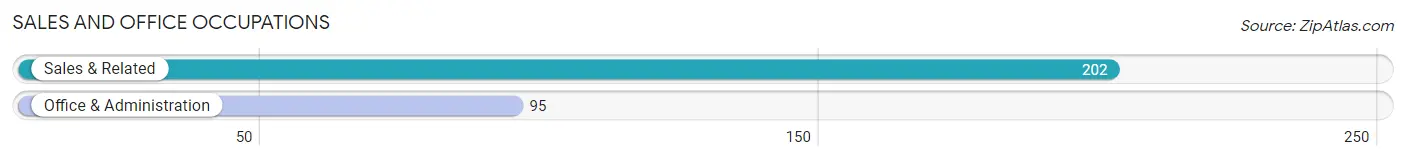
Sales and Office Occupations
The most common Sales and Office occupations in Hollywood Park are Sales & Related (202 | 14.3%), and Office & Administration (95 | 6.8%).
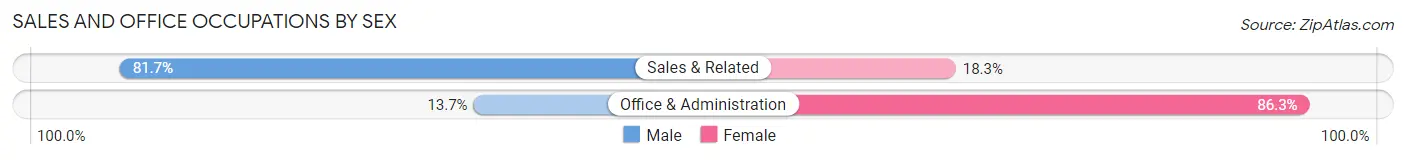
Sales and Office Occupations by Sex
| Occupation | Male | Female |
| Sales & Related | 165 (81.7%) | 37 (18.3%) |
| Office & Administration | 13 (13.7%) | 82 (86.3%) |
| Total (Category) | 178 (59.9%) | 119 (40.1%) |
| Total (Overall) | 799 (56.8%) | 609 (43.2%) |
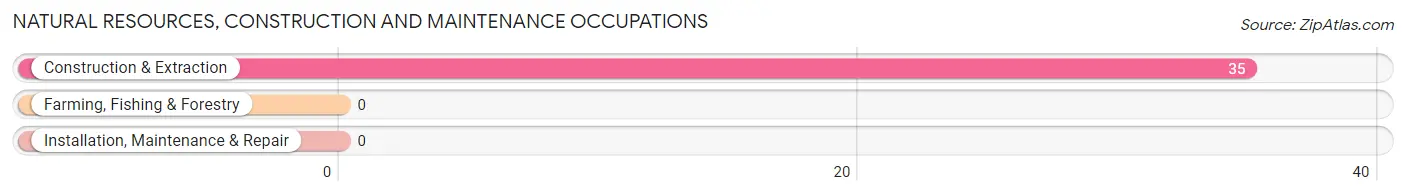
Natural Resources, Construction and Maintenance Occupations
The most common Natural Resources, Construction and Maintenance occupations in Hollywood Park are , and Construction & Extraction (35 | 2.5%).
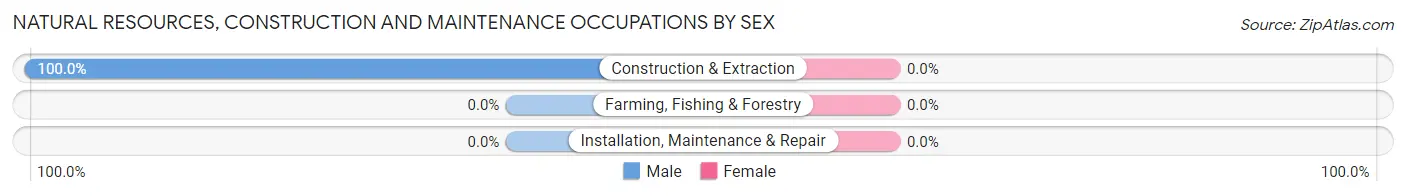
Natural Resources, Construction and Maintenance Occupations by Sex
| Occupation | Male | Female |
| Farming, Fishing & Forestry | 0 (0.0%) | 0 (0.0%) |
| Construction & Extraction | 35 (100.0%) | 0 (0.0%) |
| Installation, Maintenance & Repair | 0 (0.0%) | 0 (0.0%) |
| Total (Category) | 35 (100.0%) | 0 (0.0%) |
| Total (Overall) | 799 (56.8%) | 609 (43.2%) |
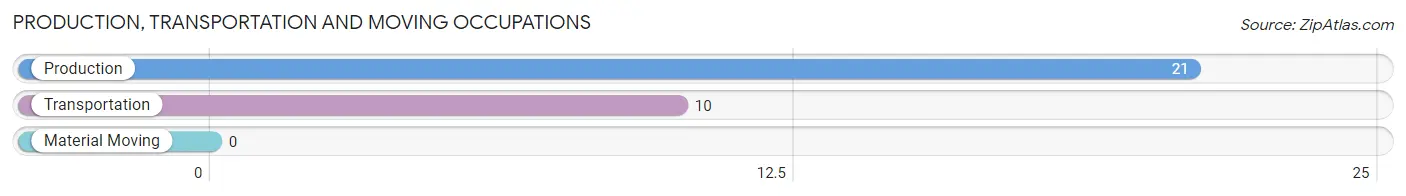
Production, Transportation and Moving Occupations
The most common Production, Transportation and Moving occupations in Hollywood Park are Production (21 | 1.5%), and Transportation (10 | 0.7%).
Production, Transportation and Moving Occupations by Sex
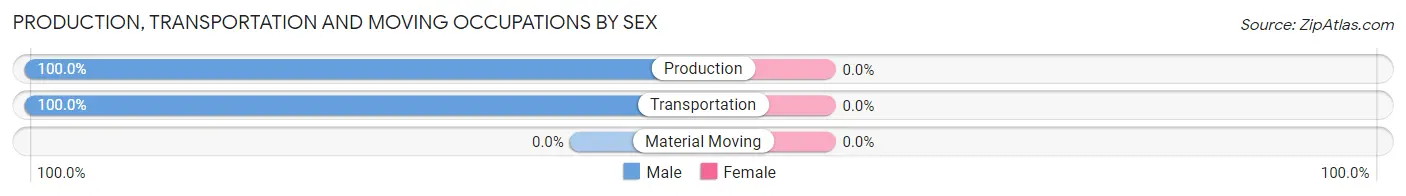
| Occupation | Male | Female |
| Production | 21 (100.0%) | 0 (0.0%) |
| Transportation | 10 (100.0%) | 0 (0.0%) |
| Material Moving | 0 (0.0%) | 0 (0.0%) |
| Total (Category) | 31 (100.0%) | 0 (0.0%) |
| Total (Overall) | 799 (56.8%) | 609 (43.2%) |
Employment Industries by Sex in Hollywood Park
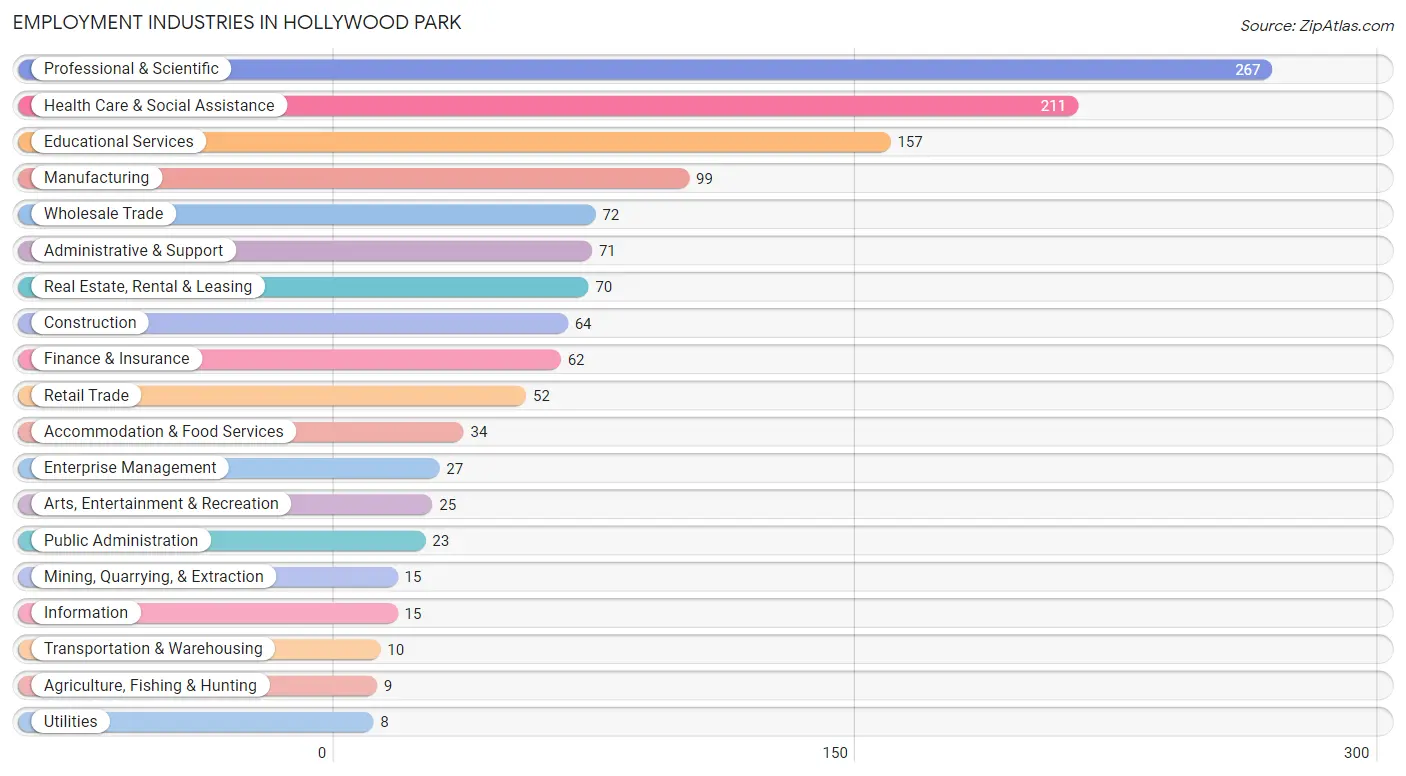
Employment Industries in Hollywood Park
The major employment industries in Hollywood Park include Professional & Scientific (267 | 19.0%), Health Care & Social Assistance (211 | 15.0%), Educational Services (157 | 11.2%), Manufacturing (99 | 7.0%), and Wholesale Trade (72 | 5.1%).
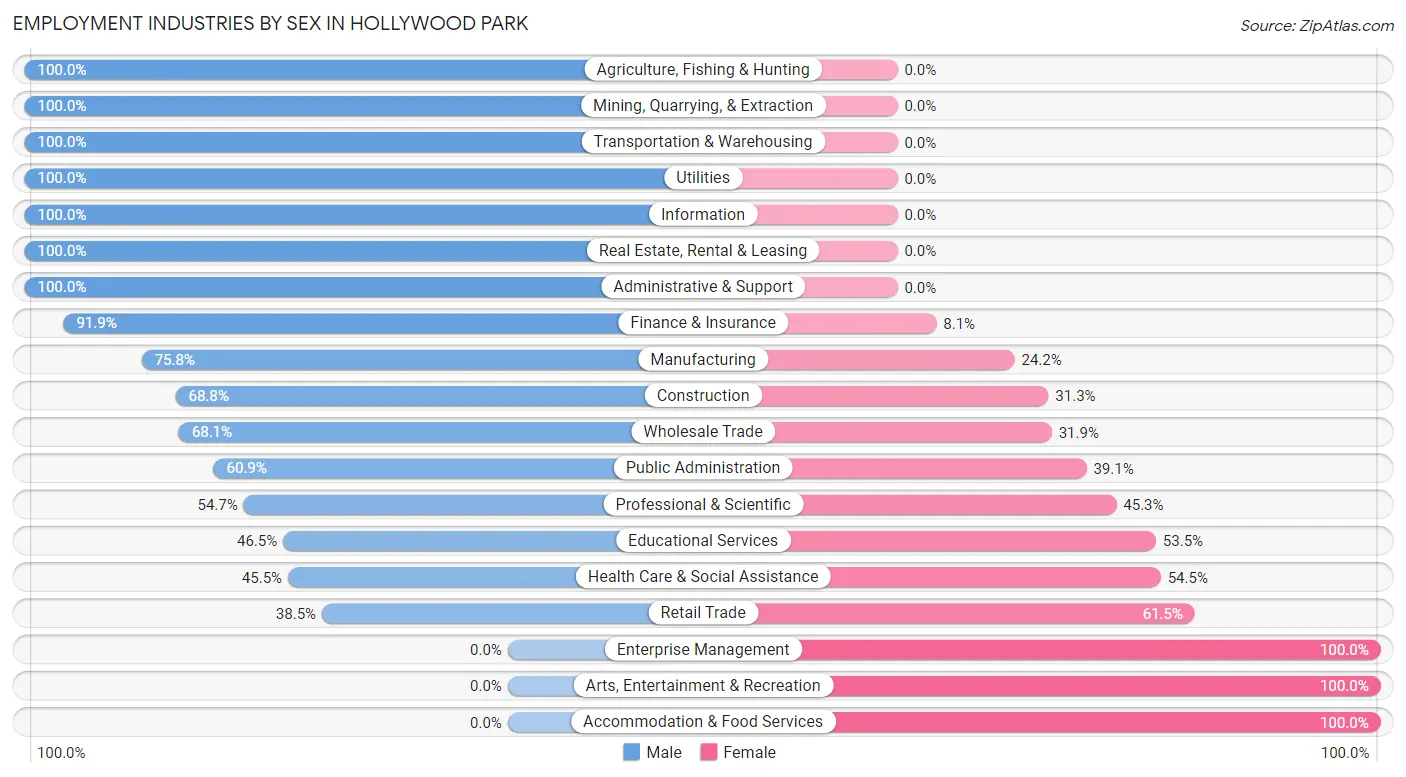
Employment Industries by Sex in Hollywood Park
The Hollywood Park industries that see more men than women are Agriculture, Fishing & Hunting (100.0%), Mining, Quarrying, & Extraction (100.0%), and Transportation & Warehousing (100.0%), whereas the industries that tend to have a higher number of women are Enterprise Management (100.0%), Arts, Entertainment & Recreation (100.0%), and Accommodation & Food Services (100.0%).
| Industry | Male | Female |
| Agriculture, Fishing & Hunting | 9 (100.0%) | 0 (0.0%) |
| Mining, Quarrying, & Extraction | 15 (100.0%) | 0 (0.0%) |
| Construction | 44 (68.8%) | 20 (31.2%) |
| Manufacturing | 75 (75.8%) | 24 (24.2%) |
| Wholesale Trade | 49 (68.1%) | 23 (31.9%) |
| Retail Trade | 20 (38.5%) | 32 (61.5%) |
| Transportation & Warehousing | 10 (100.0%) | 0 (0.0%) |
| Utilities | 8 (100.0%) | 0 (0.0%) |
| Information | 15 (100.0%) | 0 (0.0%) |
| Finance & Insurance | 57 (91.9%) | 5 (8.1%) |
| Real Estate, Rental & Leasing | 70 (100.0%) | 0 (0.0%) |
| Professional & Scientific | 146 (54.7%) | 121 (45.3%) |
| Enterprise Management | 0 (0.0%) | 27 (100.0%) |
| Administrative & Support | 71 (100.0%) | 0 (0.0%) |
| Educational Services | 73 (46.5%) | 84 (53.5%) |
| Health Care & Social Assistance | 96 (45.5%) | 115 (54.5%) |
| Arts, Entertainment & Recreation | 0 (0.0%) | 25 (100.0%) |
| Accommodation & Food Services | 0 (0.0%) | 34 (100.0%) |
| Public Administration | 14 (60.9%) | 9 (39.1%) |
| Total | 799 (56.8%) | 609 (43.2%) |
Education in Hollywood Park
School Enrollment in Hollywood Park
The most common levels of schooling among the 832 students in Hollywood Park are middle school (212 | 25.5%), high school (134 | 16.1%), and elementary school (122 | 14.7%).
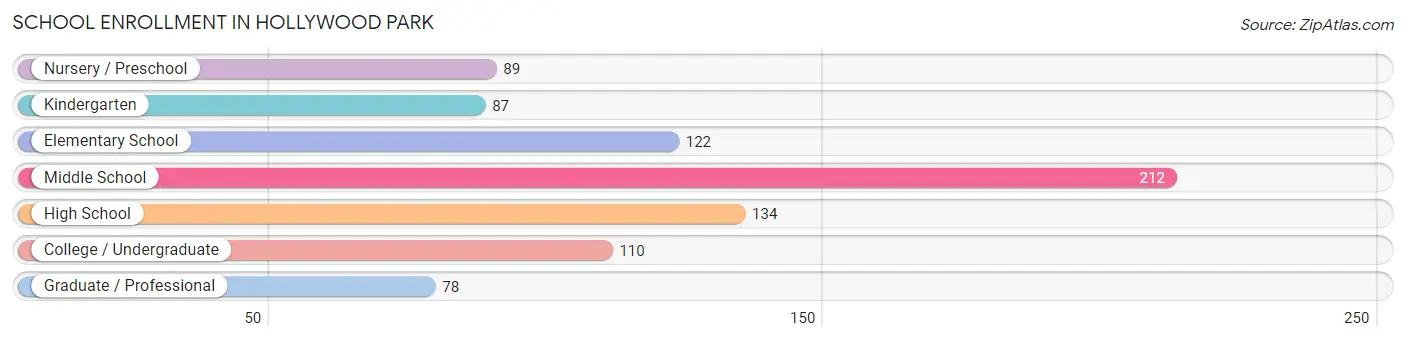
| School Level | # Students | % Students |
| Nursery / Preschool | 89 | 10.7% |
| Kindergarten | 87 | 10.5% |
| Elementary School | 122 | 14.7% |
| Middle School | 212 | 25.5% |
| High School | 134 | 16.1% |
| College / Undergraduate | 110 | 13.2% |
| Graduate / Professional | 78 | 9.4% |
| Total | 832 | 100.0% |
School Enrollment by Age by Funding Source in Hollywood Park
Out of a total of 832 students who are enrolled in schools in Hollywood Park, 325 (39.1%) attend a private institution, while the remaining 507 (60.9%) are enrolled in public schools. The age group of 3 to 4 year olds has the highest likelihood of being enrolled in private schools, with 89 (100.0% in the age bracket) enrolled. Conversely, the age group of 15 to 17 year olds has the lowest likelihood of being enrolled in a private school, with 98 (100.0% in the age bracket) attending a public institution.
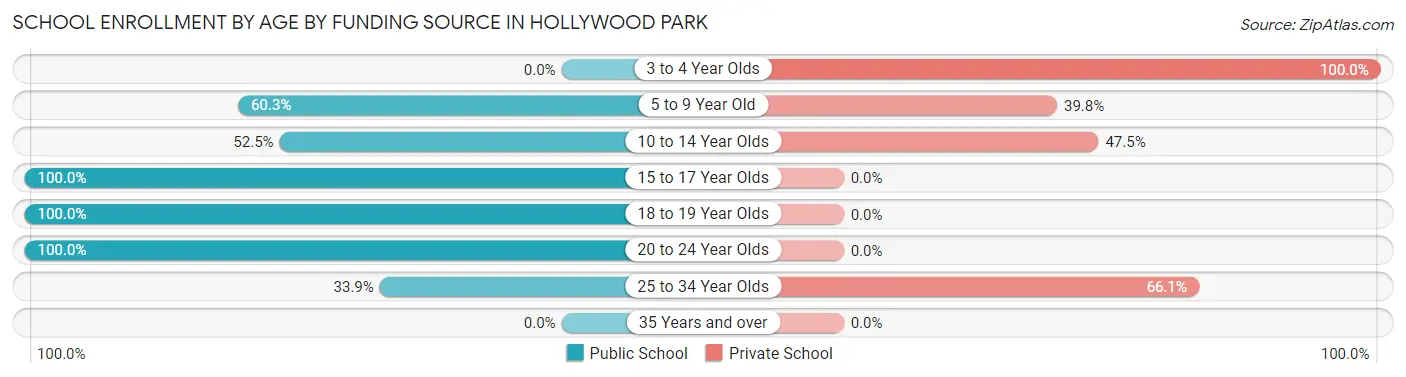
| Age Bracket | Public School | Private School |
| 3 to 4 Year Olds | 0 (0.0%) | 89 (100.0%) |
| 5 to 9 Year Old | 97 (60.3%) | 64 (39.8%) |
| 10 to 14 Year Olds | 145 (52.5%) | 131 (47.5%) |
| 15 to 17 Year Olds | 98 (100.0%) | 0 (0.0%) |
| 18 to 19 Year Olds | 40 (100.0%) | 0 (0.0%) |
| 20 to 24 Year Olds | 106 (100.0%) | 0 (0.0%) |
| 25 to 34 Year Olds | 21 (33.9%) | 41 (66.1%) |
| 35 Years and over | 0 (0.0%) | 0 (0.0%) |
| Total | 507 (60.9%) | 325 (39.1%) |
Educational Attainment by Field of Study in Hollywood Park
Business (333 | 24.3%), education (226 | 16.5%), bio, nature & agricultural (173 | 12.6%), social sciences (141 | 10.3%), and science & technology (109 | 8.0%) are the most common fields of study among 1,369 individuals in Hollywood Park who have obtained a bachelor's degree or higher.
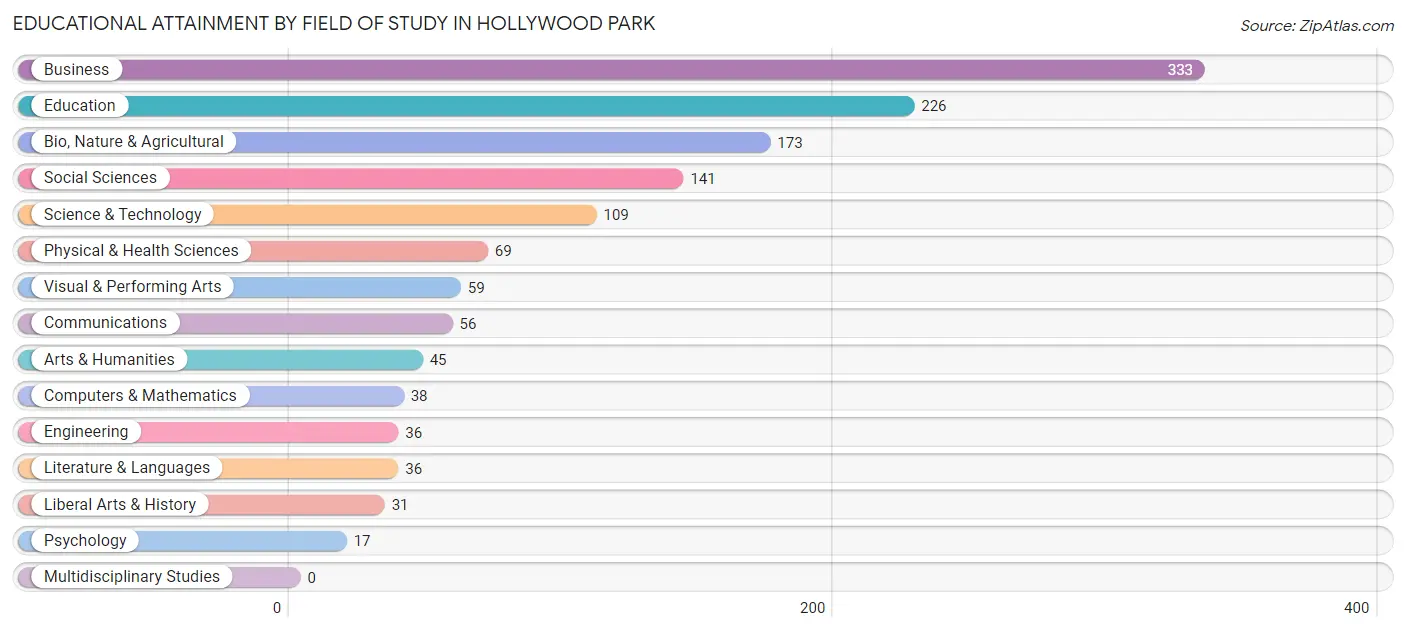
| Field of Study | # Graduates | % Graduates |
| Computers & Mathematics | 38 | 2.8% |
| Bio, Nature & Agricultural | 173 | 12.6% |
| Physical & Health Sciences | 69 | 5.0% |
| Psychology | 17 | 1.2% |
| Social Sciences | 141 | 10.3% |
| Engineering | 36 | 2.6% |
| Multidisciplinary Studies | 0 | 0.0% |
| Science & Technology | 109 | 8.0% |
| Business | 333 | 24.3% |
| Education | 226 | 16.5% |
| Literature & Languages | 36 | 2.6% |
| Liberal Arts & History | 31 | 2.3% |
| Visual & Performing Arts | 59 | 4.3% |
| Communications | 56 | 4.1% |
| Arts & Humanities | 45 | 3.3% |
| Total | 1,369 | 100.0% |
Transportation & Commute in Hollywood Park
Vehicle Availability by Sex in Hollywood Park
The most prevalent vehicle ownership categories in Hollywood Park are males with 2 vehicles (515, accounting for 63.8%) and females with 2 vehicles (366, making up 83.9%).
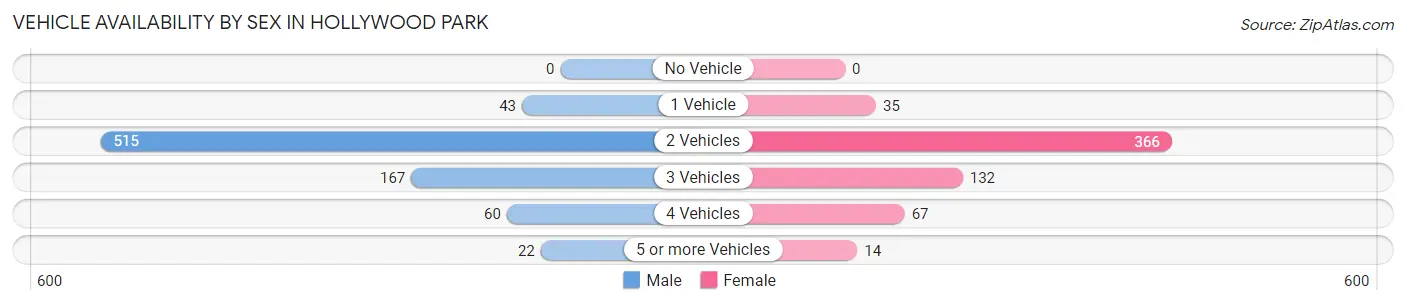
| Vehicles Available | Male | Female |
| No Vehicle | 0 (0.0%) | 0 (0.0%) |
| 1 Vehicle | 43 (5.3%) | 35 (5.7%) |
| 2 Vehicles | 515 (63.8%) | 366 (59.6%) |
| 3 Vehicles | 167 (20.7%) | 132 (21.5%) |
| 4 Vehicles | 60 (7.4%) | 67 (10.9%) |
| 5 or more Vehicles | 22 (2.7%) | 14 (2.3%) |
| Total | 807 (100.0%) | 614 (100.0%) |
Commute Time in Hollywood Park
The most frequently occuring commute durations in Hollywood Park are 20 to 24 minutes (261 commuters, 21.1%), 15 to 19 minutes (208 commuters, 16.8%), and 30 to 34 minutes (152 commuters, 12.3%).
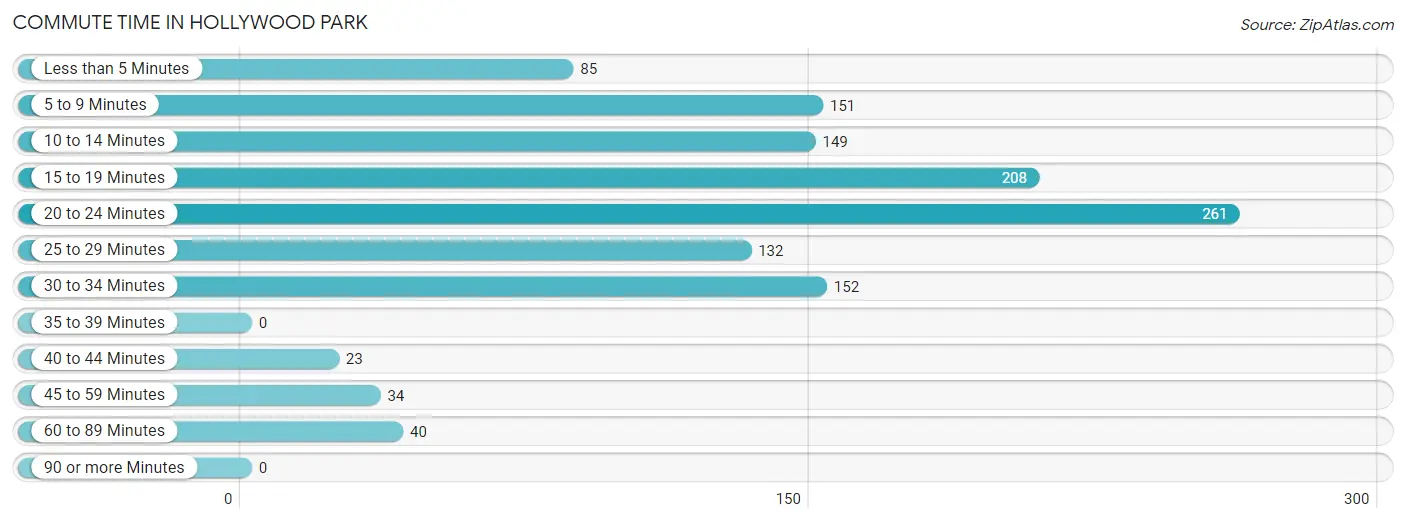
| Commute Time | # Commuters | % Commuters |
| Less than 5 Minutes | 85 | 6.9% |
| 5 to 9 Minutes | 151 | 12.2% |
| 10 to 14 Minutes | 149 | 12.1% |
| 15 to 19 Minutes | 208 | 16.8% |
| 20 to 24 Minutes | 261 | 21.1% |
| 25 to 29 Minutes | 132 | 10.7% |
| 30 to 34 Minutes | 152 | 12.3% |
| 35 to 39 Minutes | 0 | 0.0% |
| 40 to 44 Minutes | 23 | 1.9% |
| 45 to 59 Minutes | 34 | 2.8% |
| 60 to 89 Minutes | 40 | 3.2% |
| 90 or more Minutes | 0 | 0.0% |
Commute Time by Sex in Hollywood Park
The most common commute times in Hollywood Park are 20 to 24 minutes (177 commuters, 25.7%) for males and 15 to 19 minutes (119 commuters, 21.8%) for females.
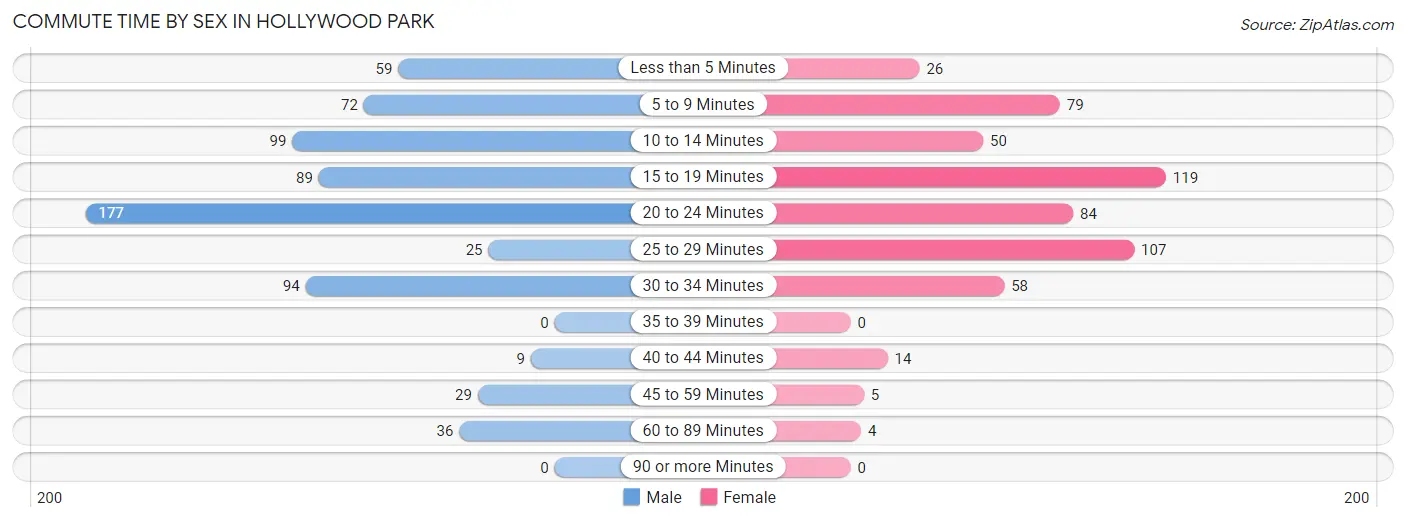
| Commute Time | Male | Female |
| Less than 5 Minutes | 59 (8.6%) | 26 (4.8%) |
| 5 to 9 Minutes | 72 (10.4%) | 79 (14.5%) |
| 10 to 14 Minutes | 99 (14.4%) | 50 (9.2%) |
| 15 to 19 Minutes | 89 (12.9%) | 119 (21.8%) |
| 20 to 24 Minutes | 177 (25.7%) | 84 (15.4%) |
| 25 to 29 Minutes | 25 (3.6%) | 107 (19.6%) |
| 30 to 34 Minutes | 94 (13.6%) | 58 (10.6%) |
| 35 to 39 Minutes | 0 (0.0%) | 0 (0.0%) |
| 40 to 44 Minutes | 9 (1.3%) | 14 (2.6%) |
| 45 to 59 Minutes | 29 (4.2%) | 5 (0.9%) |
| 60 to 89 Minutes | 36 (5.2%) | 4 (0.7%) |
| 90 or more Minutes | 0 (0.0%) | 0 (0.0%) |
Time of Departure to Work by Sex in Hollywood Park
The most frequent times of departure to work in Hollywood Park are 6:30 AM to 6:59 AM (179, 26.0%) for males and 6:30 AM to 6:59 AM (114, 20.9%) for females.
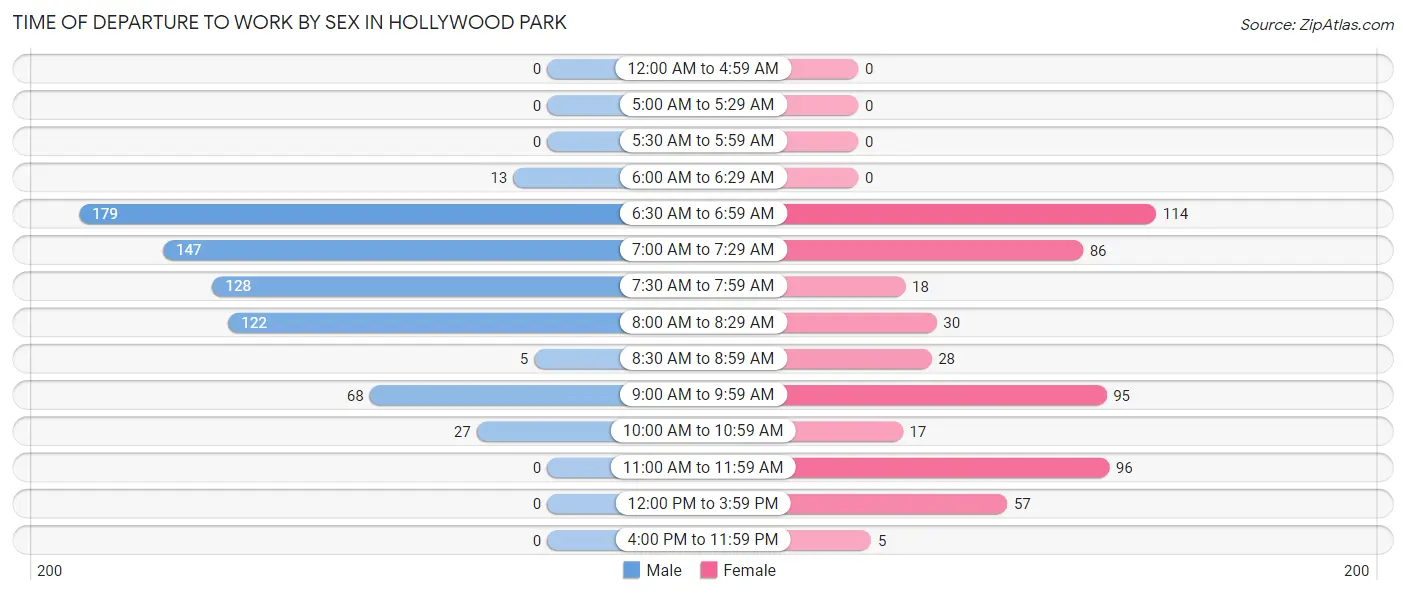
| Time of Departure | Male | Female |
| 12:00 AM to 4:59 AM | 0 (0.0%) | 0 (0.0%) |
| 5:00 AM to 5:29 AM | 0 (0.0%) | 0 (0.0%) |
| 5:30 AM to 5:59 AM | 0 (0.0%) | 0 (0.0%) |
| 6:00 AM to 6:29 AM | 13 (1.9%) | 0 (0.0%) |
| 6:30 AM to 6:59 AM | 179 (26.0%) | 114 (20.9%) |
| 7:00 AM to 7:29 AM | 147 (21.3%) | 86 (15.8%) |
| 7:30 AM to 7:59 AM | 128 (18.6%) | 18 (3.3%) |
| 8:00 AM to 8:29 AM | 122 (17.7%) | 30 (5.5%) |
| 8:30 AM to 8:59 AM | 5 (0.7%) | 28 (5.1%) |
| 9:00 AM to 9:59 AM | 68 (9.9%) | 95 (17.4%) |
| 10:00 AM to 10:59 AM | 27 (3.9%) | 17 (3.1%) |
| 11:00 AM to 11:59 AM | 0 (0.0%) | 96 (17.6%) |
| 12:00 PM to 3:59 PM | 0 (0.0%) | 57 (10.4%) |
| 4:00 PM to 11:59 PM | 0 (0.0%) | 5 (0.9%) |
| Total | 689 (100.0%) | 546 (100.0%) |
Housing Occupancy in Hollywood Park
Occupancy by Ownership in Hollywood Park
Of the total 1,109 dwellings in Hollywood Park, owner-occupied units account for 1,027 (92.6%), while renter-occupied units make up 82 (7.4%).
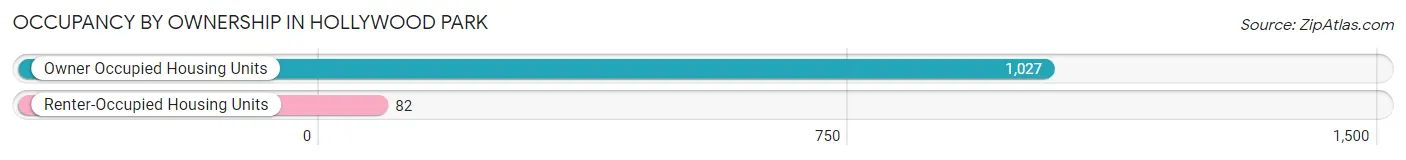
| Occupancy | # Housing Units | % Housing Units |
| Owner Occupied Housing Units | 1,027 | 92.6% |
| Renter-Occupied Housing Units | 82 | 7.4% |
| Total Occupied Housing Units | 1,109 | 100.0% |
Occupancy by Household Size in Hollywood Park
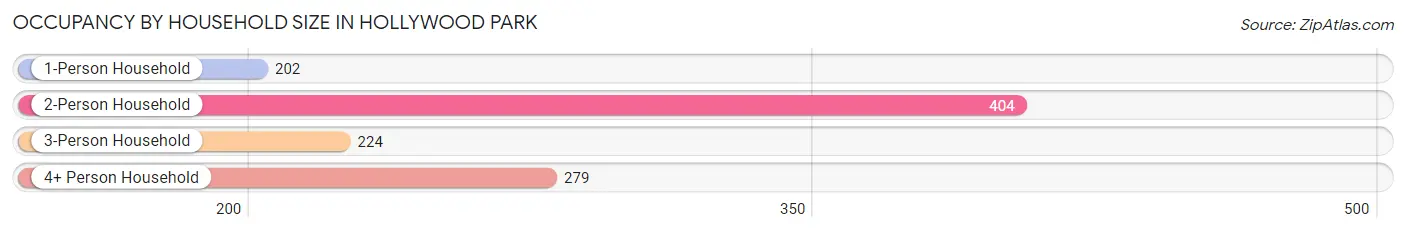
| Household Size | # Housing Units | % Housing Units |
| 1-Person Household | 202 | 18.2% |
| 2-Person Household | 404 | 36.4% |
| 3-Person Household | 224 | 20.2% |
| 4+ Person Household | 279 | 25.2% |
| Total Housing Units | 1,109 | 100.0% |
Occupancy by Ownership by Household Size in Hollywood Park
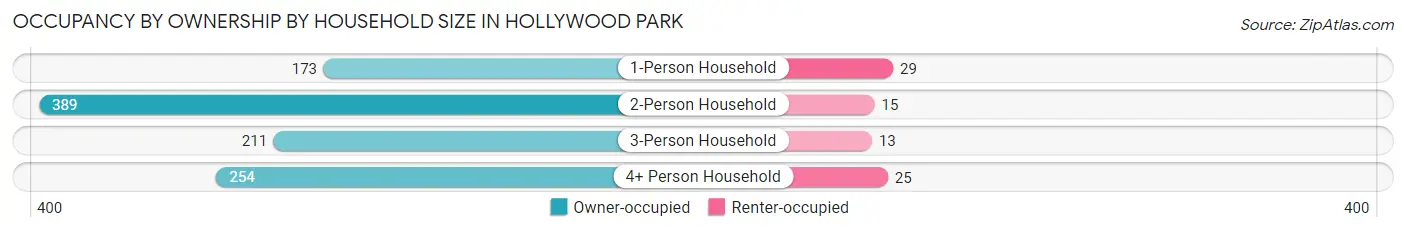
| Household Size | Owner-occupied | Renter-occupied |
| 1-Person Household | 173 (85.6%) | 29 (14.4%) |
| 2-Person Household | 389 (96.3%) | 15 (3.7%) |
| 3-Person Household | 211 (94.2%) | 13 (5.8%) |
| 4+ Person Household | 254 (91.0%) | 25 (9.0%) |
| Total Housing Units | 1,027 (92.6%) | 82 (7.4%) |
Occupancy by Educational Attainment in Hollywood Park
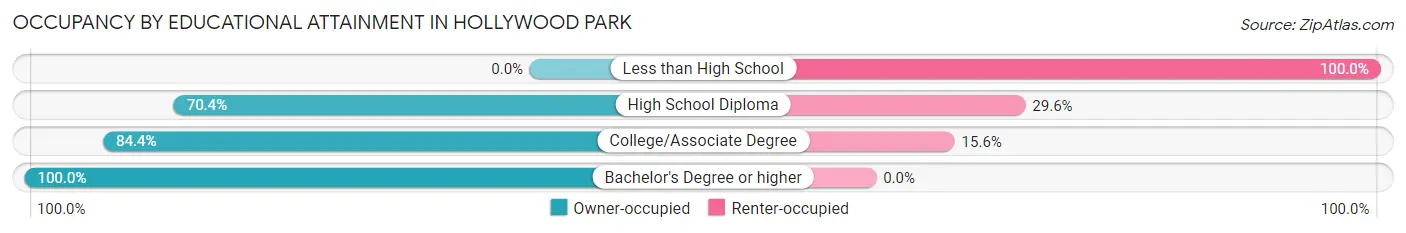
| Household Size | Owner-occupied | Renter-occupied |
| Less than High School | 0 (0.0%) | 25 (100.0%) |
| High School Diploma | 69 (70.4%) | 29 (29.6%) |
| College/Associate Degree | 152 (84.4%) | 28 (15.6%) |
| Bachelor's Degree or higher | 806 (100.0%) | 0 (0.0%) |
Occupancy by Age of Householder in Hollywood Park
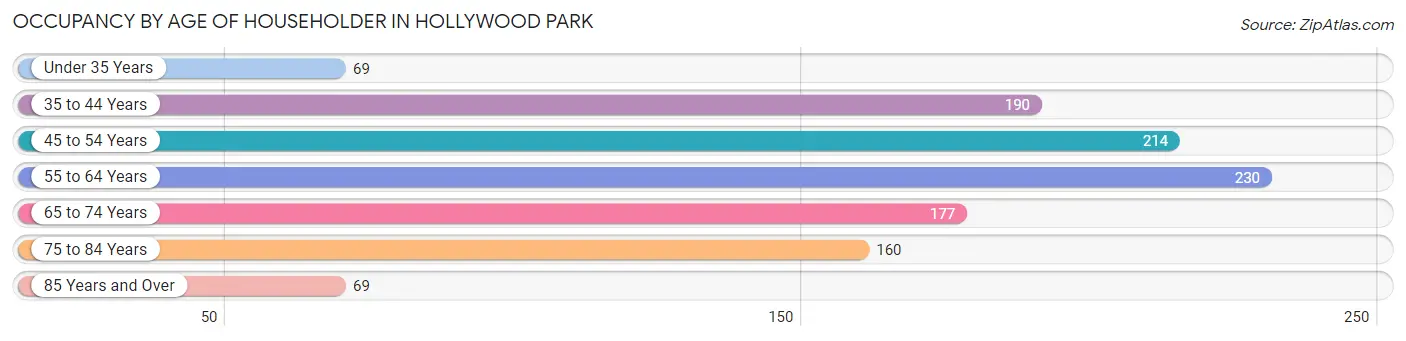
| Age Bracket | # Households | % Households |
| Under 35 Years | 69 | 6.2% |
| 35 to 44 Years | 190 | 17.1% |
| 45 to 54 Years | 214 | 19.3% |
| 55 to 64 Years | 230 | 20.7% |
| 65 to 74 Years | 177 | 16.0% |
| 75 to 84 Years | 160 | 14.4% |
| 85 Years and Over | 69 | 6.2% |
| Total | 1,109 | 100.0% |
Housing Finances in Hollywood Park
Median Income by Occupancy in Hollywood Park
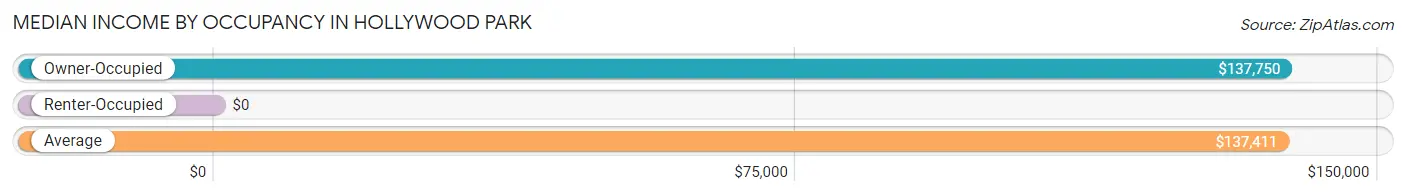
| Occupancy Type | # Households | Median Income |
| Owner-Occupied | 1,027 (92.6%) | $137,750 |
| Renter-Occupied | 82 (7.4%) | $0 |
| Average | 1,109 (100.0%) | $137,411 |
Occupancy by Householder Income Bracket in Hollywood Park
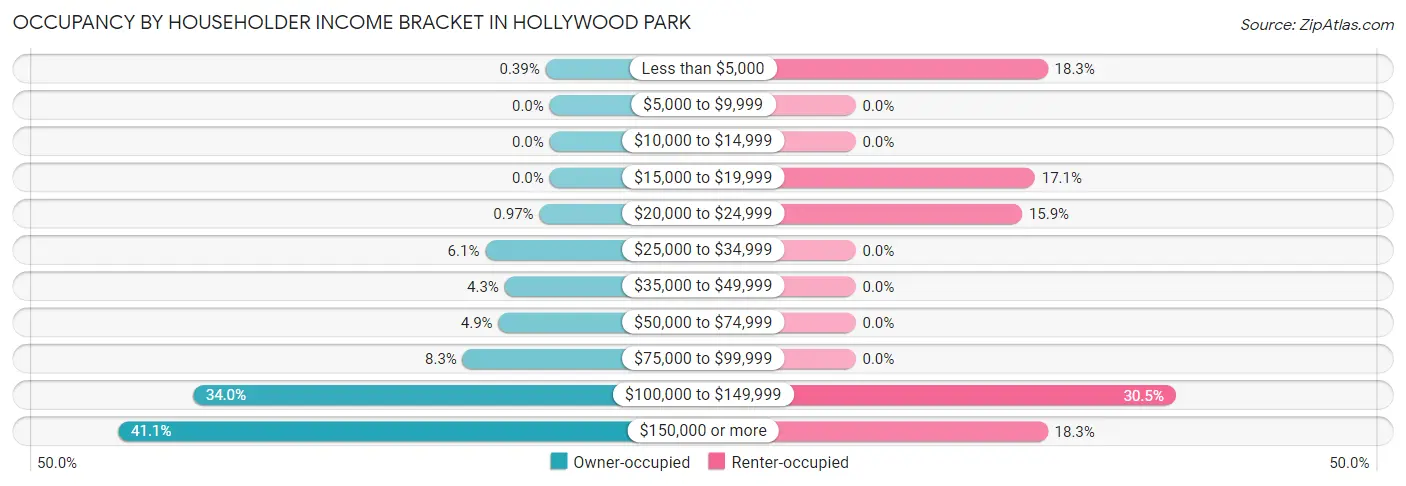
| Income Bracket | Owner-occupied | Renter-occupied |
| Less than $5,000 | 4 (0.4%) | 15 (18.3%) |
| $5,000 to $9,999 | 0 (0.0%) | 0 (0.0%) |
| $10,000 to $14,999 | 0 (0.0%) | 0 (0.0%) |
| $15,000 to $19,999 | 0 (0.0%) | 14 (17.1%) |
| $20,000 to $24,999 | 10 (1.0%) | 13 (15.9%) |
| $25,000 to $34,999 | 63 (6.1%) | 0 (0.0%) |
| $35,000 to $49,999 | 44 (4.3%) | 0 (0.0%) |
| $50,000 to $74,999 | 50 (4.9%) | 0 (0.0%) |
| $75,000 to $99,999 | 85 (8.3%) | 0 (0.0%) |
| $100,000 to $149,999 | 349 (34.0%) | 25 (30.5%) |
| $150,000 or more | 422 (41.1%) | 15 (18.3%) |
| Total | 1,027 (100.0%) | 82 (100.0%) |
Monthly Housing Cost Tiers in Hollywood Park
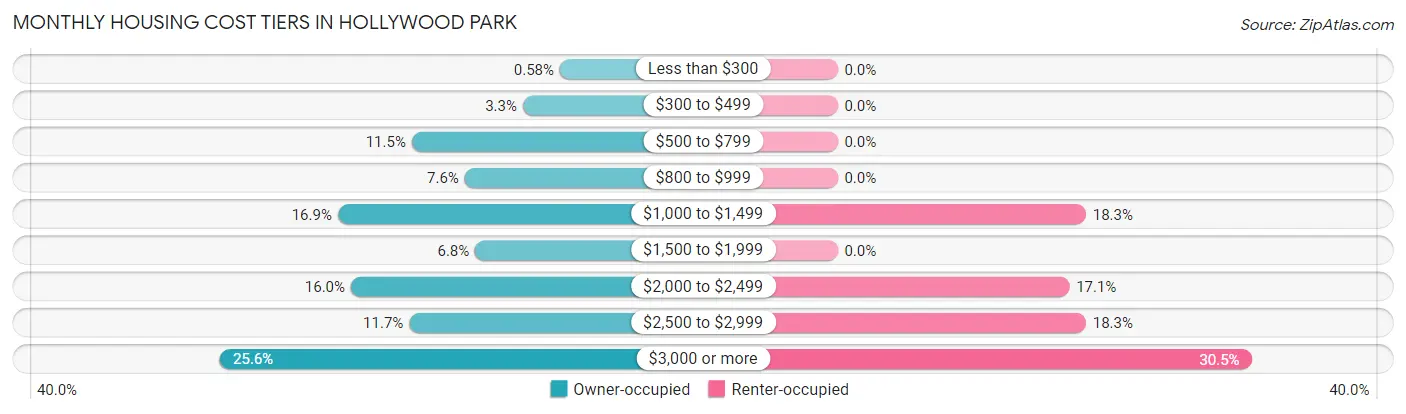
| Monthly Cost | Owner-occupied | Renter-occupied |
| Less than $300 | 6 (0.6%) | 0 (0.0%) |
| $300 to $499 | 34 (3.3%) | 0 (0.0%) |
| $500 to $799 | 118 (11.5%) | 0 (0.0%) |
| $800 to $999 | 78 (7.6%) | 0 (0.0%) |
| $1,000 to $1,499 | 174 (16.9%) | 15 (18.3%) |
| $1,500 to $1,999 | 70 (6.8%) | 0 (0.0%) |
| $2,000 to $2,499 | 164 (16.0%) | 14 (17.1%) |
| $2,500 to $2,999 | 120 (11.7%) | 15 (18.3%) |
| $3,000 or more | 263 (25.6%) | 25 (30.5%) |
| Total | 1,027 (100.0%) | 82 (100.0%) |
Physical Housing Characteristics in Hollywood Park
Housing Structures in Hollywood Park
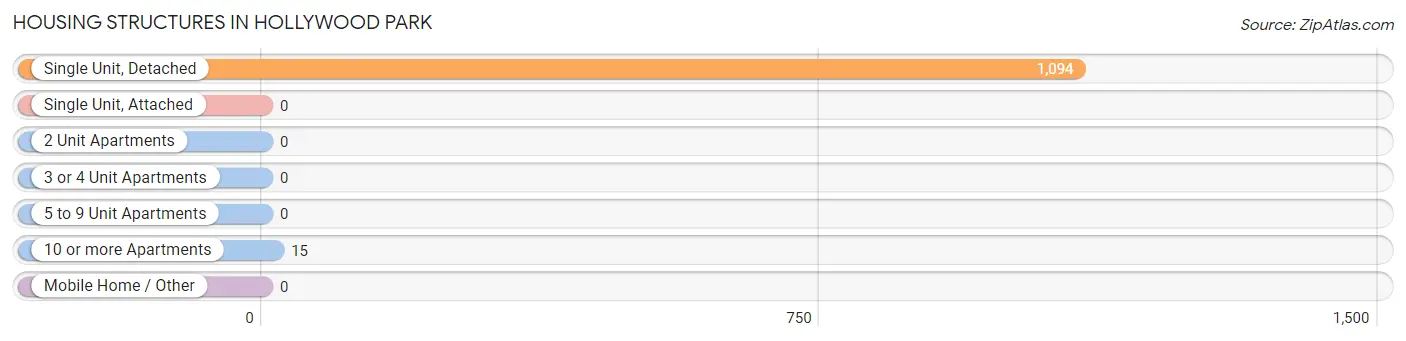
| Structure Type | # Housing Units | % Housing Units |
| Single Unit, Detached | 1,094 | 98.7% |
| Single Unit, Attached | 0 | 0.0% |
| 2 Unit Apartments | 0 | 0.0% |
| 3 or 4 Unit Apartments | 0 | 0.0% |
| 5 to 9 Unit Apartments | 0 | 0.0% |
| 10 or more Apartments | 15 | 1.3% |
| Mobile Home / Other | 0 | 0.0% |
| Total | 1,109 | 100.0% |
Housing Structures by Occupancy in Hollywood Park
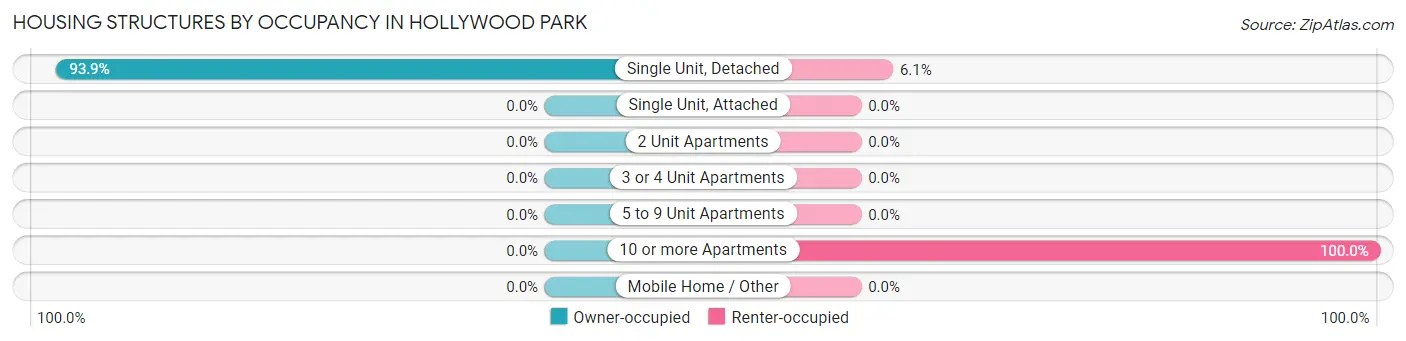
| Structure Type | Owner-occupied | Renter-occupied |
| Single Unit, Detached | 1,027 (93.9%) | 67 (6.1%) |
| Single Unit, Attached | 0 (0.0%) | 0 (0.0%) |
| 2 Unit Apartments | 0 (0.0%) | 0 (0.0%) |
| 3 or 4 Unit Apartments | 0 (0.0%) | 0 (0.0%) |
| 5 to 9 Unit Apartments | 0 (0.0%) | 0 (0.0%) |
| 10 or more Apartments | 0 (0.0%) | 15 (100.0%) |
| Mobile Home / Other | 0 (0.0%) | 0 (0.0%) |
| Total | 1,027 (92.6%) | 82 (7.4%) |
Housing Structures by Number of Rooms in Hollywood Park
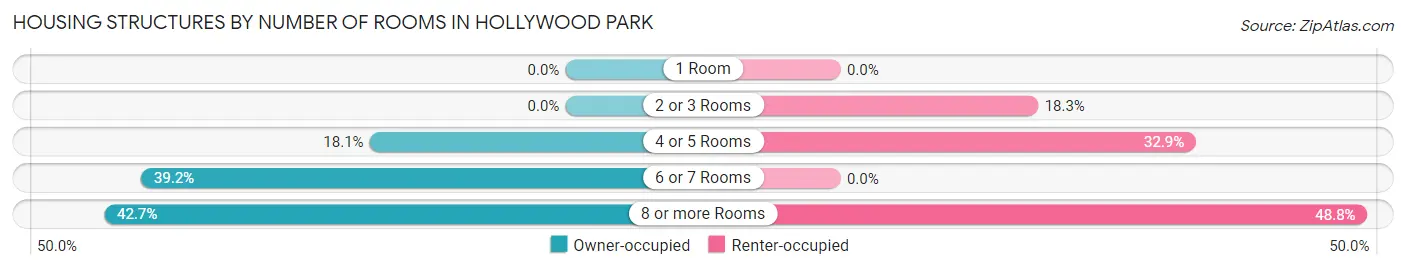
| Number of Rooms | Owner-occupied | Renter-occupied |
| 1 Room | 0 (0.0%) | 0 (0.0%) |
| 2 or 3 Rooms | 0 (0.0%) | 15 (18.3%) |
| 4 or 5 Rooms | 186 (18.1%) | 27 (32.9%) |
| 6 or 7 Rooms | 403 (39.2%) | 0 (0.0%) |
| 8 or more Rooms | 438 (42.6%) | 40 (48.8%) |
| Total | 1,027 (100.0%) | 82 (100.0%) |
Housing Structure by Heating Type in Hollywood Park
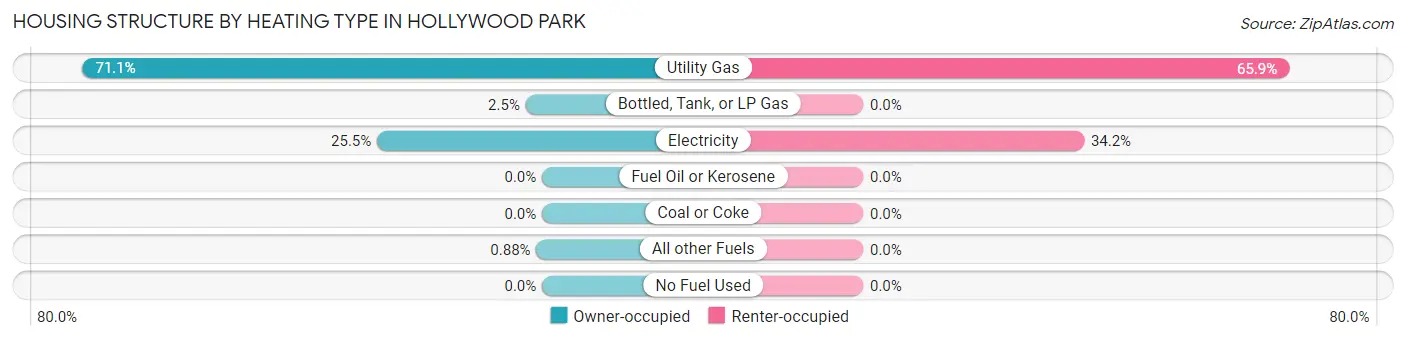
| Heating Type | Owner-occupied | Renter-occupied |
| Utility Gas | 730 (71.1%) | 54 (65.8%) |
| Bottled, Tank, or LP Gas | 26 (2.5%) | 0 (0.0%) |
| Electricity | 262 (25.5%) | 28 (34.2%) |
| Fuel Oil or Kerosene | 0 (0.0%) | 0 (0.0%) |
| Coal or Coke | 0 (0.0%) | 0 (0.0%) |
| All other Fuels | 9 (0.9%) | 0 (0.0%) |
| No Fuel Used | 0 (0.0%) | 0 (0.0%) |
| Total | 1,027 (100.0%) | 82 (100.0%) |
Household Vehicle Usage in Hollywood Park
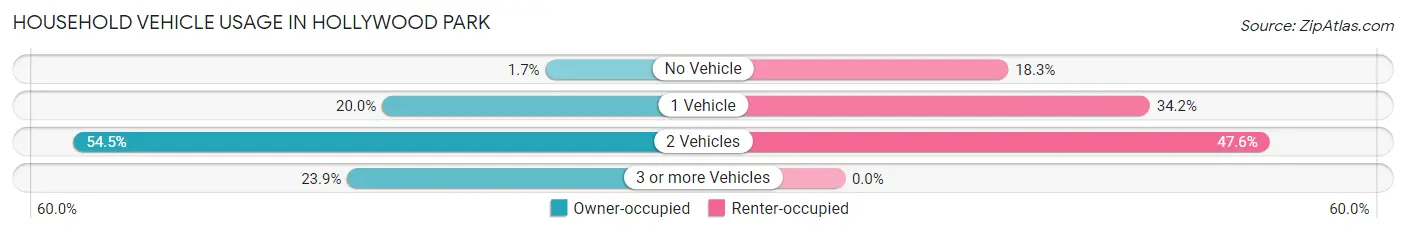
| Vehicles per Household | Owner-occupied | Renter-occupied |
| No Vehicle | 17 (1.7%) | 15 (18.3%) |
| 1 Vehicle | 205 (20.0%) | 28 (34.2%) |
| 2 Vehicles | 560 (54.5%) | 39 (47.6%) |
| 3 or more Vehicles | 245 (23.9%) | 0 (0.0%) |
| Total | 1,027 (100.0%) | 82 (100.0%) |
Real Estate & Mortgages in Hollywood Park
Real Estate and Mortgage Overview in Hollywood Park
| Characteristic | Without Mortgage | With Mortgage |
| Housing Units | 422 | 605 |
| Median Property Value | $383,000 | $423,000 |
| Median Household Income | $107,679 | $287 |
| Monthly Housing Costs | $959 | $257 |
| Real Estate Taxes | $6,538 | $5 |
Property Value by Mortgage Status in Hollywood Park
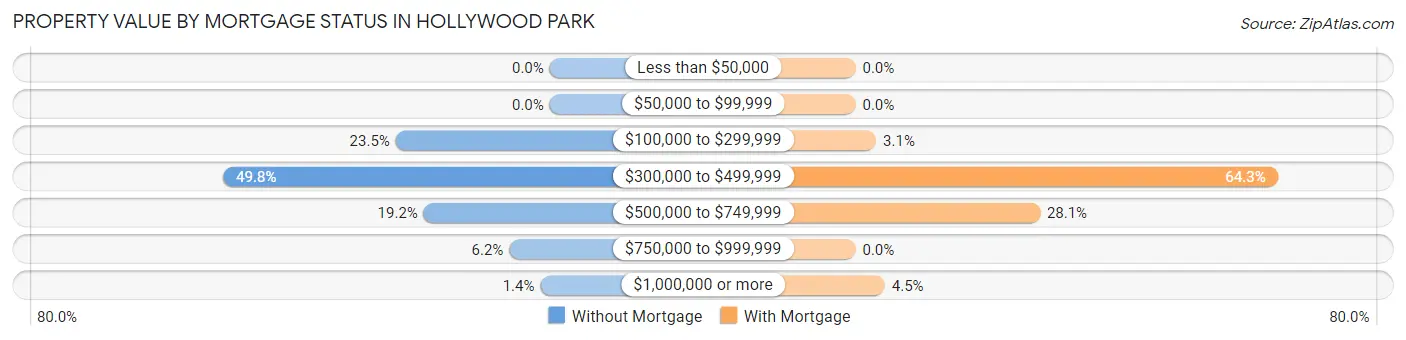
| Property Value | Without Mortgage | With Mortgage |
| Less than $50,000 | 0 (0.0%) | 0 (0.0%) |
| $50,000 to $99,999 | 0 (0.0%) | 0 (0.0%) |
| $100,000 to $299,999 | 99 (23.5%) | 19 (3.1%) |
| $300,000 to $499,999 | 210 (49.8%) | 389 (64.3%) |
| $500,000 to $749,999 | 81 (19.2%) | 170 (28.1%) |
| $750,000 to $999,999 | 26 (6.2%) | 0 (0.0%) |
| $1,000,000 or more | 6 (1.4%) | 27 (4.5%) |
| Total | 422 (100.0%) | 605 (100.0%) |
Household Income by Mortgage Status in Hollywood Park
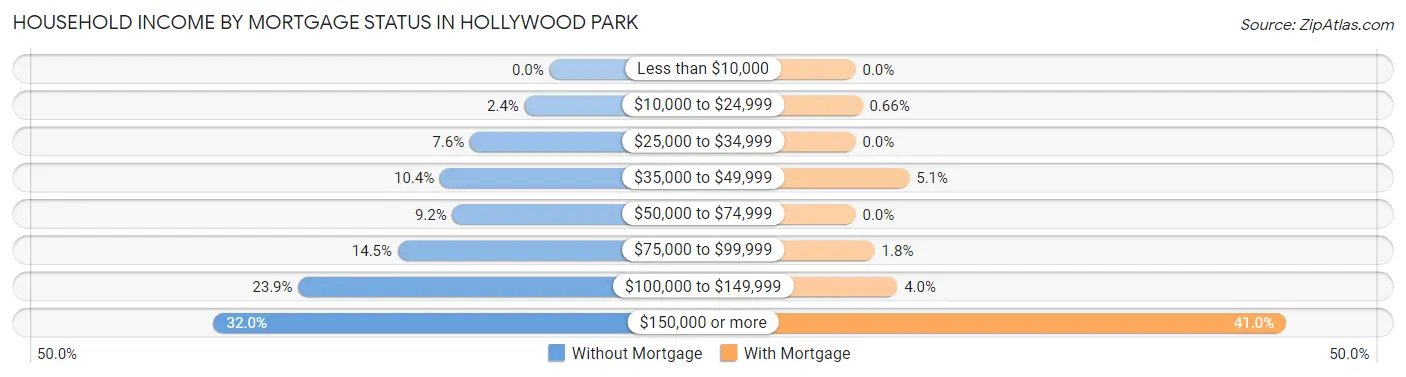
| Household Income | Without Mortgage | With Mortgage |
| Less than $10,000 | 0 (0.0%) | 0 (0.0%) |
| $10,000 to $24,999 | 10 (2.4%) | 4 (0.7%) |
| $25,000 to $34,999 | 32 (7.6%) | 0 (0.0%) |
| $35,000 to $49,999 | 44 (10.4%) | 31 (5.1%) |
| $50,000 to $74,999 | 39 (9.2%) | 0 (0.0%) |
| $75,000 to $99,999 | 61 (14.4%) | 11 (1.8%) |
| $100,000 to $149,999 | 101 (23.9%) | 24 (4.0%) |
| $150,000 or more | 135 (32.0%) | 248 (41.0%) |
| Total | 422 (100.0%) | 605 (100.0%) |
Property Value to Household Income Ratio in Hollywood Park
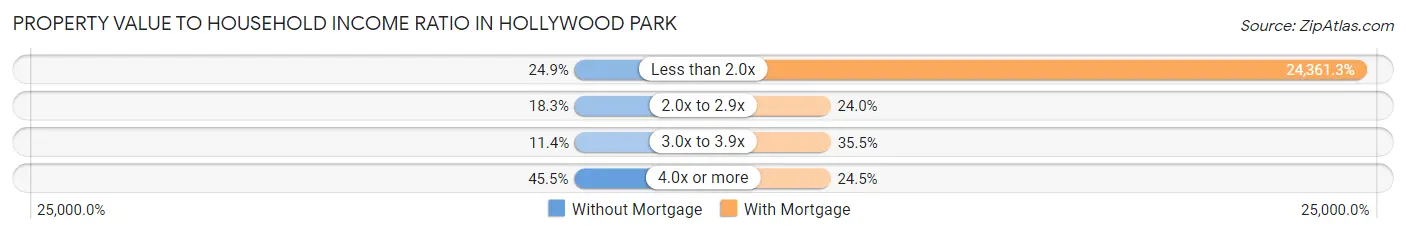
| Value-to-Income Ratio | Without Mortgage | With Mortgage |
| Less than 2.0x | 105 (24.9%) | 147,386 (24,361.3%) |
| 2.0x to 2.9x | 77 (18.2%) | 145 (24.0%) |
| 3.0x to 3.9x | 48 (11.4%) | 215 (35.5%) |
| 4.0x or more | 192 (45.5%) | 148 (24.5%) |
| Total | 422 (100.0%) | 605 (100.0%) |
Real Estate Taxes by Mortgage Status in Hollywood Park
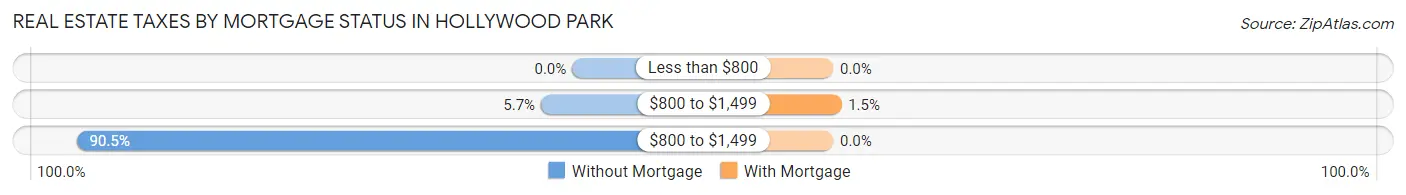
| Property Taxes | Without Mortgage | With Mortgage |
| Less than $800 | 0 (0.0%) | 0 (0.0%) |
| $800 to $1,499 | 24 (5.7%) | 9 (1.5%) |
| $800 to $1,499 | 382 (90.5%) | 0 (0.0%) |
| Total | 422 (100.0%) | 605 (100.0%) |
Health & Disability in Hollywood Park
Health Insurance Coverage by Age in Hollywood Park
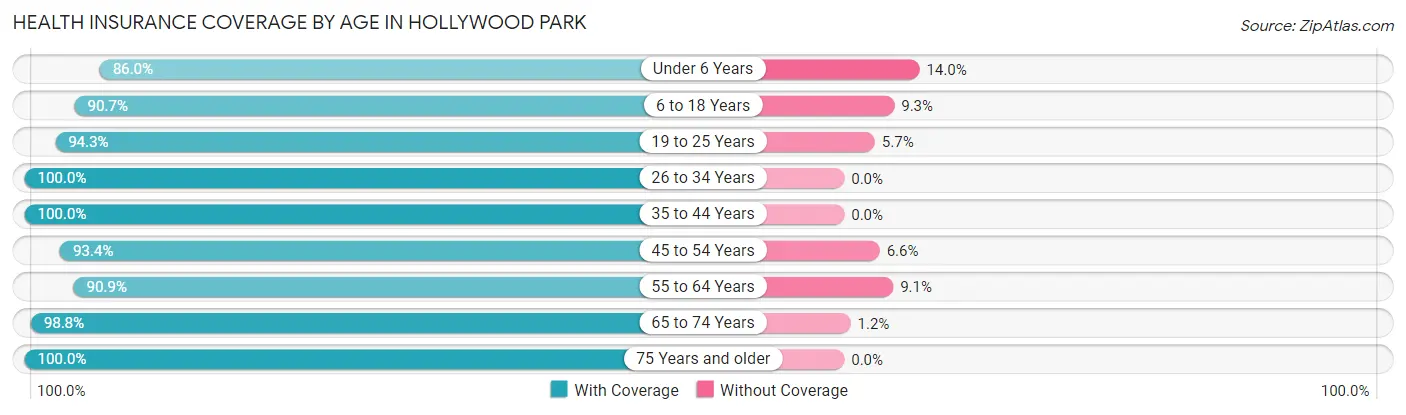
| Age Bracket | With Coverage | Without Coverage |
| Under 6 Years | 276 (86.0%) | 45 (14.0%) |
| 6 to 18 Years | 438 (90.7%) | 45 (9.3%) |
| 19 to 25 Years | 231 (94.3%) | 14 (5.7%) |
| 26 to 34 Years | 127 (100.0%) | 0 (0.0%) |
| 35 to 44 Years | 430 (100.0%) | 0 (0.0%) |
| 45 to 54 Years | 368 (93.4%) | 26 (6.6%) |
| 55 to 64 Years | 378 (90.9%) | 38 (9.1%) |
| 65 to 74 Years | 336 (98.8%) | 4 (1.2%) |
| 75 Years and older | 349 (100.0%) | 0 (0.0%) |
| Total | 2,933 (94.5%) | 172 (5.5%) |
Health Insurance Coverage by Citizenship Status in Hollywood Park
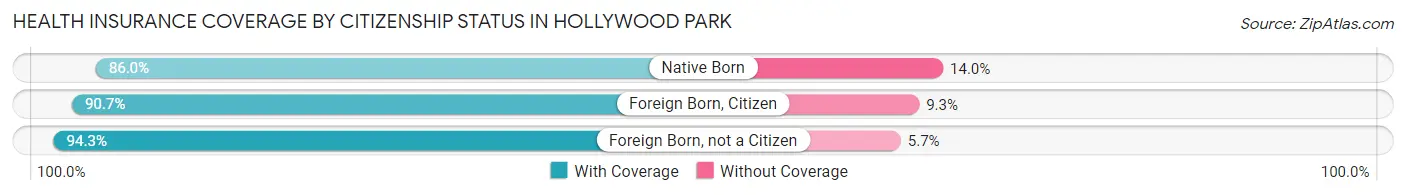
| Citizenship Status | With Coverage | Without Coverage |
| Native Born | 276 (86.0%) | 45 (14.0%) |
| Foreign Born, Citizen | 438 (90.7%) | 45 (9.3%) |
| Foreign Born, not a Citizen | 231 (94.3%) | 14 (5.7%) |
Health Insurance Coverage by Household Income in Hollywood Park
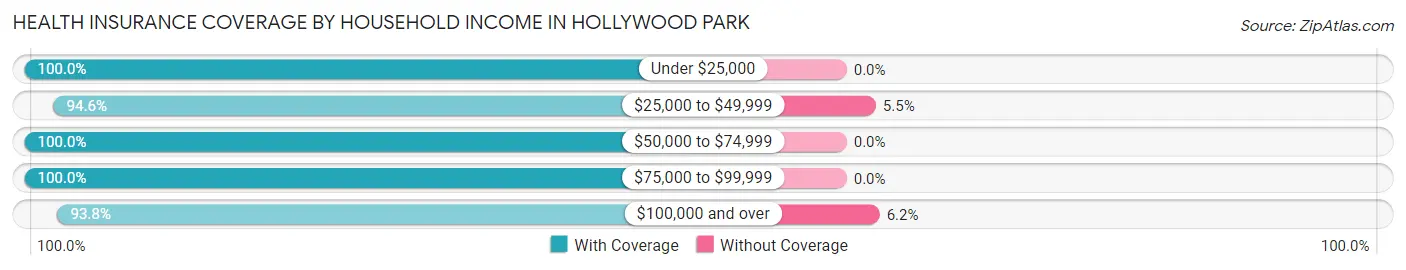
| Household Income | With Coverage | Without Coverage |
| Under $25,000 | 79 (100.0%) | 0 (0.0%) |
| $25,000 to $49,999 | 156 (94.6%) | 9 (5.4%) |
| $50,000 to $74,999 | 86 (100.0%) | 0 (0.0%) |
| $75,000 to $99,999 | 134 (100.0%) | 0 (0.0%) |
| $100,000 and over | 2,478 (93.8%) | 163 (6.2%) |
Public vs Private Health Insurance Coverage by Age in Hollywood Park
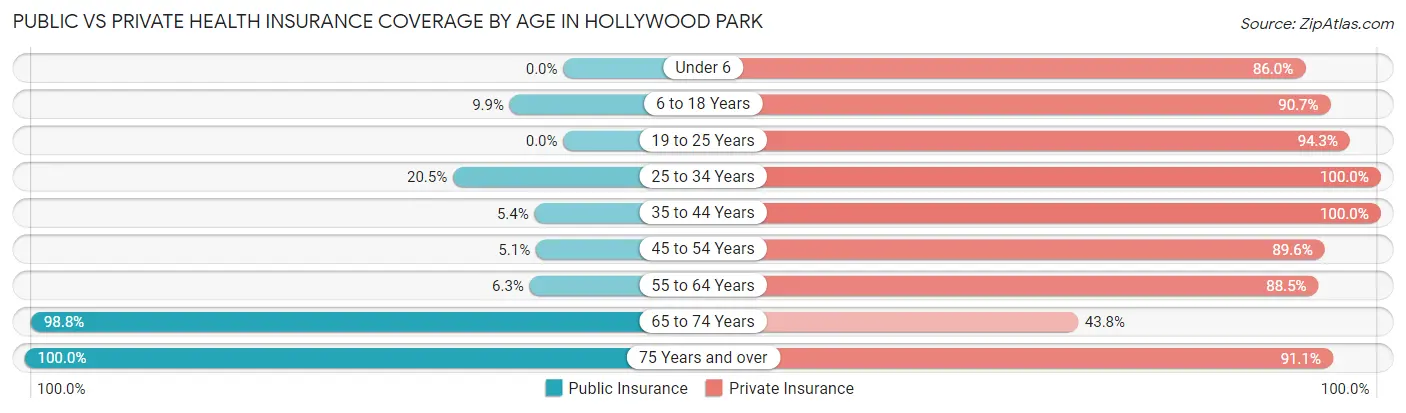
| Age Bracket | Public Insurance | Private Insurance |
| Under 6 | 0 (0.0%) | 276 (86.0%) |
| 6 to 18 Years | 48 (9.9%) | 438 (90.7%) |
| 19 to 25 Years | 0 (0.0%) | 231 (94.3%) |
| 25 to 34 Years | 26 (20.5%) | 127 (100.0%) |
| 35 to 44 Years | 23 (5.3%) | 430 (100.0%) |
| 45 to 54 Years | 20 (5.1%) | 353 (89.6%) |
| 55 to 64 Years | 26 (6.2%) | 368 (88.5%) |
| 65 to 74 Years | 336 (98.8%) | 149 (43.8%) |
| 75 Years and over | 349 (100.0%) | 318 (91.1%) |
| Total | 828 (26.7%) | 2,690 (86.6%) |
Disability Status by Sex by Age in Hollywood Park
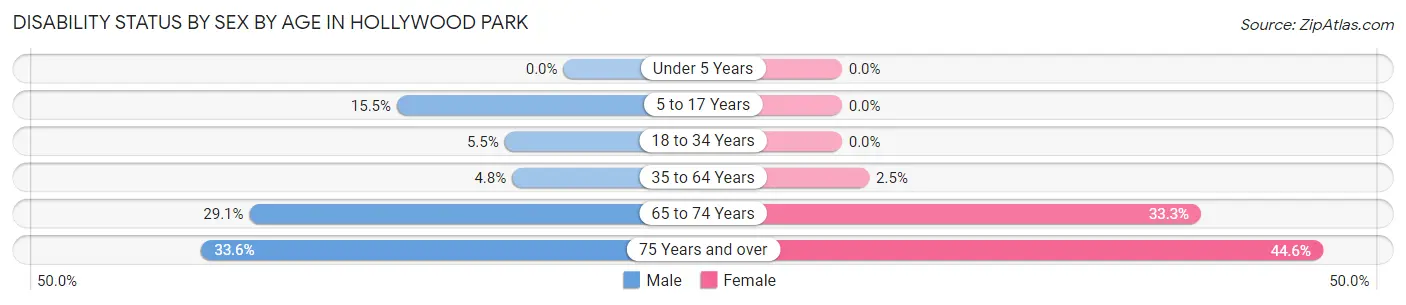
| Age Bracket | Male | Female |
| Under 5 Years | 0 (0.0%) | 0 (0.0%) |
| 5 to 17 Years | 38 (15.4%) | 0 (0.0%) |
| 18 to 34 Years | 10 (5.5%) | 0 (0.0%) |
| 35 to 64 Years | 29 (4.8%) | 16 (2.5%) |
| 65 to 74 Years | 51 (29.1%) | 55 (33.3%) |
| 75 Years and over | 42 (33.6%) | 100 (44.6%) |
Disability Class by Sex by Age in Hollywood Park
Disability Class: Hearing Difficulty
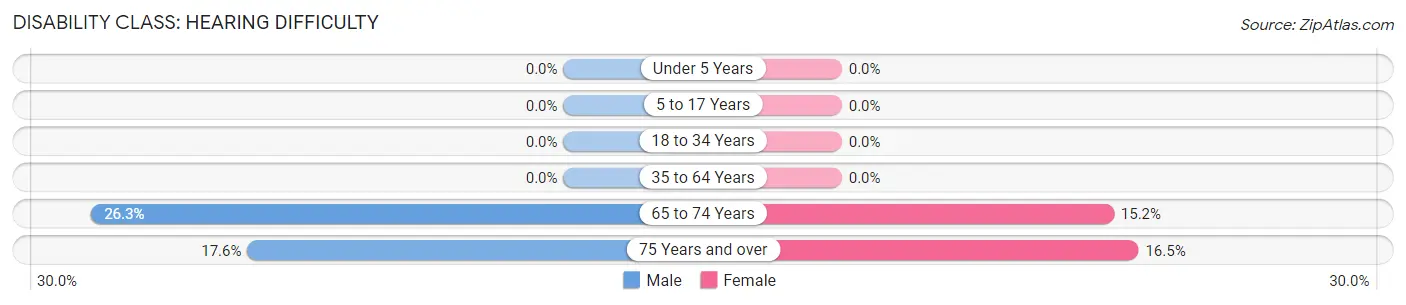
| Age Bracket | Male | Female |
| Under 5 Years | 0 (0.0%) | 0 (0.0%) |
| 5 to 17 Years | 0 (0.0%) | 0 (0.0%) |
| 18 to 34 Years | 0 (0.0%) | 0 (0.0%) |
| 35 to 64 Years | 0 (0.0%) | 0 (0.0%) |
| 65 to 74 Years | 46 (26.3%) | 25 (15.1%) |
| 75 Years and over | 22 (17.6%) | 37 (16.5%) |
Disability Class: Vision Difficulty
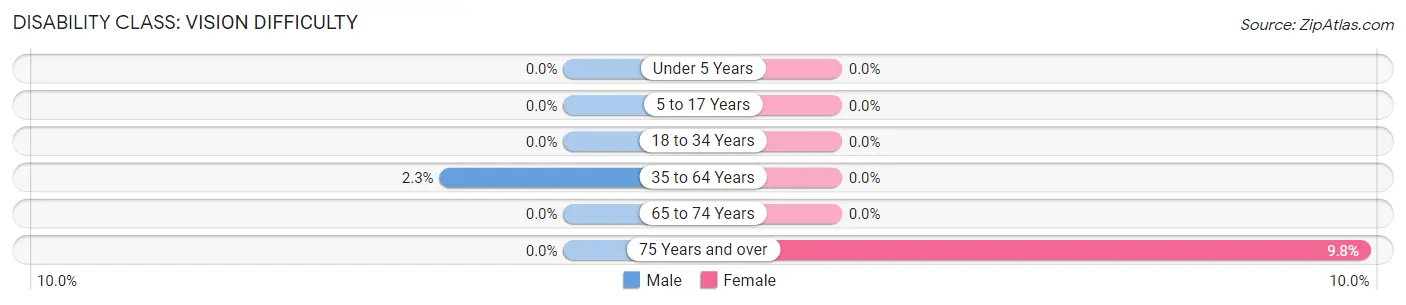
| Age Bracket | Male | Female |
| Under 5 Years | 0 (0.0%) | 0 (0.0%) |
| 5 to 17 Years | 0 (0.0%) | 0 (0.0%) |
| 18 to 34 Years | 0 (0.0%) | 0 (0.0%) |
| 35 to 64 Years | 14 (2.3%) | 0 (0.0%) |
| 65 to 74 Years | 0 (0.0%) | 0 (0.0%) |
| 75 Years and over | 0 (0.0%) | 22 (9.8%) |
Disability Class: Cognitive Difficulty
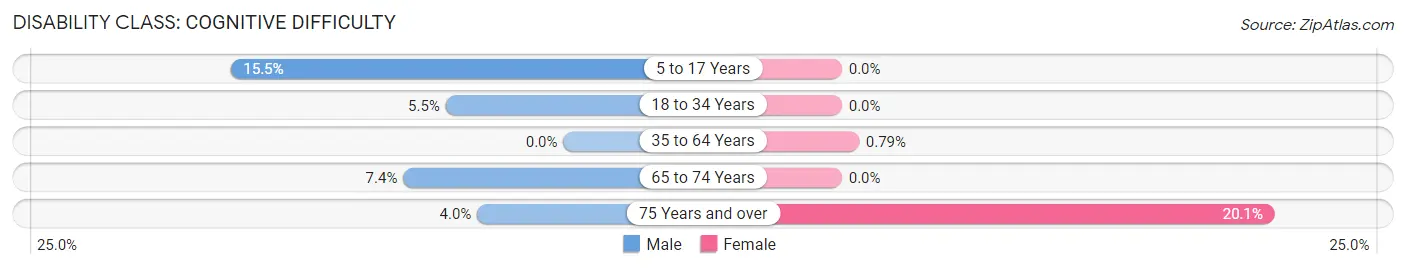
| Age Bracket | Male | Female |
| 5 to 17 Years | 38 (15.4%) | 0 (0.0%) |
| 18 to 34 Years | 10 (5.5%) | 0 (0.0%) |
| 35 to 64 Years | 0 (0.0%) | 5 (0.8%) |
| 65 to 74 Years | 13 (7.4%) | 0 (0.0%) |
| 75 Years and over | 5 (4.0%) | 45 (20.1%) |
Disability Class: Ambulatory Difficulty
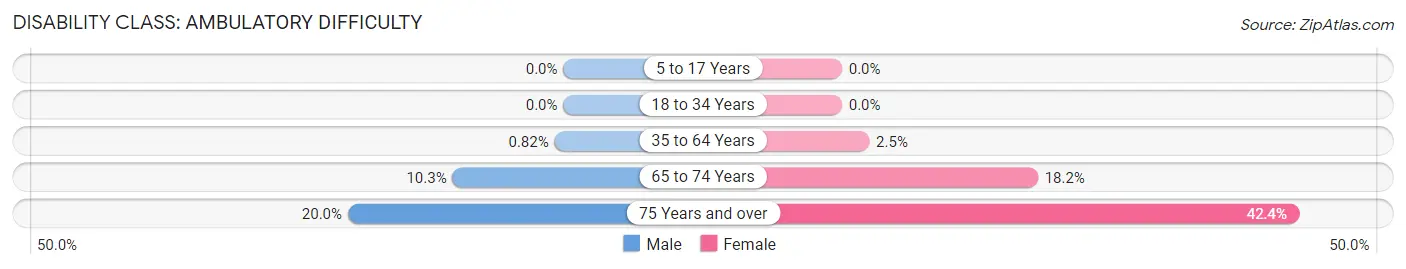
| Age Bracket | Male | Female |
| 5 to 17 Years | 0 (0.0%) | 0 (0.0%) |
| 18 to 34 Years | 0 (0.0%) | 0 (0.0%) |
| 35 to 64 Years | 5 (0.8%) | 16 (2.5%) |
| 65 to 74 Years | 18 (10.3%) | 30 (18.2%) |
| 75 Years and over | 25 (20.0%) | 95 (42.4%) |
Disability Class: Self-Care Difficulty
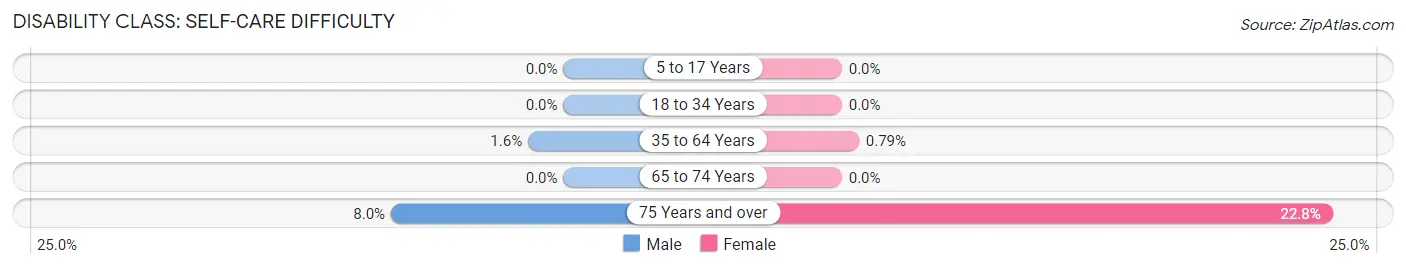
| Age Bracket | Male | Female |
| 5 to 17 Years | 0 (0.0%) | 0 (0.0%) |
| 18 to 34 Years | 0 (0.0%) | 0 (0.0%) |
| 35 to 64 Years | 10 (1.6%) | 5 (0.8%) |
| 65 to 74 Years | 0 (0.0%) | 0 (0.0%) |
| 75 Years and over | 10 (8.0%) | 51 (22.8%) |
Technology Access in Hollywood Park
Computing Device Access in Hollywood Park
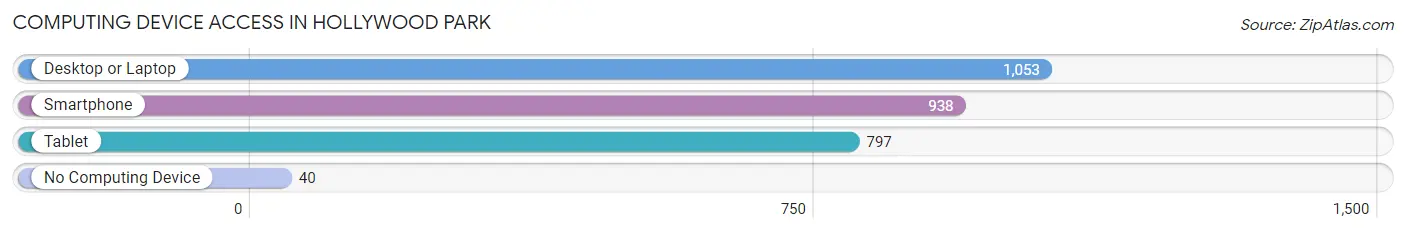
| Device Type | # Households | % Households |
| Desktop or Laptop | 1,053 | 95.0% |
| Smartphone | 938 | 84.6% |
| Tablet | 797 | 71.9% |
| No Computing Device | 40 | 3.6% |
| Total | 1,109 | 100.0% |
Internet Access in Hollywood Park
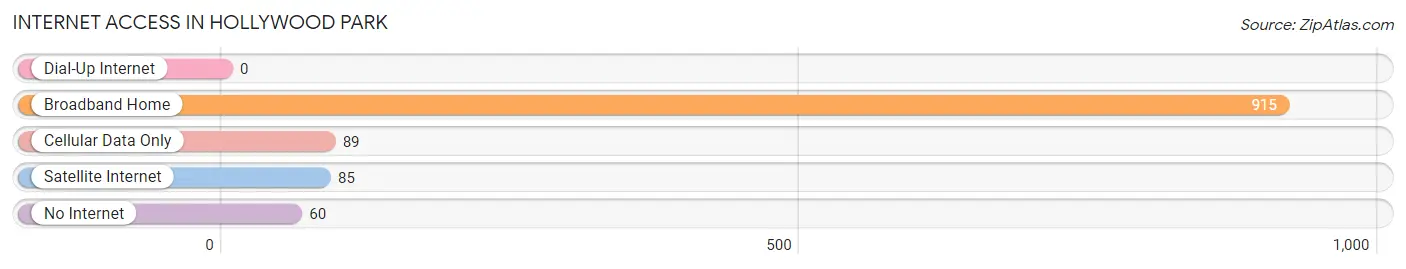
| Internet Type | # Households | % Households |
| Dial-Up Internet | 0 | 0.0% |
| Broadband Home | 915 | 82.5% |
| Cellular Data Only | 89 | 8.0% |
| Satellite Internet | 85 | 7.7% |
| No Internet | 60 | 5.4% |
| Total | 1,109 | 100.0% |
Hollywood Park Summary
Hollywood Park is a small city located in Bexar County, Texas, United States. It is part of the San Antonio–New Braunfels Metropolitan Statistical Area. The population was 1,491 at the 2010 census.
History
Hollywood Park was founded in the early 1950s by a group of investors who wanted to create a residential community. The city was named after the Hollywood Park Race Track, which was located nearby. The track was opened in 1925 and was a popular destination for horse racing fans. The track closed in 2013 and was replaced by a shopping center.
Geography
Hollywood Park is located at 29°31'25" North, 98°30'17" West (29.523750, -98.504722). It is situated in the northwest corner of Bexar County, approximately 15 miles north of downtown San Antonio. The city has a total area of 1.2 square miles, all of which is land.
Economy
Hollywood Park is primarily a residential community, with most of its residents employed in the nearby cities of San Antonio and New Braunfels. The city does not have any major employers, but there are several small businesses located in the area. These include a grocery store, a gas station, a pharmacy, and several restaurants.
Demographics
As of the 2010 census, there were 1,491 people, 545 households, and 431 families residing in the city. The population density was 1,241.8 people per square mile. The racial makeup of the city was 81.2% White, 5.2% African American, 0.2% Native American, 5.2% Asian, 0.1% Pacific Islander, 5.7% from other races, and 2.6% from two or more races. Hispanic or Latino of any race were 18.2% of the population.
The median income for a household in the city was $68,750, and the median income for a family was $76,250. Males had a median income of $50,000 versus $37,500 for females. The per capita income for the city was $30,945. About 4.2% of families and 5.2% of the population were below the poverty line, including 6.2% of those under age 18 and 4.2% of those age 65 or over.
Conclusion
Hollywood Park is a small city located in Bexar County, Texas. It was founded in the early 1950s and is primarily a residential community. The city has a total area of 1.2 square miles and a population of 1,491 as of the 2010 census. The economy of Hollywood Park is largely dependent on the nearby cities of San Antonio and New Braunfels, with most of its residents employed in those cities. The racial makeup of the city is predominantly White, with a significant Hispanic or Latino population. The median income for a household in the city is $68,750, and the per capita income is $30,945.
Common Questions
What is Per Capita Income in Hollywood Park?
Per Capita income in Hollywood Park is $70,828.
What is the Median Family Income in Hollywood Park?
Median Family Income in Hollywood Park is $142,593.
What is the Median Household income in Hollywood Park?
Median Household Income in Hollywood Park is $137,411.
What is Income or Wage Gap in Hollywood Park?
Income or Wage Gap in Hollywood Park is 68.5%.
Women in Hollywood Park earn 31.5 cents for every dollar earned by a man.
What is Inequality or Gini Index in Hollywood Park?
Inequality or Gini Index in Hollywood Park is 0.47.
What is the Total Population of Hollywood Park?
Total Population of Hollywood Park is 3,123.
What is the Total Male Population of Hollywood Park?
Total Male Population of Hollywood Park is 1,436.
What is the Total Female Population of Hollywood Park?
Total Female Population of Hollywood Park is 1,687.
What is the Ratio of Males per 100 Females in Hollywood Park?
There are 85.12 Males per 100 Females in Hollywood Park.
What is the Ratio of Females per 100 Males in Hollywood Park?
There are 117.48 Females per 100 Males in Hollywood Park.
What is the Median Population Age in Hollywood Park?
Median Population Age in Hollywood Park is 44.0 Years.
What is the Average Family Size in Hollywood Park
Average Family Size in Hollywood Park is 3.2 People.
What is the Average Household Size in Hollywood Park
Average Household Size in Hollywood Park is 2.8 People.
How Large is the Labor Force in Hollywood Park?
There are 1,426 People in the Labor Forcein in Hollywood Park.
What is the Percentage of People in the Labor Force in Hollywood Park?
60.1% of People are in the Labor Force in Hollywood Park.