Oak Leaf, TX Map & Demographics
Oak Leaf Map
Oak Leaf Overview
$57,634
PER CAPITA INCOME
$165,057
AVG FAMILY INCOME
$151,375
AVG HOUSEHOLD INCOME
34.9%
WAGE / INCOME GAP [ % ]
65.1¢/ $1
WAGE / INCOME GAP [ $ ]
0.37
INEQUALITY / GINI INDEX
1,653
TOTAL POPULATION
846
MALE POPULATION
807
FEMALE POPULATION
104.83
MALES / 100 FEMALES
95.39
FEMALES / 100 MALES
50.5
MEDIAN AGE
3.1
AVG FAMILY SIZE
2.9
AVG HOUSEHOLD SIZE
875
LABOR FORCE [ PEOPLE ]
60.2%
PERCENT IN LABOR FORCE
6.9%
UNEMPLOYMENT RATE
Income in Oak Leaf
Income Overview in Oak Leaf
Per Capita Income in Oak Leaf is $57,634, while median incomes of families and households are $165,057 and $151,375 respectively.
| Characteristic | Number | Measure |
| Per Capita Income | 1,653 | $57,634 |
| Median Family Income | 489 | $165,057 |
| Mean Family Income | 489 | $174,435 |
| Median Household Income | 569 | $151,375 |
| Mean Household Income | 569 | $166,242 |
| Income Deficit | 489 | $0 |
| Wage / Income Gap (%) | 1,653 | 34.88% |
| Wage / Income Gap ($) | 1,653 | 65.12¢ per $1 |
| Gini / Inequality Index | 1,653 | 0.37 |
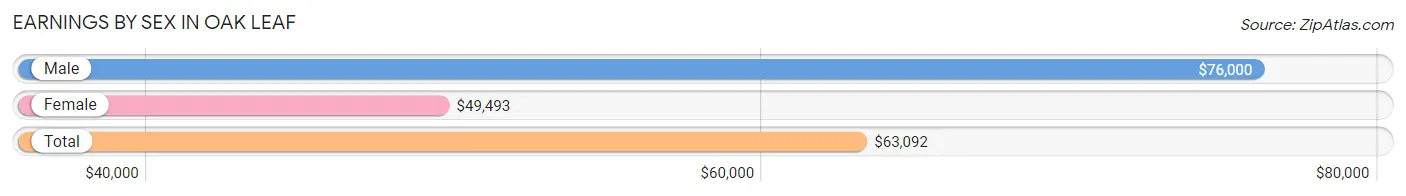
Earnings by Sex in Oak Leaf
Average Earnings in Oak Leaf are $63,092, $76,000 for men and $49,493 for women, a difference of 34.9%.
| Sex | Number | Average Earnings |
| Male | 458 (49.8%) | $76,000 |
| Female | 461 (50.2%) | $49,493 |
| Total | 919 (100.0%) | $63,092 |
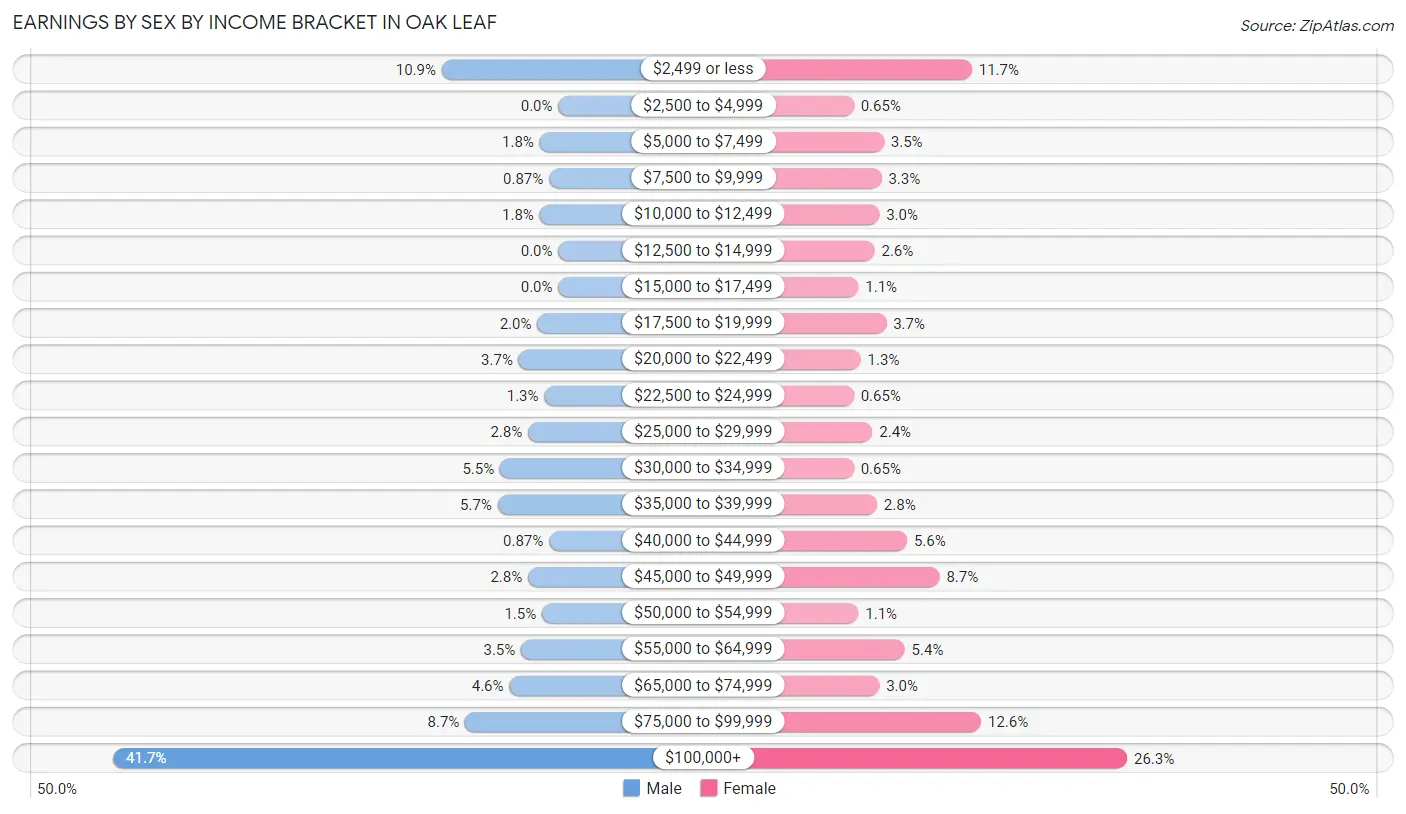
Earnings by Sex by Income Bracket in Oak Leaf
The most common earnings brackets in Oak Leaf are $100,000+ for men (191 | 41.7%) and $100,000+ for women (121 | 26.3%).
| Income | Male | Female |
| $2,499 or less | 50 (10.9%) | 54 (11.7%) |
| $2,500 to $4,999 | 0 (0.0%) | 3 (0.6%) |
| $5,000 to $7,499 | 8 (1.8%) | 16 (3.5%) |
| $7,500 to $9,999 | 4 (0.9%) | 15 (3.3%) |
| $10,000 to $12,499 | 8 (1.8%) | 14 (3.0%) |
| $12,500 to $14,999 | 0 (0.0%) | 12 (2.6%) |
| $15,000 to $17,499 | 0 (0.0%) | 5 (1.1%) |
| $17,500 to $19,999 | 9 (2.0%) | 17 (3.7%) |
| $20,000 to $22,499 | 17 (3.7%) | 6 (1.3%) |
| $22,500 to $24,999 | 6 (1.3%) | 3 (0.6%) |
| $25,000 to $29,999 | 13 (2.8%) | 11 (2.4%) |
| $30,000 to $34,999 | 25 (5.5%) | 3 (0.6%) |
| $35,000 to $39,999 | 26 (5.7%) | 13 (2.8%) |
| $40,000 to $44,999 | 4 (0.9%) | 26 (5.6%) |
| $45,000 to $49,999 | 13 (2.8%) | 40 (8.7%) |
| $50,000 to $54,999 | 7 (1.5%) | 5 (1.1%) |
| $55,000 to $64,999 | 16 (3.5%) | 25 (5.4%) |
| $65,000 to $74,999 | 21 (4.6%) | 14 (3.0%) |
| $75,000 to $99,999 | 40 (8.7%) | 58 (12.6%) |
| $100,000+ | 191 (41.7%) | 121 (26.3%) |
| Total | 458 (100.0%) | 461 (100.0%) |
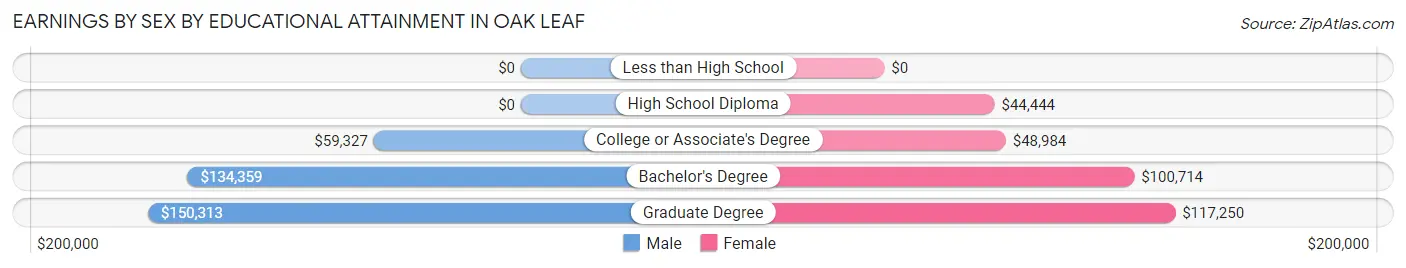
Earnings by Sex by Educational Attainment in Oak Leaf
Average earnings in Oak Leaf are $91,389 for men and $74,500 for women, a difference of 18.5%. Men with an educational attainment of graduate degree enjoy the highest average annual earnings of $150,313, while those with college or associate's degree education earn the least with $59,327. Women with an educational attainment of graduate degree earn the most with the average annual earnings of $117,250, while those with high school diploma education have the smallest earnings of $44,444.
| Educational Attainment | Male Income | Female Income |
| Less than High School | - | - |
| High School Diploma | - | - |
| College or Associate's Degree | $59,327 | $48,984 |
| Bachelor's Degree | $134,359 | $100,714 |
| Graduate Degree | $150,313 | $117,250 |
| Total | $91,389 | $74,500 |
Family Income in Oak Leaf
Family Income Brackets in Oak Leaf
According to the Oak Leaf family income data, there are 175 families falling into the $200,000+ income range, which is the most common income bracket and makes up 35.8% of all families.
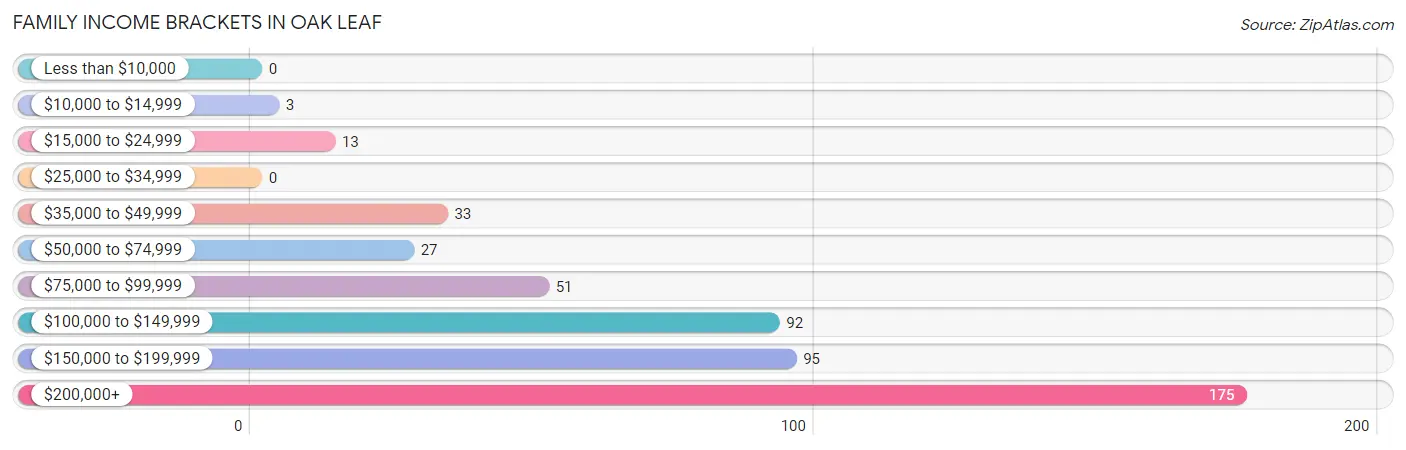
| Income Bracket | # Families | % Families |
| Less than $10,000 | 0 | 0.0% |
| $10,000 to $14,999 | 3 | 0.6% |
| $15,000 to $24,999 | 13 | 2.7% |
| $25,000 to $34,999 | 0 | 0.0% |
| $35,000 to $49,999 | 33 | 6.7% |
| $50,000 to $74,999 | 27 | 5.5% |
| $75,000 to $99,999 | 51 | 10.4% |
| $100,000 to $149,999 | 92 | 18.8% |
| $150,000 to $199,999 | 95 | 19.4% |
| $200,000+ | 175 | 35.8% |
Family Income by Famaliy Size in Oak Leaf
5-person families (36 | 7.4%) account for the highest median family income in Oak Leaf with $218,125 per family, while 2-person families (246 | 50.3%) have the highest median income of $75,750 per family member.
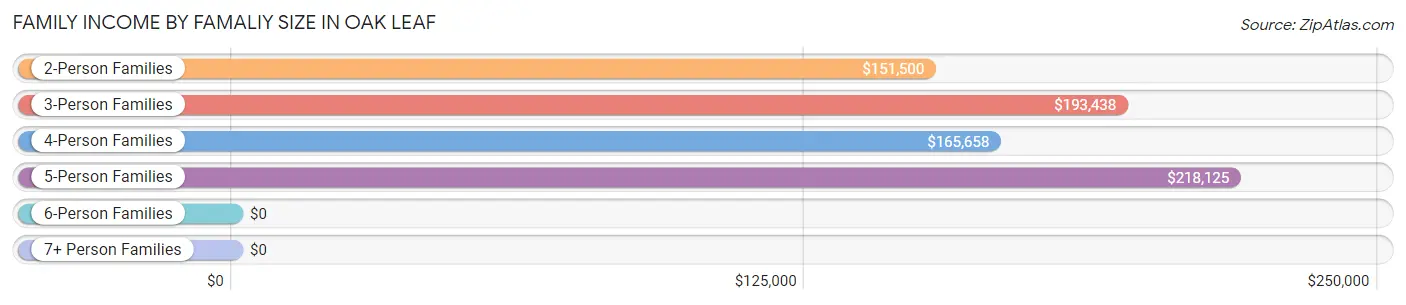
| Income Bracket | # Families | Median Income |
| 2-Person Families | 246 (50.3%) | $151,500 |
| 3-Person Families | 133 (27.2%) | $193,438 |
| 4-Person Families | 46 (9.4%) | $165,658 |
| 5-Person Families | 36 (7.4%) | $218,125 |
| 6-Person Families | 18 (3.7%) | $0 |
| 7+ Person Families | 10 (2.0%) | $0 |
| Total | 489 (100.0%) | $165,057 |
Family Income by Number of Earners in Oak Leaf
The median family income in Oak Leaf is $165,057, with families comprising 2 earners (177) having the highest median family income of $205,417, while families with no earners (99) have the lowest median family income of $77,188, accounting for 36.2% and 20.3% of families, respectively.
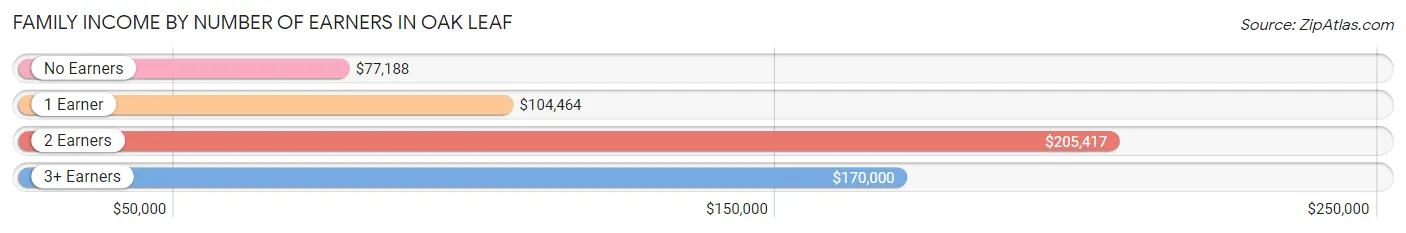
| Number of Earners | # Families | Median Income |
| No Earners | 99 (20.3%) | $77,188 |
| 1 Earner | 95 (19.4%) | $104,464 |
| 2 Earners | 177 (36.2%) | $205,417 |
| 3+ Earners | 118 (24.1%) | $170,000 |
| Total | 489 (100.0%) | $165,057 |
Household Income in Oak Leaf
Household Income Brackets in Oak Leaf
With 191 households falling in the category, the $200,000+ income range is the most frequent in Oak Leaf, accounting for 33.6% of all households. In contrast, only 3 households (0.5%) fall into the $10,000 to $14,999 income bracket, making it the least populous group.
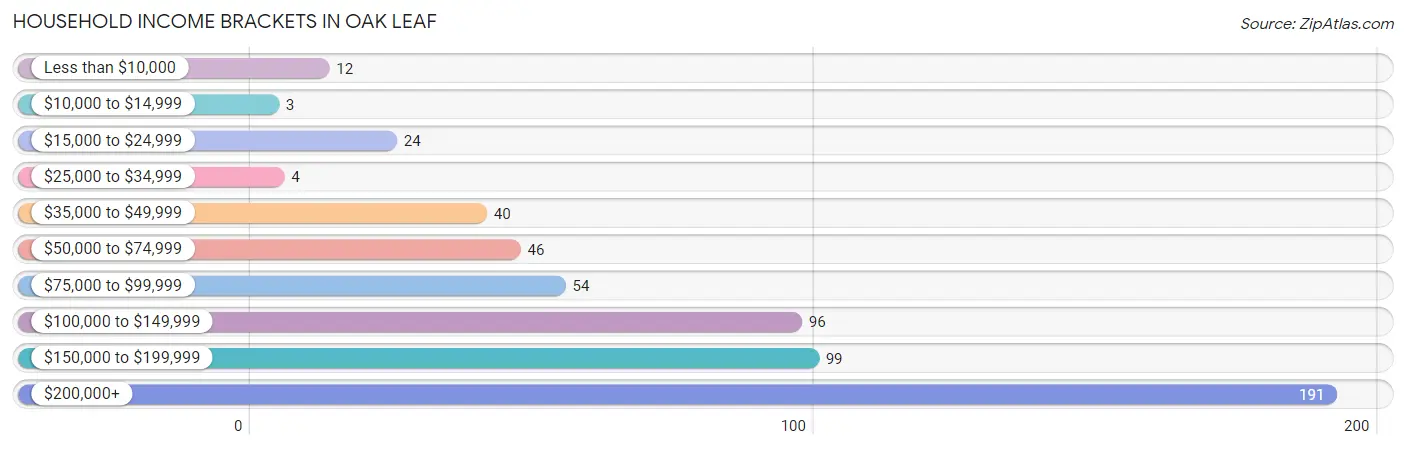
| Income Bracket | # Households | % Households |
| Less than $10,000 | 12 | 2.1% |
| $10,000 to $14,999 | 3 | 0.5% |
| $15,000 to $24,999 | 24 | 4.2% |
| $25,000 to $34,999 | 4 | 0.7% |
| $35,000 to $49,999 | 40 | 7.0% |
| $50,000 to $74,999 | 46 | 8.1% |
| $75,000 to $99,999 | 54 | 9.5% |
| $100,000 to $149,999 | 96 | 16.9% |
| $150,000 to $199,999 | 99 | 17.4% |
| $200,000+ | 191 | 33.6% |
Household Income by Householder Age in Oak Leaf
The median household income in Oak Leaf is $151,375, with the highest median household income of $194,091 found in the 45 to 64 years age bracket for the primary householder. A total of 264 households (46.4%) fall into this category.
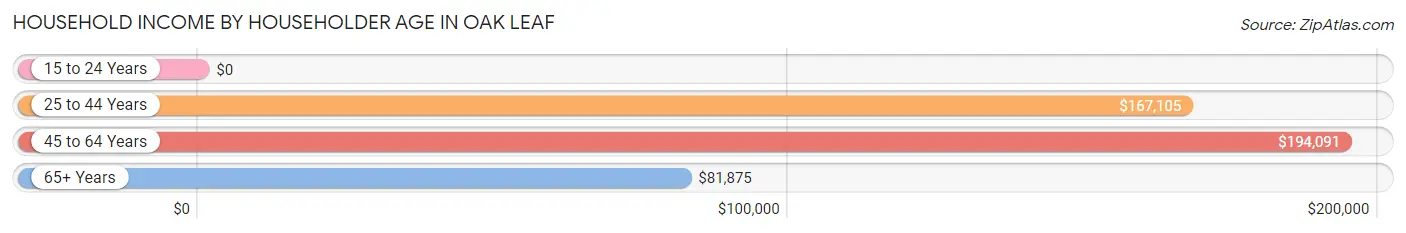
| Income Bracket | # Households | Median Income |
| 15 to 24 Years | 0 (0.0%) | $0 |
| 25 to 44 Years | 94 (16.5%) | $167,105 |
| 45 to 64 Years | 264 (46.4%) | $194,091 |
| 65+ Years | 211 (37.1%) | $81,875 |
| Total | 569 (100.0%) | $151,375 |
Poverty in Oak Leaf
Income Below Poverty by Sex and Age in Oak Leaf
With 2.0% poverty level for males and 2.0% for females among the residents of Oak Leaf, 65 to 74 year old males and 45 to 54 year old females are the most vulnerable to poverty, with 13 males (11.3%) and 13 females (8.9%) in their respective age groups living below the poverty level.
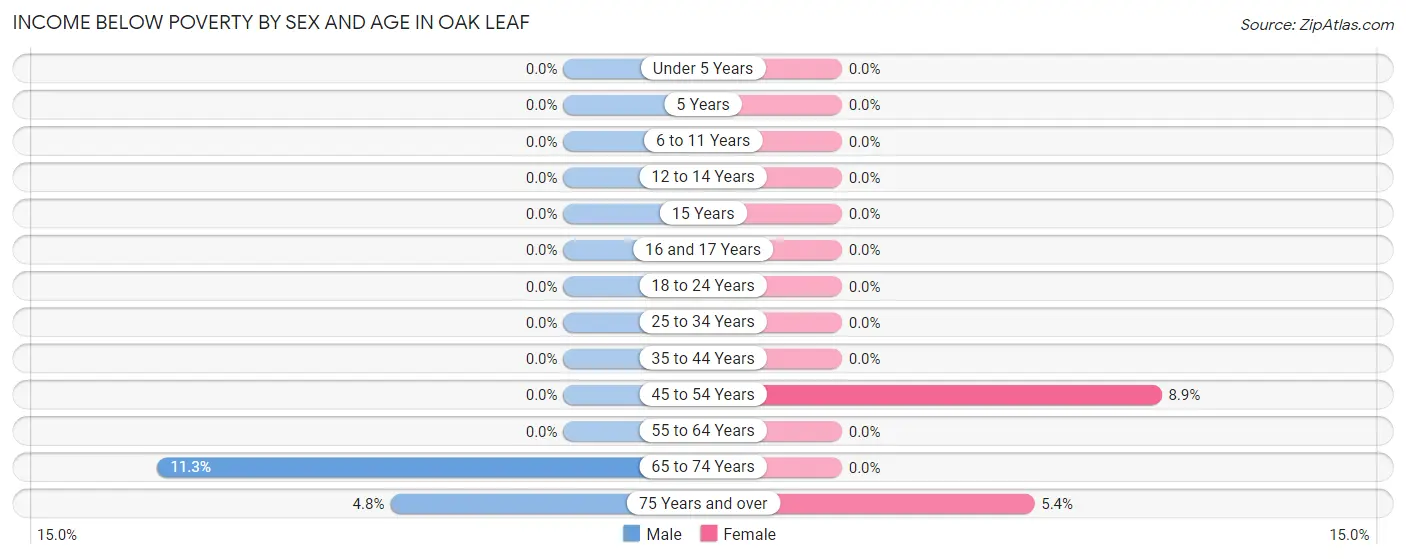
| Age Bracket | Male | Female |
| Under 5 Years | 0 (0.0%) | 0 (0.0%) |
| 5 Years | 0 (0.0%) | 0 (0.0%) |
| 6 to 11 Years | 0 (0.0%) | 0 (0.0%) |
| 12 to 14 Years | 0 (0.0%) | 0 (0.0%) |
| 15 Years | 0 (0.0%) | 0 (0.0%) |
| 16 and 17 Years | 0 (0.0%) | 0 (0.0%) |
| 18 to 24 Years | 0 (0.0%) | 0 (0.0%) |
| 25 to 34 Years | 0 (0.0%) | 0 (0.0%) |
| 35 to 44 Years | 0 (0.0%) | 0 (0.0%) |
| 45 to 54 Years | 0 (0.0%) | 13 (8.9%) |
| 55 to 64 Years | 0 (0.0%) | 0 (0.0%) |
| 65 to 74 Years | 13 (11.3%) | 0 (0.0%) |
| 75 Years and over | 4 (4.8%) | 3 (5.4%) |
| Total | 17 (2.0%) | 16 (2.0%) |
Income Above Poverty by Sex and Age in Oak Leaf
According to the poverty statistics in Oak Leaf, males aged under 5 years and females aged under 5 years are the age groups that are most secure financially, with 100.0% of males and 100.0% of females in these age groups living above the poverty line.
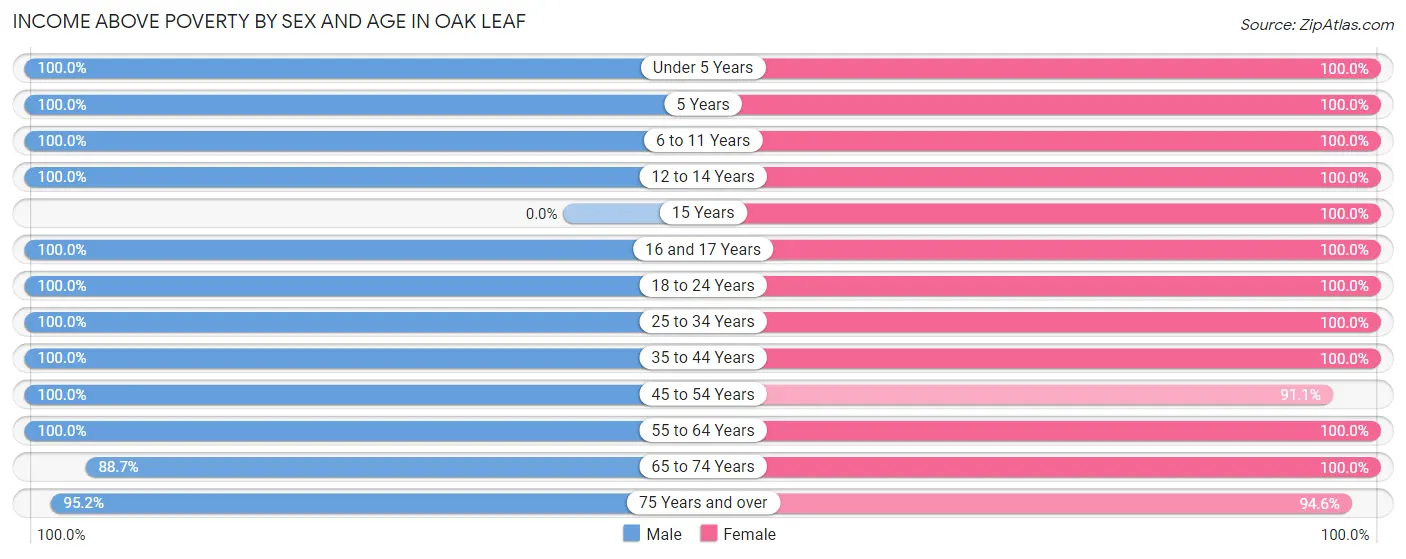
| Age Bracket | Male | Female |
| Under 5 Years | 24 (100.0%) | 11 (100.0%) |
| 5 Years | 11 (100.0%) | 4 (100.0%) |
| 6 to 11 Years | 87 (100.0%) | 32 (100.0%) |
| 12 to 14 Years | 15 (100.0%) | 14 (100.0%) |
| 15 Years | 0 (0.0%) | 2 (100.0%) |
| 16 and 17 Years | 51 (100.0%) | 24 (100.0%) |
| 18 to 24 Years | 65 (100.0%) | 120 (100.0%) |
| 25 to 34 Years | 41 (100.0%) | 41 (100.0%) |
| 35 to 44 Years | 64 (100.0%) | 84 (100.0%) |
| 45 to 54 Years | 194 (100.0%) | 133 (91.1%) |
| 55 to 64 Years | 96 (100.0%) | 139 (100.0%) |
| 65 to 74 Years | 102 (88.7%) | 134 (100.0%) |
| 75 Years and over | 79 (95.2%) | 53 (94.6%) |
| Total | 829 (98.0%) | 791 (98.0%) |
Income Below Poverty Among Married-Couple Families in Oak Leaf
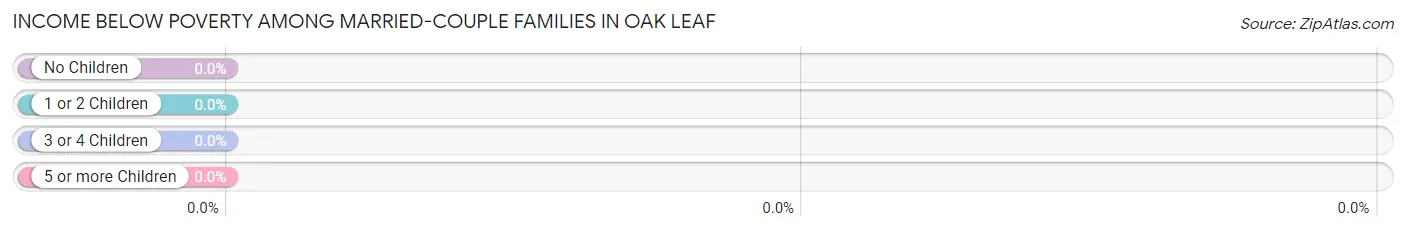
| Children | Above Poverty | Below Poverty |
| No Children | 303 (100.0%) | 0 (0.0%) |
| 1 or 2 Children | 113 (100.0%) | 0 (0.0%) |
| 3 or 4 Children | 23 (100.0%) | 0 (0.0%) |
| 5 or more Children | 1 (100.0%) | 0 (0.0%) |
| Total | 440 (100.0%) | 0 (0.0%) |
Income Below Poverty Among Single-Parent Households in Oak Leaf
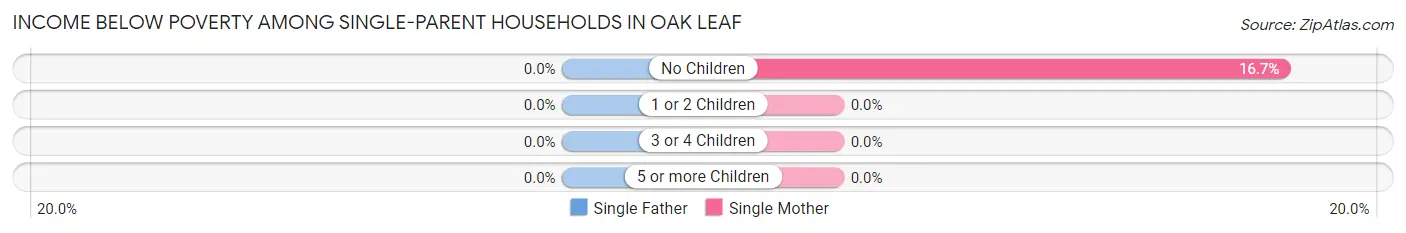
| Children | Single Father | Single Mother |
| No Children | 0 (0.0%) | 3 (16.7%) |
| 1 or 2 Children | 0 (0.0%) | 0 (0.0%) |
| 3 or 4 Children | 0 (0.0%) | 0 (0.0%) |
| 5 or more Children | 0 (0.0%) | 0 (0.0%) |
| Total | 0 (0.0%) | 3 (12.0%) |
Income Below Poverty Among Married-Couple vs Single-Parent Households in Oak Leaf
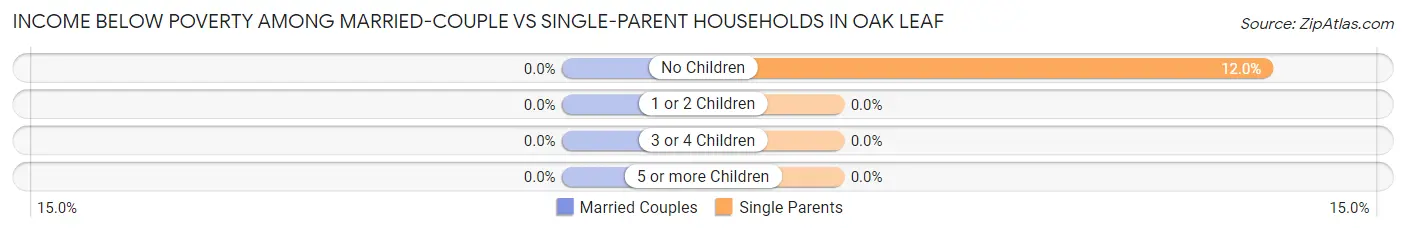
| Children | Married-Couple Families | Single-Parent Households |
| No Children | 0 (0.0%) | 3 (12.0%) |
| 1 or 2 Children | 0 (0.0%) | 0 (0.0%) |
| 3 or 4 Children | 0 (0.0%) | 0 (0.0%) |
| 5 or more Children | 0 (0.0%) | 0 (0.0%) |
| Total | 0 (0.0%) | 3 (6.1%) |
Race in Oak Leaf
The most populous races in Oak Leaf are White / Caucasian (1,244 | 75.3%), Hispanic or Latino (293 | 17.7%), and Black / African American (161 | 9.7%).
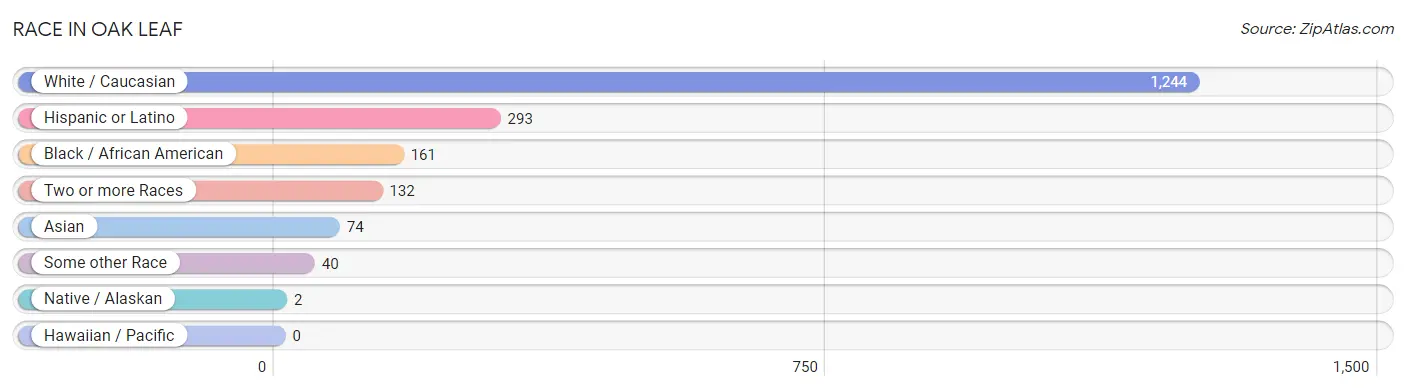
| Race | # Population | % Population |
| Asian | 74 | 4.5% |
| Black / African American | 161 | 9.7% |
| Hawaiian / Pacific | 0 | 0.0% |
| Hispanic or Latino | 293 | 17.7% |
| Native / Alaskan | 2 | 0.1% |
| White / Caucasian | 1,244 | 75.3% |
| Two or more Races | 132 | 8.0% |
| Some other Race | 40 | 2.4% |
| Total | 1,653 | 100.0% |
Ancestry in Oak Leaf
The most populous ancestries reported in Oak Leaf are English (289 | 17.5%), Mexican (285 | 17.2%), German (244 | 14.8%), Irish (161 | 9.7%), and Pakistani (70 | 4.2%), together accounting for 63.5% of all Oak Leaf residents.
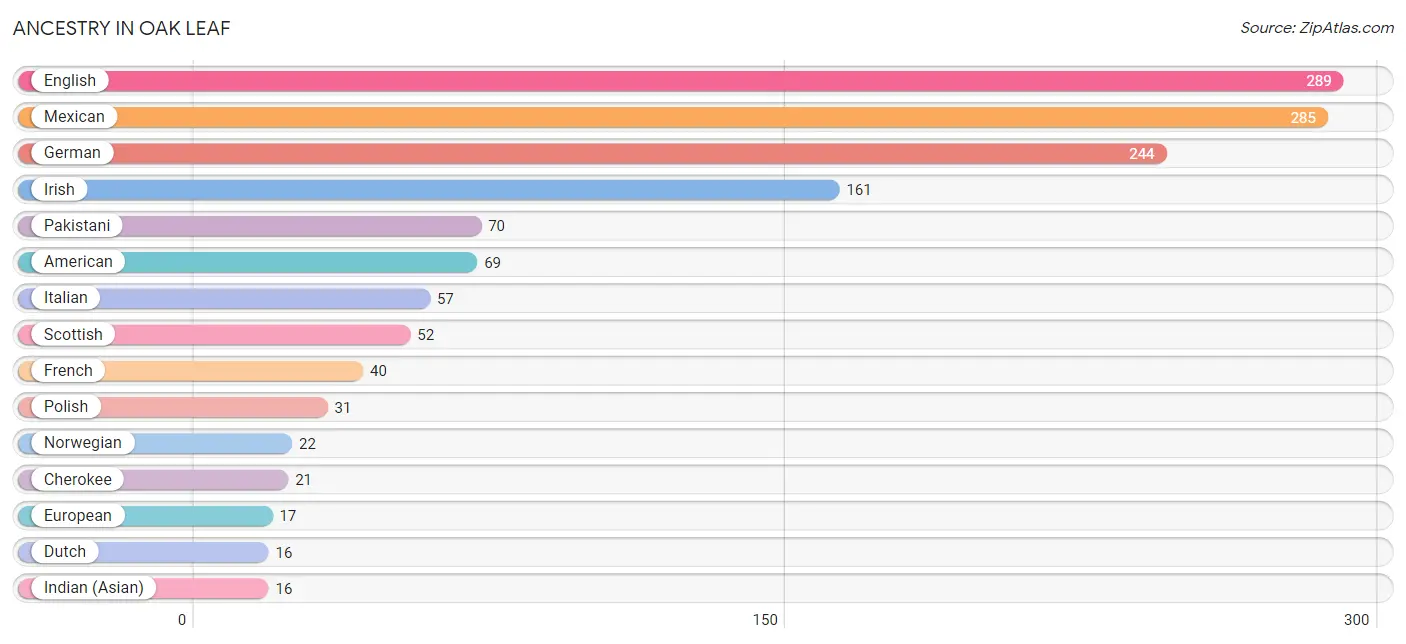
| Ancestry | # Population | % Population |
| Afghan | 5 | 0.3% |
| American | 69 | 4.2% |
| Apache | 2 | 0.1% |
| British | 3 | 0.2% |
| Central American | 3 | 0.2% |
| Cherokee | 21 | 1.3% |
| Choctaw | 5 | 0.3% |
| Czech | 11 | 0.7% |
| Czechoslovakian | 2 | 0.1% |
| Dutch | 16 | 1.0% |
| English | 289 | 17.5% |
| European | 17 | 1.0% |
| Filipino | 8 | 0.5% |
| French | 40 | 2.4% |
| French Canadian | 4 | 0.2% |
| German | 244 | 14.8% |
| Indian (Asian) | 16 | 1.0% |
| Irish | 161 | 9.7% |
| Italian | 57 | 3.5% |
| Korean | 2 | 0.1% |
| Mexican | 285 | 17.2% |
| Norwegian | 22 | 1.3% |
| Pakistani | 70 | 4.2% |
| Pennsylvania German | 3 | 0.2% |
| Polish | 31 | 1.9% |
| Russian | 3 | 0.2% |
| Salvadoran | 3 | 0.2% |
| Scotch-Irish | 7 | 0.4% |
| Scottish | 52 | 3.2% |
| Spanish | 5 | 0.3% |
| Thai | 14 | 0.9% | View All 31 Rows |
Immigrants in Oak Leaf
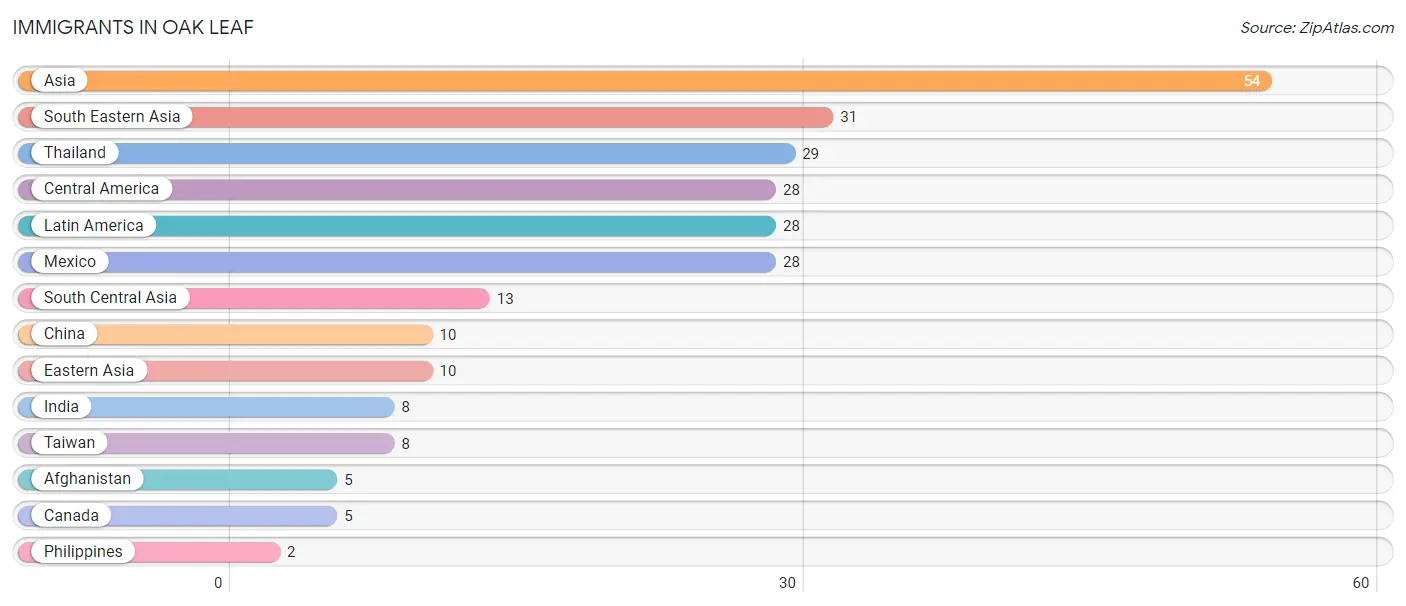
The most numerous immigrant groups reported in Oak Leaf came from Asia (54 | 3.3%), South Eastern Asia (31 | 1.9%), Thailand (29 | 1.8%), Central America (28 | 1.7%), and Latin America (28 | 1.7%), together accounting for 10.3% of all Oak Leaf residents.
| Immigration Origin | # Population | % Population |
| Afghanistan | 5 | 0.3% |
| Asia | 54 | 3.3% |
| Canada | 5 | 0.3% |
| Central America | 28 | 1.7% |
| China | 10 | 0.6% |
| Eastern Asia | 10 | 0.6% |
| India | 8 | 0.5% |
| Latin America | 28 | 1.7% |
| Mexico | 28 | 1.7% |
| Philippines | 2 | 0.1% |
| South Central Asia | 13 | 0.8% |
| South Eastern Asia | 31 | 1.9% |
| Taiwan | 8 | 0.5% |
| Thailand | 29 | 1.8% | View All 14 Rows |
Sex and Age in Oak Leaf
Sex and Age in Oak Leaf
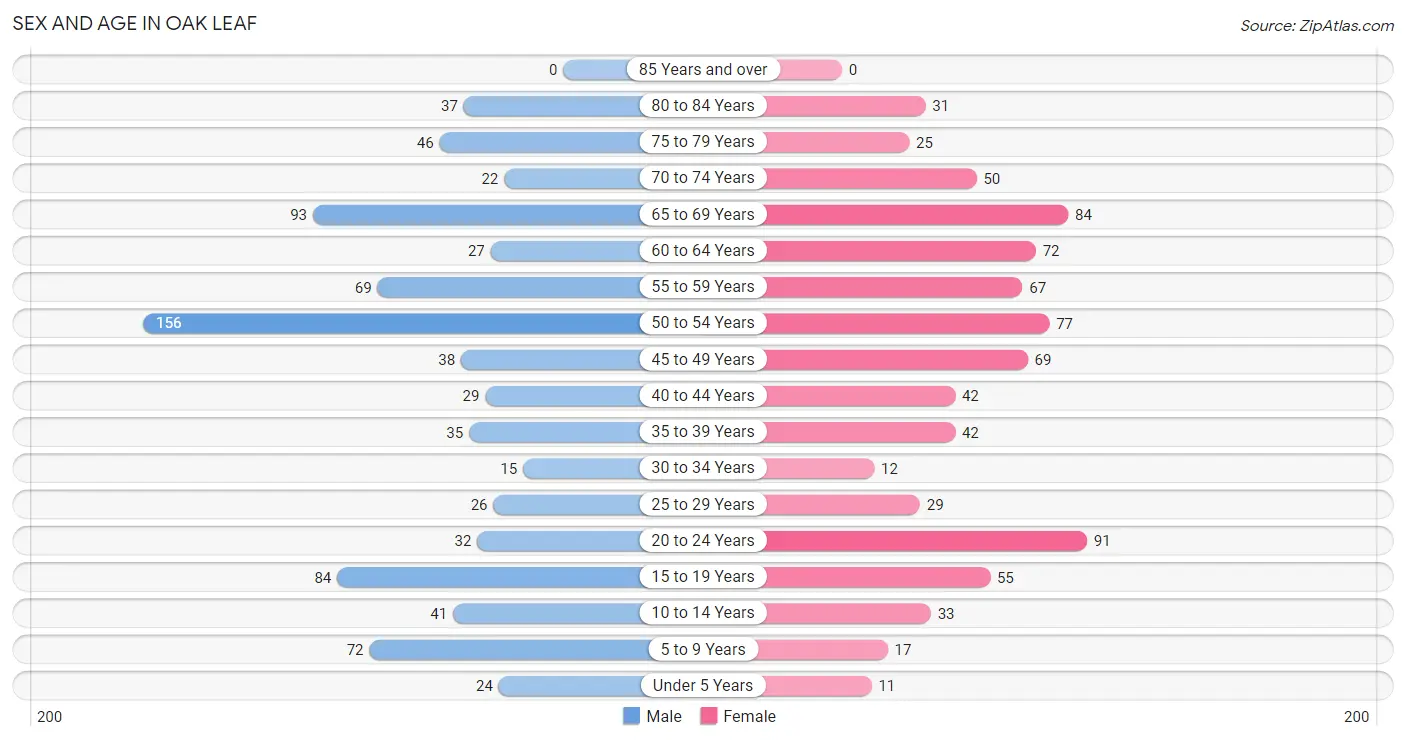
The most populous age groups in Oak Leaf are 50 to 54 Years (156 | 18.4%) for men and 20 to 24 Years (91 | 11.3%) for women.
| Age Bracket | Male | Female |
| Under 5 Years | 24 (2.8%) | 11 (1.4%) |
| 5 to 9 Years | 72 (8.5%) | 17 (2.1%) |
| 10 to 14 Years | 41 (4.9%) | 33 (4.1%) |
| 15 to 19 Years | 84 (9.9%) | 55 (6.8%) |
| 20 to 24 Years | 32 (3.8%) | 91 (11.3%) |
| 25 to 29 Years | 26 (3.1%) | 29 (3.6%) |
| 30 to 34 Years | 15 (1.8%) | 12 (1.5%) |
| 35 to 39 Years | 35 (4.1%) | 42 (5.2%) |
| 40 to 44 Years | 29 (3.4%) | 42 (5.2%) |
| 45 to 49 Years | 38 (4.5%) | 69 (8.6%) |
| 50 to 54 Years | 156 (18.4%) | 77 (9.5%) |
| 55 to 59 Years | 69 (8.2%) | 67 (8.3%) |
| 60 to 64 Years | 27 (3.2%) | 72 (8.9%) |
| 65 to 69 Years | 93 (11.0%) | 84 (10.4%) |
| 70 to 74 Years | 22 (2.6%) | 50 (6.2%) |
| 75 to 79 Years | 46 (5.4%) | 25 (3.1%) |
| 80 to 84 Years | 37 (4.4%) | 31 (3.8%) |
| 85 Years and over | 0 (0.0%) | 0 (0.0%) |
| Total | 846 (100.0%) | 807 (100.0%) |
Families and Households in Oak Leaf
Median Family Size in Oak Leaf
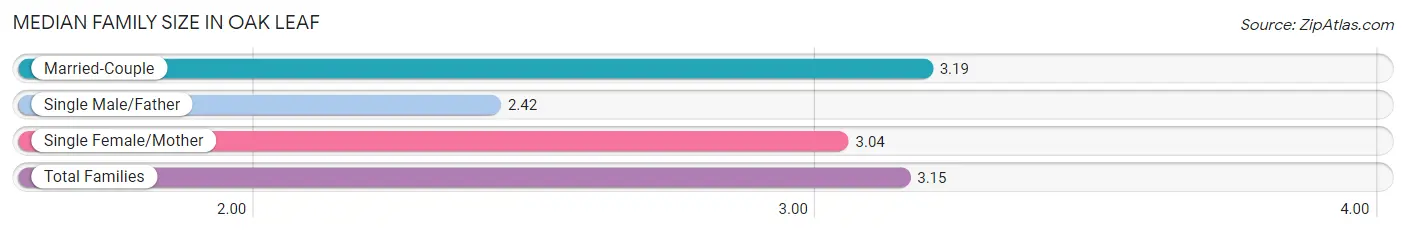
The median family size in Oak Leaf is 3.15 persons per family, with married-couple families (440 | 90.0%) accounting for the largest median family size of 3.19 persons per family. On the other hand, single male/father families (24 | 4.9%) represent the smallest median family size with 2.42 persons per family.
| Family Type | # Families | Family Size |
| Married-Couple | 440 (90.0%) | 3.19 |
| Single Male/Father | 24 (4.9%) | 2.42 |
| Single Female/Mother | 25 (5.1%) | 3.04 |
| Total Families | 489 (100.0%) | 3.15 |
Median Household Size in Oak Leaf
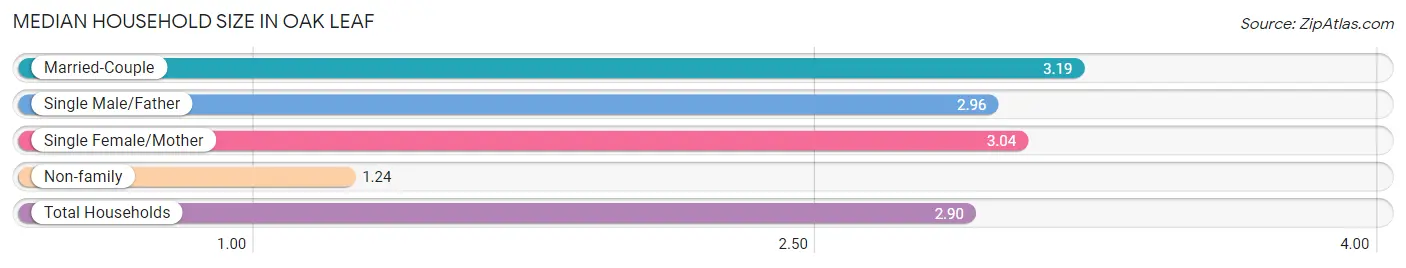
The median household size in Oak Leaf is 2.90 persons per household, with married-couple households (440 | 77.3%) accounting for the largest median household size of 3.19 persons per household. non-family households (80 | 14.1%) represent the smallest median household size with 1.24 persons per household.
| Household Type | # Households | Household Size |
| Married-Couple | 440 (77.3%) | 3.19 |
| Single Male/Father | 24 (4.2%) | 2.96 |
| Single Female/Mother | 25 (4.4%) | 3.04 |
| Non-family | 80 (14.1%) | 1.24 |
| Total Households | 569 (100.0%) | 2.90 |
Household Size by Marriage Status in Oak Leaf
Out of a total of 569 households in Oak Leaf, 489 (85.9%) are family households, while 80 (14.1%) are nonfamily households. The most numerous type of family households are 2-person households, comprising 234, and the most common type of nonfamily households are 1-person households, comprising 60.
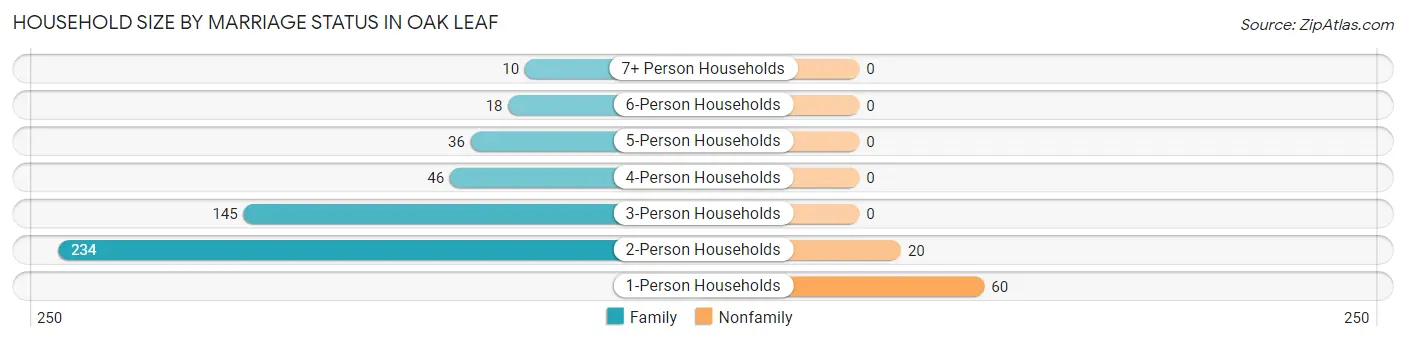
| Household Size | Family Households | Nonfamily Households |
| 1-Person Households | - | 60 (10.5%) |
| 2-Person Households | 234 (41.1%) | 20 (3.5%) |
| 3-Person Households | 145 (25.5%) | 0 (0.0%) |
| 4-Person Households | 46 (8.1%) | 0 (0.0%) |
| 5-Person Households | 36 (6.3%) | 0 (0.0%) |
| 6-Person Households | 18 (3.2%) | 0 (0.0%) |
| 7+ Person Households | 10 (1.8%) | 0 (0.0%) |
| Total | 489 (85.9%) | 80 (14.1%) |
Female Fertility in Oak Leaf
Fertility by Age in Oak Leaf
Average fertility rate in Oak Leaf is 16.0 births per 1,000 women. Women in the age bracket of 20 to 34 years have the highest fertility rate with 45.0 births per 1,000 women. Women in the age bracket of 20 to 34 years acount for 100.0% of all women with births.
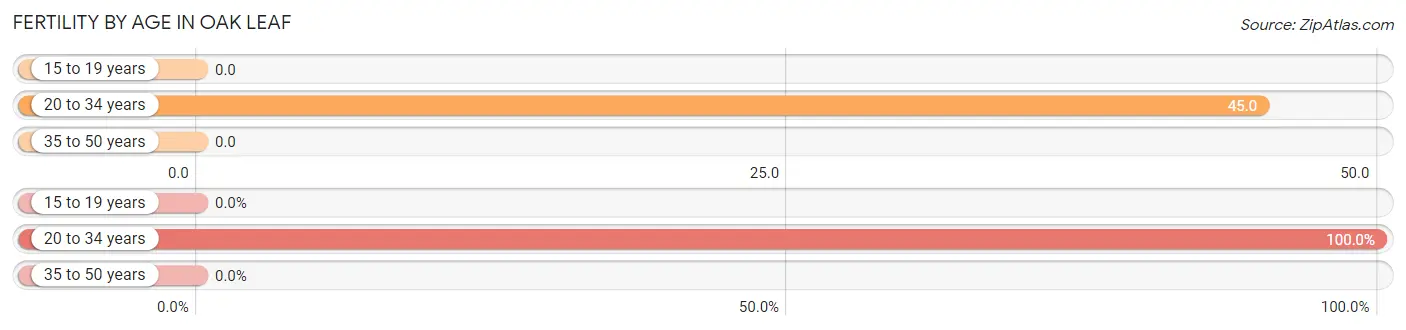
| Age Bracket | Women with Births | Births / 1,000 Women |
| 15 to 19 years | 0 (0.0%) | 0.0 |
| 20 to 34 years | 6 (100.0%) | 45.0 |
| 35 to 50 years | 0 (0.0%) | 0.0 |
| Total | 6 (100.0%) | 16.0 |
Fertility by Age by Marriage Status in Oak Leaf
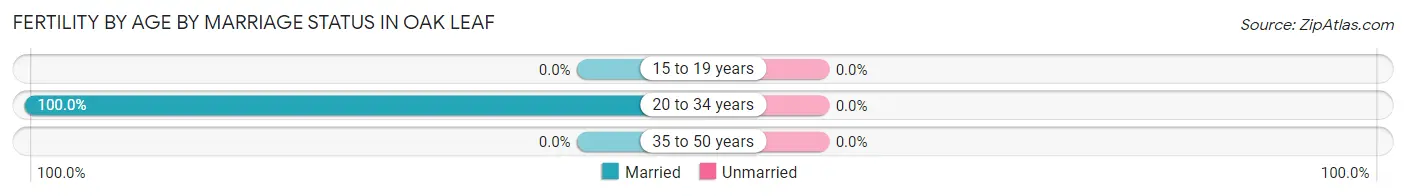
| Age Bracket | Married | Unmarried |
| 15 to 19 years | 0 (0.0%) | 0 (0.0%) |
| 20 to 34 years | 6 (100.0%) | 0 (0.0%) |
| 35 to 50 years | 0 (0.0%) | 0 (0.0%) |
| Total | 6 (100.0%) | 0 (0.0%) |
Fertility by Education in Oak Leaf
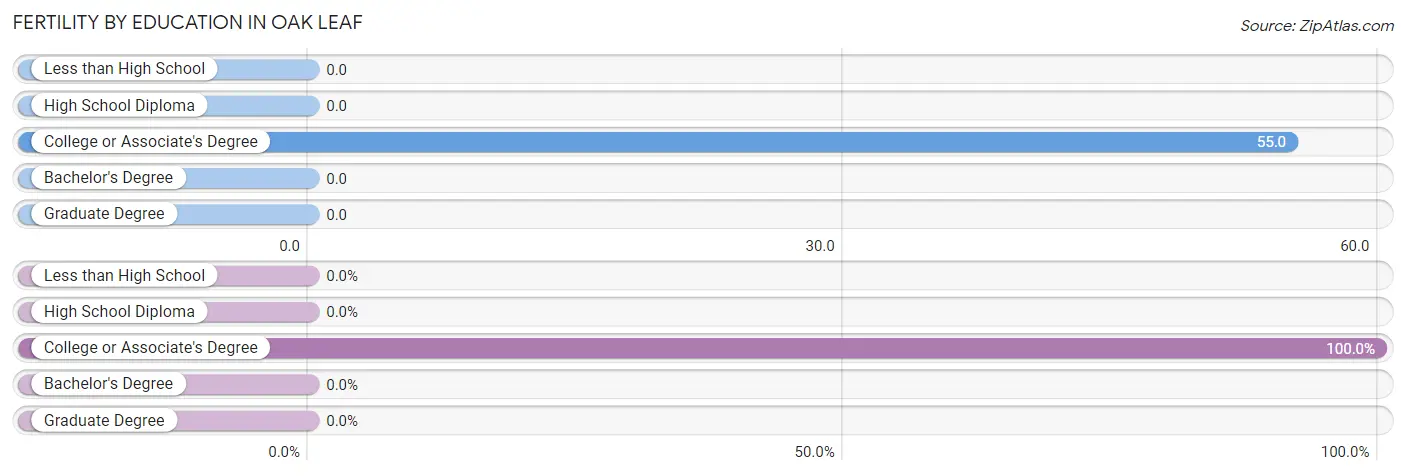
| Educational Attainment | Women with Births | Births / 1,000 Women |
| Less than High School | 0 (0.0%) | 0.0 |
| High School Diploma | 0 (0.0%) | 0.0 |
| College or Associate's Degree | 6 (100.0%) | 55.0 |
| Bachelor's Degree | 0 (0.0%) | 0.0 |
| Graduate Degree | 0 (0.0%) | 0.0 |
| Total | 6 (100.0%) | 16.0 |
Fertility by Education by Marriage Status in Oak Leaf
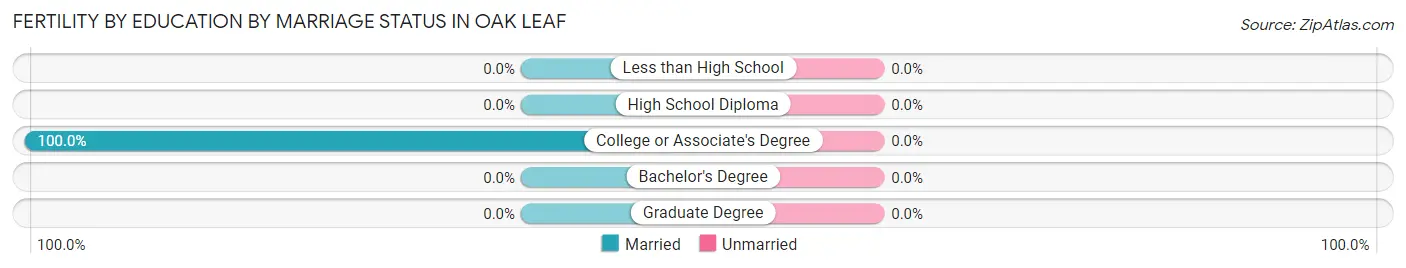
| Educational Attainment | Married | Unmarried |
| Less than High School | 0 (0.0%) | 0 (0.0%) |
| High School Diploma | 0 (0.0%) | 0 (0.0%) |
| College or Associate's Degree | 6 (100.0%) | 0 (0.0%) |
| Bachelor's Degree | 0 (0.0%) | 0 (0.0%) |
| Graduate Degree | 0 (0.0%) | 0 (0.0%) |
| Total | 6 (100.0%) | 0 (0.0%) |
Employment Characteristics in Oak Leaf
Employment by Class of Employer in Oak Leaf
Among the 813 employed individuals in Oak Leaf, private company employees (521 | 64.1%), local government employees (82 | 10.1%), and self-employed (not incorporated) (71 | 8.7%) make up the most common classes of employment.
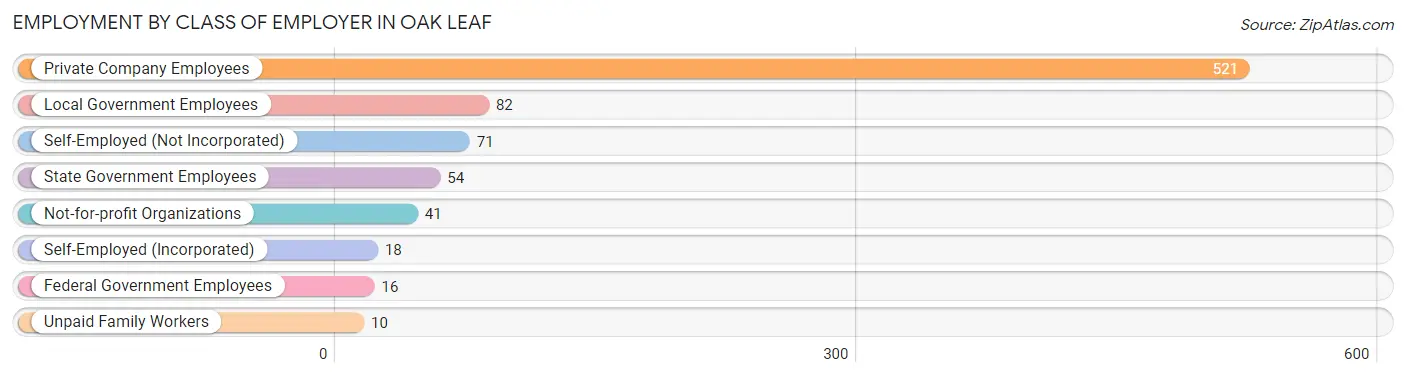
| Employer Class | # Employees | % Employees |
| Private Company Employees | 521 | 64.1% |
| Self-Employed (Incorporated) | 18 | 2.2% |
| Self-Employed (Not Incorporated) | 71 | 8.7% |
| Not-for-profit Organizations | 41 | 5.0% |
| Local Government Employees | 82 | 10.1% |
| State Government Employees | 54 | 6.6% |
| Federal Government Employees | 16 | 2.0% |
| Unpaid Family Workers | 10 | 1.2% |
| Total | 813 | 100.0% |
Employment Status by Age in Oak Leaf
According to the labor force statistics for Oak Leaf, out of the total population over 16 years of age (1,453), 60.2% or 875 individuals are in the labor force, with 6.9% or 60 of them unemployed. The age group with the highest labor force participation rate is 55 to 59 years, with 92.6% or 126 individuals in the labor force. Within the labor force, the 20 to 24 years age range has the highest percentage of unemployed individuals, with 38.0% or 41 of them being unemployed.
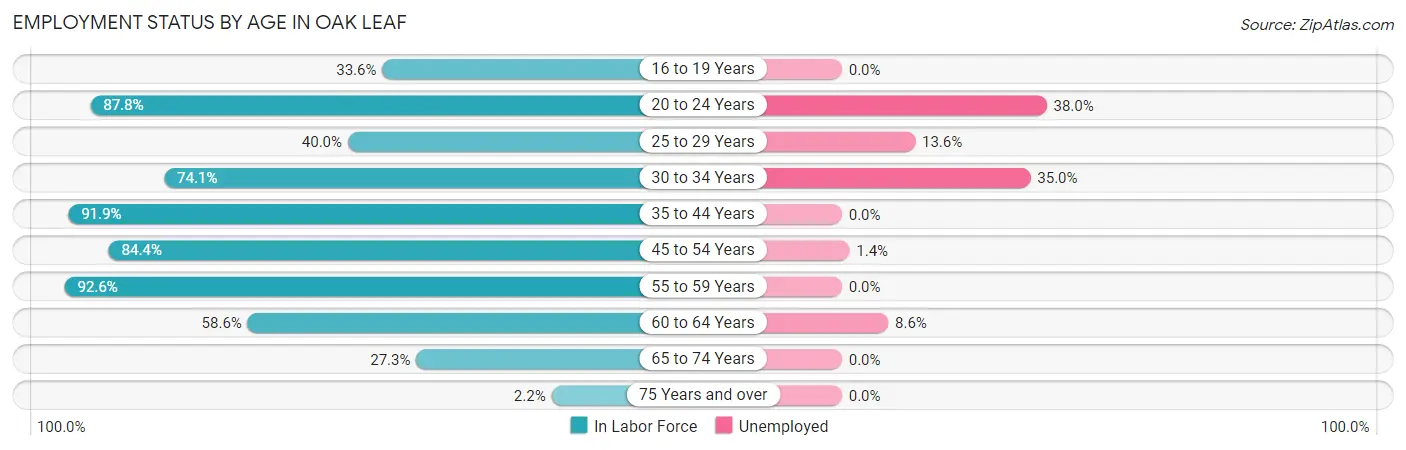
| Age Bracket | In Labor Force | Unemployed |
| 16 to 19 Years | 46 (33.6%) | 0 (0.0%) |
| 20 to 24 Years | 108 (87.8%) | 41 (38.0%) |
| 25 to 29 Years | 22 (40.0%) | 3 (13.6%) |
| 30 to 34 Years | 20 (74.1%) | 7 (35.0%) |
| 35 to 44 Years | 136 (91.9%) | 0 (0.0%) |
| 45 to 54 Years | 287 (84.4%) | 4 (1.4%) |
| 55 to 59 Years | 126 (92.6%) | 0 (0.0%) |
| 60 to 64 Years | 58 (58.6%) | 5 (8.6%) |
| 65 to 74 Years | 68 (27.3%) | 0 (0.0%) |
| 75 Years and over | 3 (2.2%) | 0 (0.0%) |
| Total | 875 (60.2%) | 60 (6.9%) |
Employment Status by Educational Attainment in Oak Leaf
According to labor force statistics for Oak Leaf, 80.6% of individuals (649) out of the total population between 25 and 64 years of age (805) are in the labor force, with 2.9% or 19 of them being unemployed. The group with the highest labor force participation rate are those with the educational attainment of bachelor's degree or higher, with 87.6% or 289 individuals in the labor force. Within the labor force, individuals with less than high school education have the highest percentage of unemployment, with 25.0% or 4 of them being unemployed.
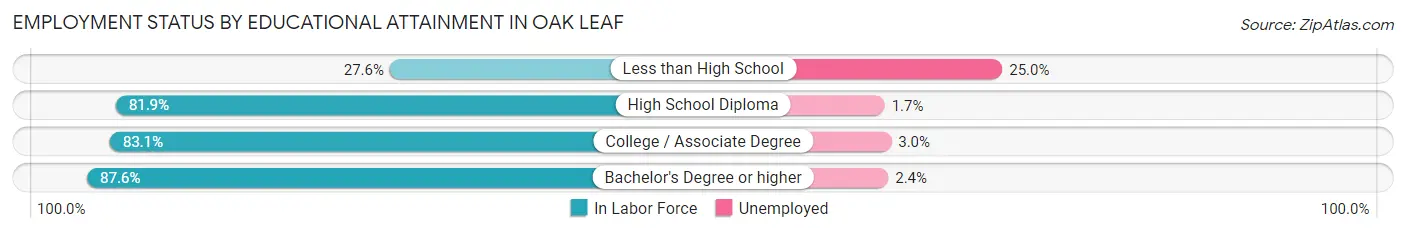
| Educational Attainment | In Labor Force | Unemployed |
| Less than High School | 16 (27.6%) | 14 (25.0%) |
| High School Diploma | 177 (81.9%) | 4 (1.7%) |
| College / Associate Degree | 167 (83.1%) | 6 (3.0%) |
| Bachelor's Degree or higher | 289 (87.6%) | 8 (2.4%) |
| Total | 649 (80.6%) | 23 (2.9%) |
Employment Occupations by Sex in Oak Leaf
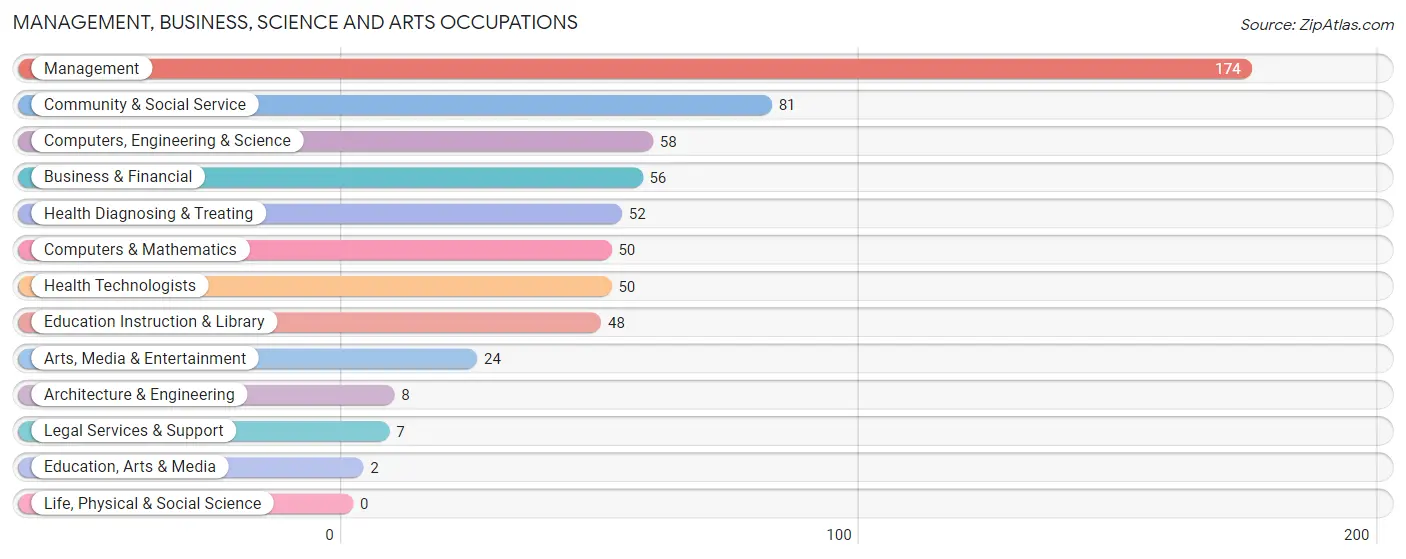
Management, Business, Science and Arts Occupations
The most common Management, Business, Science and Arts occupations in Oak Leaf are Management (174 | 21.4%), Community & Social Service (81 | 10.0%), Computers, Engineering & Science (58 | 7.1%), Business & Financial (56 | 6.9%), and Health Diagnosing & Treating (52 | 6.4%).
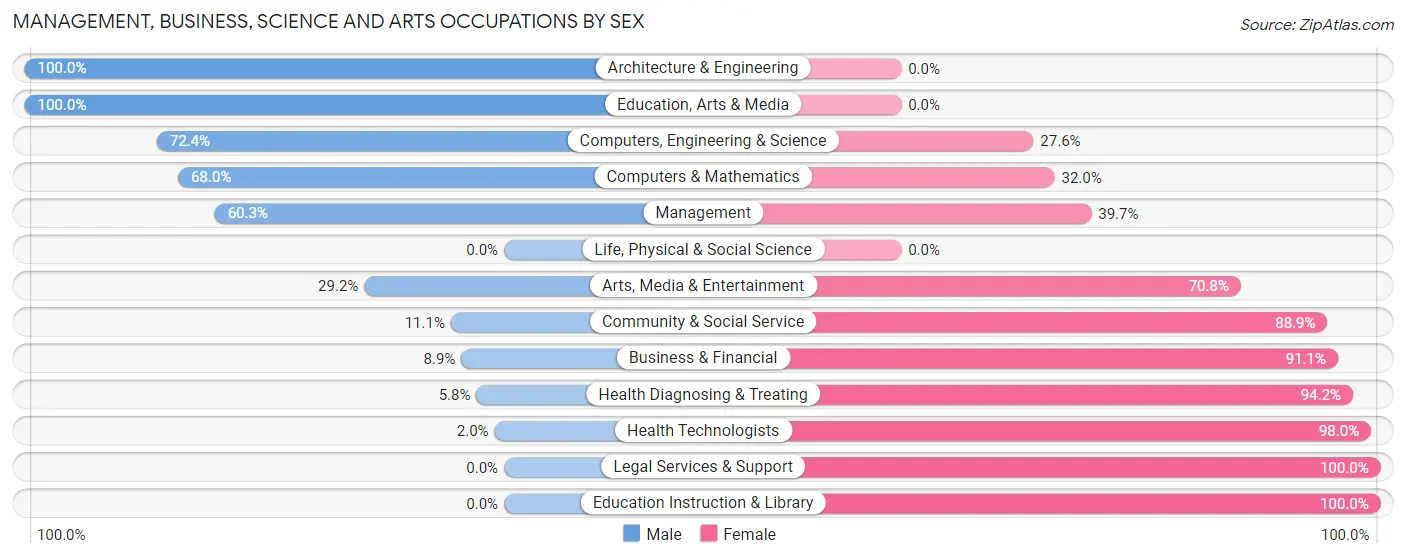
Management, Business, Science and Arts Occupations by Sex
Within the Management, Business, Science and Arts occupations in Oak Leaf, the most male-oriented occupations are Architecture & Engineering (100.0%), Education, Arts & Media (100.0%), and Computers, Engineering & Science (72.4%), while the most female-oriented occupations are Legal Services & Support (100.0%), Education Instruction & Library (100.0%), and Health Technologists (98.0%).
| Occupation | Male | Female |
| Management | 105 (60.3%) | 69 (39.7%) |
| Business & Financial | 5 (8.9%) | 51 (91.1%) |
| Computers, Engineering & Science | 42 (72.4%) | 16 (27.6%) |
| Computers & Mathematics | 34 (68.0%) | 16 (32.0%) |
| Architecture & Engineering | 8 (100.0%) | 0 (0.0%) |
| Life, Physical & Social Science | 0 (0.0%) | 0 (0.0%) |
| Community & Social Service | 9 (11.1%) | 72 (88.9%) |
| Education, Arts & Media | 2 (100.0%) | 0 (0.0%) |
| Legal Services & Support | 0 (0.0%) | 7 (100.0%) |
| Education Instruction & Library | 0 (0.0%) | 48 (100.0%) |
| Arts, Media & Entertainment | 7 (29.2%) | 17 (70.8%) |
| Health Diagnosing & Treating | 3 (5.8%) | 49 (94.2%) |
| Health Technologists | 1 (2.0%) | 49 (98.0%) |
| Total (Category) | 164 (39.0%) | 257 (61.1%) |
| Total (Overall) | 417 (51.2%) | 397 (48.8%) |
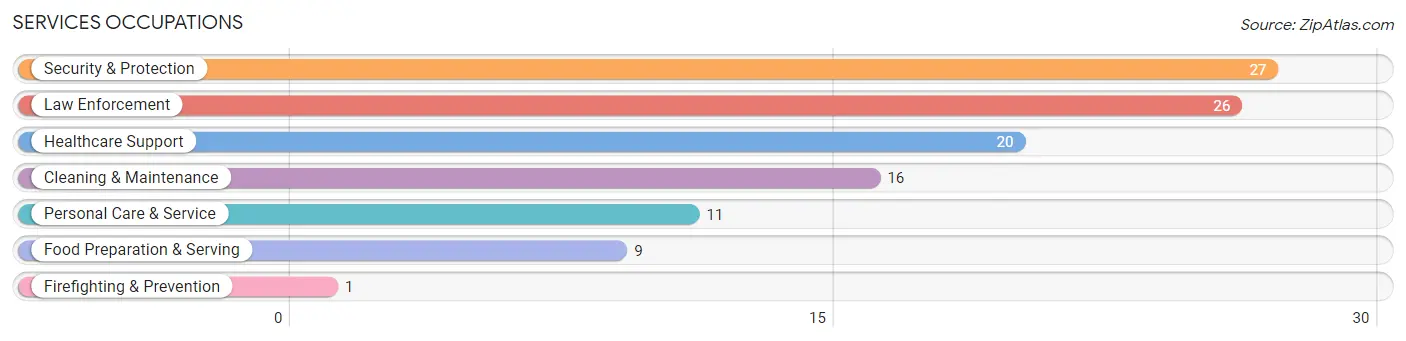
Services Occupations
The most common Services occupations in Oak Leaf are Security & Protection (27 | 3.3%), Law Enforcement (26 | 3.2%), Healthcare Support (20 | 2.5%), Cleaning & Maintenance (16 | 2.0%), and Personal Care & Service (11 | 1.3%).
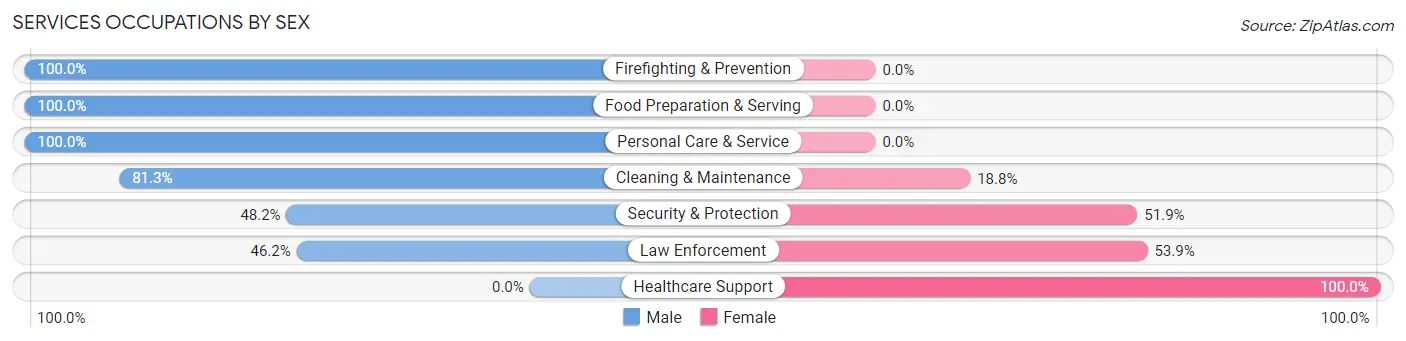
Services Occupations by Sex
Within the Services occupations in Oak Leaf, the most male-oriented occupations are Firefighting & Prevention (100.0%), Food Preparation & Serving (100.0%), and Personal Care & Service (100.0%), while the most female-oriented occupations are Healthcare Support (100.0%), Law Enforcement (53.8%), and Security & Protection (51.8%).
| Occupation | Male | Female |
| Healthcare Support | 0 (0.0%) | 20 (100.0%) |
| Security & Protection | 13 (48.1%) | 14 (51.8%) |
| Firefighting & Prevention | 1 (100.0%) | 0 (0.0%) |
| Law Enforcement | 12 (46.2%) | 14 (53.8%) |
| Food Preparation & Serving | 9 (100.0%) | 0 (0.0%) |
| Cleaning & Maintenance | 13 (81.2%) | 3 (18.8%) |
| Personal Care & Service | 11 (100.0%) | 0 (0.0%) |
| Total (Category) | 46 (55.4%) | 37 (44.6%) |
| Total (Overall) | 417 (51.2%) | 397 (48.8%) |
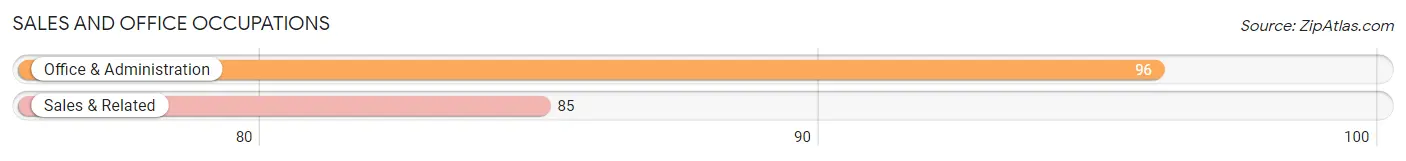
Sales and Office Occupations
The most common Sales and Office occupations in Oak Leaf are Office & Administration (96 | 11.8%), and Sales & Related (85 | 10.4%).
Sales and Office Occupations by Sex
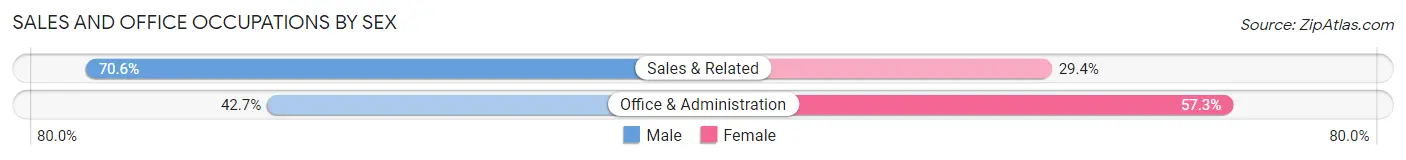
| Occupation | Male | Female |
| Sales & Related | 60 (70.6%) | 25 (29.4%) |
| Office & Administration | 41 (42.7%) | 55 (57.3%) |
| Total (Category) | 101 (55.8%) | 80 (44.2%) |
| Total (Overall) | 417 (51.2%) | 397 (48.8%) |
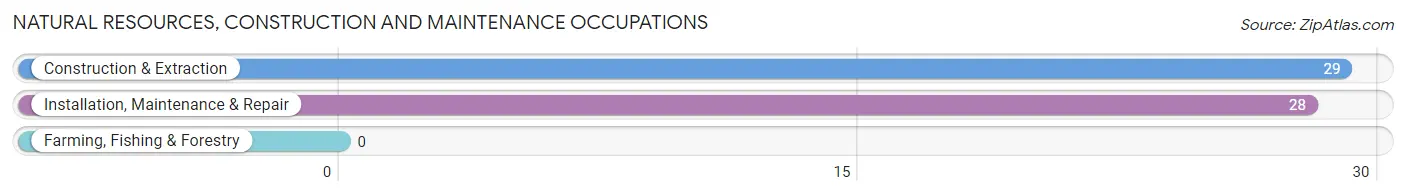
Natural Resources, Construction and Maintenance Occupations
The most common Natural Resources, Construction and Maintenance occupations in Oak Leaf are Construction & Extraction (29 | 3.6%), and Installation, Maintenance & Repair (28 | 3.4%).
Natural Resources, Construction and Maintenance Occupations by Sex
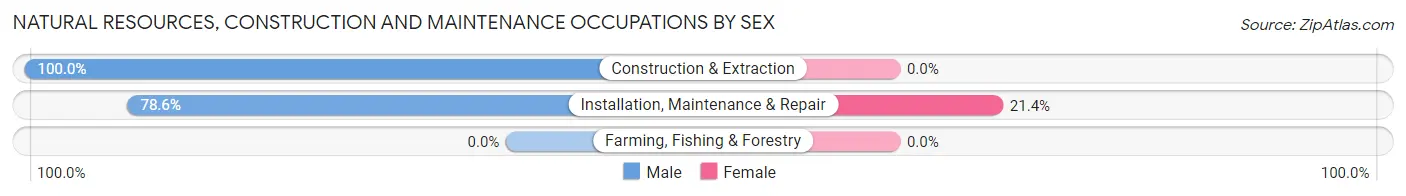
| Occupation | Male | Female |
| Farming, Fishing & Forestry | 0 (0.0%) | 0 (0.0%) |
| Construction & Extraction | 29 (100.0%) | 0 (0.0%) |
| Installation, Maintenance & Repair | 22 (78.6%) | 6 (21.4%) |
| Total (Category) | 51 (89.5%) | 6 (10.5%) |
| Total (Overall) | 417 (51.2%) | 397 (48.8%) |
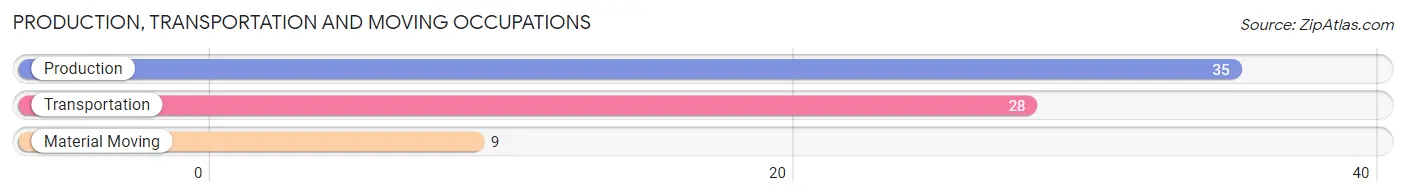
Production, Transportation and Moving Occupations
The most common Production, Transportation and Moving occupations in Oak Leaf are Production (35 | 4.3%), Transportation (28 | 3.4%), and Material Moving (9 | 1.1%).
Production, Transportation and Moving Occupations by Sex
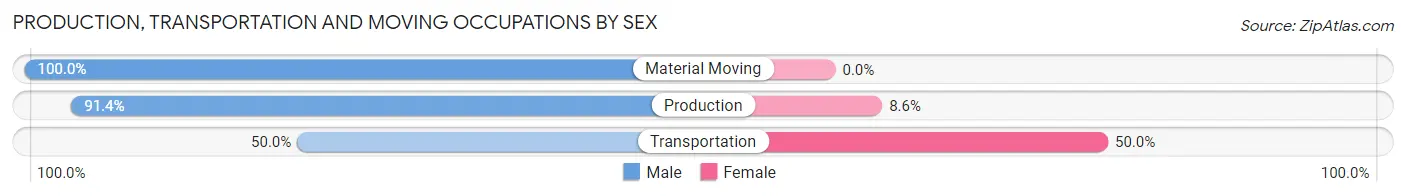
| Occupation | Male | Female |
| Production | 32 (91.4%) | 3 (8.6%) |
| Transportation | 14 (50.0%) | 14 (50.0%) |
| Material Moving | 9 (100.0%) | 0 (0.0%) |
| Total (Category) | 55 (76.4%) | 17 (23.6%) |
| Total (Overall) | 417 (51.2%) | 397 (48.8%) |
Employment Industries by Sex in Oak Leaf
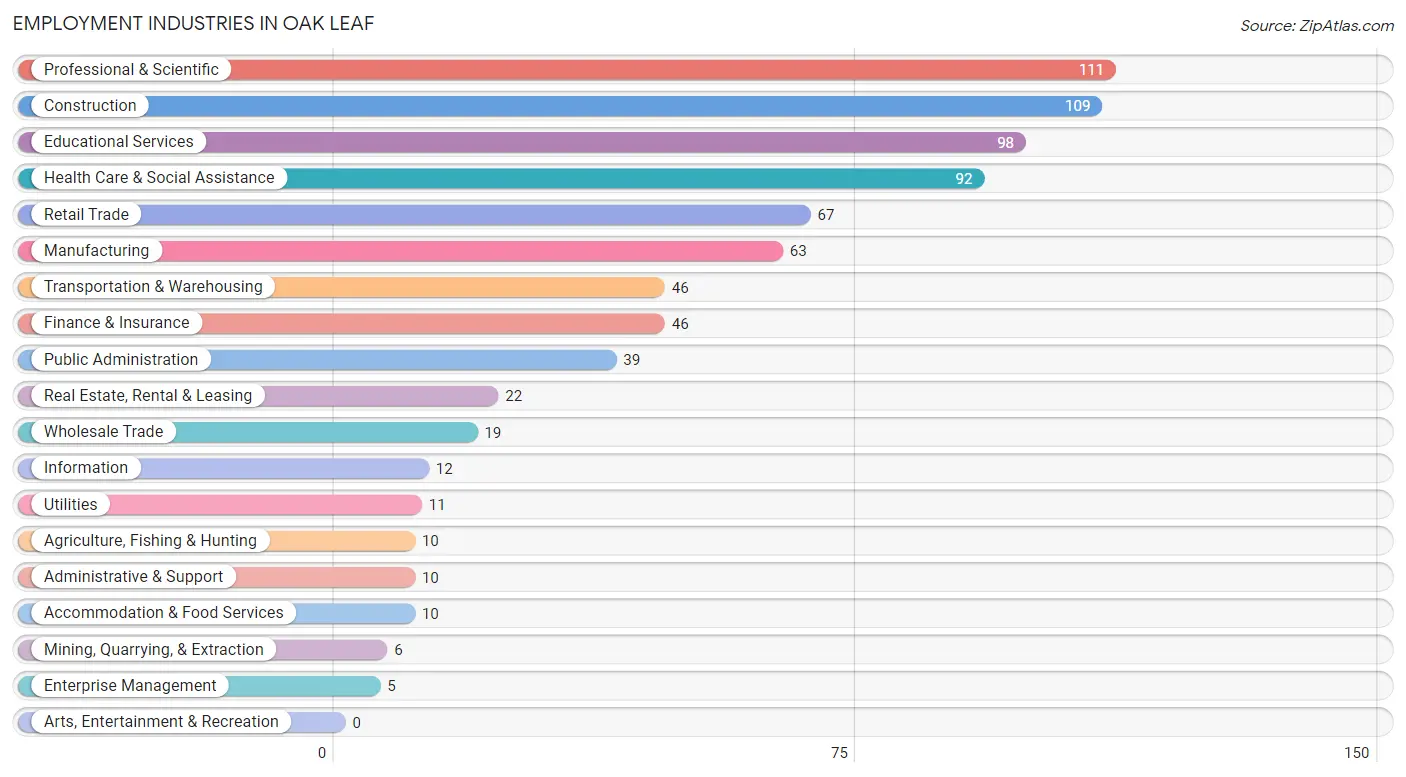
Employment Industries in Oak Leaf
The major employment industries in Oak Leaf include Professional & Scientific (111 | 13.6%), Construction (109 | 13.4%), Educational Services (98 | 12.0%), Health Care & Social Assistance (92 | 11.3%), and Retail Trade (67 | 8.2%).
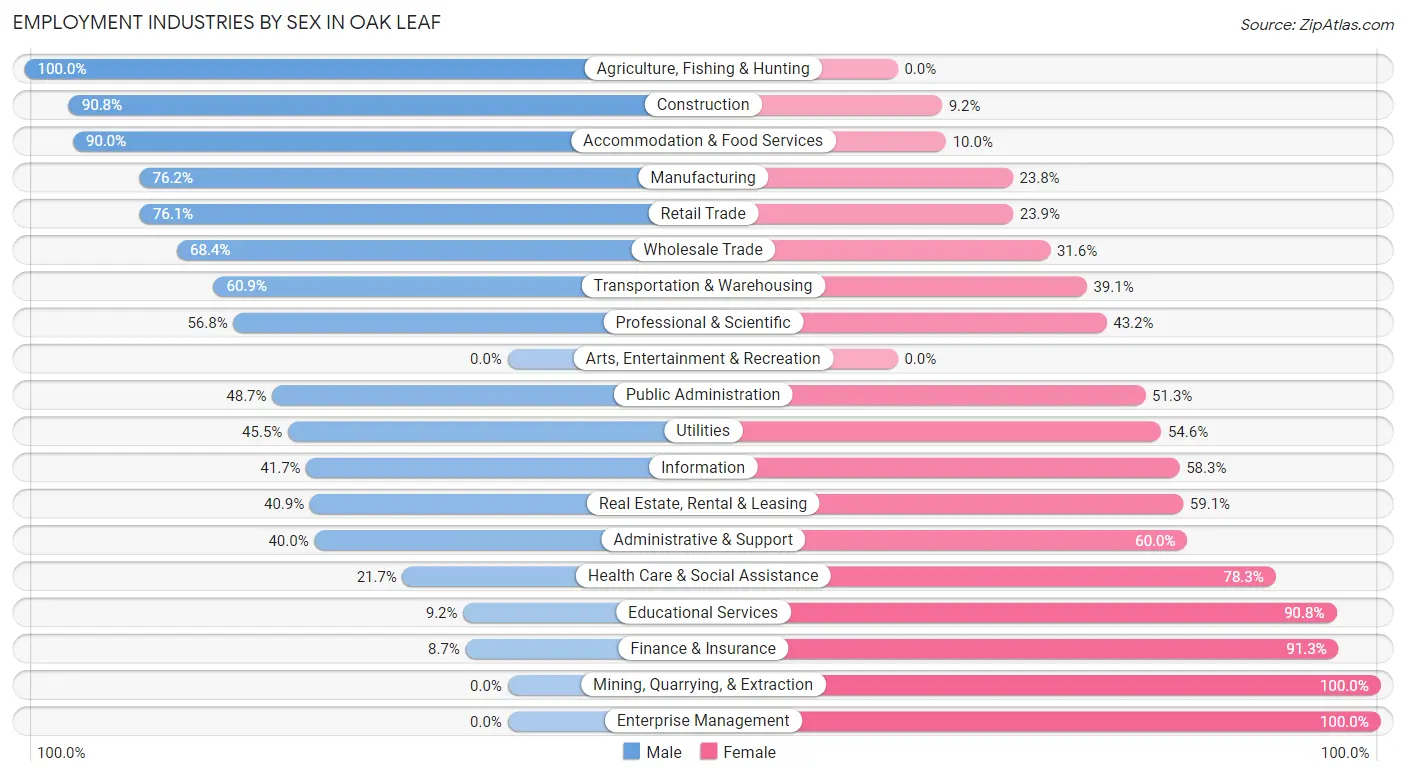
Employment Industries by Sex in Oak Leaf
The Oak Leaf industries that see more men than women are Agriculture, Fishing & Hunting (100.0%), Construction (90.8%), and Accommodation & Food Services (90.0%), whereas the industries that tend to have a higher number of women are Mining, Quarrying, & Extraction (100.0%), Enterprise Management (100.0%), and Finance & Insurance (91.3%).
| Industry | Male | Female |
| Agriculture, Fishing & Hunting | 10 (100.0%) | 0 (0.0%) |
| Mining, Quarrying, & Extraction | 0 (0.0%) | 6 (100.0%) |
| Construction | 99 (90.8%) | 10 (9.2%) |
| Manufacturing | 48 (76.2%) | 15 (23.8%) |
| Wholesale Trade | 13 (68.4%) | 6 (31.6%) |
| Retail Trade | 51 (76.1%) | 16 (23.9%) |
| Transportation & Warehousing | 28 (60.9%) | 18 (39.1%) |
| Utilities | 5 (45.5%) | 6 (54.5%) |
| Information | 5 (41.7%) | 7 (58.3%) |
| Finance & Insurance | 4 (8.7%) | 42 (91.3%) |
| Real Estate, Rental & Leasing | 9 (40.9%) | 13 (59.1%) |
| Professional & Scientific | 63 (56.8%) | 48 (43.2%) |
| Enterprise Management | 0 (0.0%) | 5 (100.0%) |
| Administrative & Support | 4 (40.0%) | 6 (60.0%) |
| Educational Services | 9 (9.2%) | 89 (90.8%) |
| Health Care & Social Assistance | 20 (21.7%) | 72 (78.3%) |
| Arts, Entertainment & Recreation | 0 (0.0%) | 0 (0.0%) |
| Accommodation & Food Services | 9 (90.0%) | 1 (10.0%) |
| Public Administration | 19 (48.7%) | 20 (51.3%) |
| Total | 417 (51.2%) | 397 (48.8%) |
Education in Oak Leaf
School Enrollment in Oak Leaf
The most common levels of schooling among the 384 students in Oak Leaf are college / undergraduate (119 | 31.0%), high school (88 | 22.9%), and middle school (66 | 17.2%).
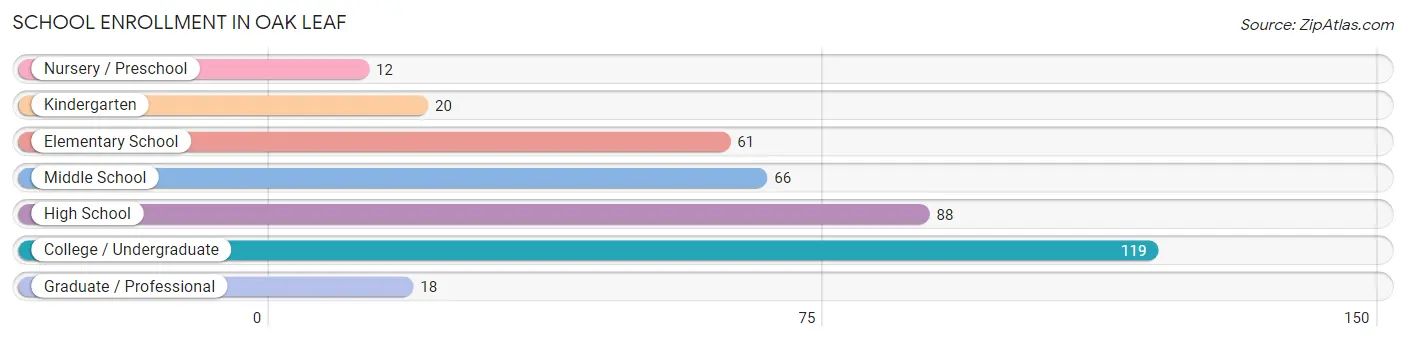
| School Level | # Students | % Students |
| Nursery / Preschool | 12 | 3.1% |
| Kindergarten | 20 | 5.2% |
| Elementary School | 61 | 15.9% |
| Middle School | 66 | 17.2% |
| High School | 88 | 22.9% |
| College / Undergraduate | 119 | 31.0% |
| Graduate / Professional | 18 | 4.7% |
| Total | 384 | 100.0% |
School Enrollment by Age by Funding Source in Oak Leaf
Out of a total of 384 students who are enrolled in schools in Oak Leaf, 92 (24.0%) attend a private institution, while the remaining 292 (76.0%) are enrolled in public schools. The age group of 25 to 34 year olds has the highest likelihood of being enrolled in private schools, with 4 (66.7% in the age bracket) enrolled. Conversely, the age group of 15 to 17 year olds has the lowest likelihood of being enrolled in a private school, with 74 (96.1% in the age bracket) attending a public institution.
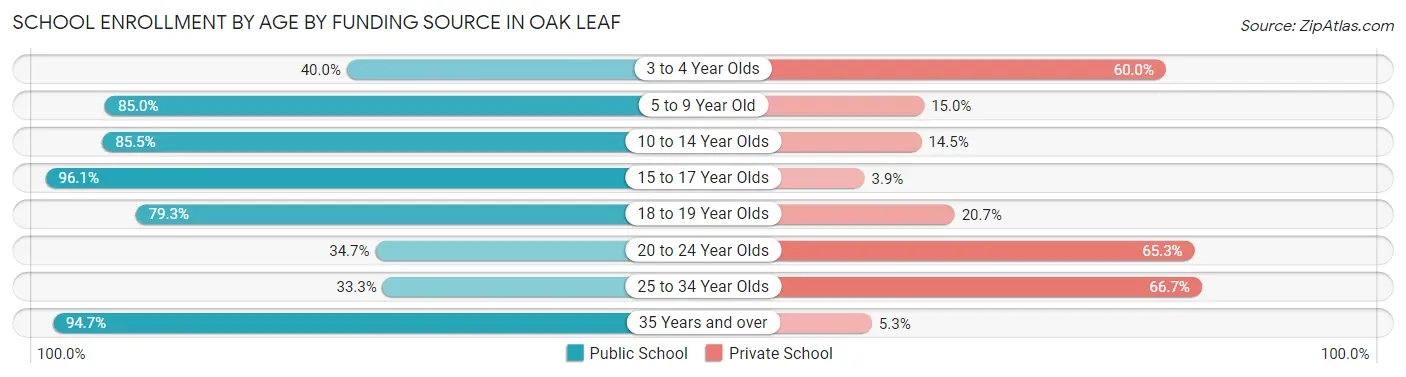
| Age Bracket | Public School | Private School |
| 3 to 4 Year Olds | 4 (40.0%) | 6 (60.0%) |
| 5 to 9 Year Old | 68 (85.0%) | 12 (15.0%) |
| 10 to 14 Year Olds | 59 (85.5%) | 10 (14.5%) |
| 15 to 17 Year Olds | 74 (96.1%) | 3 (3.9%) |
| 18 to 19 Year Olds | 23 (79.3%) | 6 (20.7%) |
| 20 to 24 Year Olds | 26 (34.7%) | 49 (65.3%) |
| 25 to 34 Year Olds | 2 (33.3%) | 4 (66.7%) |
| 35 Years and over | 36 (94.7%) | 2 (5.3%) |
| Total | 292 (76.0%) | 92 (24.0%) |
Educational Attainment by Field of Study in Oak Leaf
Business (135 | 26.8%), science & technology (62 | 12.3%), education (60 | 11.9%), arts & humanities (60 | 11.9%), and computers & mathematics (41 | 8.2%) are the most common fields of study among 503 individuals in Oak Leaf who have obtained a bachelor's degree or higher.
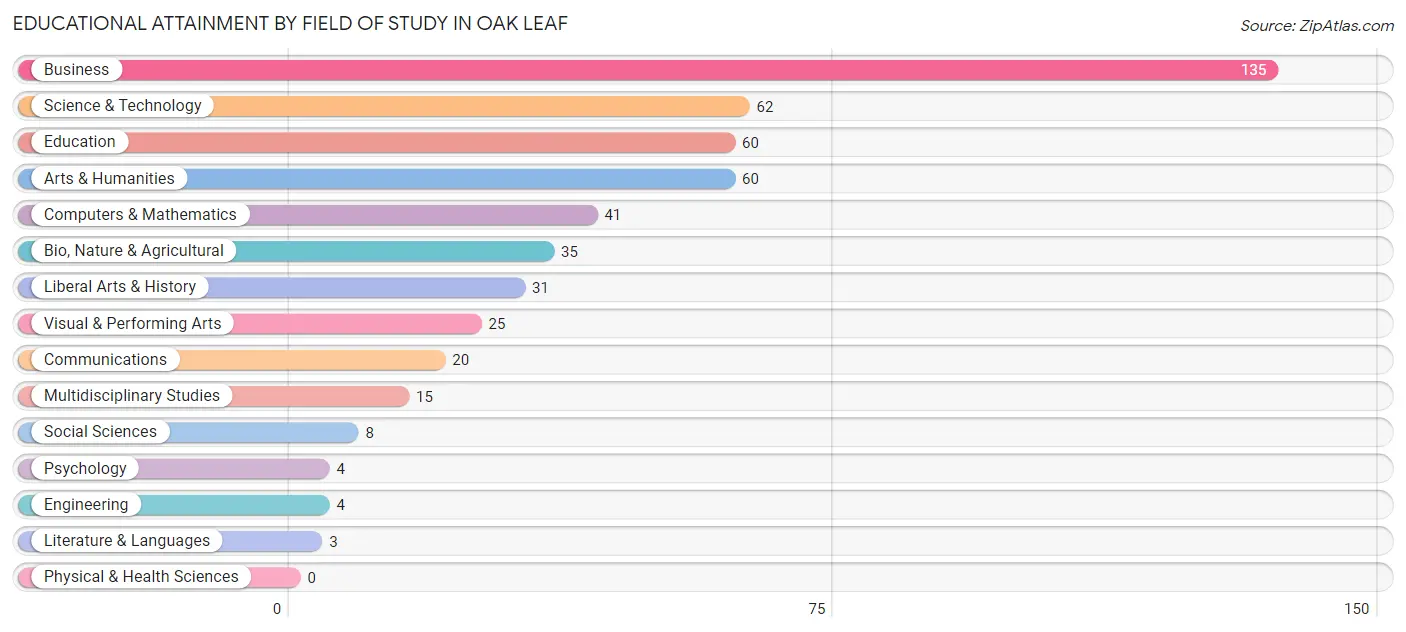
| Field of Study | # Graduates | % Graduates |
| Computers & Mathematics | 41 | 8.2% |
| Bio, Nature & Agricultural | 35 | 7.0% |
| Physical & Health Sciences | 0 | 0.0% |
| Psychology | 4 | 0.8% |
| Social Sciences | 8 | 1.6% |
| Engineering | 4 | 0.8% |
| Multidisciplinary Studies | 15 | 3.0% |
| Science & Technology | 62 | 12.3% |
| Business | 135 | 26.8% |
| Education | 60 | 11.9% |
| Literature & Languages | 3 | 0.6% |
| Liberal Arts & History | 31 | 6.2% |
| Visual & Performing Arts | 25 | 5.0% |
| Communications | 20 | 4.0% |
| Arts & Humanities | 60 | 11.9% |
| Total | 503 | 100.0% |
Transportation & Commute in Oak Leaf
Vehicle Availability by Sex in Oak Leaf
The most prevalent vehicle ownership categories in Oak Leaf are males with 3 vehicles (123, accounting for 29.6%) and females with 3 vehicles (123, making up 31.1%).
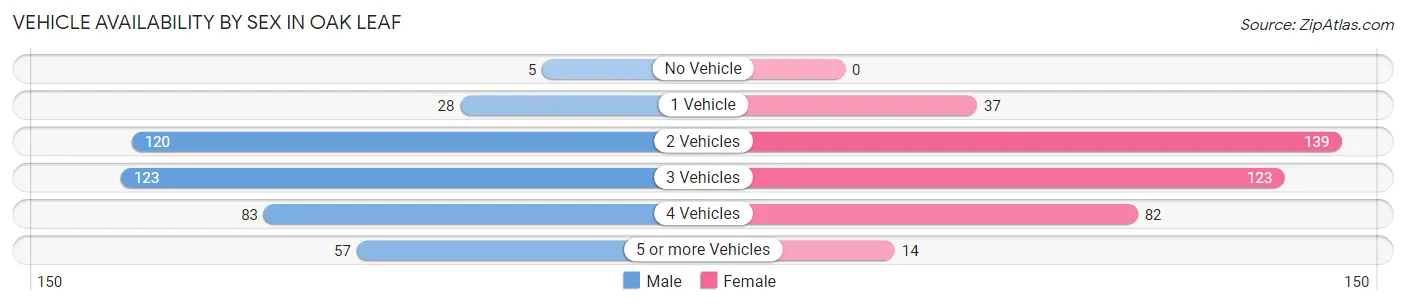
| Vehicles Available | Male | Female |
| No Vehicle | 5 (1.2%) | 0 (0.0%) |
| 1 Vehicle | 28 (6.7%) | 37 (9.4%) |
| 2 Vehicles | 120 (28.8%) | 139 (35.2%) |
| 3 Vehicles | 123 (29.6%) | 123 (31.1%) |
| 4 Vehicles | 83 (20.0%) | 82 (20.8%) |
| 5 or more Vehicles | 57 (13.7%) | 14 (3.5%) |
| Total | 416 (100.0%) | 395 (100.0%) |
Commute Time in Oak Leaf
The most frequently occuring commute durations in Oak Leaf are 30 to 34 minutes (131 commuters, 19.8%), 45 to 59 minutes (116 commuters, 17.5%), and 60 to 89 minutes (86 commuters, 13.0%).
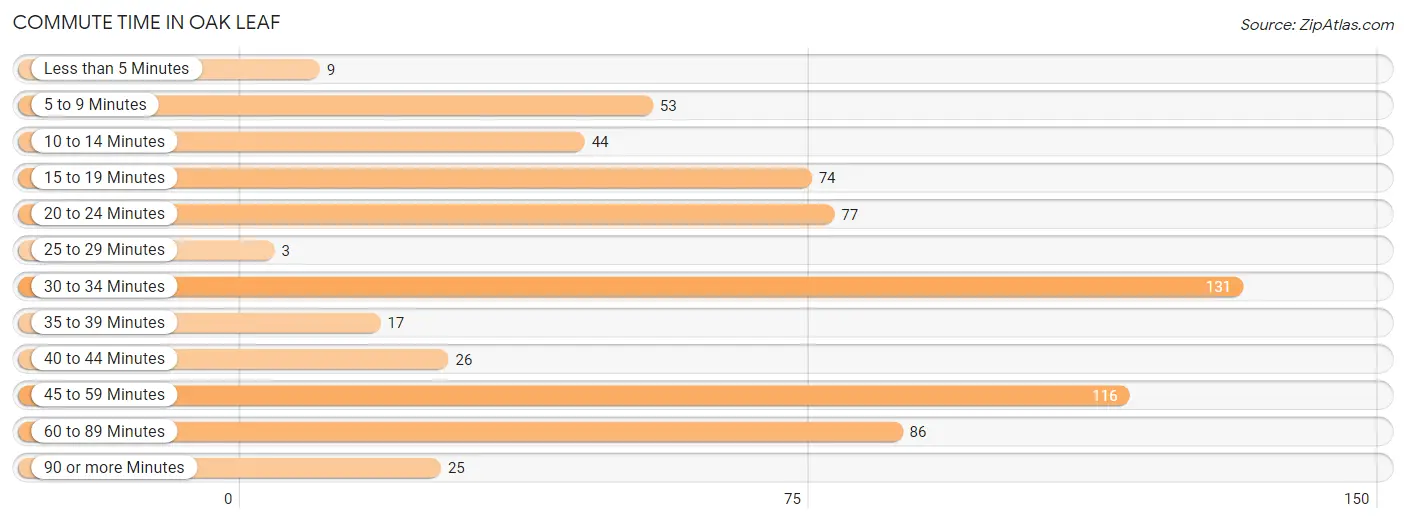
| Commute Time | # Commuters | % Commuters |
| Less than 5 Minutes | 9 | 1.4% |
| 5 to 9 Minutes | 53 | 8.0% |
| 10 to 14 Minutes | 44 | 6.7% |
| 15 to 19 Minutes | 74 | 11.2% |
| 20 to 24 Minutes | 77 | 11.7% |
| 25 to 29 Minutes | 3 | 0.4% |
| 30 to 34 Minutes | 131 | 19.8% |
| 35 to 39 Minutes | 17 | 2.6% |
| 40 to 44 Minutes | 26 | 3.9% |
| 45 to 59 Minutes | 116 | 17.5% |
| 60 to 89 Minutes | 86 | 13.0% |
| 90 or more Minutes | 25 | 3.8% |
Commute Time by Sex in Oak Leaf
The most common commute times in Oak Leaf are 60 to 89 minutes (78 commuters, 22.8%) for males and 30 to 34 minutes (81 commuters, 25.4%) for females.
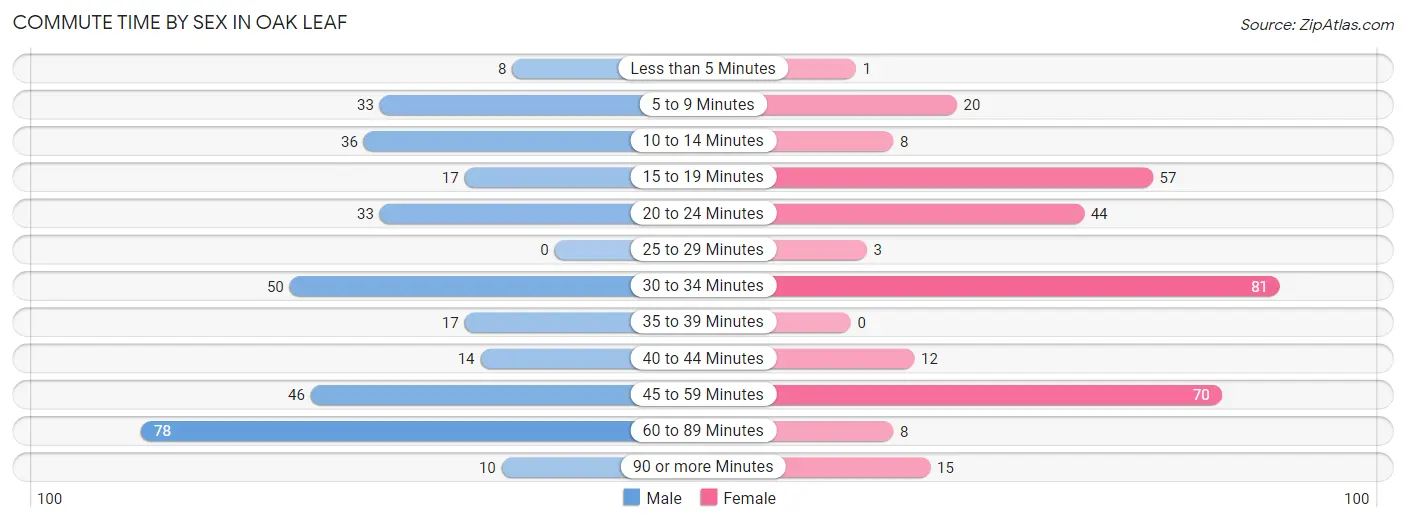
| Commute Time | Male | Female |
| Less than 5 Minutes | 8 (2.3%) | 1 (0.3%) |
| 5 to 9 Minutes | 33 (9.7%) | 20 (6.3%) |
| 10 to 14 Minutes | 36 (10.5%) | 8 (2.5%) |
| 15 to 19 Minutes | 17 (5.0%) | 57 (17.9%) |
| 20 to 24 Minutes | 33 (9.7%) | 44 (13.8%) |
| 25 to 29 Minutes | 0 (0.0%) | 3 (0.9%) |
| 30 to 34 Minutes | 50 (14.6%) | 81 (25.4%) |
| 35 to 39 Minutes | 17 (5.0%) | 0 (0.0%) |
| 40 to 44 Minutes | 14 (4.1%) | 12 (3.8%) |
| 45 to 59 Minutes | 46 (13.5%) | 70 (21.9%) |
| 60 to 89 Minutes | 78 (22.8%) | 8 (2.5%) |
| 90 or more Minutes | 10 (2.9%) | 15 (4.7%) |
Time of Departure to Work by Sex in Oak Leaf
The most frequent times of departure to work in Oak Leaf are 8:00 AM to 8:29 AM (55, 16.1%) for males and 7:00 AM to 7:29 AM (66, 20.7%) for females.
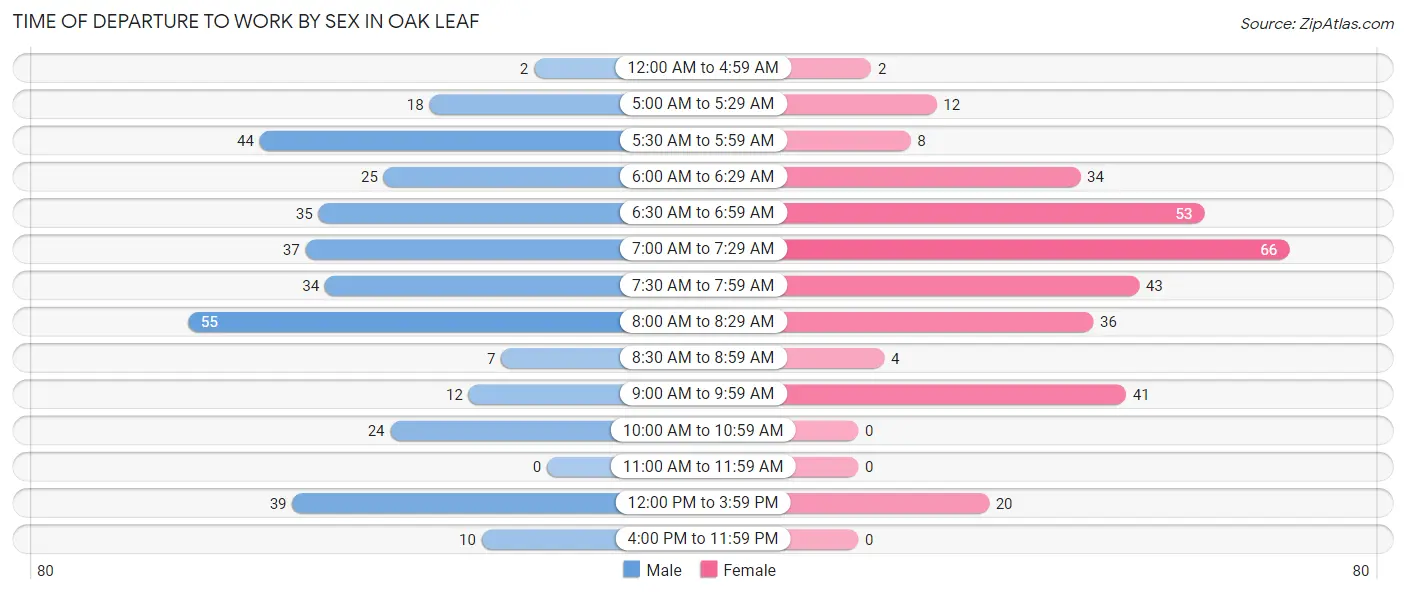
| Time of Departure | Male | Female |
| 12:00 AM to 4:59 AM | 2 (0.6%) | 2 (0.6%) |
| 5:00 AM to 5:29 AM | 18 (5.3%) | 12 (3.8%) |
| 5:30 AM to 5:59 AM | 44 (12.9%) | 8 (2.5%) |
| 6:00 AM to 6:29 AM | 25 (7.3%) | 34 (10.7%) |
| 6:30 AM to 6:59 AM | 35 (10.2%) | 53 (16.6%) |
| 7:00 AM to 7:29 AM | 37 (10.8%) | 66 (20.7%) |
| 7:30 AM to 7:59 AM | 34 (9.9%) | 43 (13.5%) |
| 8:00 AM to 8:29 AM | 55 (16.1%) | 36 (11.3%) |
| 8:30 AM to 8:59 AM | 7 (2.1%) | 4 (1.3%) |
| 9:00 AM to 9:59 AM | 12 (3.5%) | 41 (12.9%) |
| 10:00 AM to 10:59 AM | 24 (7.0%) | 0 (0.0%) |
| 11:00 AM to 11:59 AM | 0 (0.0%) | 0 (0.0%) |
| 12:00 PM to 3:59 PM | 39 (11.4%) | 20 (6.3%) |
| 4:00 PM to 11:59 PM | 10 (2.9%) | 0 (0.0%) |
| Total | 342 (100.0%) | 319 (100.0%) |
Housing Occupancy in Oak Leaf
Occupancy by Ownership in Oak Leaf
Of the total 569 dwellings in Oak Leaf, owner-occupied units account for 541 (95.1%), while renter-occupied units make up 28 (4.9%).
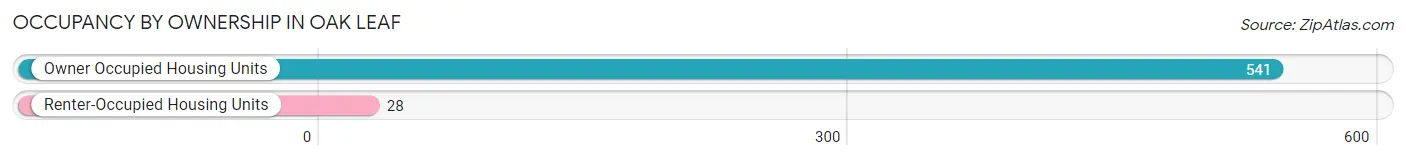
| Occupancy | # Housing Units | % Housing Units |
| Owner Occupied Housing Units | 541 | 95.1% |
| Renter-Occupied Housing Units | 28 | 4.9% |
| Total Occupied Housing Units | 569 | 100.0% |
Occupancy by Household Size in Oak Leaf
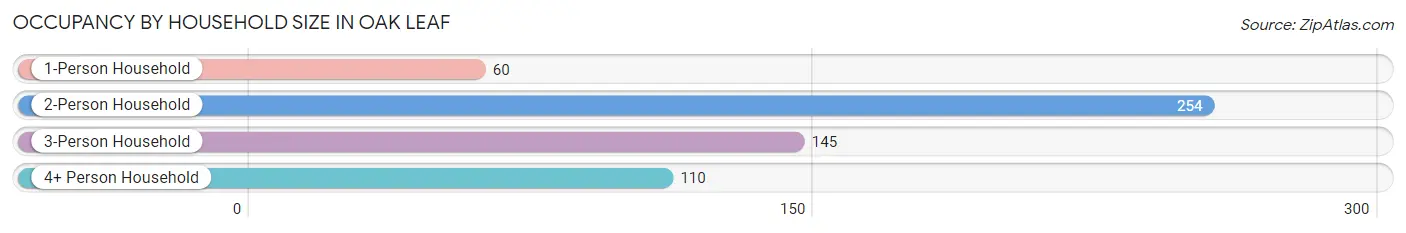
| Household Size | # Housing Units | % Housing Units |
| 1-Person Household | 60 | 10.5% |
| 2-Person Household | 254 | 44.6% |
| 3-Person Household | 145 | 25.5% |
| 4+ Person Household | 110 | 19.3% |
| Total Housing Units | 569 | 100.0% |
Occupancy by Ownership by Household Size in Oak Leaf
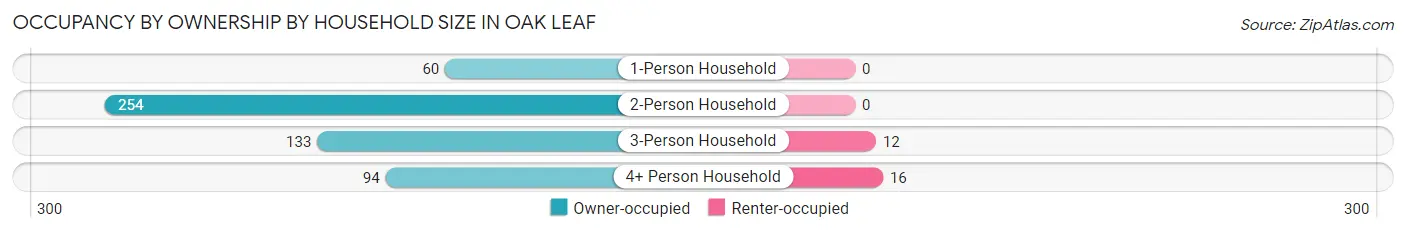
| Household Size | Owner-occupied | Renter-occupied |
| 1-Person Household | 60 (100.0%) | 0 (0.0%) |
| 2-Person Household | 254 (100.0%) | 0 (0.0%) |
| 3-Person Household | 133 (91.7%) | 12 (8.3%) |
| 4+ Person Household | 94 (85.5%) | 16 (14.5%) |
| Total Housing Units | 541 (95.1%) | 28 (4.9%) |
Occupancy by Educational Attainment in Oak Leaf
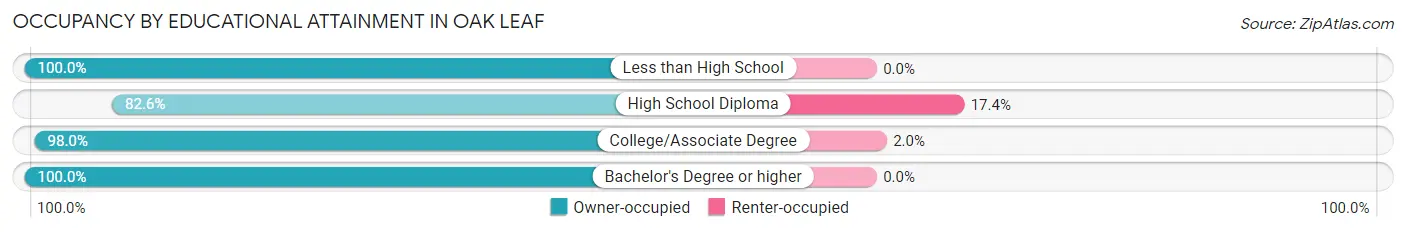
| Household Size | Owner-occupied | Renter-occupied |
| Less than High School | 17 (100.0%) | 0 (0.0%) |
| High School Diploma | 119 (82.6%) | 25 (17.4%) |
| College/Associate Degree | 148 (98.0%) | 3 (2.0%) |
| Bachelor's Degree or higher | 257 (100.0%) | 0 (0.0%) |
Occupancy by Age of Householder in Oak Leaf
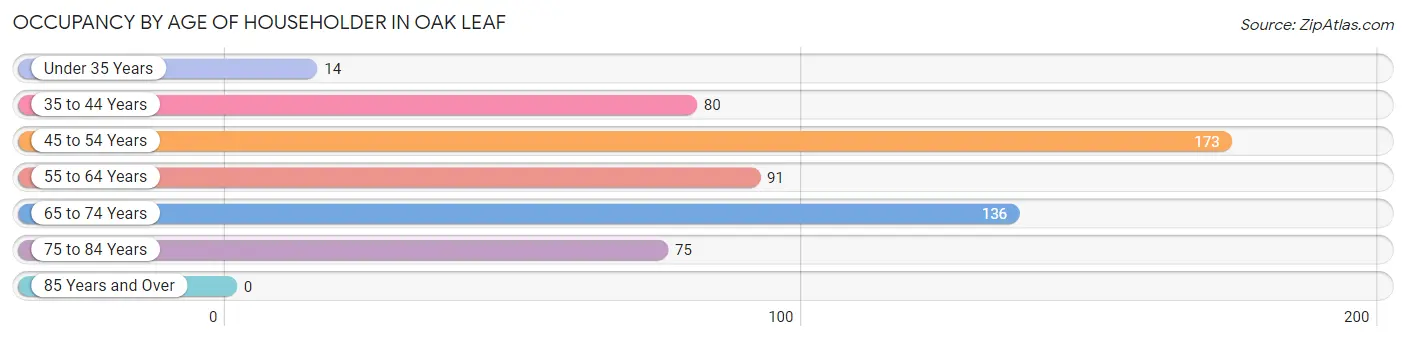
| Age Bracket | # Households | % Households |
| Under 35 Years | 14 | 2.5% |
| 35 to 44 Years | 80 | 14.1% |
| 45 to 54 Years | 173 | 30.4% |
| 55 to 64 Years | 91 | 16.0% |
| 65 to 74 Years | 136 | 23.9% |
| 75 to 84 Years | 75 | 13.2% |
| 85 Years and Over | 0 | 0.0% |
| Total | 569 | 100.0% |
Housing Finances in Oak Leaf
Median Income by Occupancy in Oak Leaf
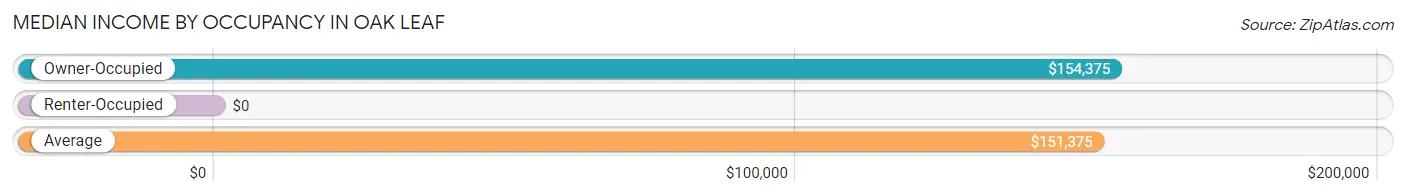
| Occupancy Type | # Households | Median Income |
| Owner-Occupied | 541 (95.1%) | $154,375 |
| Renter-Occupied | 28 (4.9%) | $0 |
| Average | 569 (100.0%) | $151,375 |
Occupancy by Householder Income Bracket in Oak Leaf
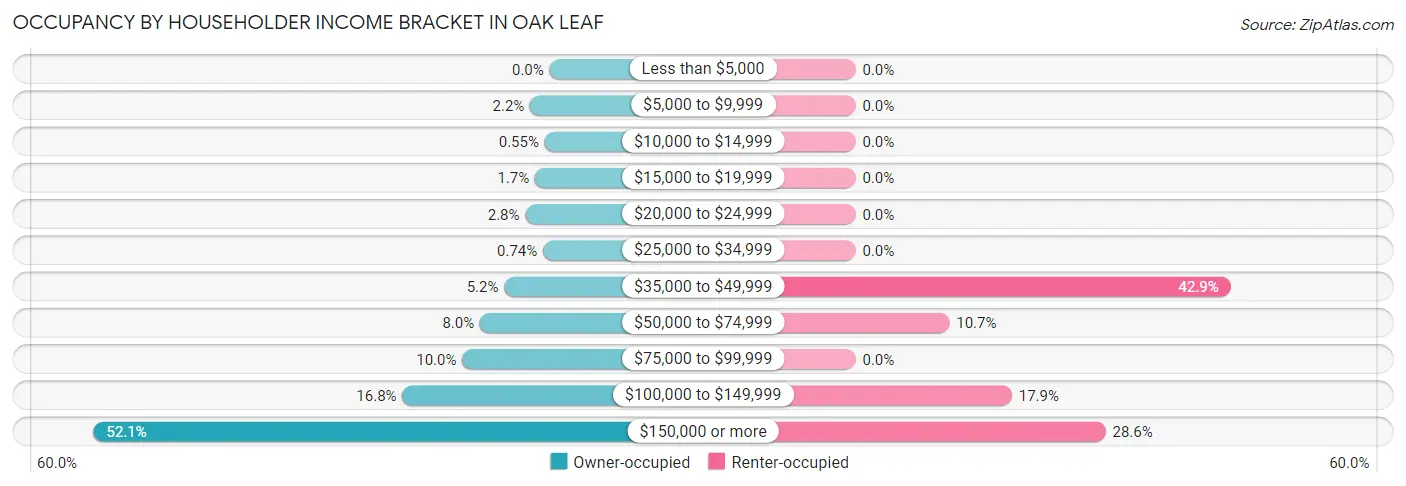
| Income Bracket | Owner-occupied | Renter-occupied |
| Less than $5,000 | 0 (0.0%) | 0 (0.0%) |
| $5,000 to $9,999 | 12 (2.2%) | 0 (0.0%) |
| $10,000 to $14,999 | 3 (0.5%) | 0 (0.0%) |
| $15,000 to $19,999 | 9 (1.7%) | 0 (0.0%) |
| $20,000 to $24,999 | 15 (2.8%) | 0 (0.0%) |
| $25,000 to $34,999 | 4 (0.7%) | 0 (0.0%) |
| $35,000 to $49,999 | 28 (5.2%) | 12 (42.9%) |
| $50,000 to $74,999 | 43 (8.0%) | 3 (10.7%) |
| $75,000 to $99,999 | 54 (10.0%) | 0 (0.0%) |
| $100,000 to $149,999 | 91 (16.8%) | 5 (17.9%) |
| $150,000 or more | 282 (52.1%) | 8 (28.6%) |
| Total | 541 (100.0%) | 28 (100.0%) |
Monthly Housing Cost Tiers in Oak Leaf
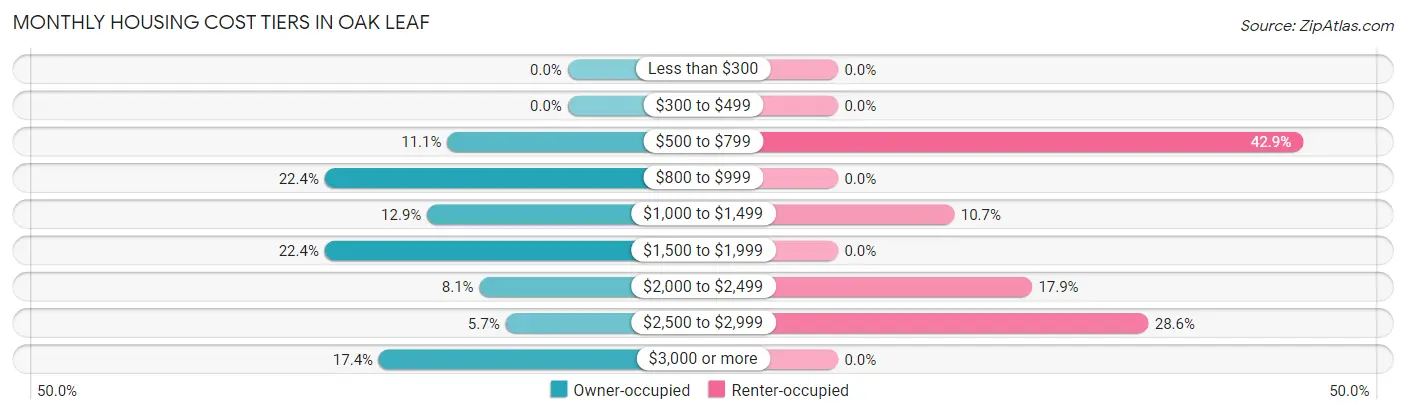
| Monthly Cost | Owner-occupied | Renter-occupied |
| Less than $300 | 0 (0.0%) | 0 (0.0%) |
| $300 to $499 | 0 (0.0%) | 0 (0.0%) |
| $500 to $799 | 60 (11.1%) | 12 (42.9%) |
| $800 to $999 | 121 (22.4%) | 0 (0.0%) |
| $1,000 to $1,499 | 70 (12.9%) | 3 (10.7%) |
| $1,500 to $1,999 | 121 (22.4%) | 0 (0.0%) |
| $2,000 to $2,499 | 44 (8.1%) | 5 (17.9%) |
| $2,500 to $2,999 | 31 (5.7%) | 8 (28.6%) |
| $3,000 or more | 94 (17.4%) | 0 (0.0%) |
| Total | 541 (100.0%) | 28 (100.0%) |
Physical Housing Characteristics in Oak Leaf
Housing Structures in Oak Leaf
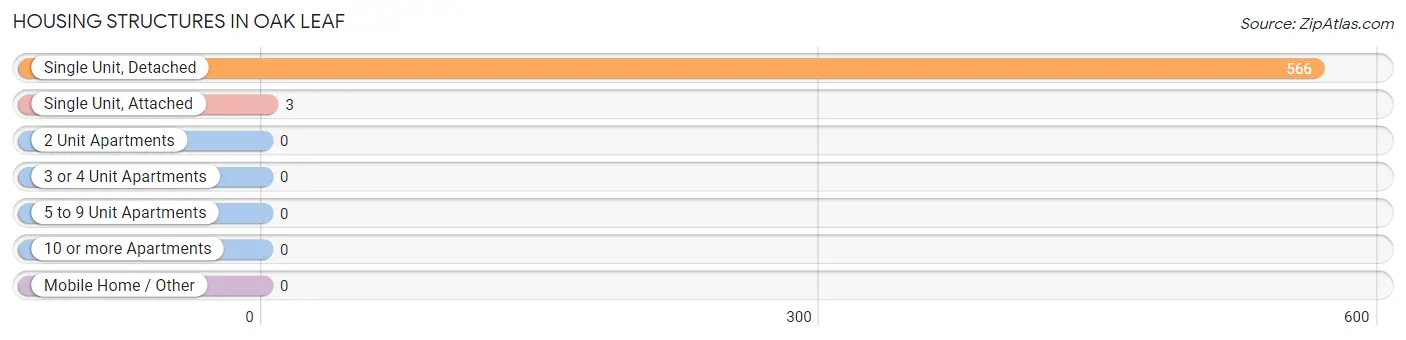
| Structure Type | # Housing Units | % Housing Units |
| Single Unit, Detached | 566 | 99.5% |
| Single Unit, Attached | 3 | 0.5% |
| 2 Unit Apartments | 0 | 0.0% |
| 3 or 4 Unit Apartments | 0 | 0.0% |
| 5 to 9 Unit Apartments | 0 | 0.0% |
| 10 or more Apartments | 0 | 0.0% |
| Mobile Home / Other | 0 | 0.0% |
| Total | 569 | 100.0% |
Housing Structures by Occupancy in Oak Leaf
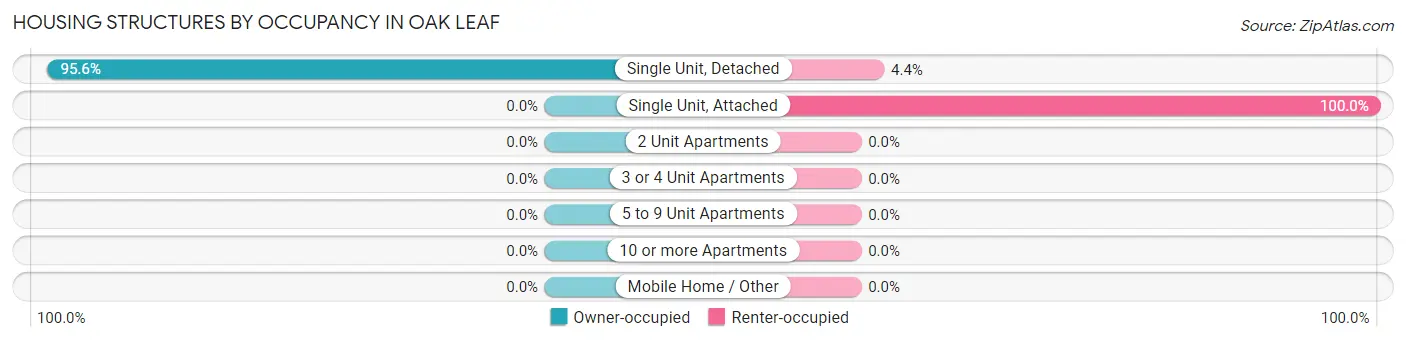
| Structure Type | Owner-occupied | Renter-occupied |
| Single Unit, Detached | 541 (95.6%) | 25 (4.4%) |
| Single Unit, Attached | 0 (0.0%) | 3 (100.0%) |
| 2 Unit Apartments | 0 (0.0%) | 0 (0.0%) |
| 3 or 4 Unit Apartments | 0 (0.0%) | 0 (0.0%) |
| 5 to 9 Unit Apartments | 0 (0.0%) | 0 (0.0%) |
| 10 or more Apartments | 0 (0.0%) | 0 (0.0%) |
| Mobile Home / Other | 0 (0.0%) | 0 (0.0%) |
| Total | 541 (95.1%) | 28 (4.9%) |
Housing Structures by Number of Rooms in Oak Leaf
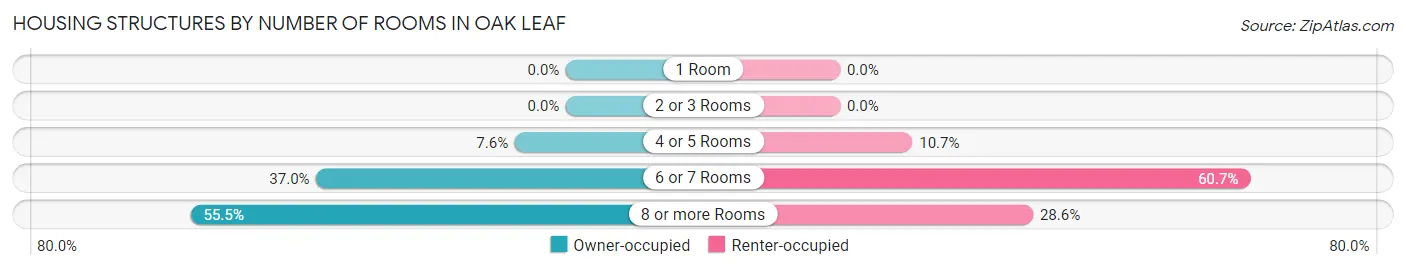
| Number of Rooms | Owner-occupied | Renter-occupied |
| 1 Room | 0 (0.0%) | 0 (0.0%) |
| 2 or 3 Rooms | 0 (0.0%) | 0 (0.0%) |
| 4 or 5 Rooms | 41 (7.6%) | 3 (10.7%) |
| 6 or 7 Rooms | 200 (37.0%) | 17 (60.7%) |
| 8 or more Rooms | 300 (55.4%) | 8 (28.6%) |
| Total | 541 (100.0%) | 28 (100.0%) |
Housing Structure by Heating Type in Oak Leaf
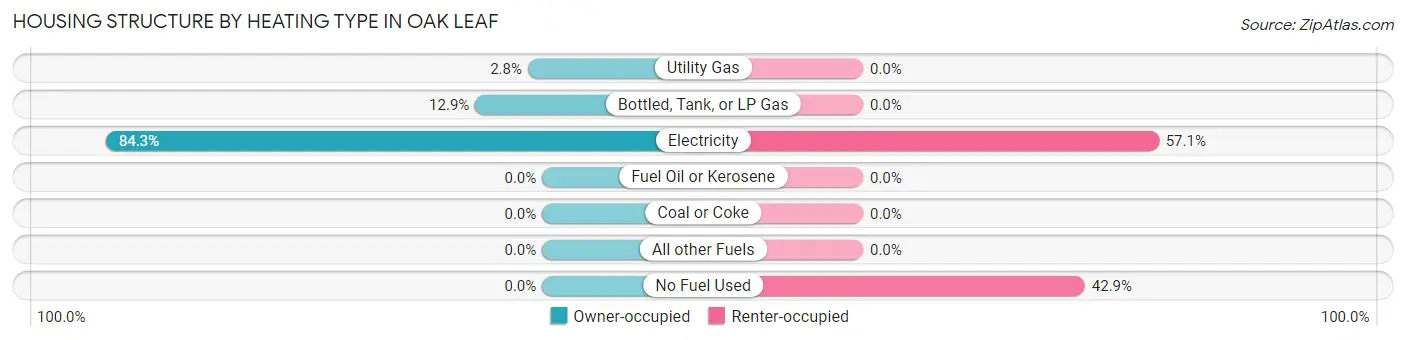
| Heating Type | Owner-occupied | Renter-occupied |
| Utility Gas | 15 (2.8%) | 0 (0.0%) |
| Bottled, Tank, or LP Gas | 70 (12.9%) | 0 (0.0%) |
| Electricity | 456 (84.3%) | 16 (57.1%) |
| Fuel Oil or Kerosene | 0 (0.0%) | 0 (0.0%) |
| Coal or Coke | 0 (0.0%) | 0 (0.0%) |
| All other Fuels | 0 (0.0%) | 0 (0.0%) |
| No Fuel Used | 0 (0.0%) | 12 (42.9%) |
| Total | 541 (100.0%) | 28 (100.0%) |
Household Vehicle Usage in Oak Leaf
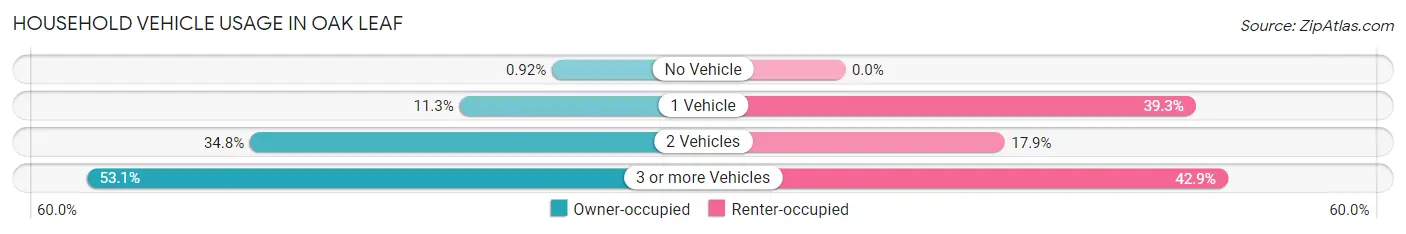
| Vehicles per Household | Owner-occupied | Renter-occupied |
| No Vehicle | 5 (0.9%) | 0 (0.0%) |
| 1 Vehicle | 61 (11.3%) | 11 (39.3%) |
| 2 Vehicles | 188 (34.7%) | 5 (17.9%) |
| 3 or more Vehicles | 287 (53.0%) | 12 (42.9%) |
| Total | 541 (100.0%) | 28 (100.0%) |
Real Estate & Mortgages in Oak Leaf
Real Estate and Mortgage Overview in Oak Leaf
| Characteristic | Without Mortgage | With Mortgage |
| Housing Units | 243 | 298 |
| Median Property Value | $303,300 | $338,100 |
| Median Household Income | $136,250 | $165 |
| Monthly Housing Costs | $873 | $89 |
| Real Estate Taxes | $4,470 | $4 |
Property Value by Mortgage Status in Oak Leaf
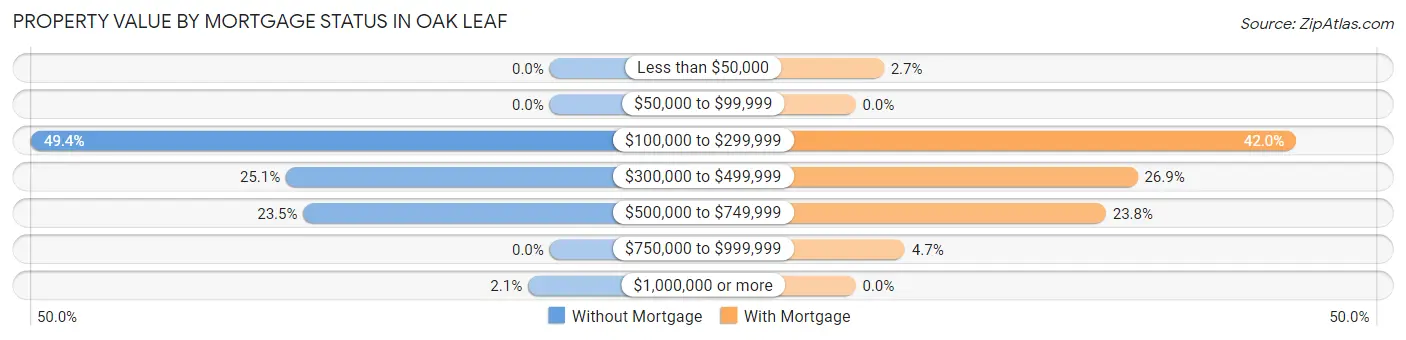
| Property Value | Without Mortgage | With Mortgage |
| Less than $50,000 | 0 (0.0%) | 8 (2.7%) |
| $50,000 to $99,999 | 0 (0.0%) | 0 (0.0%) |
| $100,000 to $299,999 | 120 (49.4%) | 125 (41.9%) |
| $300,000 to $499,999 | 61 (25.1%) | 80 (26.9%) |
| $500,000 to $749,999 | 57 (23.5%) | 71 (23.8%) |
| $750,000 to $999,999 | 0 (0.0%) | 14 (4.7%) |
| $1,000,000 or more | 5 (2.1%) | 0 (0.0%) |
| Total | 243 (100.0%) | 298 (100.0%) |
Household Income by Mortgage Status in Oak Leaf
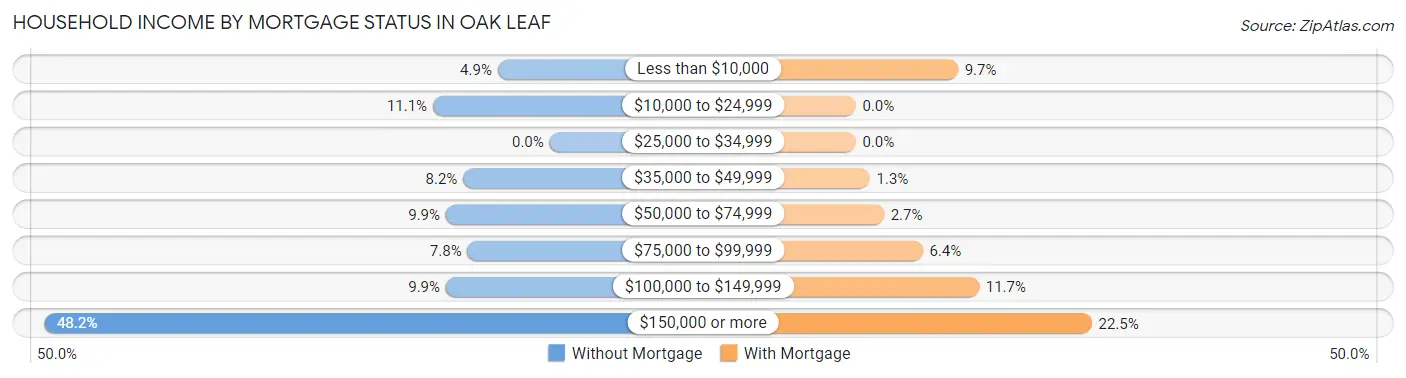
| Household Income | Without Mortgage | With Mortgage |
| Less than $10,000 | 12 (4.9%) | 29 (9.7%) |
| $10,000 to $24,999 | 27 (11.1%) | 0 (0.0%) |
| $25,000 to $34,999 | 0 (0.0%) | 0 (0.0%) |
| $35,000 to $49,999 | 20 (8.2%) | 4 (1.3%) |
| $50,000 to $74,999 | 24 (9.9%) | 8 (2.7%) |
| $75,000 to $99,999 | 19 (7.8%) | 19 (6.4%) |
| $100,000 to $149,999 | 24 (9.9%) | 35 (11.7%) |
| $150,000 or more | 117 (48.1%) | 67 (22.5%) |
| Total | 243 (100.0%) | 298 (100.0%) |
Property Value to Household Income Ratio in Oak Leaf
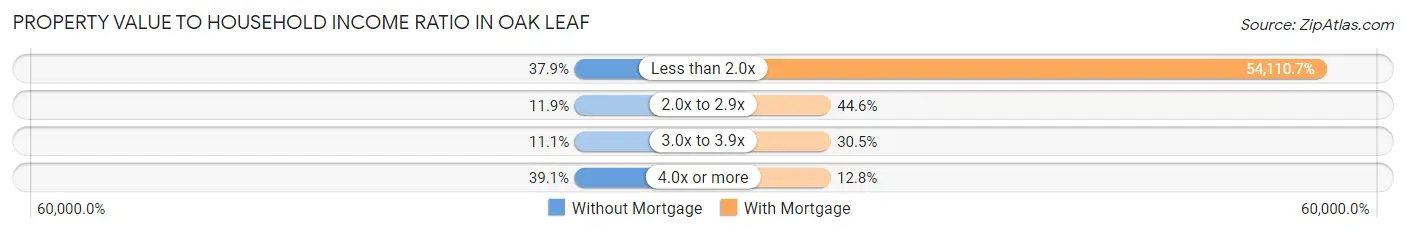
| Value-to-Income Ratio | Without Mortgage | With Mortgage |
| Less than 2.0x | 92 (37.9%) | 161,250 (54,110.7%) |
| 2.0x to 2.9x | 29 (11.9%) | 133 (44.6%) |
| 3.0x to 3.9x | 27 (11.1%) | 91 (30.5%) |
| 4.0x or more | 95 (39.1%) | 38 (12.8%) |
| Total | 243 (100.0%) | 298 (100.0%) |
Real Estate Taxes by Mortgage Status in Oak Leaf
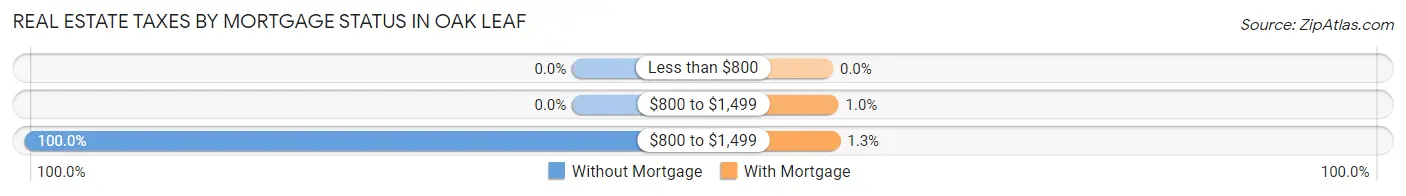
| Property Taxes | Without Mortgage | With Mortgage |
| Less than $800 | 0 (0.0%) | 0 (0.0%) |
| $800 to $1,499 | 0 (0.0%) | 3 (1.0%) |
| $800 to $1,499 | 243 (100.0%) | 4 (1.3%) |
| Total | 243 (100.0%) | 298 (100.0%) |
Health & Disability in Oak Leaf
Health Insurance Coverage by Age in Oak Leaf
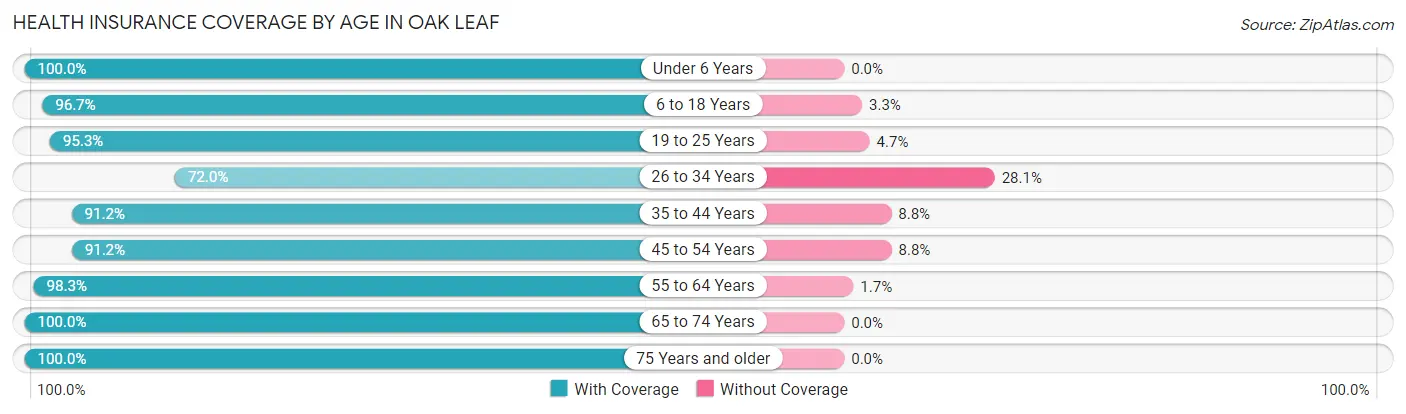
| Age Bracket | With Coverage | Without Coverage |
| Under 6 Years | 50 (100.0%) | 0 (0.0%) |
| 6 to 18 Years | 233 (96.7%) | 8 (3.3%) |
| 19 to 25 Years | 161 (95.3%) | 8 (4.7%) |
| 26 to 34 Years | 59 (72.0%) | 23 (28.1%) |
| 35 to 44 Years | 135 (91.2%) | 13 (8.8%) |
| 45 to 54 Years | 310 (91.2%) | 30 (8.8%) |
| 55 to 64 Years | 231 (98.3%) | 4 (1.7%) |
| 65 to 74 Years | 249 (100.0%) | 0 (0.0%) |
| 75 Years and older | 139 (100.0%) | 0 (0.0%) |
| Total | 1,567 (94.8%) | 86 (5.2%) |
Health Insurance Coverage by Citizenship Status in Oak Leaf
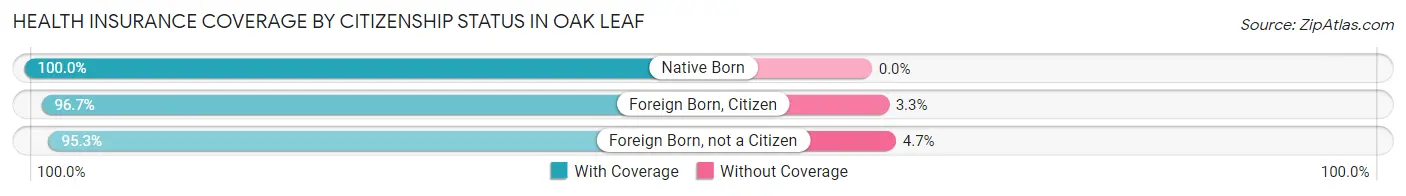
| Citizenship Status | With Coverage | Without Coverage |
| Native Born | 50 (100.0%) | 0 (0.0%) |
| Foreign Born, Citizen | 233 (96.7%) | 8 (3.3%) |
| Foreign Born, not a Citizen | 161 (95.3%) | 8 (4.7%) |
Health Insurance Coverage by Household Income in Oak Leaf
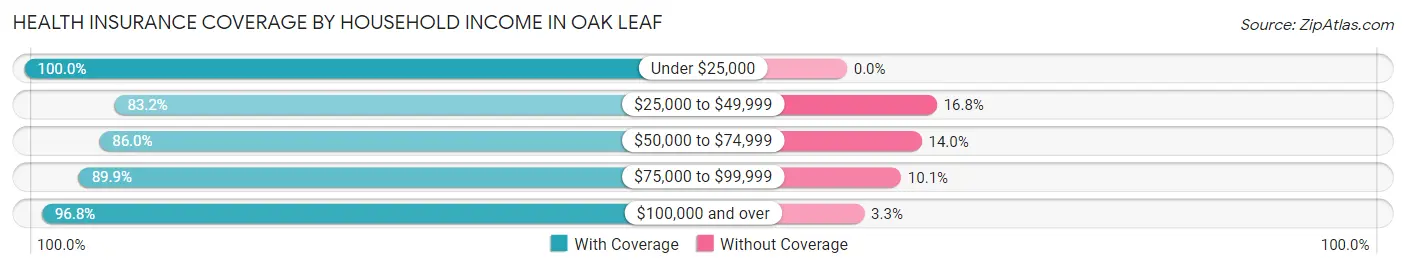
| Household Income | With Coverage | Without Coverage |
| Under $25,000 | 56 (100.0%) | 0 (0.0%) |
| $25,000 to $49,999 | 79 (83.2%) | 16 (16.8%) |
| $50,000 to $74,999 | 86 (86.0%) | 14 (14.0%) |
| $75,000 to $99,999 | 124 (89.9%) | 14 (10.1%) |
| $100,000 and over | 1,220 (96.8%) | 41 (3.3%) |
Public vs Private Health Insurance Coverage by Age in Oak Leaf
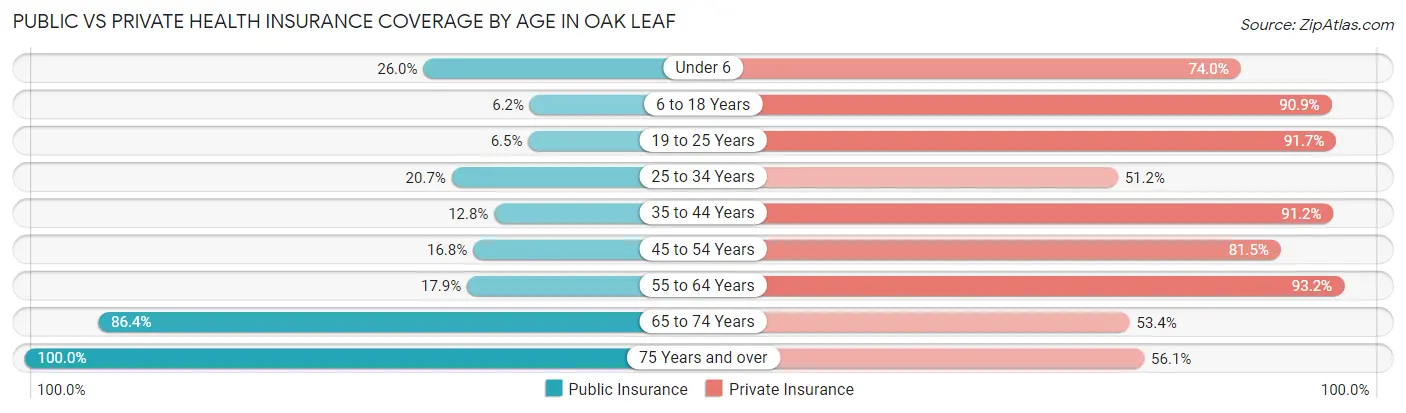
| Age Bracket | Public Insurance | Private Insurance |
| Under 6 | 13 (26.0%) | 37 (74.0%) |
| 6 to 18 Years | 15 (6.2%) | 219 (90.9%) |
| 19 to 25 Years | 11 (6.5%) | 155 (91.7%) |
| 25 to 34 Years | 17 (20.7%) | 42 (51.2%) |
| 35 to 44 Years | 19 (12.8%) | 135 (91.2%) |
| 45 to 54 Years | 57 (16.8%) | 277 (81.5%) |
| 55 to 64 Years | 42 (17.9%) | 219 (93.2%) |
| 65 to 74 Years | 215 (86.4%) | 133 (53.4%) |
| 75 Years and over | 139 (100.0%) | 78 (56.1%) |
| Total | 528 (31.9%) | 1,295 (78.3%) |
Disability Status by Sex by Age in Oak Leaf
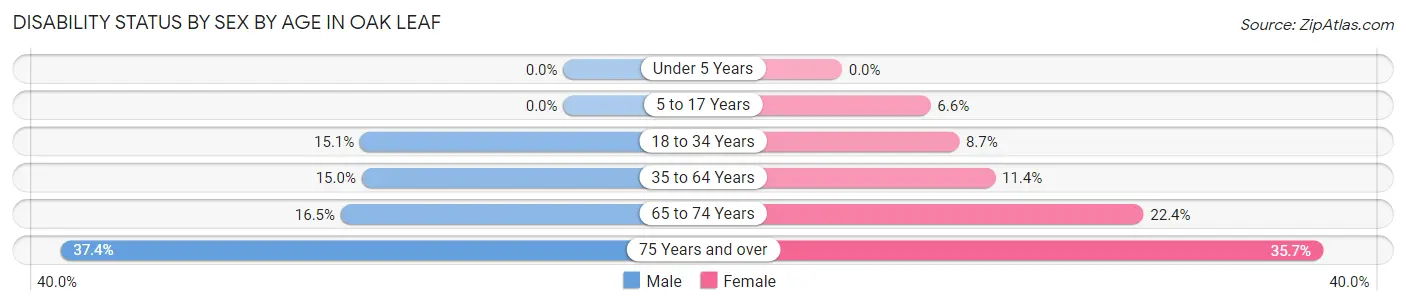
| Age Bracket | Male | Female |
| Under 5 Years | 0 (0.0%) | 0 (0.0%) |
| 5 to 17 Years | 0 (0.0%) | 5 (6.6%) |
| 18 to 34 Years | 16 (15.1%) | 14 (8.7%) |
| 35 to 64 Years | 53 (15.0%) | 42 (11.4%) |
| 65 to 74 Years | 19 (16.5%) | 30 (22.4%) |
| 75 Years and over | 31 (37.3%) | 20 (35.7%) |
Disability Class by Sex by Age in Oak Leaf
Disability Class: Hearing Difficulty
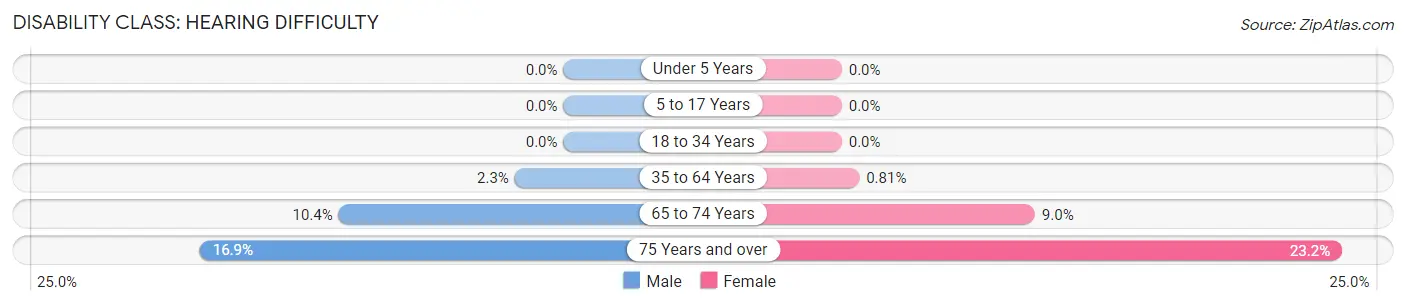
| Age Bracket | Male | Female |
| Under 5 Years | 0 (0.0%) | 0 (0.0%) |
| 5 to 17 Years | 0 (0.0%) | 0 (0.0%) |
| 18 to 34 Years | 0 (0.0%) | 0 (0.0%) |
| 35 to 64 Years | 8 (2.3%) | 3 (0.8%) |
| 65 to 74 Years | 12 (10.4%) | 12 (9.0%) |
| 75 Years and over | 14 (16.9%) | 13 (23.2%) |
Disability Class: Vision Difficulty
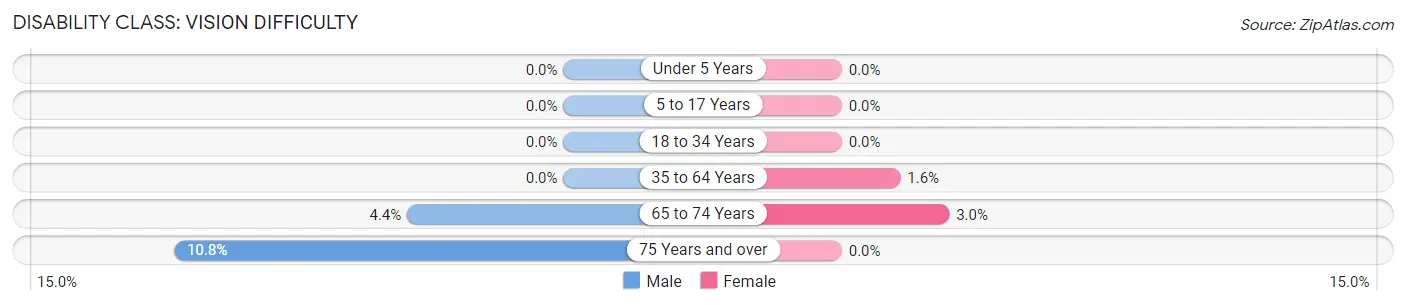
| Age Bracket | Male | Female |
| Under 5 Years | 0 (0.0%) | 0 (0.0%) |
| 5 to 17 Years | 0 (0.0%) | 0 (0.0%) |
| 18 to 34 Years | 0 (0.0%) | 0 (0.0%) |
| 35 to 64 Years | 0 (0.0%) | 6 (1.6%) |
| 65 to 74 Years | 5 (4.3%) | 4 (3.0%) |
| 75 Years and over | 9 (10.8%) | 0 (0.0%) |
Disability Class: Cognitive Difficulty
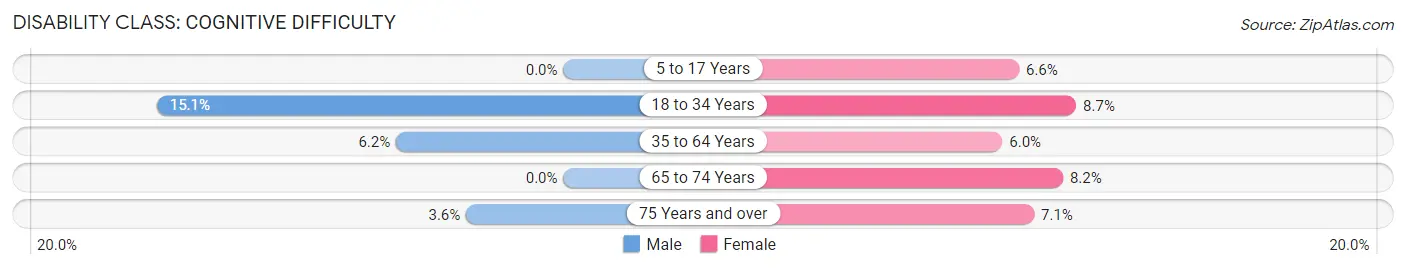
| Age Bracket | Male | Female |
| 5 to 17 Years | 0 (0.0%) | 5 (6.6%) |
| 18 to 34 Years | 16 (15.1%) | 14 (8.7%) |
| 35 to 64 Years | 22 (6.2%) | 22 (6.0%) |
| 65 to 74 Years | 0 (0.0%) | 11 (8.2%) |
| 75 Years and over | 3 (3.6%) | 4 (7.1%) |
Disability Class: Ambulatory Difficulty
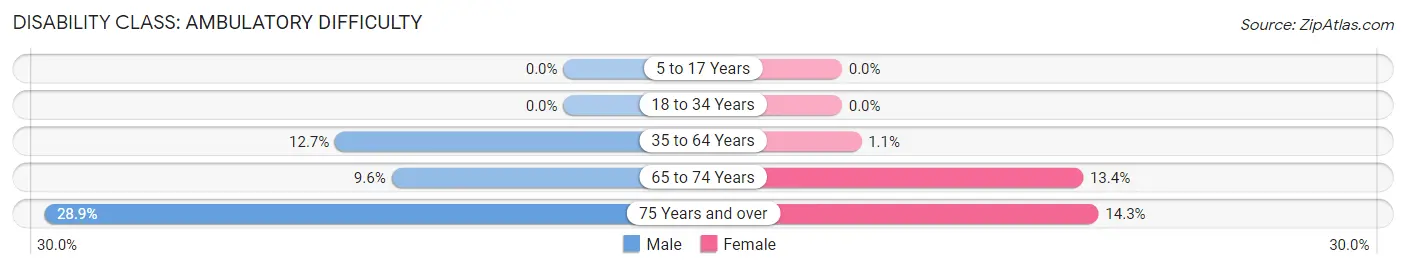
| Age Bracket | Male | Female |
| 5 to 17 Years | 0 (0.0%) | 0 (0.0%) |
| 18 to 34 Years | 0 (0.0%) | 0 (0.0%) |
| 35 to 64 Years | 45 (12.7%) | 4 (1.1%) |
| 65 to 74 Years | 11 (9.6%) | 18 (13.4%) |
| 75 Years and over | 24 (28.9%) | 8 (14.3%) |
Disability Class: Self-Care Difficulty
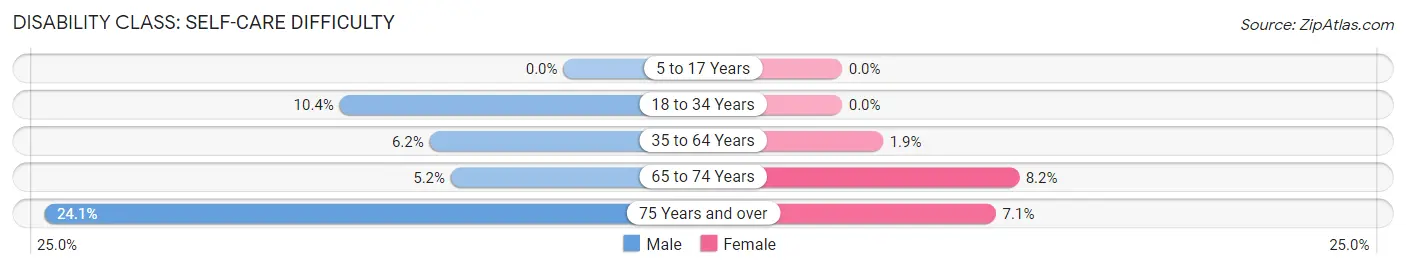
| Age Bracket | Male | Female |
| 5 to 17 Years | 0 (0.0%) | 0 (0.0%) |
| 18 to 34 Years | 11 (10.4%) | 0 (0.0%) |
| 35 to 64 Years | 22 (6.2%) | 7 (1.9%) |
| 65 to 74 Years | 6 (5.2%) | 11 (8.2%) |
| 75 Years and over | 20 (24.1%) | 4 (7.1%) |
Technology Access in Oak Leaf
Computing Device Access in Oak Leaf
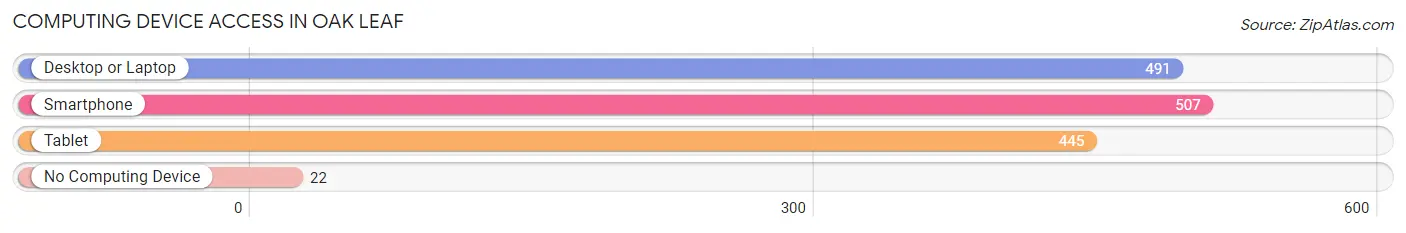
| Device Type | # Households | % Households |
| Desktop or Laptop | 491 | 86.3% |
| Smartphone | 507 | 89.1% |
| Tablet | 445 | 78.2% |
| No Computing Device | 22 | 3.9% |
| Total | 569 | 100.0% |
Internet Access in Oak Leaf
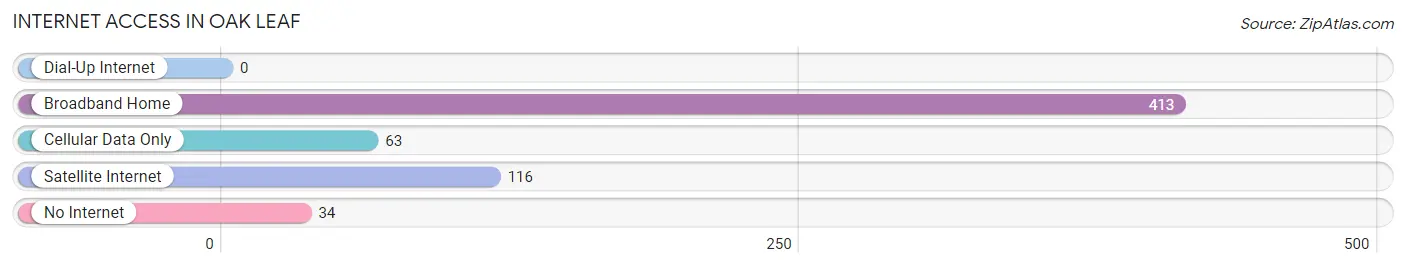
| Internet Type | # Households | % Households |
| Dial-Up Internet | 0 | 0.0% |
| Broadband Home | 413 | 72.6% |
| Cellular Data Only | 63 | 11.1% |
| Satellite Internet | 116 | 20.4% |
| No Internet | 34 | 6.0% |
| Total | 569 | 100.0% |
Oak Leaf Summary
Leaf, Texas is a small unincorporated community located in the southeastern corner of Smith County, Texas. The town is situated on the banks of the Sabine River, which forms the border between Texas and Louisiana. The town is located approximately 20 miles east of Tyler, the county seat of Smith County.
History
The area that is now Oak Leaf was first settled in the early 1800s by a group of settlers from the United States. The settlers were attracted to the area due to its fertile soil and abundant wildlife. The town was originally known as “Oak Grove” and was later changed to “Oak Leaf” in 1845.
The town was officially incorporated in 1848 and was named after the abundance of oak trees in the area. The town quickly grew and by the late 1800s, it had become a thriving community with a population of over 500 people.
The town was home to several businesses, including a general store, a blacksmith shop, a cotton gin, and a sawmill. The town also had a post office, a school, and several churches.
Geography
Oak Leaf is located in the southeastern corner of Smith County, Texas. The town is situated on the banks of the Sabine River, which forms the border between Texas and Louisiana. The town is located approximately 20 miles east of Tyler, the county seat of Smith County.
The town is located in a rural area and is surrounded by rolling hills and forests. The climate in the area is generally mild and humid, with temperatures ranging from the mid-50s in the winter to the mid-90s in the summer.
Economy
The economy of Oak Leaf is largely based on agriculture. The town is home to several farms and ranches, which produce a variety of crops, including cotton, corn, soybeans, and wheat. The town also has several small businesses, including a general store, a blacksmith shop, and a sawmill.
The town is also home to several oil and gas wells, which provide jobs for many of the town’s residents.
Demographics
As of the 2010 census, the population of Oak Leaf was 545. The town is predominantly white, with a small Hispanic population. The median household income in the town is $37,500, and the median home value is $90,000.
Conclusion
Oak Leaf, Texas is a small unincorporated community located in the southeastern corner of Smith County, Texas. The town is situated on the banks of the Sabine River, which forms the border between Texas and Louisiana. The town is home to several farms and ranches, which produce a variety of crops, and is also home to several oil and gas wells. The town has a population of 545, and the median household income is $37,500.
Common Questions
What is Per Capita Income in Oak Leaf?
Per Capita income in Oak Leaf is $57,634.
What is the Median Family Income in Oak Leaf?
Median Family Income in Oak Leaf is $165,057.
What is the Median Household income in Oak Leaf?
Median Household Income in Oak Leaf is $151,375.
What is Income or Wage Gap in Oak Leaf?
Income or Wage Gap in Oak Leaf is 34.9%.
Women in Oak Leaf earn 65.1 cents for every dollar earned by a man.
What is Inequality or Gini Index in Oak Leaf?
Inequality or Gini Index in Oak Leaf is 0.37.
What is the Total Population of Oak Leaf?
Total Population of Oak Leaf is 1,653.
What is the Total Male Population of Oak Leaf?
Total Male Population of Oak Leaf is 846.
What is the Total Female Population of Oak Leaf?
Total Female Population of Oak Leaf is 807.
What is the Ratio of Males per 100 Females in Oak Leaf?
There are 104.83 Males per 100 Females in Oak Leaf.
What is the Ratio of Females per 100 Males in Oak Leaf?
There are 95.39 Females per 100 Males in Oak Leaf.
What is the Median Population Age in Oak Leaf?
Median Population Age in Oak Leaf is 50.5 Years.
What is the Average Family Size in Oak Leaf
Average Family Size in Oak Leaf is 3.1 People.
What is the Average Household Size in Oak Leaf
Average Household Size in Oak Leaf is 2.9 People.
How Large is the Labor Force in Oak Leaf?
There are 875 People in the Labor Forcein in Oak Leaf.
What is the Percentage of People in the Labor Force in Oak Leaf?
60.2% of People are in the Labor Force in Oak Leaf.
What is the Unemployment Rate in Oak Leaf?
Unemployment Rate in Oak Leaf is 6.9%.