Shady Shores, TX Map & Demographics
Shady Shores Map
Shady Shores Overview
$54,793
PER CAPITA INCOME
$153,036
AVG FAMILY INCOME
$149,333
AVG HOUSEHOLD INCOME
22.5%
WAGE / INCOME GAP [ % ]
77.5¢/ $1
WAGE / INCOME GAP [ $ ]
$10,128
FAMILY INCOME DEFICIT
0.36
INEQUALITY / GINI INDEX
2,811
TOTAL POPULATION
1,465
MALE POPULATION
1,346
FEMALE POPULATION
108.84
MALES / 100 FEMALES
91.88
FEMALES / 100 MALES
45.6
MEDIAN AGE
3.3
AVG FAMILY SIZE
3.0
AVG HOUSEHOLD SIZE
1,511
LABOR FORCE [ PEOPLE ]
65.1%
PERCENT IN LABOR FORCE
7.3%
UNEMPLOYMENT RATE
Shady Shores Area Codes
Income in Shady Shores
Income Overview in Shady Shores
Per Capita Income in Shady Shores is $54,793, while median incomes of families and households are $153,036 and $149,333 respectively.
| Characteristic | Number | Measure |
| Per Capita Income | 2,811 | $54,793 |
| Median Family Income | 783 | $153,036 |
| Mean Family Income | 783 | $169,278 |
| Median Household Income | 938 | $149,333 |
| Mean Household Income | 938 | $160,050 |
| Income Deficit | 783 | $10,128 |
| Wage / Income Gap (%) | 2,811 | 22.48% |
| Wage / Income Gap ($) | 2,811 | 77.52¢ per $1 |
| Gini / Inequality Index | 2,811 | 0.36 |
Earnings by Sex in Shady Shores
Average Earnings in Shady Shores are $60,880, $68,625 for men and $53,200 for women, a difference of 22.5%.
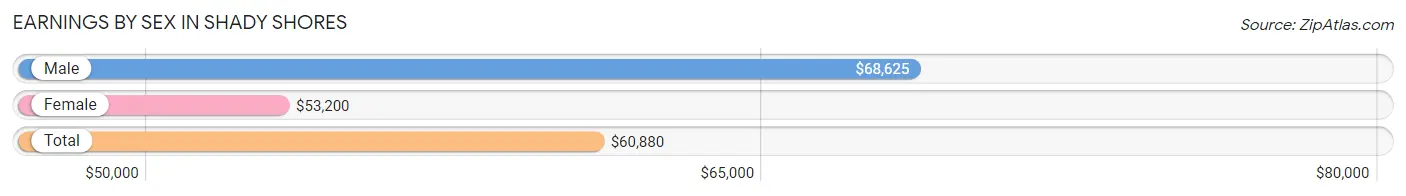
| Sex | Number | Average Earnings |
| Male | 915 (56.7%) | $68,625 |
| Female | 700 (43.3%) | $53,200 |
| Total | 1,615 (100.0%) | $60,880 |
Earnings by Sex by Income Bracket in Shady Shores
The most common earnings brackets in Shady Shores are $100,000+ for men (292 | 31.9%) and $100,000+ for women (140 | 20.0%).
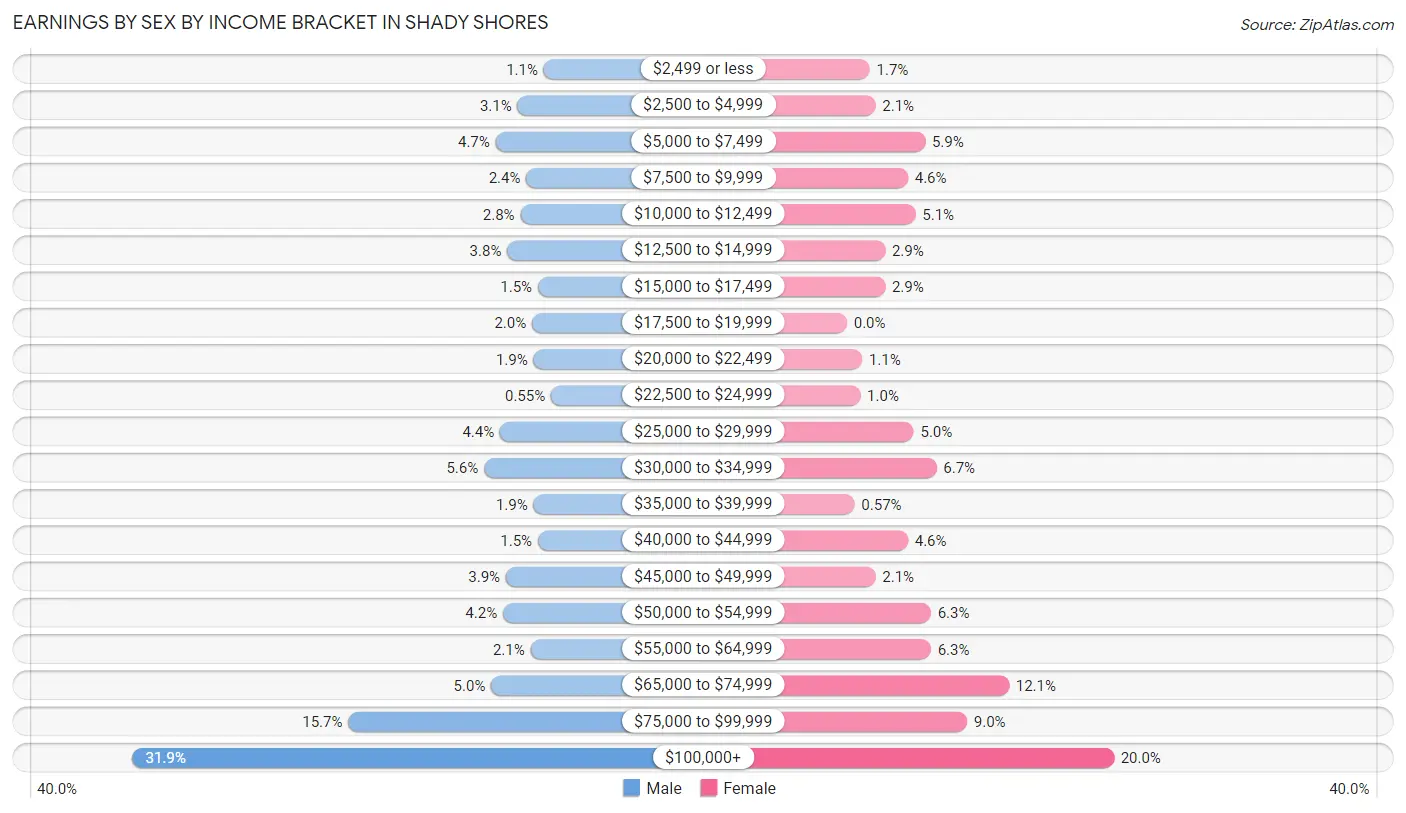
| Income | Male | Female |
| $2,499 or less | 10 (1.1%) | 12 (1.7%) |
| $2,500 to $4,999 | 28 (3.1%) | 15 (2.1%) |
| $5,000 to $7,499 | 43 (4.7%) | 41 (5.9%) |
| $7,500 to $9,999 | 22 (2.4%) | 32 (4.6%) |
| $10,000 to $12,499 | 26 (2.8%) | 36 (5.1%) |
| $12,500 to $14,999 | 35 (3.8%) | 20 (2.9%) |
| $15,000 to $17,499 | 14 (1.5%) | 20 (2.9%) |
| $17,500 to $19,999 | 18 (2.0%) | 0 (0.0%) |
| $20,000 to $22,499 | 17 (1.9%) | 8 (1.1%) |
| $22,500 to $24,999 | 5 (0.5%) | 7 (1.0%) |
| $25,000 to $29,999 | 40 (4.4%) | 35 (5.0%) |
| $30,000 to $34,999 | 51 (5.6%) | 47 (6.7%) |
| $35,000 to $39,999 | 17 (1.9%) | 4 (0.6%) |
| $40,000 to $44,999 | 14 (1.5%) | 32 (4.6%) |
| $45,000 to $49,999 | 36 (3.9%) | 15 (2.1%) |
| $50,000 to $54,999 | 38 (4.2%) | 44 (6.3%) |
| $55,000 to $64,999 | 19 (2.1%) | 44 (6.3%) |
| $65,000 to $74,999 | 46 (5.0%) | 85 (12.1%) |
| $75,000 to $99,999 | 144 (15.7%) | 63 (9.0%) |
| $100,000+ | 292 (31.9%) | 140 (20.0%) |
| Total | 915 (100.0%) | 700 (100.0%) |
Earnings by Sex by Educational Attainment in Shady Shores
Average earnings in Shady Shores are $79,291 for men and $61,620 for women, a difference of 22.3%. Men with an educational attainment of bachelor's degree enjoy the highest average annual earnings of $127,939, while those with college or associate's degree education earn the least with $54,412. Women with an educational attainment of high school diploma earn the most with the average annual earnings of $67,661, while those with college or associate's degree education have the smallest earnings of $41,250.
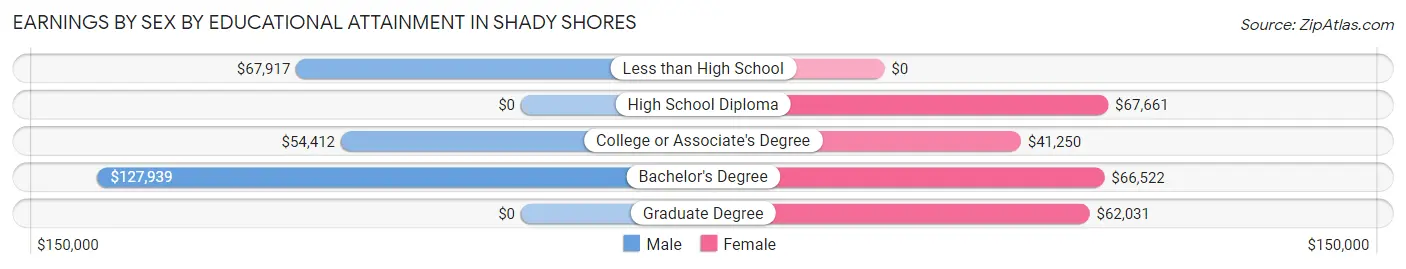
| Educational Attainment | Male Income | Female Income |
| Less than High School | $67,917 | $0 |
| High School Diploma | - | - |
| College or Associate's Degree | $54,412 | $41,250 |
| Bachelor's Degree | $127,939 | $66,522 |
| Graduate Degree | - | - |
| Total | $79,291 | $61,620 |
Family Income in Shady Shores
Family Income Brackets in Shady Shores
According to the Shady Shores family income data, there are 251 families falling into the $200,000+ income range, which is the most common income bracket and makes up 32.1% of all families. Conversely, the $10,000 to $14,999 income bracket is the least frequent group with only 7 families (0.9%) belonging to this category.
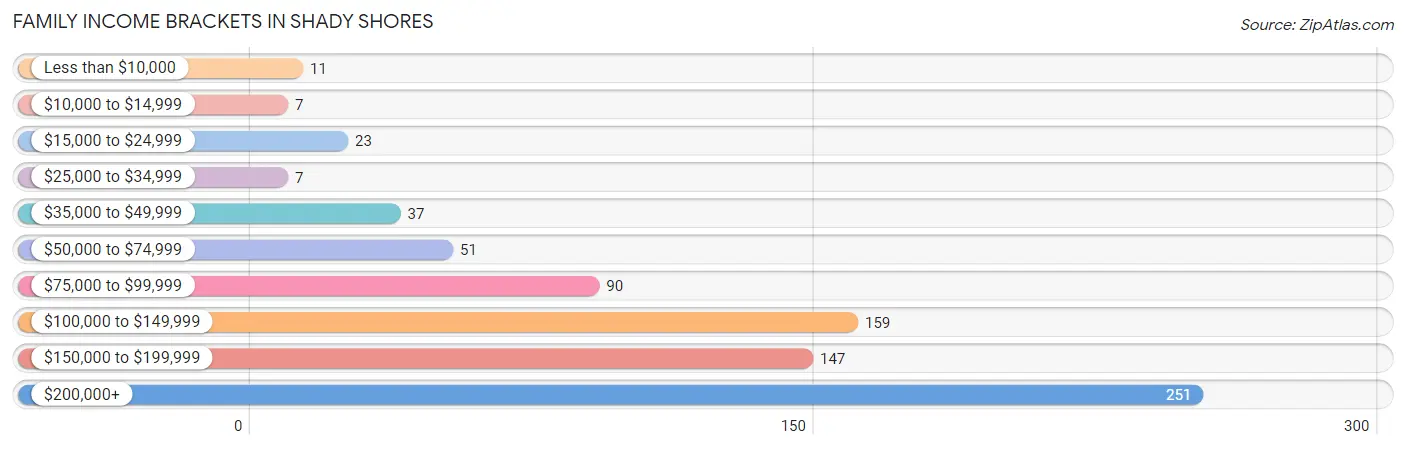
| Income Bracket | # Families | % Families |
| Less than $10,000 | 11 | 1.4% |
| $10,000 to $14,999 | 7 | 0.9% |
| $15,000 to $24,999 | 23 | 2.9% |
| $25,000 to $34,999 | 7 | 0.9% |
| $35,000 to $49,999 | 37 | 4.7% |
| $50,000 to $74,999 | 51 | 6.5% |
| $75,000 to $99,999 | 90 | 11.5% |
| $100,000 to $149,999 | 159 | 20.3% |
| $150,000 to $199,999 | 147 | 18.8% |
| $200,000+ | 251 | 32.1% |
Family Income by Famaliy Size in Shady Shores
4-person families (124 | 15.8%) account for the highest median family income in Shady Shores with $167,885 per family, while 2-person families (355 | 45.3%) have the highest median income of $74,297 per family member.
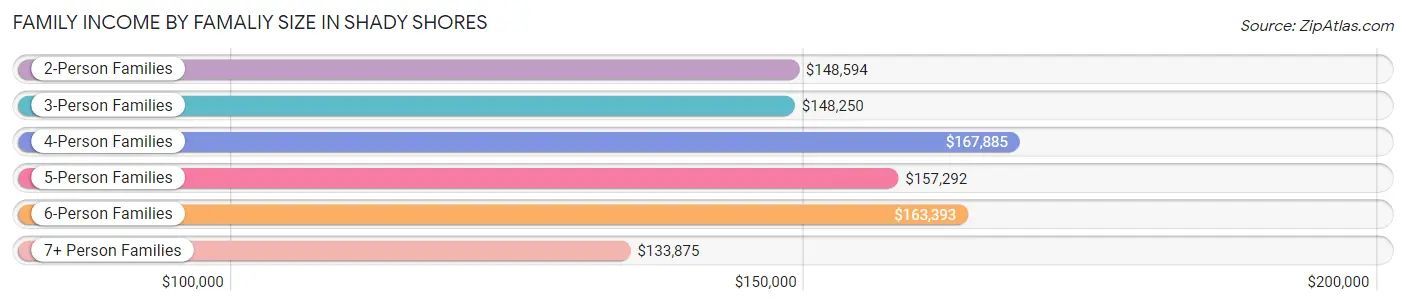
| Income Bracket | # Families | Median Income |
| 2-Person Families | 355 (45.3%) | $148,594 |
| 3-Person Families | 175 (22.4%) | $148,250 |
| 4-Person Families | 124 (15.8%) | $167,885 |
| 5-Person Families | 91 (11.6%) | $157,292 |
| 6-Person Families | 17 (2.2%) | $163,393 |
| 7+ Person Families | 21 (2.7%) | $133,875 |
| Total | 783 (100.0%) | $153,036 |
Family Income by Number of Earners in Shady Shores
The median family income in Shady Shores is $153,036, with families comprising 2 earners (428) having the highest median family income of $171,875, while families with no earners (100) have the lowest median family income of $76,250, accounting for 54.7% and 12.8% of families, respectively.
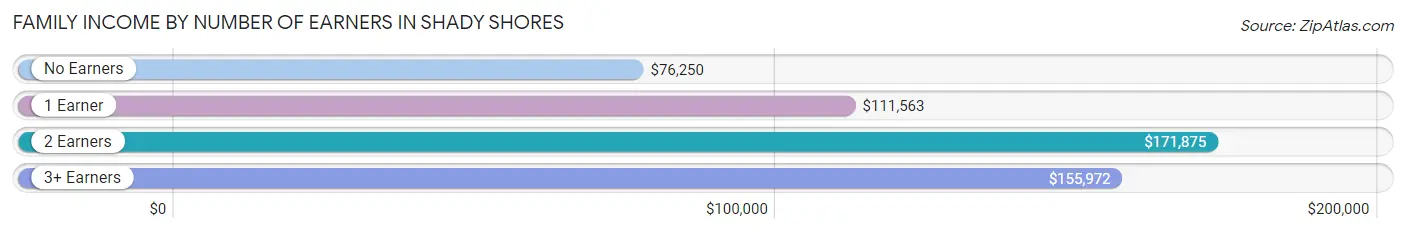
| Number of Earners | # Families | Median Income |
| No Earners | 100 (12.8%) | $76,250 |
| 1 Earner | 149 (19.0%) | $111,563 |
| 2 Earners | 428 (54.7%) | $171,875 |
| 3+ Earners | 106 (13.5%) | $155,972 |
| Total | 783 (100.0%) | $153,036 |
Household Income in Shady Shores
Household Income Brackets in Shady Shores
With 295 households falling in the category, the $200,000+ income range is the most frequent in Shady Shores, accounting for 31.5% of all households. In contrast, only 14 households (1.5%) fall into the $25,000 to $34,999 income bracket, making it the least populous group.
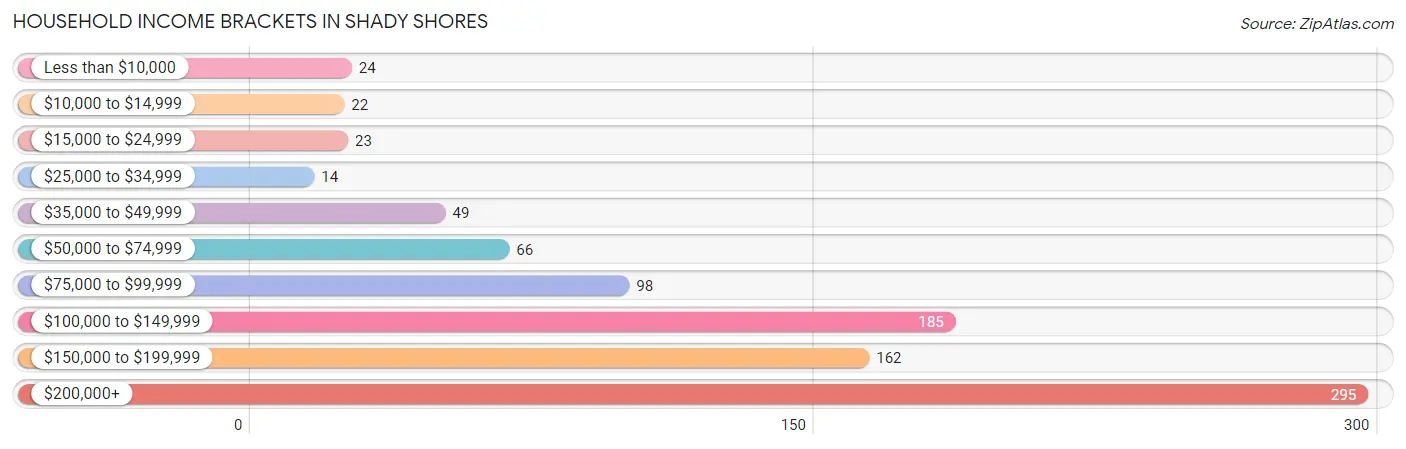
| Income Bracket | # Households | % Households |
| Less than $10,000 | 24 | 2.6% |
| $10,000 to $14,999 | 22 | 2.3% |
| $15,000 to $24,999 | 23 | 2.5% |
| $25,000 to $34,999 | 14 | 1.5% |
| $35,000 to $49,999 | 49 | 5.2% |
| $50,000 to $74,999 | 66 | 7.0% |
| $75,000 to $99,999 | 98 | 10.4% |
| $100,000 to $149,999 | 185 | 19.7% |
| $150,000 to $199,999 | 162 | 17.3% |
| $200,000+ | 295 | 31.4% |
Household Income by Householder Age in Shady Shores
The median household income in Shady Shores is $149,333, with the highest median household income of $167,961 found in the 25 to 44 years age bracket for the primary householder. A total of 189 households (20.2%) fall into this category.
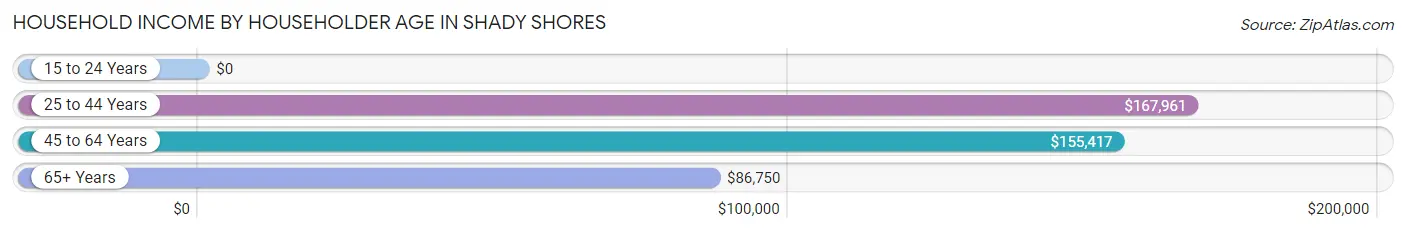
| Income Bracket | # Households | Median Income |
| 15 to 24 Years | 0 (0.0%) | $0 |
| 25 to 44 Years | 189 (20.2%) | $167,961 |
| 45 to 64 Years | 530 (56.5%) | $155,417 |
| 65+ Years | 219 (23.4%) | $86,750 |
| Total | 938 (100.0%) | $149,333 |
Poverty in Shady Shores
Income Below Poverty by Sex and Age in Shady Shores
With 5.3% poverty level for males and 5.9% for females among the residents of Shady Shores, under 5 year old males and under 5 year old females are the most vulnerable to poverty, with 6 males (14.3%) and 5 females (17.9%) in their respective age groups living below the poverty level.
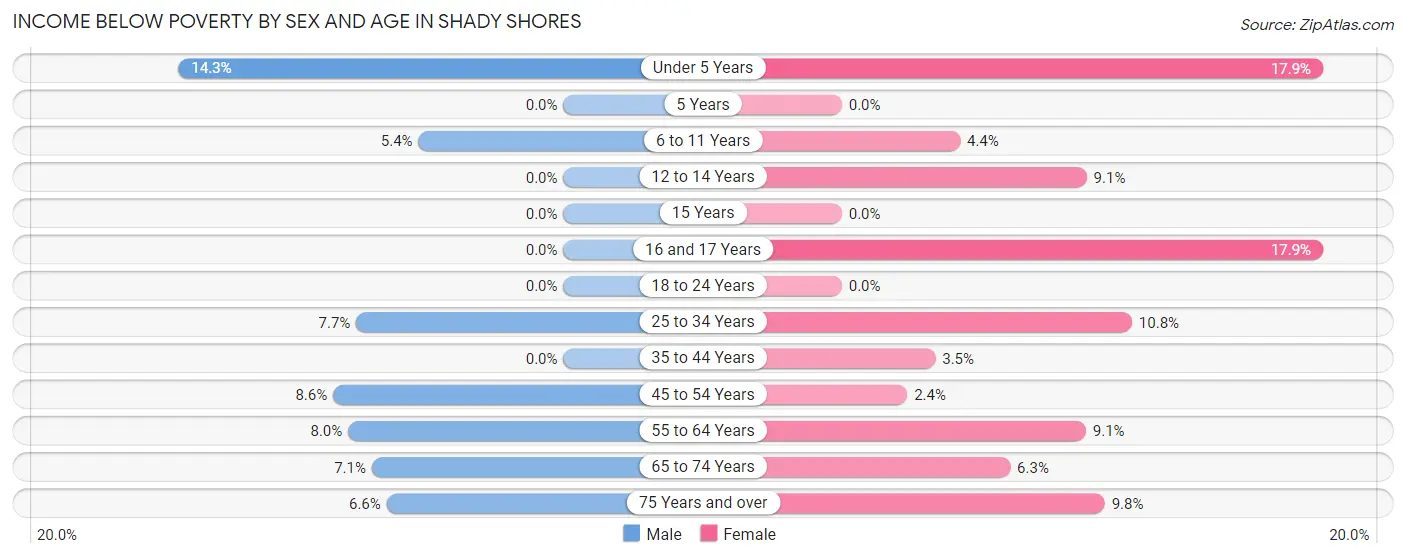
| Age Bracket | Male | Female |
| Under 5 Years | 6 (14.3%) | 5 (17.9%) |
| 5 Years | 0 (0.0%) | 0 (0.0%) |
| 6 to 11 Years | 5 (5.4%) | 5 (4.4%) |
| 12 to 14 Years | 0 (0.0%) | 5 (9.1%) |
| 15 Years | 0 (0.0%) | 0 (0.0%) |
| 16 and 17 Years | 0 (0.0%) | 5 (17.9%) |
| 18 to 24 Years | 0 (0.0%) | 0 (0.0%) |
| 25 to 34 Years | 8 (7.7%) | 7 (10.8%) |
| 35 to 44 Years | 0 (0.0%) | 7 (3.5%) |
| 45 to 54 Years | 13 (8.6%) | 5 (2.4%) |
| 55 to 64 Years | 27 (8.0%) | 24 (9.1%) |
| 65 to 74 Years | 14 (7.1%) | 8 (6.2%) |
| 75 Years and over | 4 (6.6%) | 8 (9.8%) |
| Total | 77 (5.3%) | 79 (5.9%) |
Income Above Poverty by Sex and Age in Shady Shores
According to the poverty statistics in Shady Shores, males aged 5 years and females aged 5 years are the age groups that are most secure financially, with 100.0% of males and 100.0% of females in these age groups living above the poverty line.
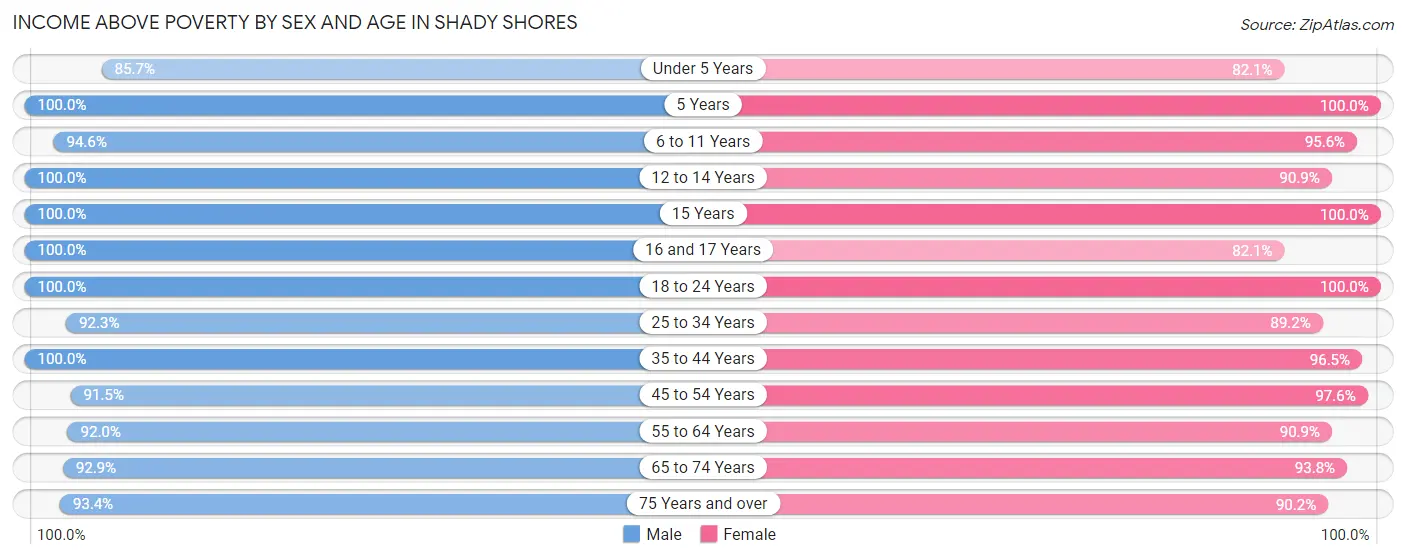
| Age Bracket | Male | Female |
| Under 5 Years | 36 (85.7%) | 23 (82.1%) |
| 5 Years | 27 (100.0%) | 27 (100.0%) |
| 6 to 11 Years | 88 (94.6%) | 109 (95.6%) |
| 12 to 14 Years | 80 (100.0%) | 50 (90.9%) |
| 15 Years | 7 (100.0%) | 17 (100.0%) |
| 16 and 17 Years | 24 (100.0%) | 23 (82.1%) |
| 18 to 24 Years | 176 (100.0%) | 129 (100.0%) |
| 25 to 34 Years | 96 (92.3%) | 58 (89.2%) |
| 35 to 44 Years | 164 (100.0%) | 195 (96.5%) |
| 45 to 54 Years | 139 (91.4%) | 201 (97.6%) |
| 55 to 64 Years | 311 (92.0%) | 241 (90.9%) |
| 65 to 74 Years | 183 (92.9%) | 120 (93.8%) |
| 75 Years and over | 57 (93.4%) | 74 (90.2%) |
| Total | 1,388 (94.7%) | 1,267 (94.1%) |
Income Below Poverty Among Married-Couple Families in Shady Shores
The poverty statistics for married-couple families in Shady Shores show that 3.9% or 29 of the total 739 families live below the poverty line. Families with 3 or 4 children have the highest poverty rate of 8.2%, comprising of 5 families. On the other hand, families with no children have the lowest poverty rate of 2.7%, which includes 12 families.
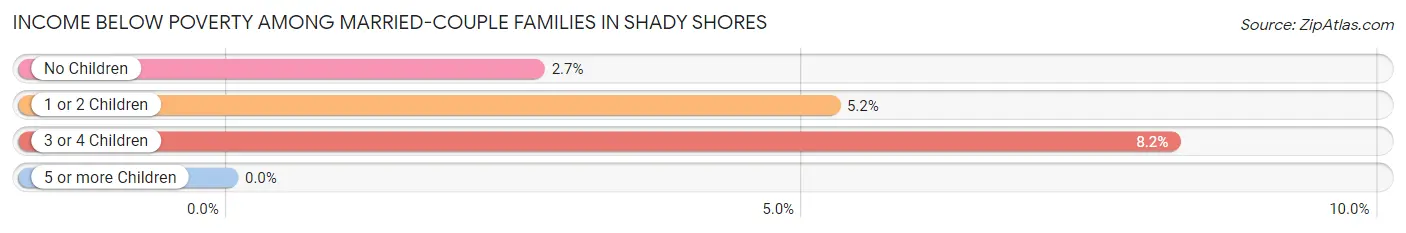
| Children | Above Poverty | Below Poverty |
| No Children | 437 (97.3%) | 12 (2.7%) |
| 1 or 2 Children | 217 (94.8%) | 12 (5.2%) |
| 3 or 4 Children | 56 (91.8%) | 5 (8.2%) |
| 5 or more Children | 0 (0.0%) | 0 (0.0%) |
| Total | 710 (96.1%) | 29 (3.9%) |
Income Below Poverty Among Single-Parent Households in Shady Shores
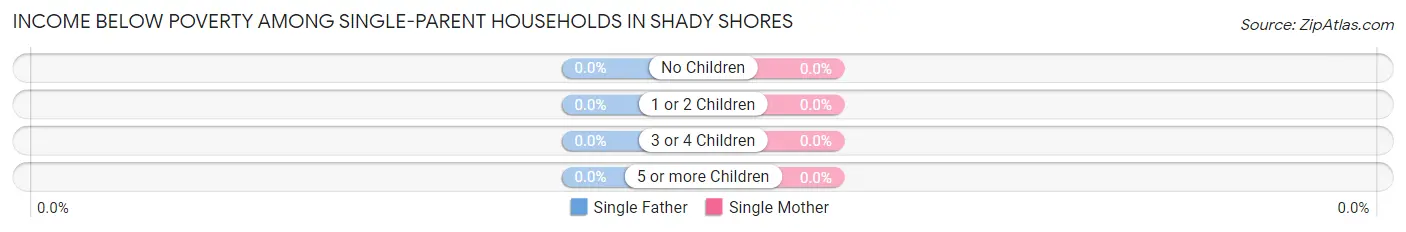
| Children | Single Father | Single Mother |
| No Children | 0 (0.0%) | 0 (0.0%) |
| 1 or 2 Children | 0 (0.0%) | 0 (0.0%) |
| 3 or 4 Children | 0 (0.0%) | 0 (0.0%) |
| 5 or more Children | 0 (0.0%) | 0 (0.0%) |
| Total | 0 (0.0%) | 0 (0.0%) |
Income Below Poverty Among Married-Couple vs Single-Parent Households in Shady Shores
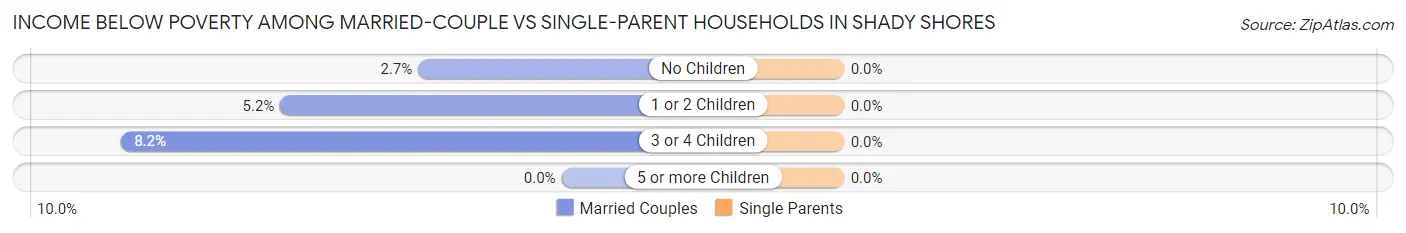
| Children | Married-Couple Families | Single-Parent Households |
| No Children | 12 (2.7%) | 0 (0.0%) |
| 1 or 2 Children | 12 (5.2%) | 0 (0.0%) |
| 3 or 4 Children | 5 (8.2%) | 0 (0.0%) |
| 5 or more Children | 0 (0.0%) | 0 (0.0%) |
| Total | 29 (3.9%) | 0 (0.0%) |
Race in Shady Shores
The most populous races in Shady Shores are White / Caucasian (2,449 | 87.1%), Hispanic or Latino (356 | 12.7%), and Some other Race (157 | 5.6%).
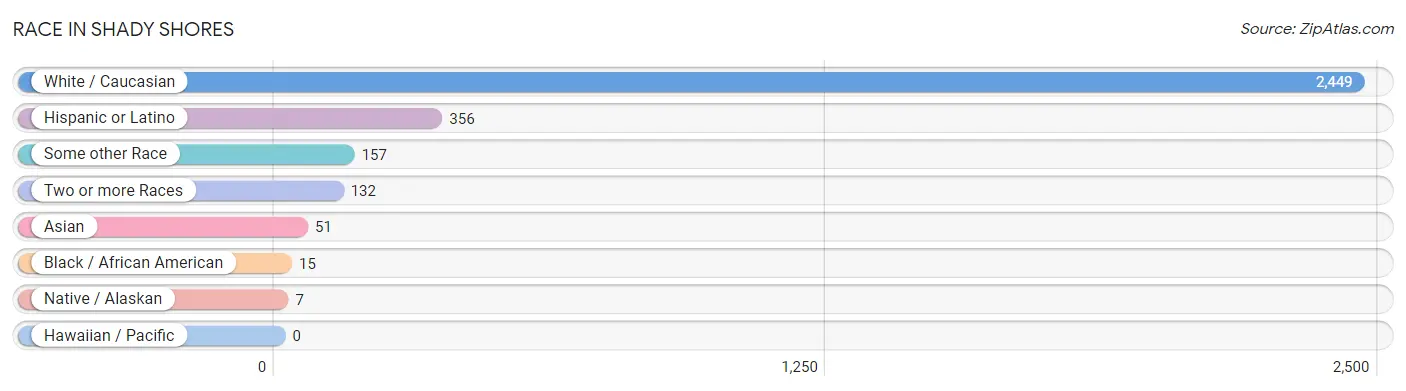
| Race | # Population | % Population |
| Asian | 51 | 1.8% |
| Black / African American | 15 | 0.5% |
| Hawaiian / Pacific | 0 | 0.0% |
| Hispanic or Latino | 356 | 12.7% |
| Native / Alaskan | 7 | 0.3% |
| White / Caucasian | 2,449 | 87.1% |
| Two or more Races | 132 | 4.7% |
| Some other Race | 157 | 5.6% |
| Total | 2,811 | 100.0% |
Ancestry in Shady Shores
The most populous ancestries reported in Shady Shores are English (529 | 18.8%), German (453 | 16.1%), Irish (301 | 10.7%), Mexican (301 | 10.7%), and American (150 | 5.3%), together accounting for 61.7% of all Shady Shores residents.
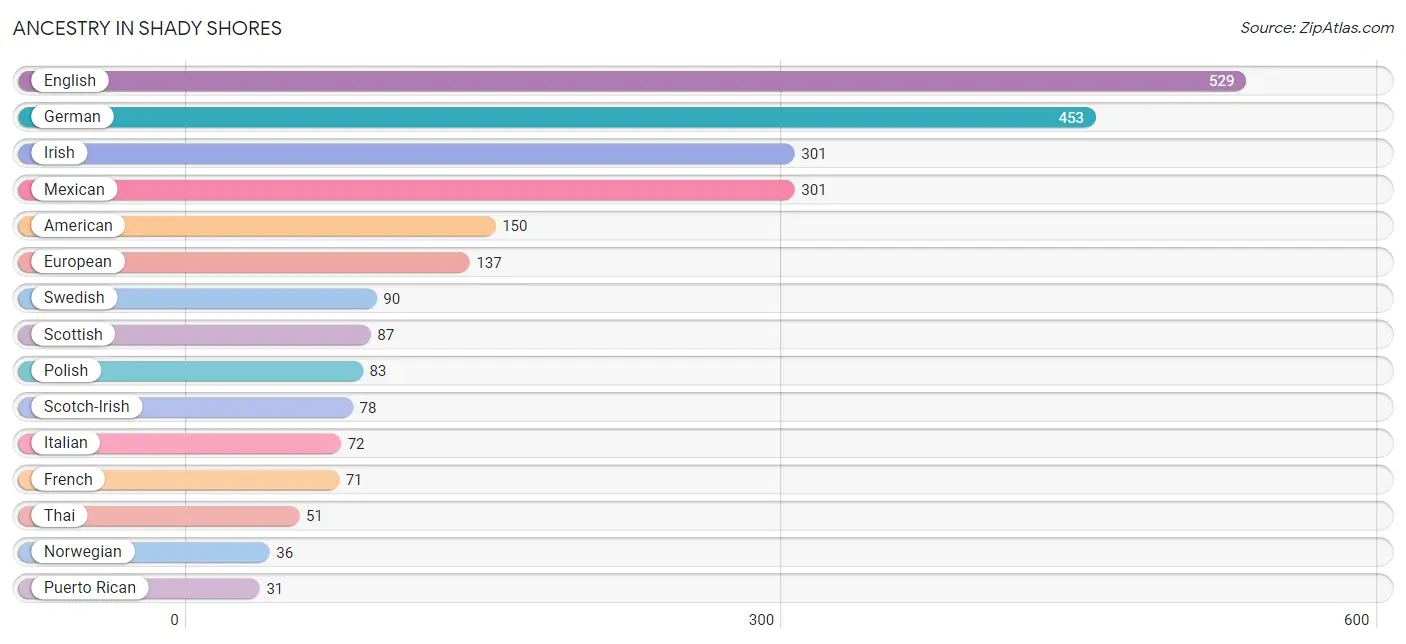
| Ancestry | # Population | % Population |
| American | 150 | 5.3% |
| Austrian | 6 | 0.2% |
| British | 25 | 0.9% |
| Canadian | 11 | 0.4% |
| Celtic | 3 | 0.1% |
| Central American | 24 | 0.9% |
| Cherokee | 12 | 0.4% |
| Choctaw | 5 | 0.2% |
| Czech | 5 | 0.2% |
| Czechoslovakian | 8 | 0.3% |
| Danish | 9 | 0.3% |
| Dutch | 22 | 0.8% |
| Eastern European | 6 | 0.2% |
| English | 529 | 18.8% |
| European | 137 | 4.9% |
| French | 71 | 2.5% |
| German | 453 | 16.1% |
| Greek | 3 | 0.1% |
| Irish | 301 | 10.7% |
| Italian | 72 | 2.6% |
| Mexican | 301 | 10.7% |
| Norwegian | 36 | 1.3% |
| Panamanian | 24 | 0.9% |
| Polish | 83 | 2.9% |
| Portuguese | 7 | 0.3% |
| Puerto Rican | 31 | 1.1% |
| Russian | 23 | 0.8% |
| Scandinavian | 4 | 0.1% |
| Scotch-Irish | 78 | 2.8% |
| Scottish | 87 | 3.1% |
| Serbian | 27 | 1.0% |
| Slovak | 18 | 0.6% |
| Swedish | 90 | 3.2% |
| Swiss | 24 | 0.9% |
| Thai | 51 | 1.8% |
| Welsh | 5 | 0.2% | View All 36 Rows |
Immigrants in Shady Shores
The most numerous immigrant groups reported in Shady Shores came from Central America (97 | 3.5%), Latin America (97 | 3.5%), Mexico (90 | 3.2%), Europe (49 | 1.7%), and Northern Europe (49 | 1.7%), together accounting for 13.6% of all Shady Shores residents.
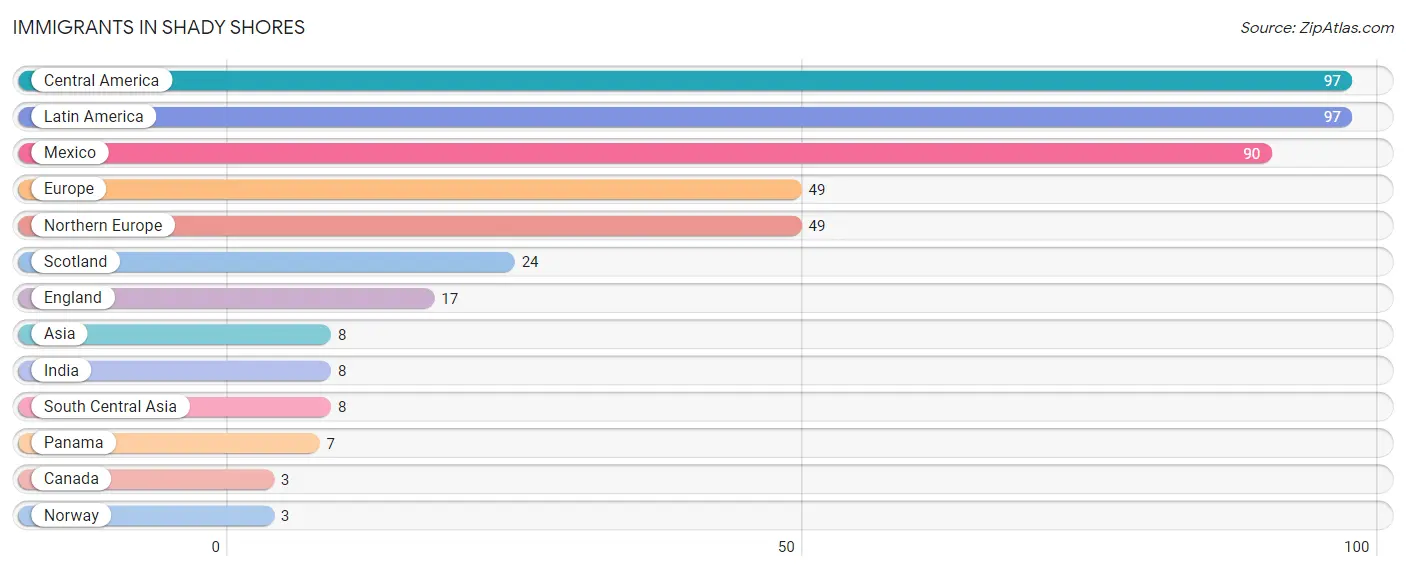
| Immigration Origin | # Population | % Population |
| Asia | 8 | 0.3% |
| Canada | 3 | 0.1% |
| Central America | 97 | 3.5% |
| England | 17 | 0.6% |
| Europe | 49 | 1.7% |
| India | 8 | 0.3% |
| Latin America | 97 | 3.5% |
| Mexico | 90 | 3.2% |
| Northern Europe | 49 | 1.7% |
| Norway | 3 | 0.1% |
| Panama | 7 | 0.3% |
| Scotland | 24 | 0.9% |
| South Central Asia | 8 | 0.3% | View All 13 Rows |
Sex and Age in Shady Shores
Sex and Age in Shady Shores
The most populous age groups in Shady Shores are 55 to 59 Years (181 | 12.3%) for men and 55 to 59 Years (153 | 11.4%) for women.
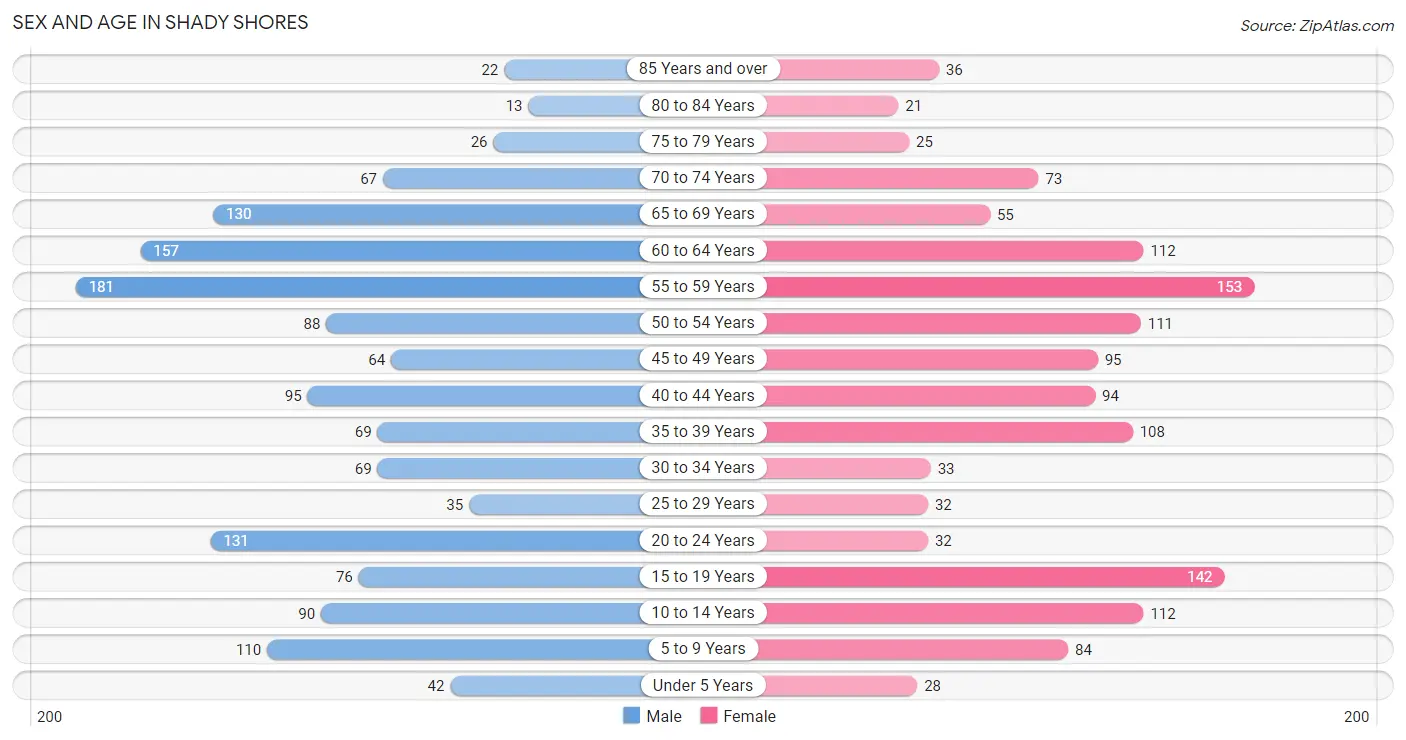
| Age Bracket | Male | Female |
| Under 5 Years | 42 (2.9%) | 28 (2.1%) |
| 5 to 9 Years | 110 (7.5%) | 84 (6.2%) |
| 10 to 14 Years | 90 (6.1%) | 112 (8.3%) |
| 15 to 19 Years | 76 (5.2%) | 142 (10.5%) |
| 20 to 24 Years | 131 (8.9%) | 32 (2.4%) |
| 25 to 29 Years | 35 (2.4%) | 32 (2.4%) |
| 30 to 34 Years | 69 (4.7%) | 33 (2.5%) |
| 35 to 39 Years | 69 (4.7%) | 108 (8.0%) |
| 40 to 44 Years | 95 (6.5%) | 94 (7.0%) |
| 45 to 49 Years | 64 (4.4%) | 95 (7.1%) |
| 50 to 54 Years | 88 (6.0%) | 111 (8.3%) |
| 55 to 59 Years | 181 (12.3%) | 153 (11.4%) |
| 60 to 64 Years | 157 (10.7%) | 112 (8.3%) |
| 65 to 69 Years | 130 (8.9%) | 55 (4.1%) |
| 70 to 74 Years | 67 (4.6%) | 73 (5.4%) |
| 75 to 79 Years | 26 (1.8%) | 25 (1.9%) |
| 80 to 84 Years | 13 (0.9%) | 21 (1.6%) |
| 85 Years and over | 22 (1.5%) | 36 (2.7%) |
| Total | 1,465 (100.0%) | 1,346 (100.0%) |
Families and Households in Shady Shores
Median Family Size in Shady Shores
The median family size in Shady Shores is 3.34 persons per family, with single female/mother families (40 | 5.1%) accounting for the largest median family size of 4.25 persons per family. On the other hand, single male/father families (4 | 0.5%) represent the smallest median family size with 2.50 persons per family.
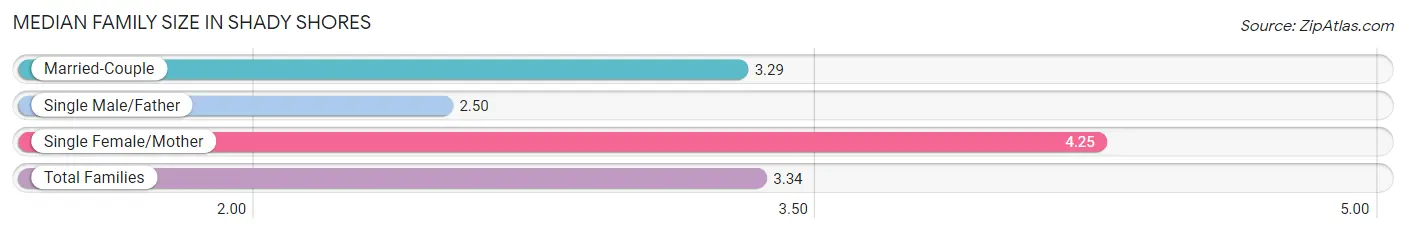
| Family Type | # Families | Family Size |
| Married-Couple | 739 (94.4%) | 3.29 |
| Single Male/Father | 4 (0.5%) | 2.50 |
| Single Female/Mother | 40 (5.1%) | 4.25 |
| Total Families | 783 (100.0%) | 3.34 |
Median Household Size in Shady Shores
The median household size in Shady Shores is 3.00 persons per household, with single female/mother households (40 | 4.3%) accounting for the largest median household size of 4.25 persons per household. non-family households (155 | 16.5%) represent the smallest median household size with 1.14 persons per household.
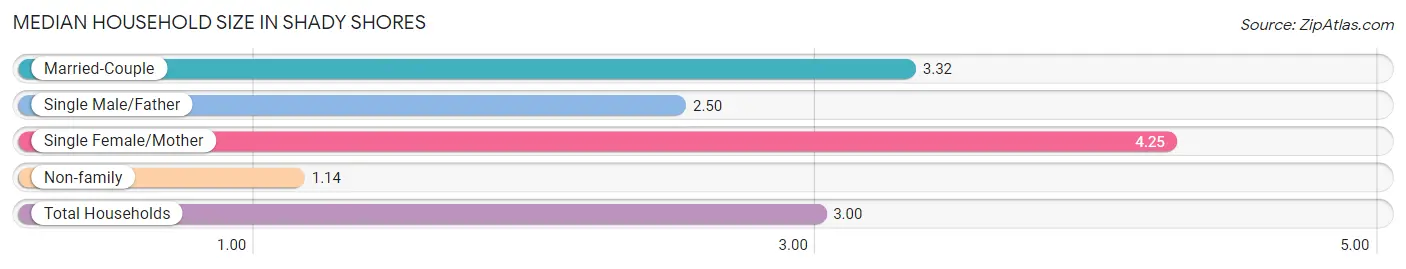
| Household Type | # Households | Household Size |
| Married-Couple | 739 (78.8%) | 3.32 |
| Single Male/Father | 4 (0.4%) | 2.50 |
| Single Female/Mother | 40 (4.3%) | 4.25 |
| Non-family | 155 (16.5%) | 1.14 |
| Total Households | 938 (100.0%) | 3.00 |
Household Size by Marriage Status in Shady Shores
Out of a total of 938 households in Shady Shores, 783 (83.5%) are family households, while 155 (16.5%) are nonfamily households. The most numerous type of family households are 2-person households, comprising 355, and the most common type of nonfamily households are 1-person households, comprising 134.
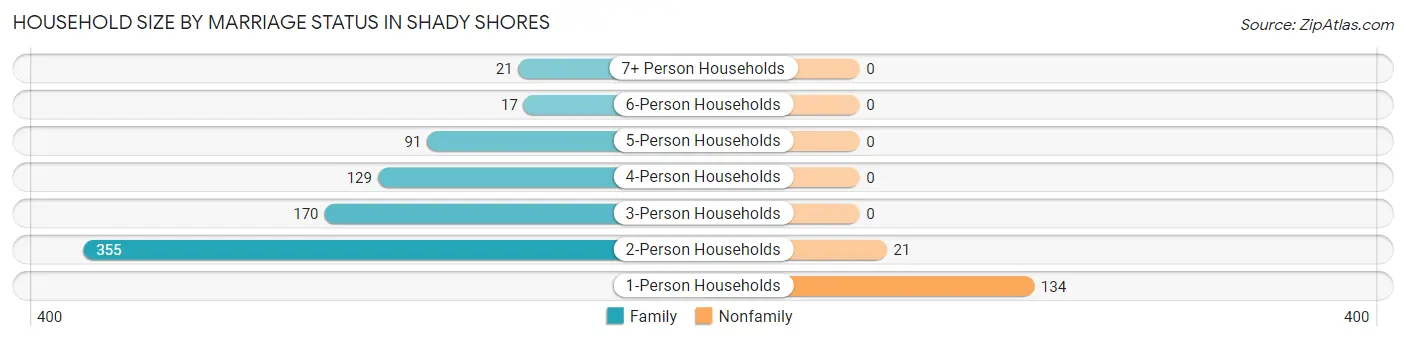
| Household Size | Family Households | Nonfamily Households |
| 1-Person Households | - | 134 (14.3%) |
| 2-Person Households | 355 (37.9%) | 21 (2.2%) |
| 3-Person Households | 170 (18.1%) | 0 (0.0%) |
| 4-Person Households | 129 (13.8%) | 0 (0.0%) |
| 5-Person Households | 91 (9.7%) | 0 (0.0%) |
| 6-Person Households | 17 (1.8%) | 0 (0.0%) |
| 7+ Person Households | 21 (2.2%) | 0 (0.0%) |
| Total | 783 (83.5%) | 155 (16.5%) |
Female Fertility in Shady Shores
Fertility by Age in Shady Shores
Average fertility rate in Shady Shores is 45.0 births per 1,000 women. Women in the age bracket of 20 to 34 years have the highest fertility rate with 134.0 births per 1,000 women. Women in the age bracket of 20 to 34 years acount for 52.0% of all women with births.
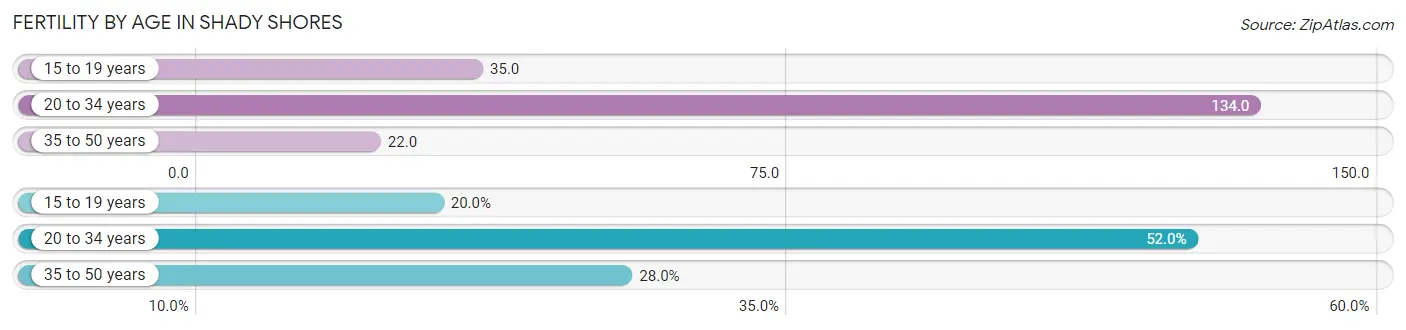
| Age Bracket | Women with Births | Births / 1,000 Women |
| 15 to 19 years | 5 (20.0%) | 35.0 |
| 20 to 34 years | 13 (52.0%) | 134.0 |
| 35 to 50 years | 7 (28.0%) | 22.0 |
| Total | 25 (100.0%) | 45.0 |
Fertility by Age by Marriage Status in Shady Shores
52.0% of women with births (25) in Shady Shores are married. The highest percentage of unmarried women with births falls into 15 to 19 years age bracket with 100.0% of them unmarried at the time of birth, while the lowest percentage of unmarried women with births belong to 20 to 34 years age bracket with 0.0% of them unmarried.
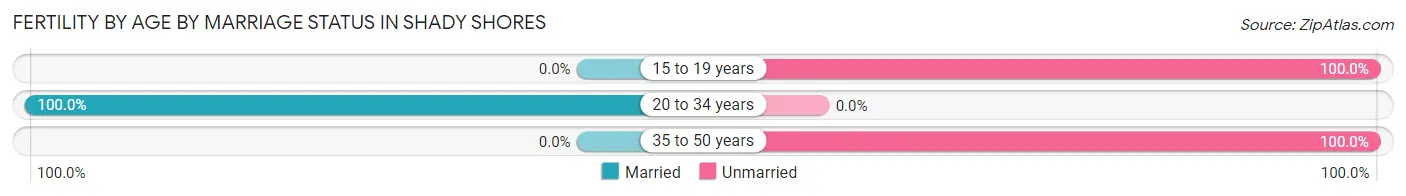
| Age Bracket | Married | Unmarried |
| 15 to 19 years | 0 (0.0%) | 5 (100.0%) |
| 20 to 34 years | 13 (100.0%) | 0 (0.0%) |
| 35 to 50 years | 0 (0.0%) | 7 (100.0%) |
| Total | 13 (52.0%) | 12 (48.0%) |
Fertility by Education in Shady Shores
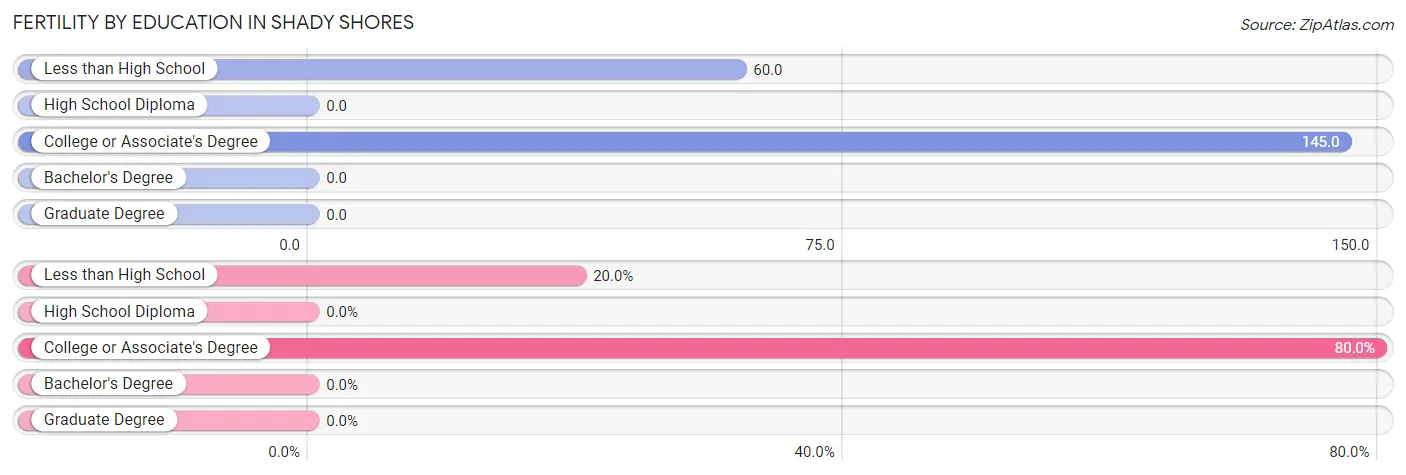
| Educational Attainment | Women with Births | Births / 1,000 Women |
| Less than High School | 5 (20.0%) | 60.0 |
| High School Diploma | 0 (0.0%) | 0.0 |
| College or Associate's Degree | 20 (80.0%) | 145.0 |
| Bachelor's Degree | 0 (0.0%) | 0.0 |
| Graduate Degree | 0 (0.0%) | 0.0 |
| Total | 25 (100.0%) | 45.0 |
Fertility by Education by Marriage Status in Shady Shores
48.0% of women with births in Shady Shores are unmarried. Women with the educational attainment of college or associate's degree are most likely to be married with 65.0% of them married at childbirth, while women with the educational attainment of less than high school are least likely to be married with 100.0% of them unmarried at childbirth.
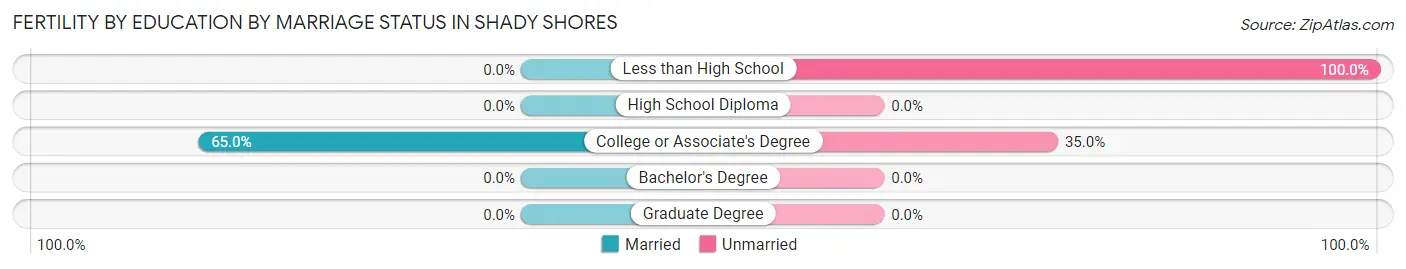
| Educational Attainment | Married | Unmarried |
| Less than High School | 0 (0.0%) | 5 (100.0%) |
| High School Diploma | 0 (0.0%) | 0 (0.0%) |
| College or Associate's Degree | 13 (65.0%) | 7 (35.0%) |
| Bachelor's Degree | 0 (0.0%) | 0 (0.0%) |
| Graduate Degree | 0 (0.0%) | 0 (0.0%) |
| Total | 13 (52.0%) | 12 (48.0%) |
Employment Characteristics in Shady Shores
Employment by Class of Employer in Shady Shores
Among the 1,401 employed individuals in Shady Shores, private company employees (956 | 68.2%), self-employed (not incorporated) (155 | 11.1%), and not-for-profit organizations (84 | 6.0%) make up the most common classes of employment.
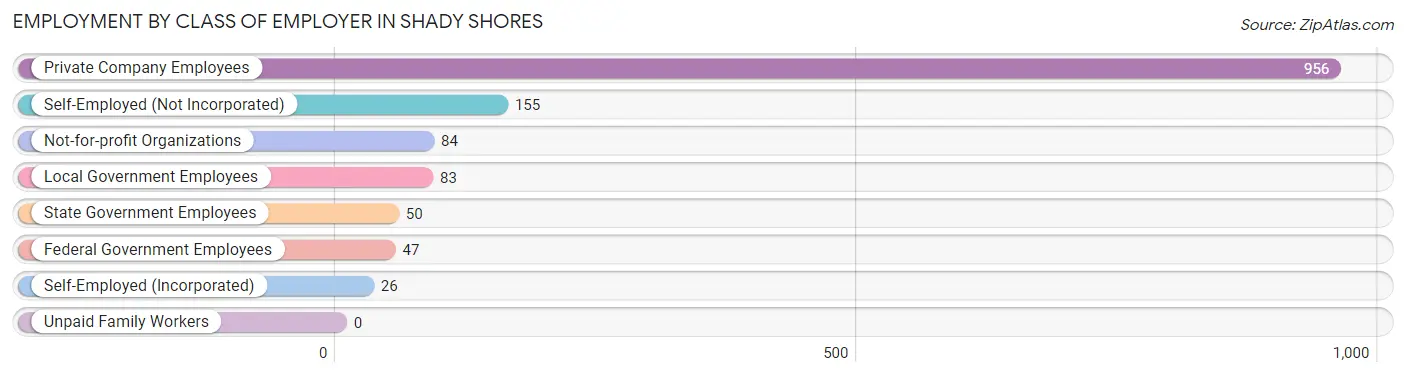
| Employer Class | # Employees | % Employees |
| Private Company Employees | 956 | 68.2% |
| Self-Employed (Incorporated) | 26 | 1.9% |
| Self-Employed (Not Incorporated) | 155 | 11.1% |
| Not-for-profit Organizations | 84 | 6.0% |
| Local Government Employees | 83 | 5.9% |
| State Government Employees | 50 | 3.6% |
| Federal Government Employees | 47 | 3.4% |
| Unpaid Family Workers | 0 | 0.0% |
| Total | 1,401 | 100.0% |
Employment Status by Age in Shady Shores
According to the labor force statistics for Shady Shores, out of the total population over 16 years of age (2,321), 65.1% or 1,511 individuals are in the labor force, with 7.3% or 110 of them unemployed. The age group with the highest labor force participation rate is 20 to 24 years, with 90.2% or 147 individuals in the labor force. Within the labor force, the 65 to 74 years age range has the highest percentage of unemployed individuals, with 14.0% or 6 of them being unemployed.
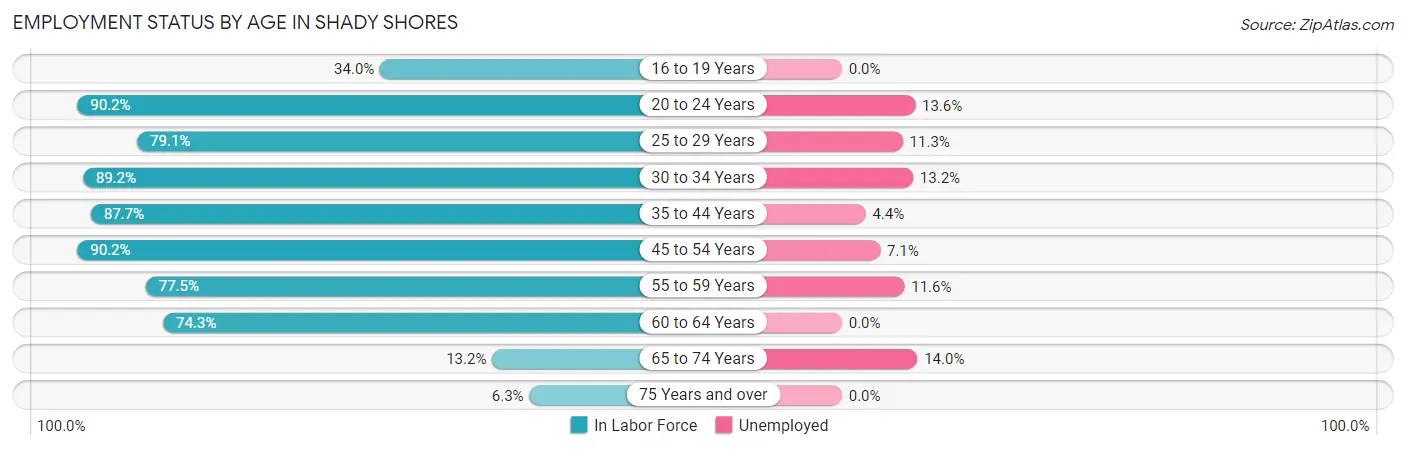
| Age Bracket | In Labor Force | Unemployed |
| 16 to 19 Years | 66 (34.0%) | 0 (0.0%) |
| 20 to 24 Years | 147 (90.2%) | 20 (13.6%) |
| 25 to 29 Years | 53 (79.1%) | 6 (11.3%) |
| 30 to 34 Years | 91 (89.2%) | 12 (13.2%) |
| 35 to 44 Years | 321 (87.7%) | 14 (4.4%) |
| 45 to 54 Years | 323 (90.2%) | 23 (7.1%) |
| 55 to 59 Years | 259 (77.5%) | 30 (11.6%) |
| 60 to 64 Years | 200 (74.3%) | 0 (0.0%) |
| 65 to 74 Years | 43 (13.2%) | 6 (14.0%) |
| 75 Years and over | 9 (6.3%) | 0 (0.0%) |
| Total | 1,511 (65.1%) | 110 (7.3%) |
Employment Status by Educational Attainment in Shady Shores
According to labor force statistics for Shady Shores, 83.4% of individuals (1,248) out of the total population between 25 and 64 years of age (1,496) are in the labor force, with 6.8% or 85 of them being unemployed. The group with the highest labor force participation rate are those with the educational attainment of less than high school, with 84.7% or 50 individuals in the labor force. Within the labor force, individuals with less than high school education have the highest percentage of unemployment, with 18.0% or 9 of them being unemployed.
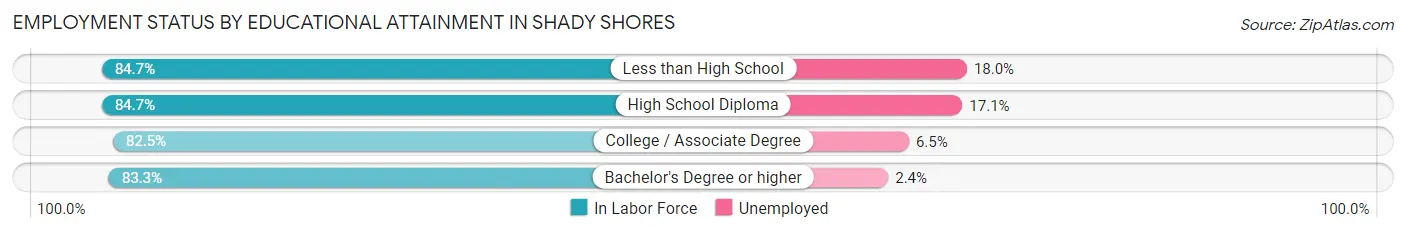
| Educational Attainment | In Labor Force | Unemployed |
| Less than High School | 50 (84.7%) | 11 (18.0%) |
| High School Diploma | 216 (84.7%) | 44 (17.1%) |
| College / Associate Degree | 387 (82.5%) | 30 (6.5%) |
| Bachelor's Degree or higher | 594 (83.3%) | 17 (2.4%) |
| Total | 1,248 (83.4%) | 102 (6.8%) |
Employment Occupations by Sex in Shady Shores
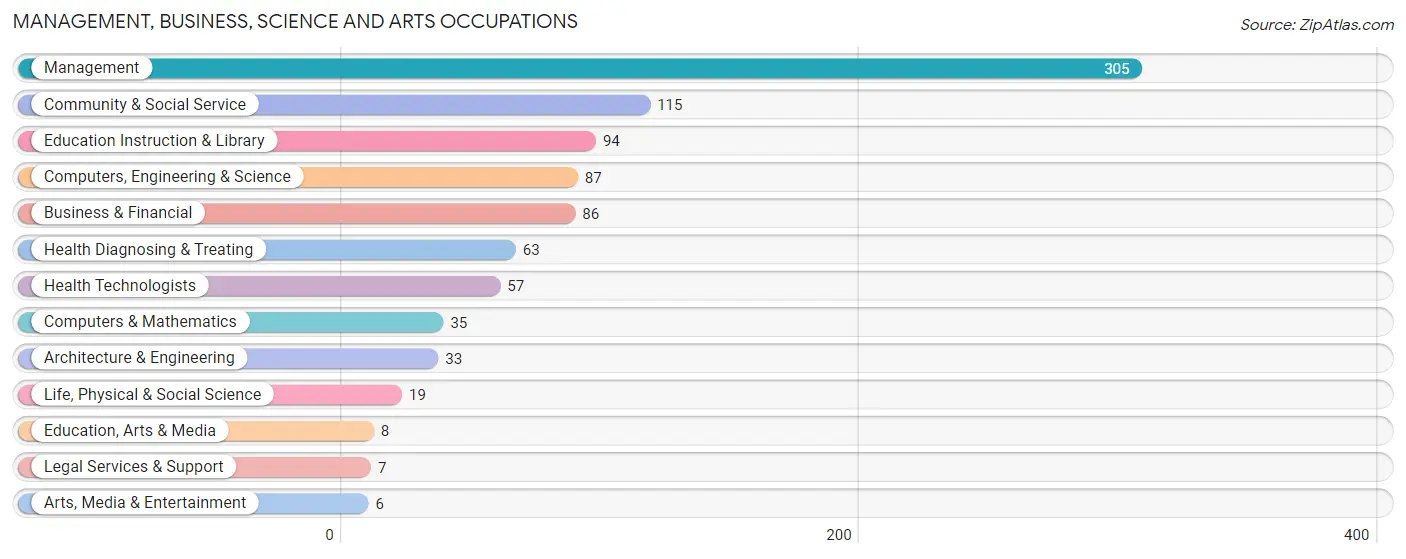
Management, Business, Science and Arts Occupations
The most common Management, Business, Science and Arts occupations in Shady Shores are Management (305 | 21.8%), Community & Social Service (115 | 8.2%), Education Instruction & Library (94 | 6.7%), Computers, Engineering & Science (87 | 6.2%), and Business & Financial (86 | 6.1%).
Management, Business, Science and Arts Occupations by Sex
Within the Management, Business, Science and Arts occupations in Shady Shores, the most male-oriented occupations are Computers, Engineering & Science (100.0%), Computers & Mathematics (100.0%), and Architecture & Engineering (100.0%), while the most female-oriented occupations are Education, Arts & Media (100.0%), Legal Services & Support (100.0%), and Arts, Media & Entertainment (100.0%).
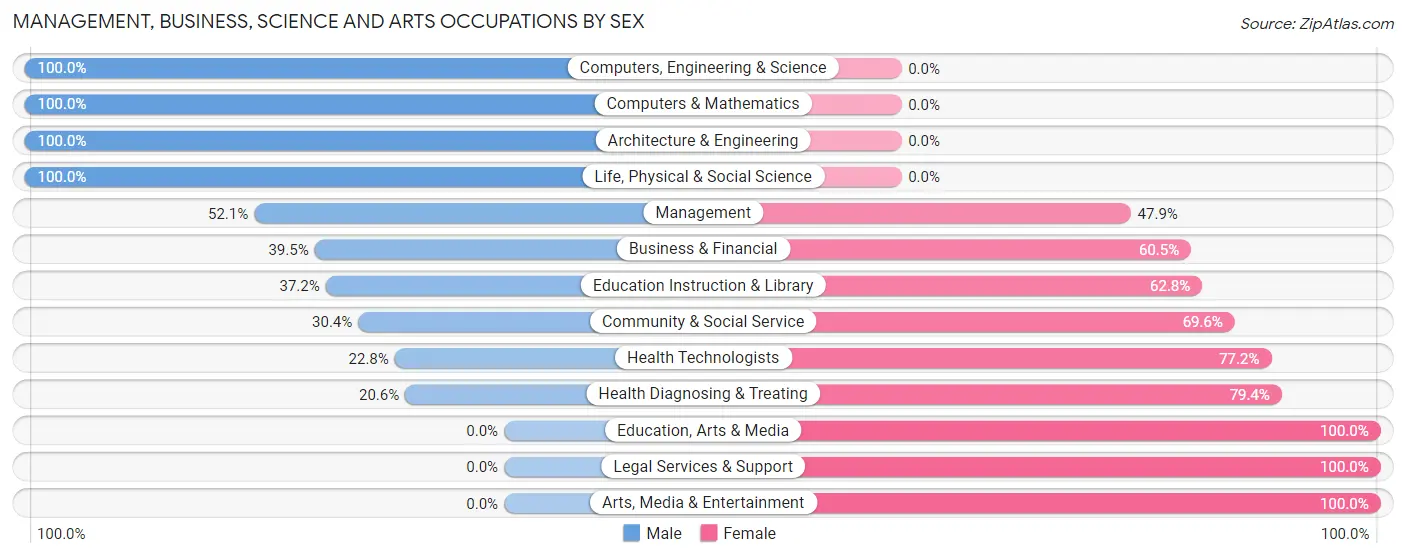
| Occupation | Male | Female |
| Management | 159 (52.1%) | 146 (47.9%) |
| Business & Financial | 34 (39.5%) | 52 (60.5%) |
| Computers, Engineering & Science | 87 (100.0%) | 0 (0.0%) |
| Computers & Mathematics | 35 (100.0%) | 0 (0.0%) |
| Architecture & Engineering | 33 (100.0%) | 0 (0.0%) |
| Life, Physical & Social Science | 19 (100.0%) | 0 (0.0%) |
| Community & Social Service | 35 (30.4%) | 80 (69.6%) |
| Education, Arts & Media | 0 (0.0%) | 8 (100.0%) |
| Legal Services & Support | 0 (0.0%) | 7 (100.0%) |
| Education Instruction & Library | 35 (37.2%) | 59 (62.8%) |
| Arts, Media & Entertainment | 0 (0.0%) | 6 (100.0%) |
| Health Diagnosing & Treating | 13 (20.6%) | 50 (79.4%) |
| Health Technologists | 13 (22.8%) | 44 (77.2%) |
| Total (Category) | 328 (50.0%) | 328 (50.0%) |
| Total (Overall) | 768 (54.8%) | 633 (45.2%) |
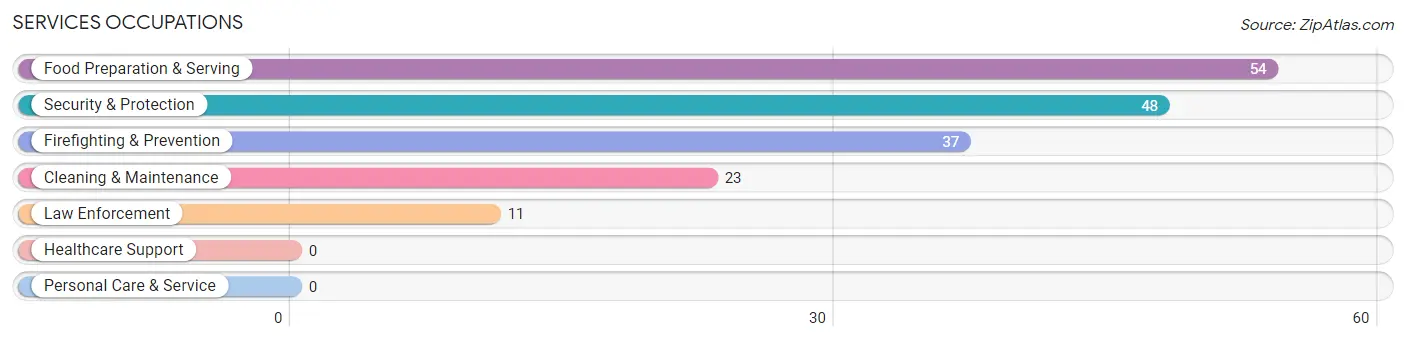
Services Occupations
The most common Services occupations in Shady Shores are Food Preparation & Serving (54 | 3.8%), Security & Protection (48 | 3.4%), Firefighting & Prevention (37 | 2.6%), Cleaning & Maintenance (23 | 1.6%), and Law Enforcement (11 | 0.8%).
Services Occupations by Sex
Within the Services occupations in Shady Shores, the most male-oriented occupations are Law Enforcement (100.0%), Cleaning & Maintenance (65.2%), and Food Preparation & Serving (64.8%), while the most female-oriented occupations are Firefighting & Prevention (78.4%), Security & Protection (60.4%), and Food Preparation & Serving (35.2%).
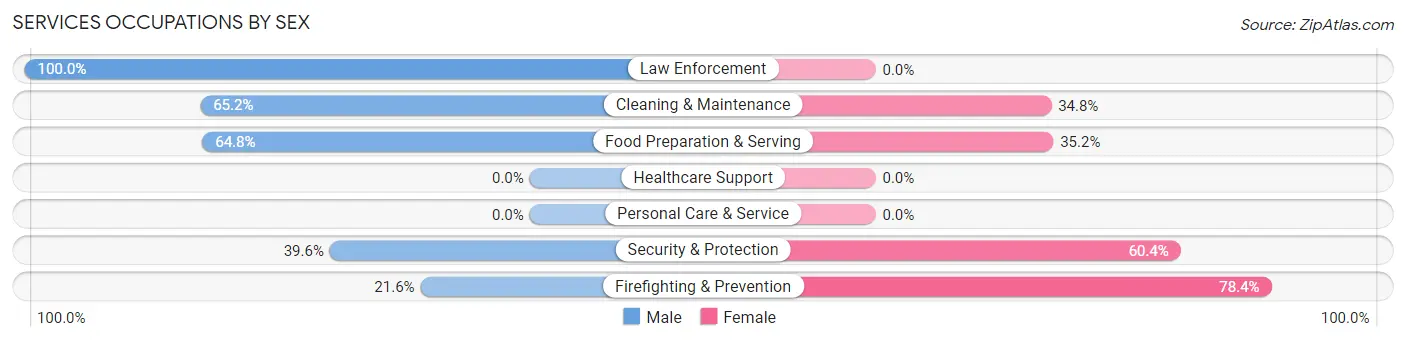
| Occupation | Male | Female |
| Healthcare Support | 0 (0.0%) | 0 (0.0%) |
| Security & Protection | 19 (39.6%) | 29 (60.4%) |
| Firefighting & Prevention | 8 (21.6%) | 29 (78.4%) |
| Law Enforcement | 11 (100.0%) | 0 (0.0%) |
| Food Preparation & Serving | 35 (64.8%) | 19 (35.2%) |
| Cleaning & Maintenance | 15 (65.2%) | 8 (34.8%) |
| Personal Care & Service | 0 (0.0%) | 0 (0.0%) |
| Total (Category) | 69 (55.2%) | 56 (44.8%) |
| Total (Overall) | 768 (54.8%) | 633 (45.2%) |
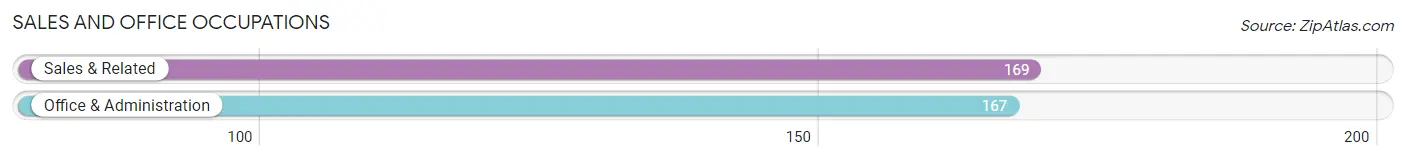
Sales and Office Occupations
The most common Sales and Office occupations in Shady Shores are Sales & Related (169 | 12.1%), and Office & Administration (167 | 11.9%).
Sales and Office Occupations by Sex
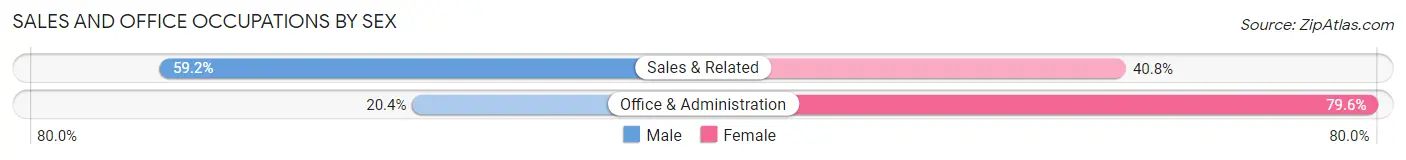
| Occupation | Male | Female |
| Sales & Related | 100 (59.2%) | 69 (40.8%) |
| Office & Administration | 34 (20.4%) | 133 (79.6%) |
| Total (Category) | 134 (39.9%) | 202 (60.1%) |
| Total (Overall) | 768 (54.8%) | 633 (45.2%) |
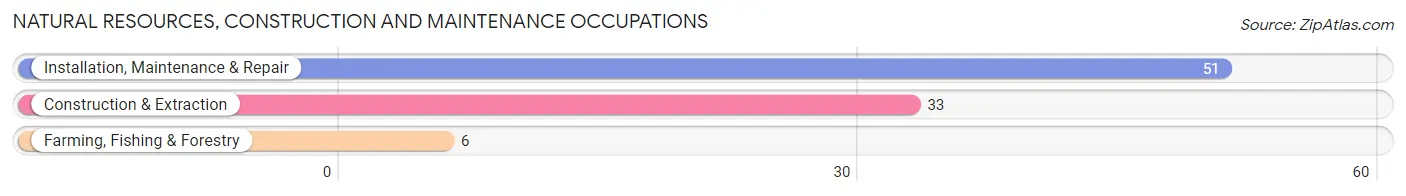
Natural Resources, Construction and Maintenance Occupations
The most common Natural Resources, Construction and Maintenance occupations in Shady Shores are Installation, Maintenance & Repair (51 | 3.6%), Construction & Extraction (33 | 2.4%), and Farming, Fishing & Forestry (6 | 0.4%).
Natural Resources, Construction and Maintenance Occupations by Sex
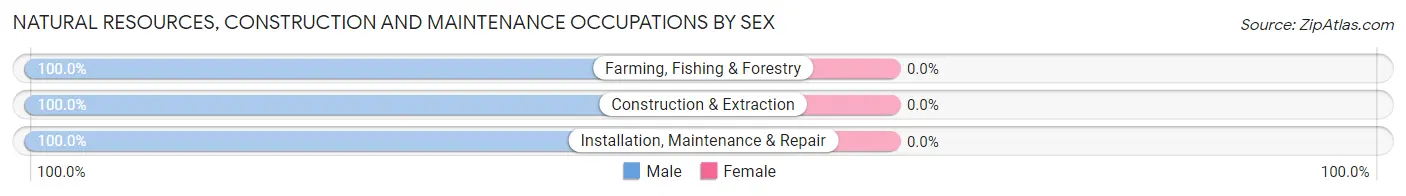
| Occupation | Male | Female |
| Farming, Fishing & Forestry | 6 (100.0%) | 0 (0.0%) |
| Construction & Extraction | 33 (100.0%) | 0 (0.0%) |
| Installation, Maintenance & Repair | 51 (100.0%) | 0 (0.0%) |
| Total (Category) | 90 (100.0%) | 0 (0.0%) |
| Total (Overall) | 768 (54.8%) | 633 (45.2%) |
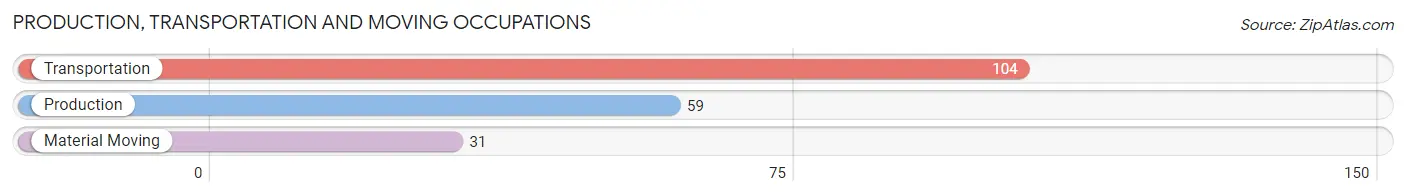
Production, Transportation and Moving Occupations
The most common Production, Transportation and Moving occupations in Shady Shores are Transportation (104 | 7.4%), Production (59 | 4.2%), and Material Moving (31 | 2.2%).
Production, Transportation and Moving Occupations by Sex
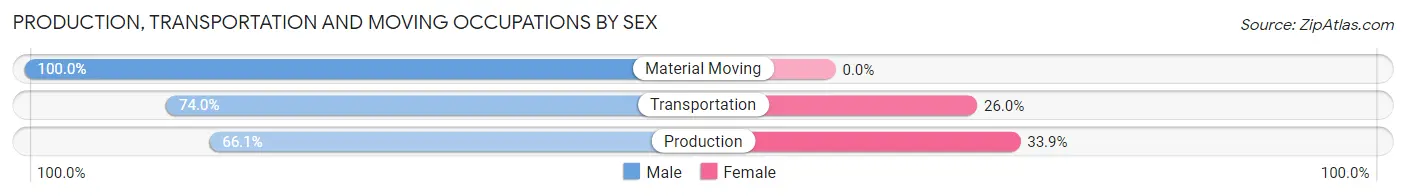
| Occupation | Male | Female |
| Production | 39 (66.1%) | 20 (33.9%) |
| Transportation | 77 (74.0%) | 27 (26.0%) |
| Material Moving | 31 (100.0%) | 0 (0.0%) |
| Total (Category) | 147 (75.8%) | 47 (24.2%) |
| Total (Overall) | 768 (54.8%) | 633 (45.2%) |
Employment Industries by Sex in Shady Shores
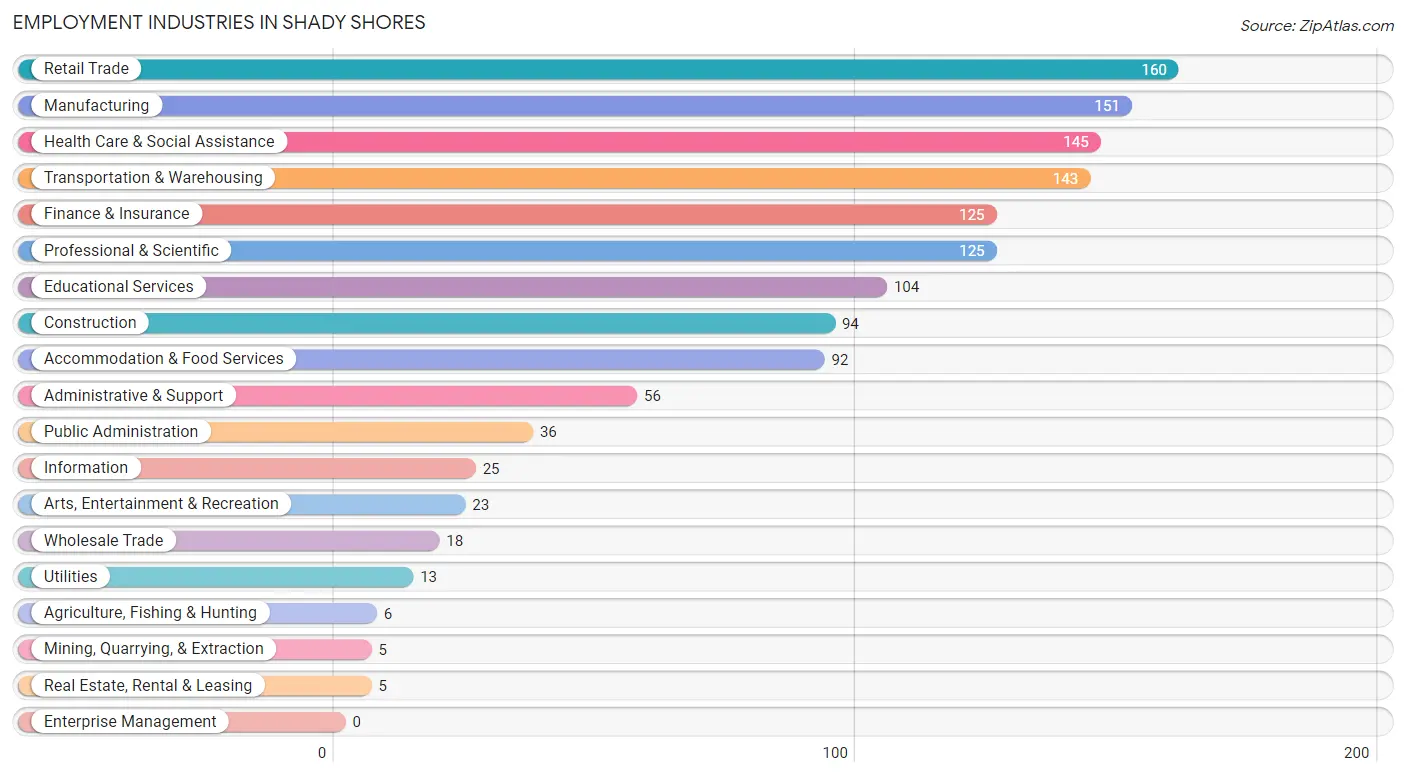
Employment Industries in Shady Shores
The major employment industries in Shady Shores include Retail Trade (160 | 11.4%), Manufacturing (151 | 10.8%), Health Care & Social Assistance (145 | 10.3%), Transportation & Warehousing (143 | 10.2%), and Finance & Insurance (125 | 8.9%).
Employment Industries by Sex in Shady Shores
The Shady Shores industries that see more men than women are Agriculture, Fishing & Hunting (100.0%), Wholesale Trade (100.0%), and Manufacturing (86.1%), whereas the industries that tend to have a higher number of women are Mining, Quarrying, & Extraction (100.0%), Utilities (100.0%), and Administrative & Support (87.5%).
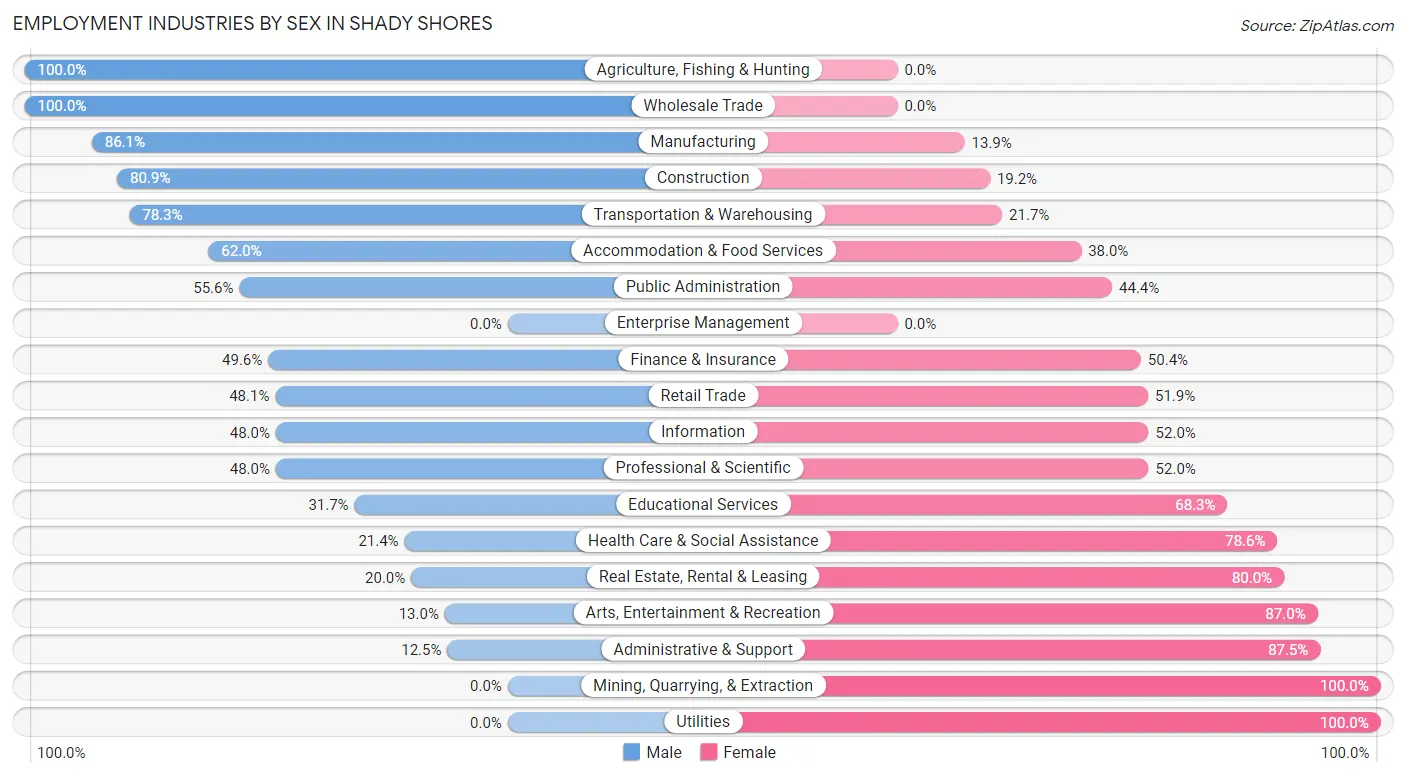
| Industry | Male | Female |
| Agriculture, Fishing & Hunting | 6 (100.0%) | 0 (0.0%) |
| Mining, Quarrying, & Extraction | 0 (0.0%) | 5 (100.0%) |
| Construction | 76 (80.8%) | 18 (19.2%) |
| Manufacturing | 130 (86.1%) | 21 (13.9%) |
| Wholesale Trade | 18 (100.0%) | 0 (0.0%) |
| Retail Trade | 77 (48.1%) | 83 (51.9%) |
| Transportation & Warehousing | 112 (78.3%) | 31 (21.7%) |
| Utilities | 0 (0.0%) | 13 (100.0%) |
| Information | 12 (48.0%) | 13 (52.0%) |
| Finance & Insurance | 62 (49.6%) | 63 (50.4%) |
| Real Estate, Rental & Leasing | 1 (20.0%) | 4 (80.0%) |
| Professional & Scientific | 60 (48.0%) | 65 (52.0%) |
| Enterprise Management | 0 (0.0%) | 0 (0.0%) |
| Administrative & Support | 7 (12.5%) | 49 (87.5%) |
| Educational Services | 33 (31.7%) | 71 (68.3%) |
| Health Care & Social Assistance | 31 (21.4%) | 114 (78.6%) |
| Arts, Entertainment & Recreation | 3 (13.0%) | 20 (87.0%) |
| Accommodation & Food Services | 57 (62.0%) | 35 (38.0%) |
| Public Administration | 20 (55.6%) | 16 (44.4%) |
| Total | 768 (54.8%) | 633 (45.2%) |
Education in Shady Shores
School Enrollment in Shady Shores
The most common levels of schooling among the 642 students in Shady Shores are high school (176 | 27.4%), middle school (158 | 24.6%), and elementary school (129 | 20.1%).
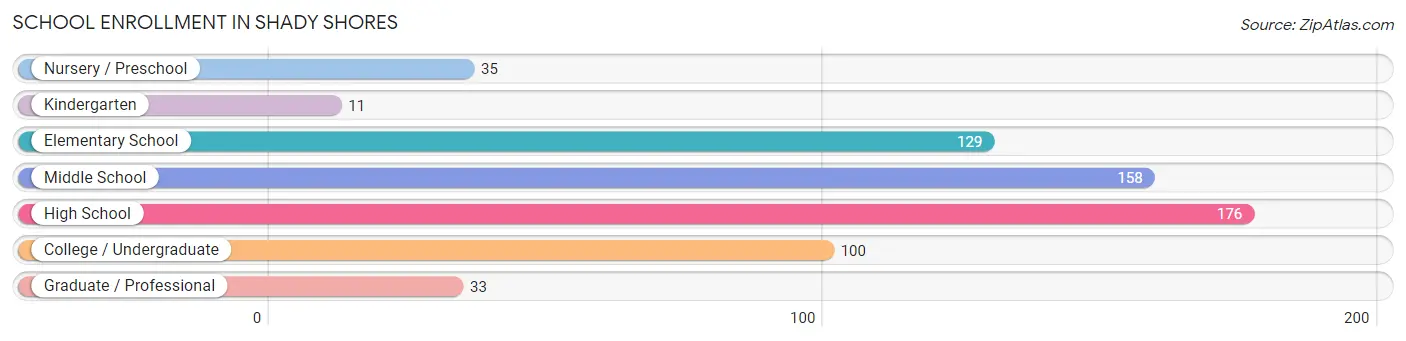
| School Level | # Students | % Students |
| Nursery / Preschool | 35 | 5.4% |
| Kindergarten | 11 | 1.7% |
| Elementary School | 129 | 20.1% |
| Middle School | 158 | 24.6% |
| High School | 176 | 27.4% |
| College / Undergraduate | 100 | 15.6% |
| Graduate / Professional | 33 | 5.1% |
| Total | 642 | 100.0% |
School Enrollment by Age by Funding Source in Shady Shores
Out of a total of 642 students who are enrolled in schools in Shady Shores, 91 (14.2%) attend a private institution, while the remaining 551 (85.8%) are enrolled in public schools. The age group of 15 to 17 year olds has the highest likelihood of being enrolled in private schools, with 30 (39.5% in the age bracket) enrolled. Conversely, the age group of 3 to 4 year olds has the lowest likelihood of being enrolled in a private school, with 18 (100.0% in the age bracket) attending a public institution.
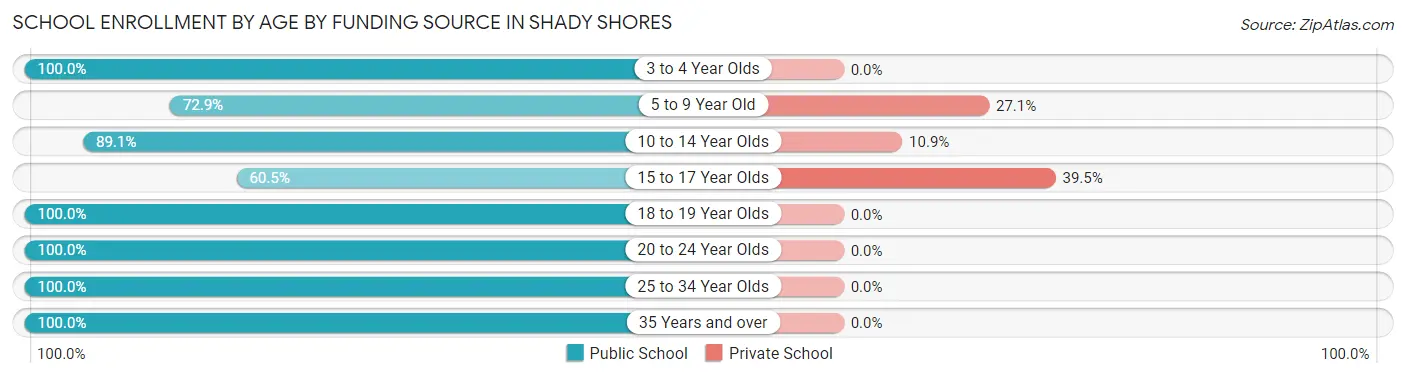
| Age Bracket | Public School | Private School |
| 3 to 4 Year Olds | 18 (100.0%) | 0 (0.0%) |
| 5 to 9 Year Old | 105 (72.9%) | 39 (27.1%) |
| 10 to 14 Year Olds | 180 (89.1%) | 22 (10.9%) |
| 15 to 17 Year Olds | 46 (60.5%) | 30 (39.5%) |
| 18 to 19 Year Olds | 111 (100.0%) | 0 (0.0%) |
| 20 to 24 Year Olds | 44 (100.0%) | 0 (0.0%) |
| 25 to 34 Year Olds | 30 (100.0%) | 0 (0.0%) |
| 35 Years and over | 17 (100.0%) | 0 (0.0%) |
| Total | 551 (85.8%) | 91 (14.2%) |
Educational Attainment by Field of Study in Shady Shores
Business (295 | 31.1%), science & technology (95 | 10.0%), education (83 | 8.7%), social sciences (72 | 7.6%), and engineering (66 | 7.0%) are the most common fields of study among 949 individuals in Shady Shores who have obtained a bachelor's degree or higher.
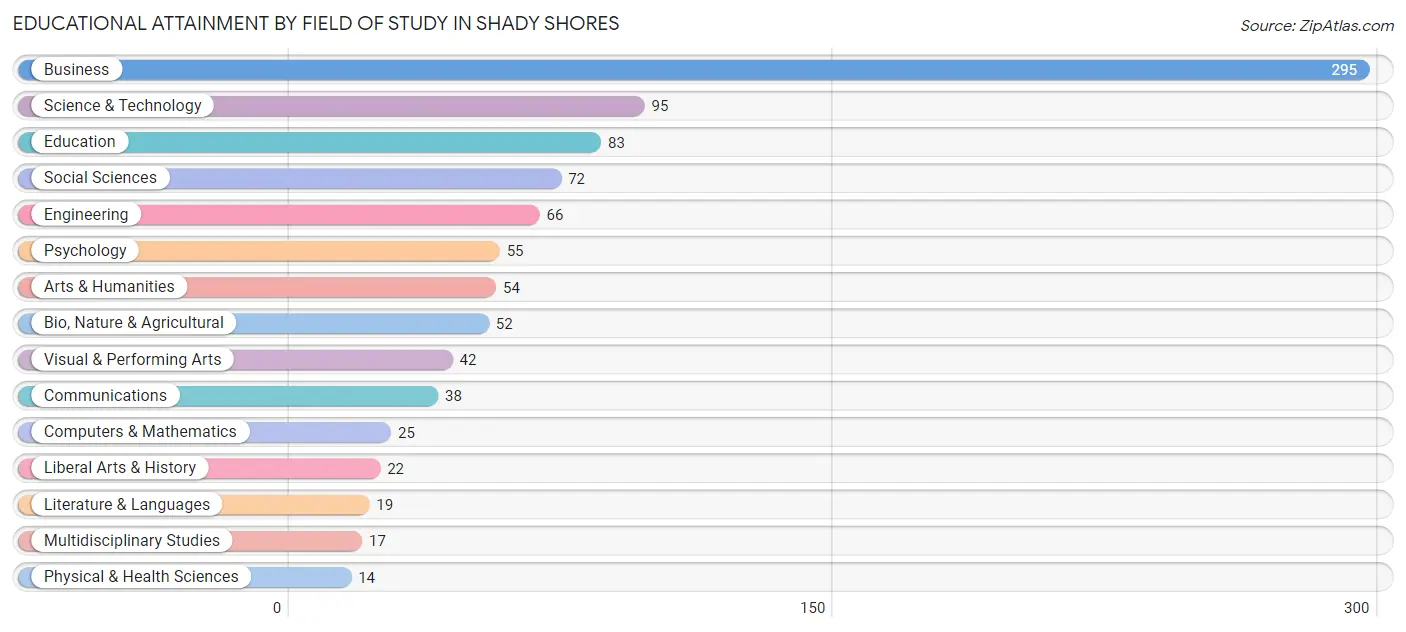
| Field of Study | # Graduates | % Graduates |
| Computers & Mathematics | 25 | 2.6% |
| Bio, Nature & Agricultural | 52 | 5.5% |
| Physical & Health Sciences | 14 | 1.5% |
| Psychology | 55 | 5.8% |
| Social Sciences | 72 | 7.6% |
| Engineering | 66 | 7.0% |
| Multidisciplinary Studies | 17 | 1.8% |
| Science & Technology | 95 | 10.0% |
| Business | 295 | 31.1% |
| Education | 83 | 8.7% |
| Literature & Languages | 19 | 2.0% |
| Liberal Arts & History | 22 | 2.3% |
| Visual & Performing Arts | 42 | 4.4% |
| Communications | 38 | 4.0% |
| Arts & Humanities | 54 | 5.7% |
| Total | 949 | 100.0% |
Transportation & Commute in Shady Shores
Vehicle Availability by Sex in Shady Shores
The most prevalent vehicle ownership categories in Shady Shores are males with 2 vehicles (322, accounting for 41.9%) and females with 2 vehicles (265, making up 50.9%).
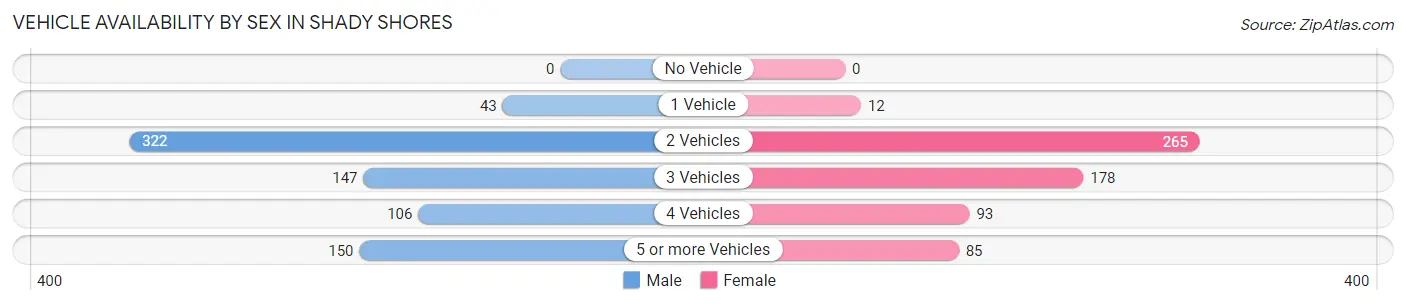
| Vehicles Available | Male | Female |
| No Vehicle | 0 (0.0%) | 0 (0.0%) |
| 1 Vehicle | 43 (5.6%) | 12 (1.9%) |
| 2 Vehicles | 322 (41.9%) | 265 (41.9%) |
| 3 Vehicles | 147 (19.1%) | 178 (28.1%) |
| 4 Vehicles | 106 (13.8%) | 93 (14.7%) |
| 5 or more Vehicles | 150 (19.5%) | 85 (13.4%) |
| Total | 768 (100.0%) | 633 (100.0%) |
Commute Time in Shady Shores
The most frequently occuring commute durations in Shady Shores are 15 to 19 minutes (211 commuters, 17.9%), 30 to 34 minutes (190 commuters, 16.1%), and 45 to 59 minutes (161 commuters, 13.6%).
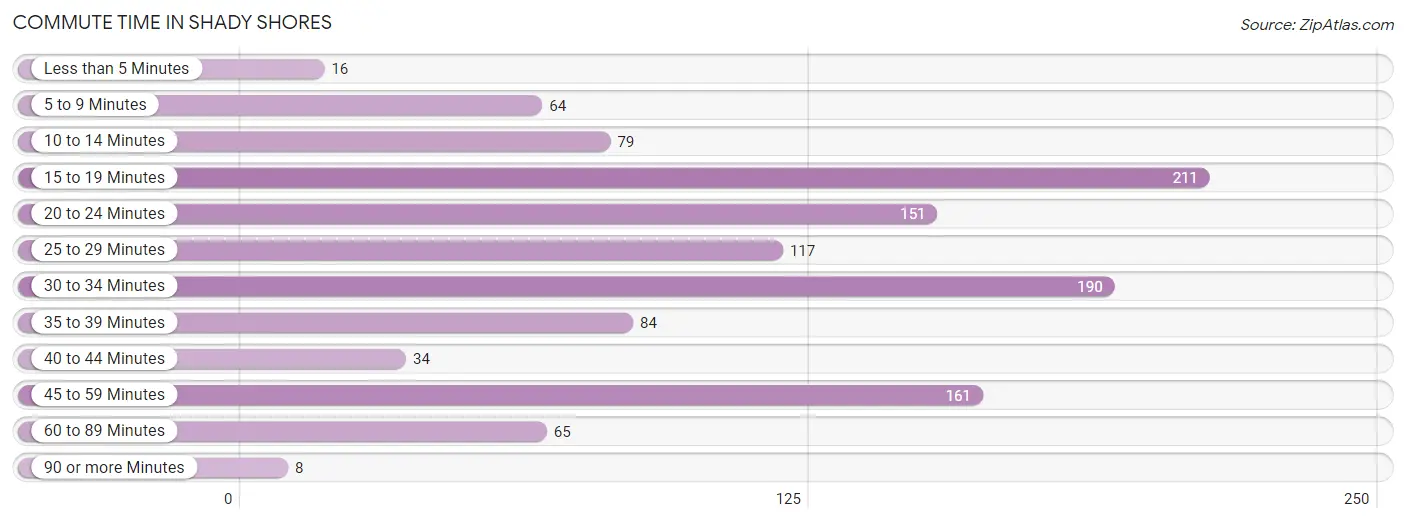
| Commute Time | # Commuters | % Commuters |
| Less than 5 Minutes | 16 | 1.4% |
| 5 to 9 Minutes | 64 | 5.4% |
| 10 to 14 Minutes | 79 | 6.7% |
| 15 to 19 Minutes | 211 | 17.9% |
| 20 to 24 Minutes | 151 | 12.8% |
| 25 to 29 Minutes | 117 | 9.9% |
| 30 to 34 Minutes | 190 | 16.1% |
| 35 to 39 Minutes | 84 | 7.1% |
| 40 to 44 Minutes | 34 | 2.9% |
| 45 to 59 Minutes | 161 | 13.6% |
| 60 to 89 Minutes | 65 | 5.5% |
| 90 or more Minutes | 8 | 0.7% |
Commute Time by Sex in Shady Shores
The most common commute times in Shady Shores are 45 to 59 minutes (124 commuters, 19.0%) for males and 15 to 19 minutes (137 commuters, 26.0%) for females.
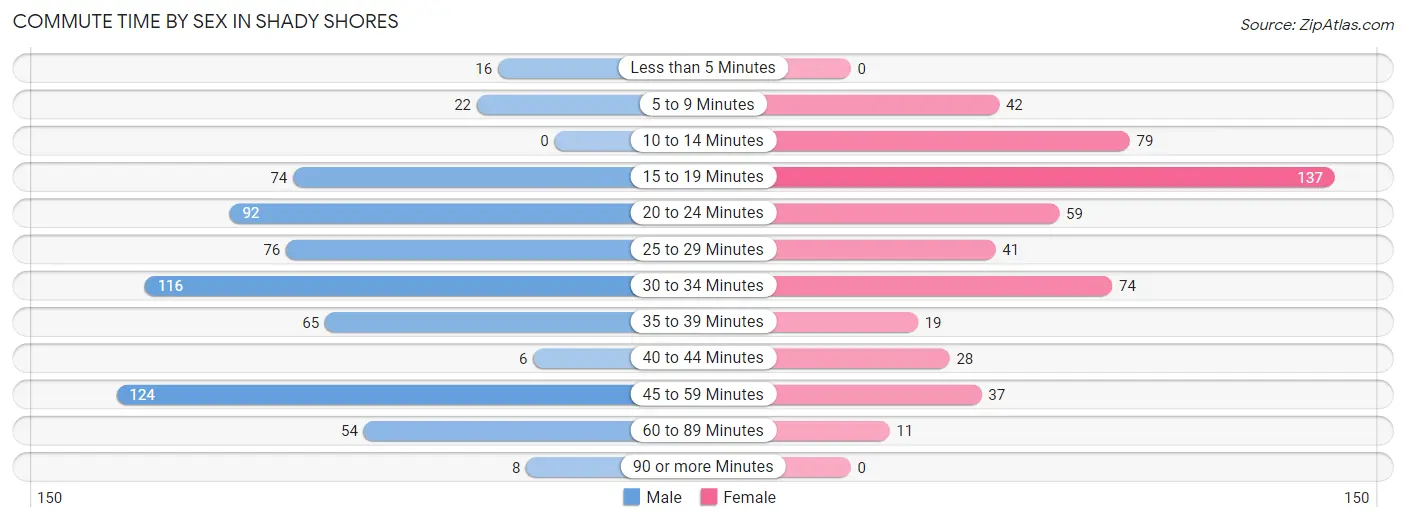
| Commute Time | Male | Female |
| Less than 5 Minutes | 16 (2.5%) | 0 (0.0%) |
| 5 to 9 Minutes | 22 (3.4%) | 42 (8.0%) |
| 10 to 14 Minutes | 0 (0.0%) | 79 (15.0%) |
| 15 to 19 Minutes | 74 (11.3%) | 137 (26.0%) |
| 20 to 24 Minutes | 92 (14.1%) | 59 (11.2%) |
| 25 to 29 Minutes | 76 (11.6%) | 41 (7.8%) |
| 30 to 34 Minutes | 116 (17.8%) | 74 (14.0%) |
| 35 to 39 Minutes | 65 (10.0%) | 19 (3.6%) |
| 40 to 44 Minutes | 6 (0.9%) | 28 (5.3%) |
| 45 to 59 Minutes | 124 (19.0%) | 37 (7.0%) |
| 60 to 89 Minutes | 54 (8.3%) | 11 (2.1%) |
| 90 or more Minutes | 8 (1.2%) | 0 (0.0%) |
Time of Departure to Work by Sex in Shady Shores
The most frequent times of departure to work in Shady Shores are 8:00 AM to 8:29 AM (77, 11.8%) for males and 7:00 AM to 7:29 AM (128, 24.3%) for females.
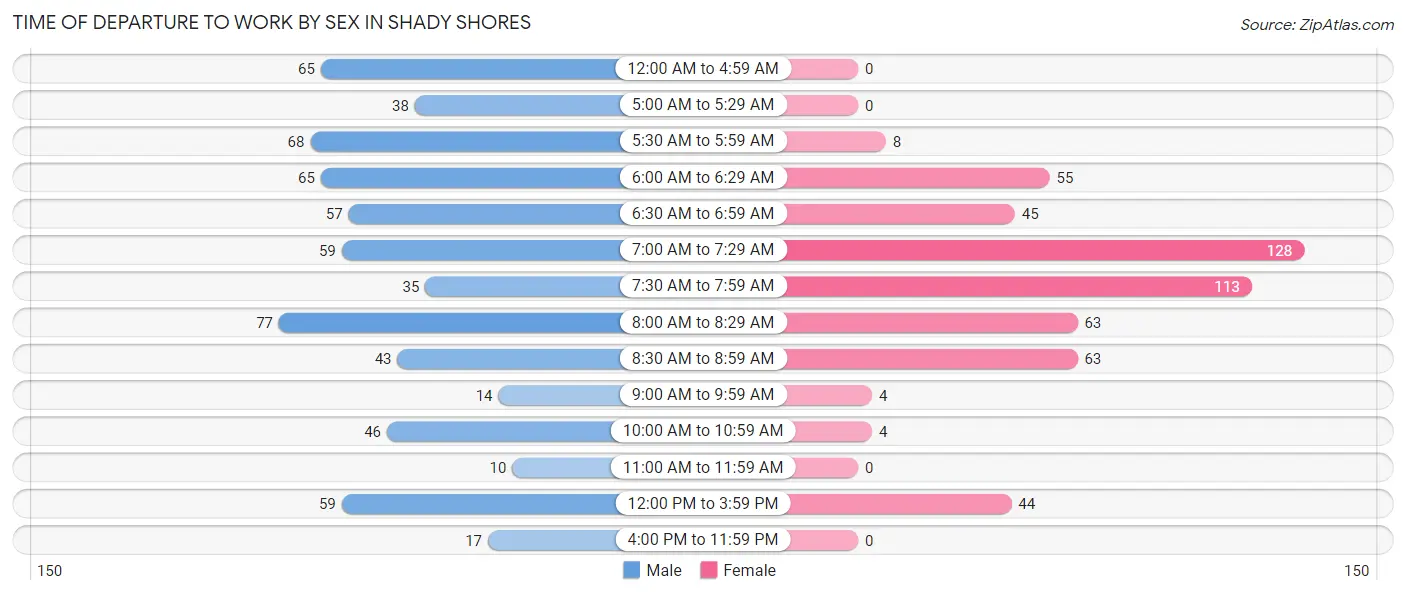
| Time of Departure | Male | Female |
| 12:00 AM to 4:59 AM | 65 (10.0%) | 0 (0.0%) |
| 5:00 AM to 5:29 AM | 38 (5.8%) | 0 (0.0%) |
| 5:30 AM to 5:59 AM | 68 (10.4%) | 8 (1.5%) |
| 6:00 AM to 6:29 AM | 65 (10.0%) | 55 (10.4%) |
| 6:30 AM to 6:59 AM | 57 (8.7%) | 45 (8.5%) |
| 7:00 AM to 7:29 AM | 59 (9.0%) | 128 (24.3%) |
| 7:30 AM to 7:59 AM | 35 (5.4%) | 113 (21.4%) |
| 8:00 AM to 8:29 AM | 77 (11.8%) | 63 (11.9%) |
| 8:30 AM to 8:59 AM | 43 (6.6%) | 63 (11.9%) |
| 9:00 AM to 9:59 AM | 14 (2.1%) | 4 (0.8%) |
| 10:00 AM to 10:59 AM | 46 (7.0%) | 4 (0.8%) |
| 11:00 AM to 11:59 AM | 10 (1.5%) | 0 (0.0%) |
| 12:00 PM to 3:59 PM | 59 (9.0%) | 44 (8.4%) |
| 4:00 PM to 11:59 PM | 17 (2.6%) | 0 (0.0%) |
| Total | 653 (100.0%) | 527 (100.0%) |
Housing Occupancy in Shady Shores
Occupancy by Ownership in Shady Shores
Of the total 938 dwellings in Shady Shores, owner-occupied units account for 901 (96.1%), while renter-occupied units make up 37 (3.9%).
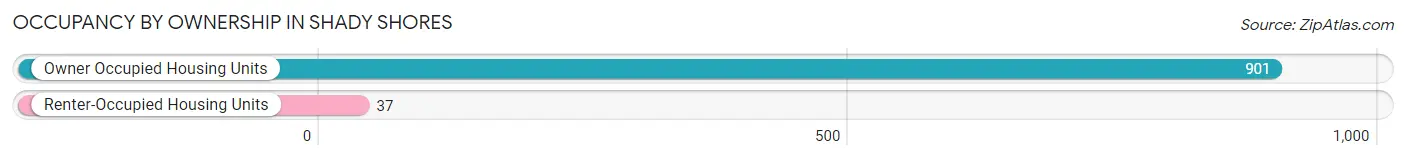
| Occupancy | # Housing Units | % Housing Units |
| Owner Occupied Housing Units | 901 | 96.1% |
| Renter-Occupied Housing Units | 37 | 3.9% |
| Total Occupied Housing Units | 938 | 100.0% |
Occupancy by Household Size in Shady Shores
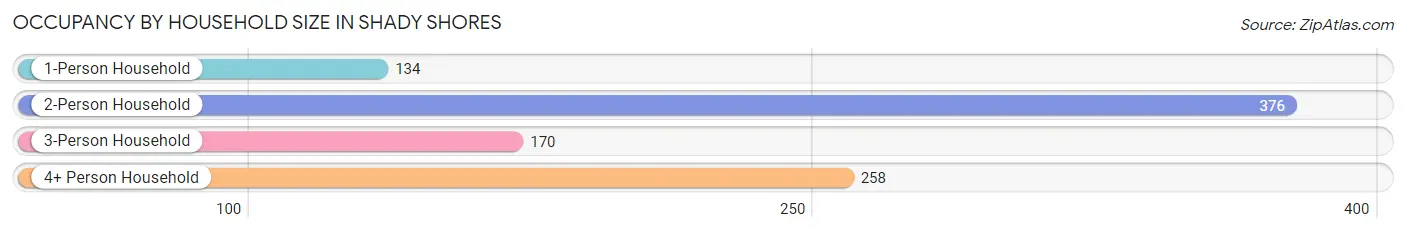
| Household Size | # Housing Units | % Housing Units |
| 1-Person Household | 134 | 14.3% |
| 2-Person Household | 376 | 40.1% |
| 3-Person Household | 170 | 18.1% |
| 4+ Person Household | 258 | 27.5% |
| Total Housing Units | 938 | 100.0% |
Occupancy by Ownership by Household Size in Shady Shores
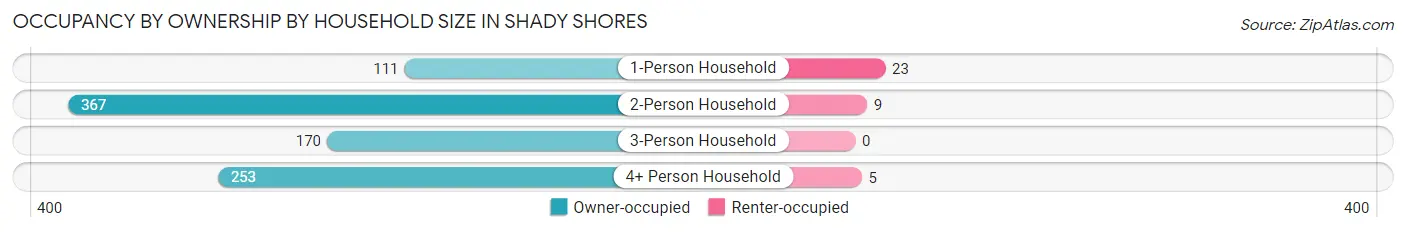
| Household Size | Owner-occupied | Renter-occupied |
| 1-Person Household | 111 (82.8%) | 23 (17.2%) |
| 2-Person Household | 367 (97.6%) | 9 (2.4%) |
| 3-Person Household | 170 (100.0%) | 0 (0.0%) |
| 4+ Person Household | 253 (98.1%) | 5 (1.9%) |
| Total Housing Units | 901 (96.1%) | 37 (3.9%) |
Occupancy by Educational Attainment in Shady Shores
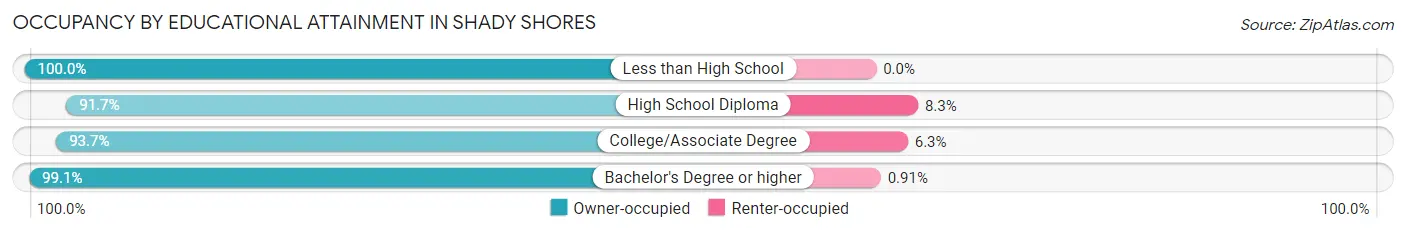
| Household Size | Owner-occupied | Renter-occupied |
| Less than High School | 21 (100.0%) | 0 (0.0%) |
| High School Diploma | 144 (91.7%) | 13 (8.3%) |
| College/Associate Degree | 299 (93.7%) | 20 (6.3%) |
| Bachelor's Degree or higher | 437 (99.1%) | 4 (0.9%) |
Occupancy by Age of Householder in Shady Shores
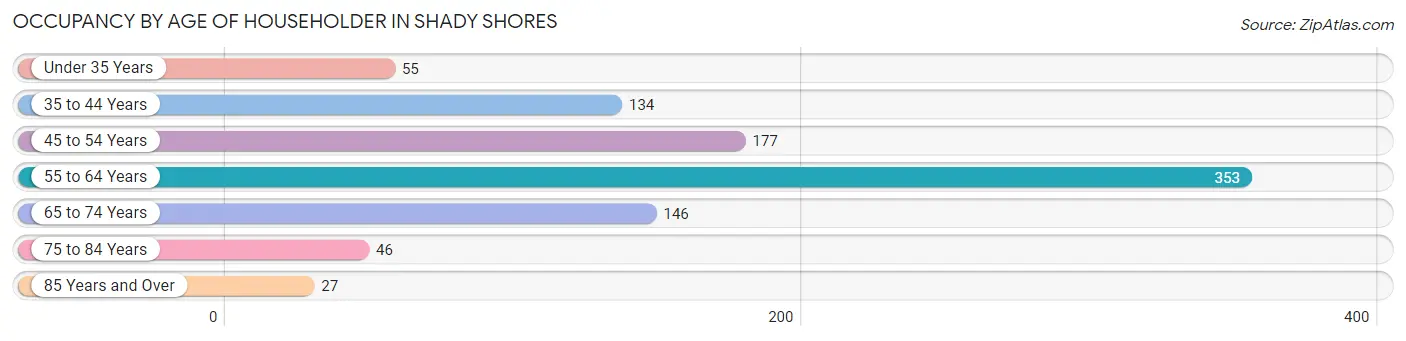
| Age Bracket | # Households | % Households |
| Under 35 Years | 55 | 5.9% |
| 35 to 44 Years | 134 | 14.3% |
| 45 to 54 Years | 177 | 18.9% |
| 55 to 64 Years | 353 | 37.6% |
| 65 to 74 Years | 146 | 15.6% |
| 75 to 84 Years | 46 | 4.9% |
| 85 Years and Over | 27 | 2.9% |
| Total | 938 | 100.0% |
Housing Finances in Shady Shores
Median Income by Occupancy in Shady Shores
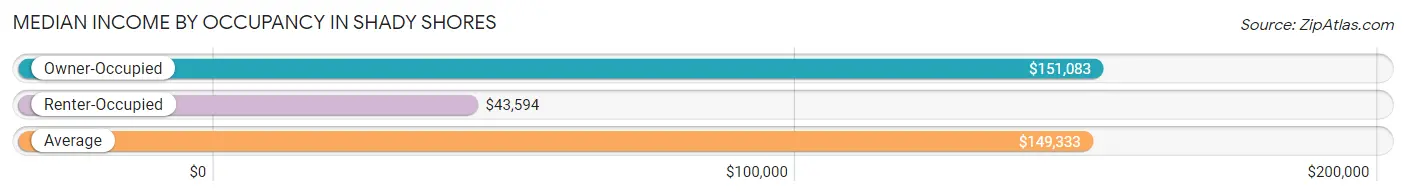
| Occupancy Type | # Households | Median Income |
| Owner-Occupied | 901 (96.1%) | $151,083 |
| Renter-Occupied | 37 (3.9%) | $43,594 |
| Average | 938 (100.0%) | $149,333 |
Occupancy by Householder Income Bracket in Shady Shores
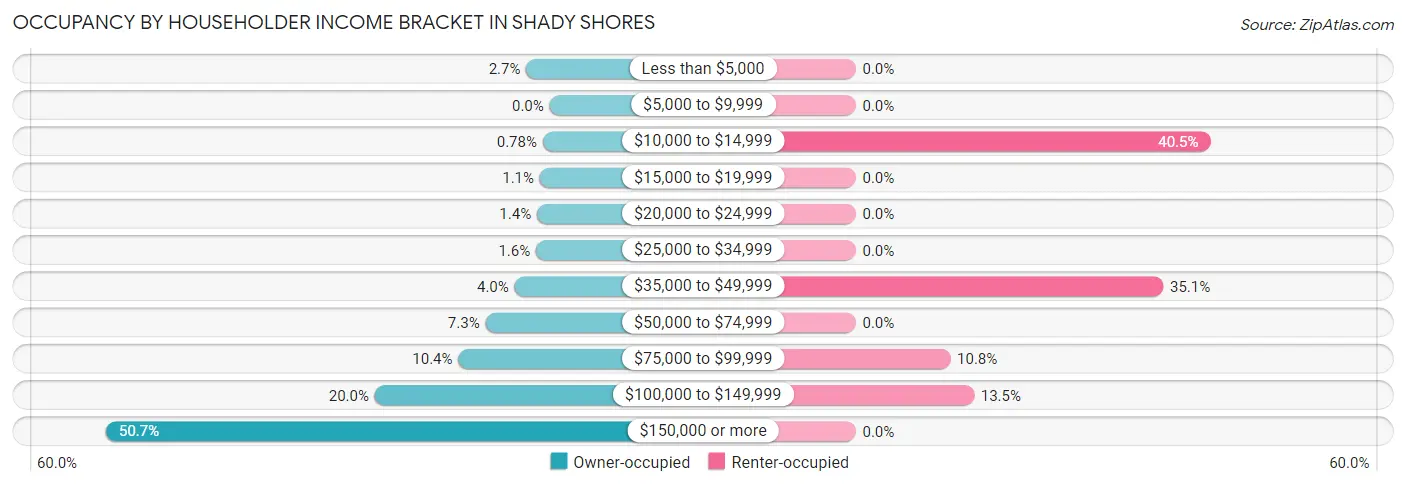
| Income Bracket | Owner-occupied | Renter-occupied |
| Less than $5,000 | 24 (2.7%) | 0 (0.0%) |
| $5,000 to $9,999 | 0 (0.0%) | 0 (0.0%) |
| $10,000 to $14,999 | 7 (0.8%) | 15 (40.5%) |
| $15,000 to $19,999 | 10 (1.1%) | 0 (0.0%) |
| $20,000 to $24,999 | 13 (1.4%) | 0 (0.0%) |
| $25,000 to $34,999 | 14 (1.5%) | 0 (0.0%) |
| $35,000 to $49,999 | 36 (4.0%) | 13 (35.1%) |
| $50,000 to $74,999 | 66 (7.3%) | 0 (0.0%) |
| $75,000 to $99,999 | 94 (10.4%) | 4 (10.8%) |
| $100,000 to $149,999 | 180 (20.0%) | 5 (13.5%) |
| $150,000 or more | 457 (50.7%) | 0 (0.0%) |
| Total | 901 (100.0%) | 37 (100.0%) |
Monthly Housing Cost Tiers in Shady Shores
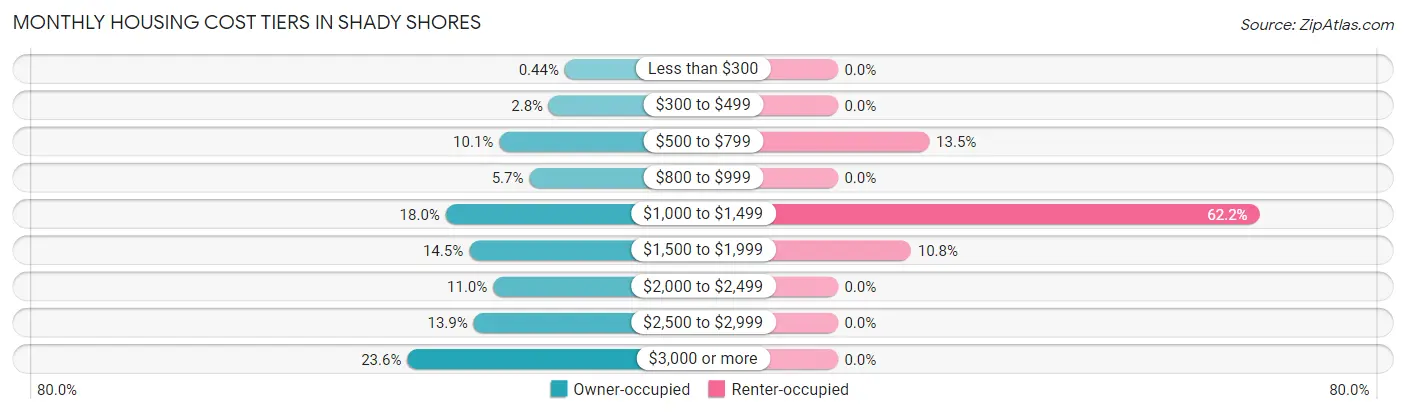
| Monthly Cost | Owner-occupied | Renter-occupied |
| Less than $300 | 4 (0.4%) | 0 (0.0%) |
| $300 to $499 | 25 (2.8%) | 0 (0.0%) |
| $500 to $799 | 91 (10.1%) | 5 (13.5%) |
| $800 to $999 | 51 (5.7%) | 0 (0.0%) |
| $1,000 to $1,499 | 162 (18.0%) | 23 (62.2%) |
| $1,500 to $1,999 | 131 (14.5%) | 4 (10.8%) |
| $2,000 to $2,499 | 99 (11.0%) | 0 (0.0%) |
| $2,500 to $2,999 | 125 (13.9%) | 0 (0.0%) |
| $3,000 or more | 213 (23.6%) | 0 (0.0%) |
| Total | 901 (100.0%) | 37 (100.0%) |
Physical Housing Characteristics in Shady Shores
Housing Structures in Shady Shores
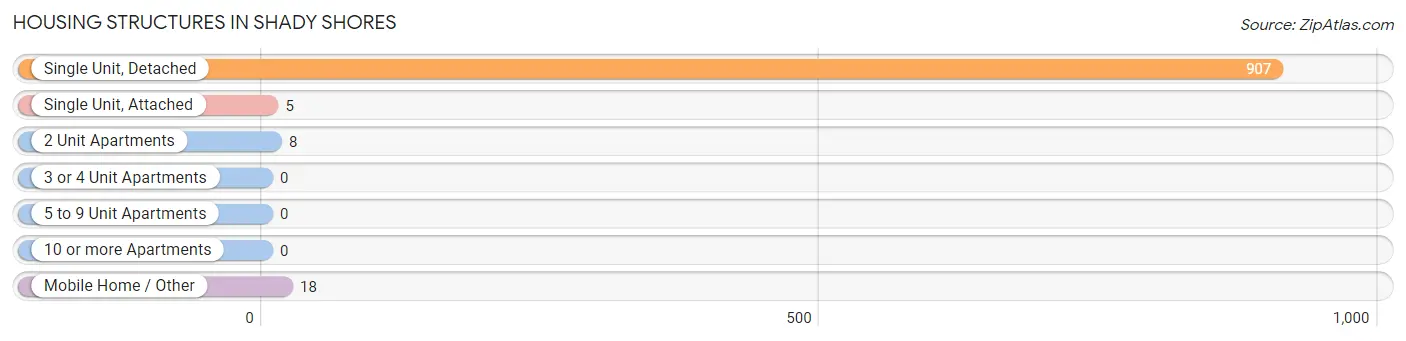
| Structure Type | # Housing Units | % Housing Units |
| Single Unit, Detached | 907 | 96.7% |
| Single Unit, Attached | 5 | 0.5% |
| 2 Unit Apartments | 8 | 0.9% |
| 3 or 4 Unit Apartments | 0 | 0.0% |
| 5 to 9 Unit Apartments | 0 | 0.0% |
| 10 or more Apartments | 0 | 0.0% |
| Mobile Home / Other | 18 | 1.9% |
| Total | 938 | 100.0% |
Housing Structures by Occupancy in Shady Shores
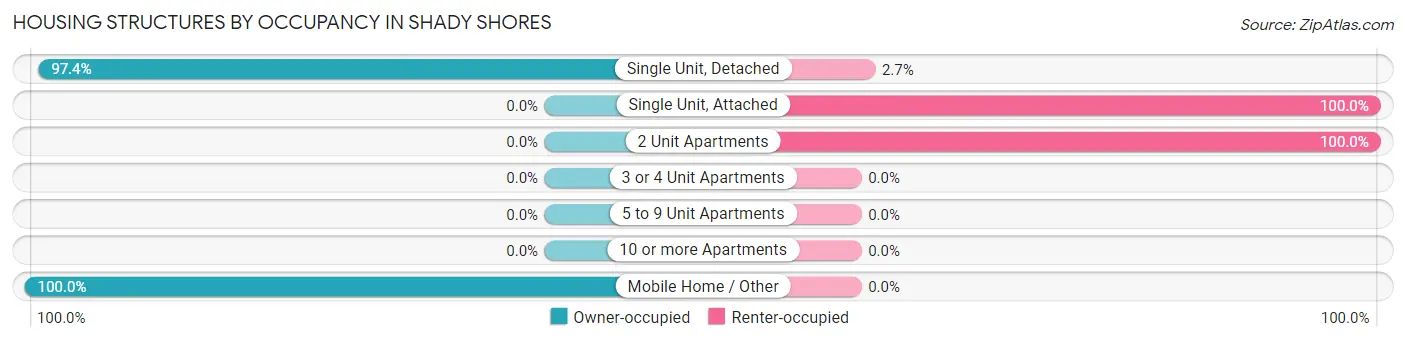
| Structure Type | Owner-occupied | Renter-occupied |
| Single Unit, Detached | 883 (97.4%) | 24 (2.6%) |
| Single Unit, Attached | 0 (0.0%) | 5 (100.0%) |
| 2 Unit Apartments | 0 (0.0%) | 8 (100.0%) |
| 3 or 4 Unit Apartments | 0 (0.0%) | 0 (0.0%) |
| 5 to 9 Unit Apartments | 0 (0.0%) | 0 (0.0%) |
| 10 or more Apartments | 0 (0.0%) | 0 (0.0%) |
| Mobile Home / Other | 18 (100.0%) | 0 (0.0%) |
| Total | 901 (96.1%) | 37 (3.9%) |
Housing Structures by Number of Rooms in Shady Shores
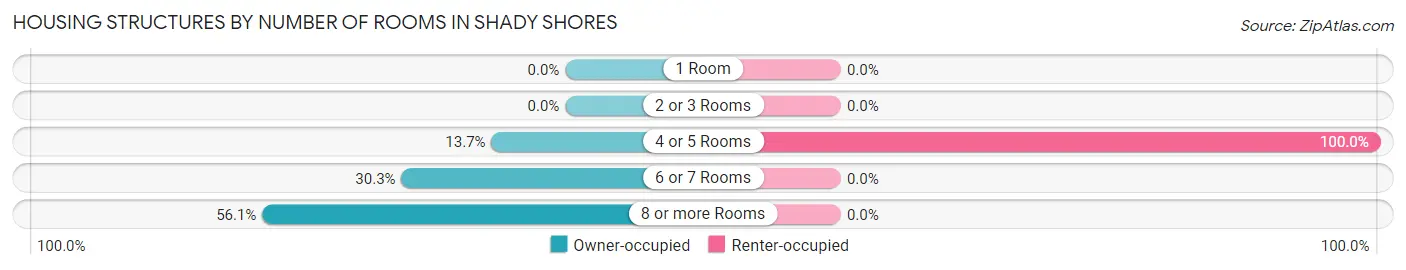
| Number of Rooms | Owner-occupied | Renter-occupied |
| 1 Room | 0 (0.0%) | 0 (0.0%) |
| 2 or 3 Rooms | 0 (0.0%) | 0 (0.0%) |
| 4 or 5 Rooms | 123 (13.7%) | 37 (100.0%) |
| 6 or 7 Rooms | 273 (30.3%) | 0 (0.0%) |
| 8 or more Rooms | 505 (56.0%) | 0 (0.0%) |
| Total | 901 (100.0%) | 37 (100.0%) |
Housing Structure by Heating Type in Shady Shores
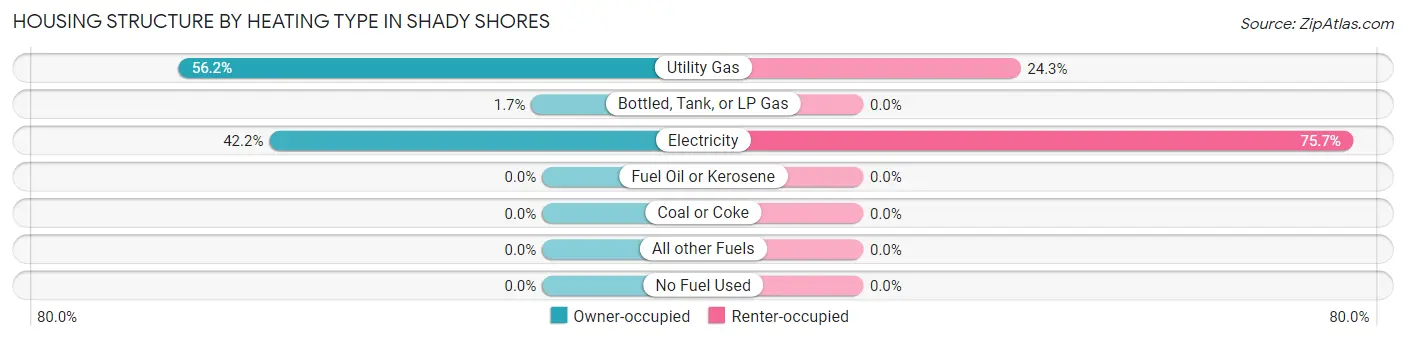
| Heating Type | Owner-occupied | Renter-occupied |
| Utility Gas | 506 (56.2%) | 9 (24.3%) |
| Bottled, Tank, or LP Gas | 15 (1.7%) | 0 (0.0%) |
| Electricity | 380 (42.2%) | 28 (75.7%) |
| Fuel Oil or Kerosene | 0 (0.0%) | 0 (0.0%) |
| Coal or Coke | 0 (0.0%) | 0 (0.0%) |
| All other Fuels | 0 (0.0%) | 0 (0.0%) |
| No Fuel Used | 0 (0.0%) | 0 (0.0%) |
| Total | 901 (100.0%) | 37 (100.0%) |
Household Vehicle Usage in Shady Shores
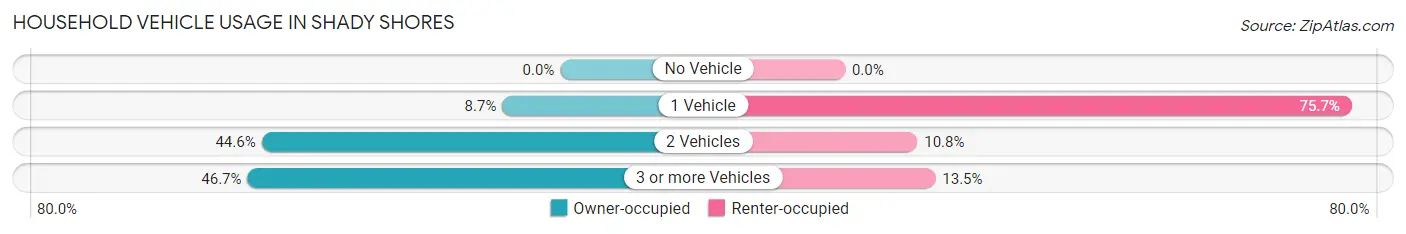
| Vehicles per Household | Owner-occupied | Renter-occupied |
| No Vehicle | 0 (0.0%) | 0 (0.0%) |
| 1 Vehicle | 78 (8.7%) | 28 (75.7%) |
| 2 Vehicles | 402 (44.6%) | 4 (10.8%) |
| 3 or more Vehicles | 421 (46.7%) | 5 (13.5%) |
| Total | 901 (100.0%) | 37 (100.0%) |
Real Estate & Mortgages in Shady Shores
Real Estate and Mortgage Overview in Shady Shores
| Characteristic | Without Mortgage | With Mortgage |
| Housing Units | 285 | 616 |
| Median Property Value | $310,200 | $465,300 |
| Median Household Income | $128,750 | $342 |
| Monthly Housing Costs | $883 | $208 |
| Real Estate Taxes | $4,654 | $0 |
Property Value by Mortgage Status in Shady Shores
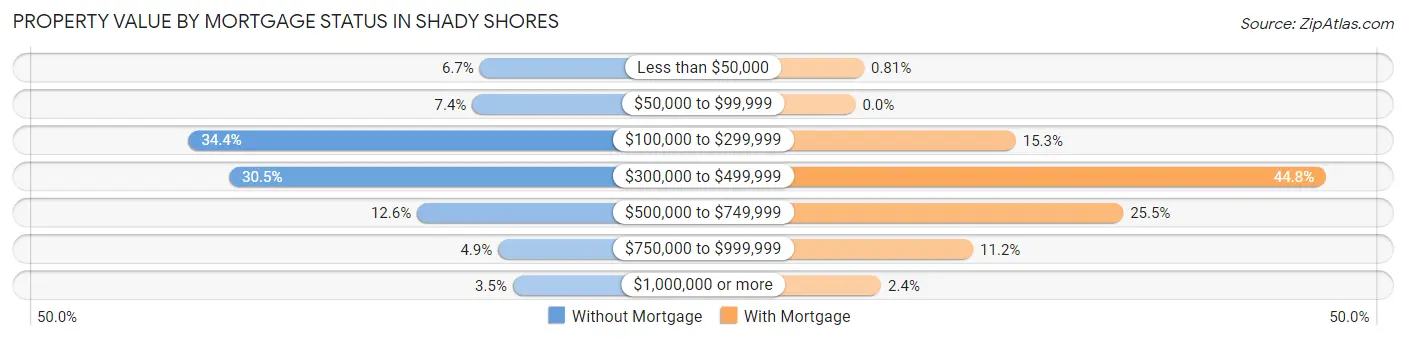
| Property Value | Without Mortgage | With Mortgage |
| Less than $50,000 | 19 (6.7%) | 5 (0.8%) |
| $50,000 to $99,999 | 21 (7.4%) | 0 (0.0%) |
| $100,000 to $299,999 | 98 (34.4%) | 94 (15.3%) |
| $300,000 to $499,999 | 87 (30.5%) | 276 (44.8%) |
| $500,000 to $749,999 | 36 (12.6%) | 157 (25.5%) |
| $750,000 to $999,999 | 14 (4.9%) | 69 (11.2%) |
| $1,000,000 or more | 10 (3.5%) | 15 (2.4%) |
| Total | 285 (100.0%) | 616 (100.0%) |
Household Income by Mortgage Status in Shady Shores
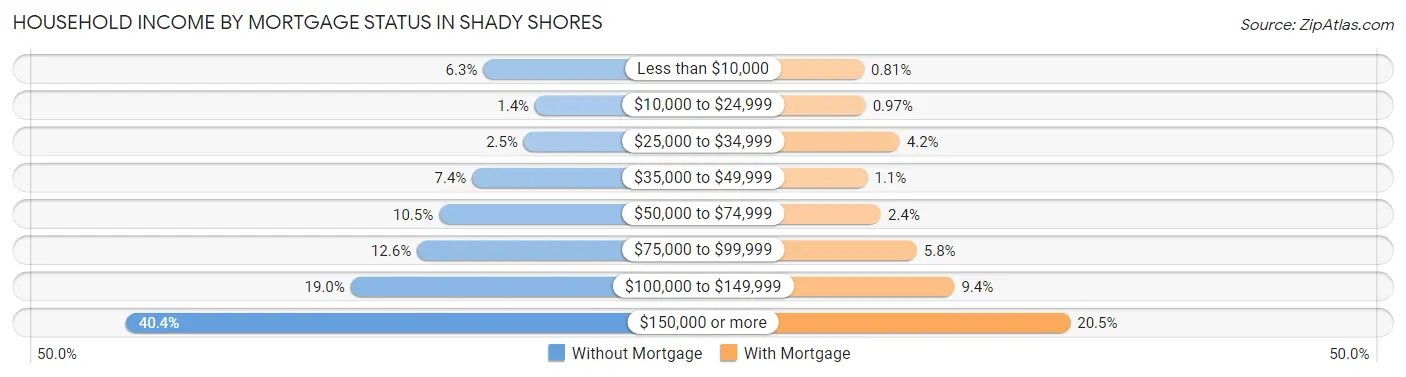
| Household Income | Without Mortgage | With Mortgage |
| Less than $10,000 | 18 (6.3%) | 5 (0.8%) |
| $10,000 to $24,999 | 4 (1.4%) | 6 (1.0%) |
| $25,000 to $34,999 | 7 (2.5%) | 26 (4.2%) |
| $35,000 to $49,999 | 21 (7.4%) | 7 (1.1%) |
| $50,000 to $74,999 | 30 (10.5%) | 15 (2.4%) |
| $75,000 to $99,999 | 36 (12.6%) | 36 (5.8%) |
| $100,000 to $149,999 | 54 (19.0%) | 58 (9.4%) |
| $150,000 or more | 115 (40.4%) | 126 (20.4%) |
| Total | 285 (100.0%) | 616 (100.0%) |
Property Value to Household Income Ratio in Shady Shores
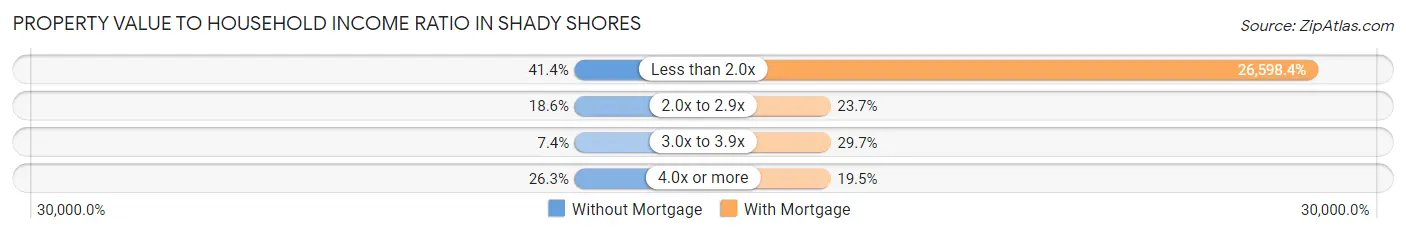
| Value-to-Income Ratio | Without Mortgage | With Mortgage |
| Less than 2.0x | 118 (41.4%) | 163,846 (26,598.4%) |
| 2.0x to 2.9x | 53 (18.6%) | 146 (23.7%) |
| 3.0x to 3.9x | 21 (7.4%) | 183 (29.7%) |
| 4.0x or more | 75 (26.3%) | 120 (19.5%) |
| Total | 285 (100.0%) | 616 (100.0%) |
Real Estate Taxes by Mortgage Status in Shady Shores
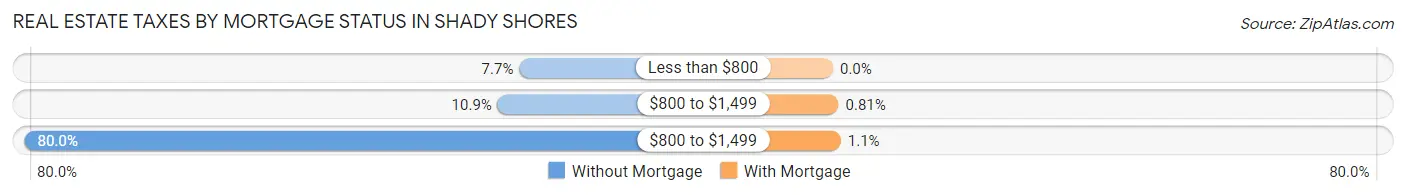
| Property Taxes | Without Mortgage | With Mortgage |
| Less than $800 | 22 (7.7%) | 0 (0.0%) |
| $800 to $1,499 | 31 (10.9%) | 5 (0.8%) |
| $800 to $1,499 | 228 (80.0%) | 7 (1.1%) |
| Total | 285 (100.0%) | 616 (100.0%) |
Health & Disability in Shady Shores
Health Insurance Coverage by Age in Shady Shores
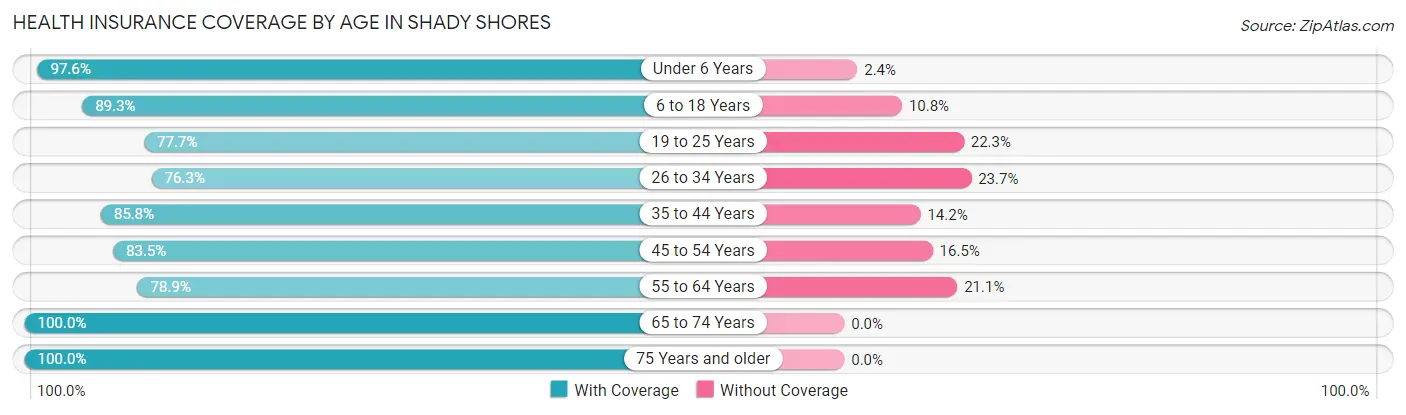
| Age Bracket | With Coverage | Without Coverage |
| Under 6 Years | 121 (97.6%) | 3 (2.4%) |
| 6 to 18 Years | 465 (89.2%) | 56 (10.7%) |
| 19 to 25 Years | 157 (77.7%) | 45 (22.3%) |
| 26 to 34 Years | 129 (76.3%) | 40 (23.7%) |
| 35 to 44 Years | 314 (85.8%) | 52 (14.2%) |
| 45 to 54 Years | 299 (83.5%) | 59 (16.5%) |
| 55 to 64 Years | 476 (78.9%) | 127 (21.1%) |
| 65 to 74 Years | 325 (100.0%) | 0 (0.0%) |
| 75 Years and older | 143 (100.0%) | 0 (0.0%) |
| Total | 2,429 (86.4%) | 382 (13.6%) |
Health Insurance Coverage by Citizenship Status in Shady Shores
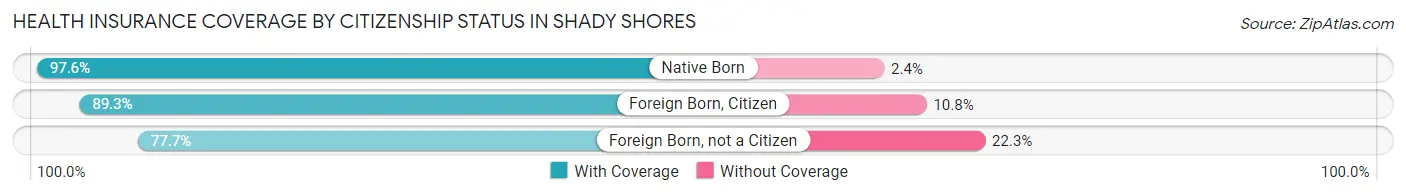
| Citizenship Status | With Coverage | Without Coverage |
| Native Born | 121 (97.6%) | 3 (2.4%) |
| Foreign Born, Citizen | 465 (89.2%) | 56 (10.7%) |
| Foreign Born, not a Citizen | 157 (77.7%) | 45 (22.3%) |
Health Insurance Coverage by Household Income in Shady Shores
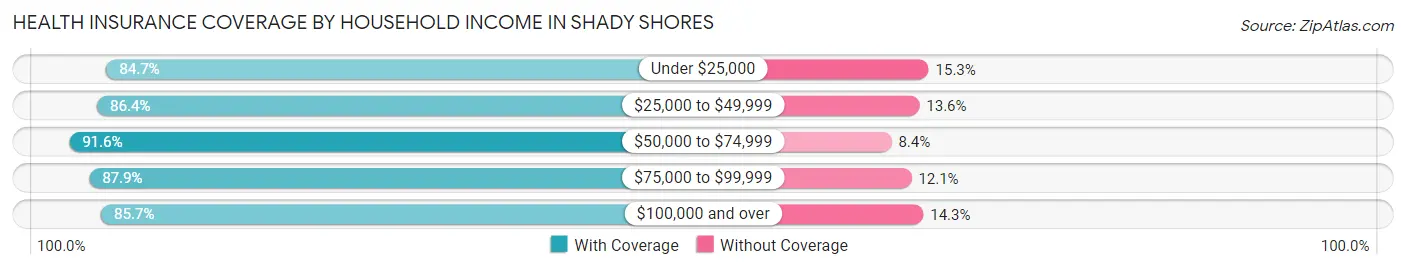
| Household Income | With Coverage | Without Coverage |
| Under $25,000 | 116 (84.7%) | 21 (15.3%) |
| $25,000 to $49,999 | 108 (86.4%) | 17 (13.6%) |
| $50,000 to $74,999 | 208 (91.6%) | 19 (8.4%) |
| $75,000 to $99,999 | 312 (87.9%) | 43 (12.1%) |
| $100,000 and over | 1,685 (85.7%) | 282 (14.3%) |
Public vs Private Health Insurance Coverage by Age in Shady Shores
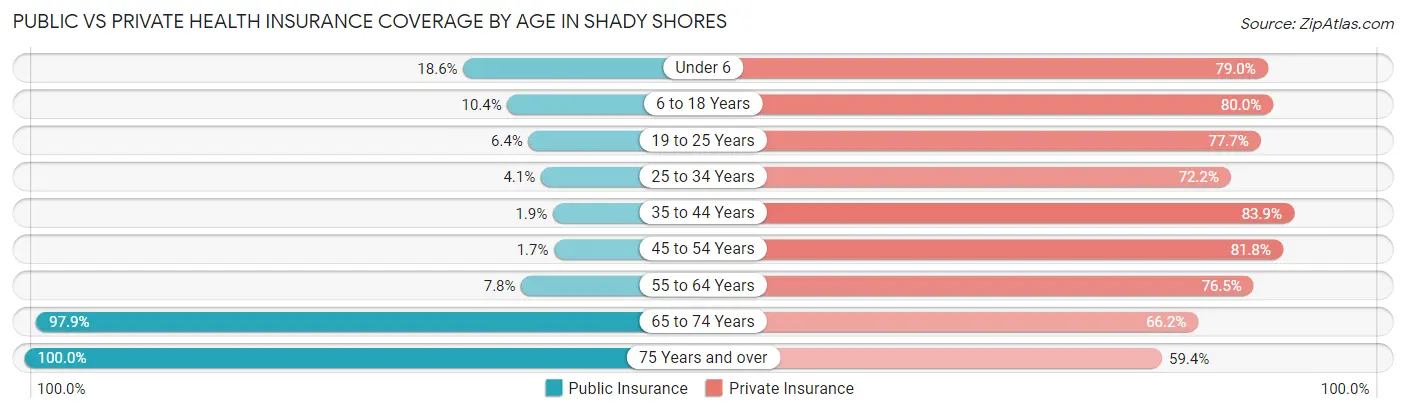
| Age Bracket | Public Insurance | Private Insurance |
| Under 6 | 23 (18.5%) | 98 (79.0%) |
| 6 to 18 Years | 54 (10.4%) | 417 (80.0%) |
| 19 to 25 Years | 13 (6.4%) | 157 (77.7%) |
| 25 to 34 Years | 7 (4.1%) | 122 (72.2%) |
| 35 to 44 Years | 7 (1.9%) | 307 (83.9%) |
| 45 to 54 Years | 6 (1.7%) | 293 (81.8%) |
| 55 to 64 Years | 47 (7.8%) | 461 (76.4%) |
| 65 to 74 Years | 318 (97.9%) | 215 (66.1%) |
| 75 Years and over | 143 (100.0%) | 85 (59.4%) |
| Total | 618 (22.0%) | 2,155 (76.7%) |
Disability Status by Sex by Age in Shady Shores
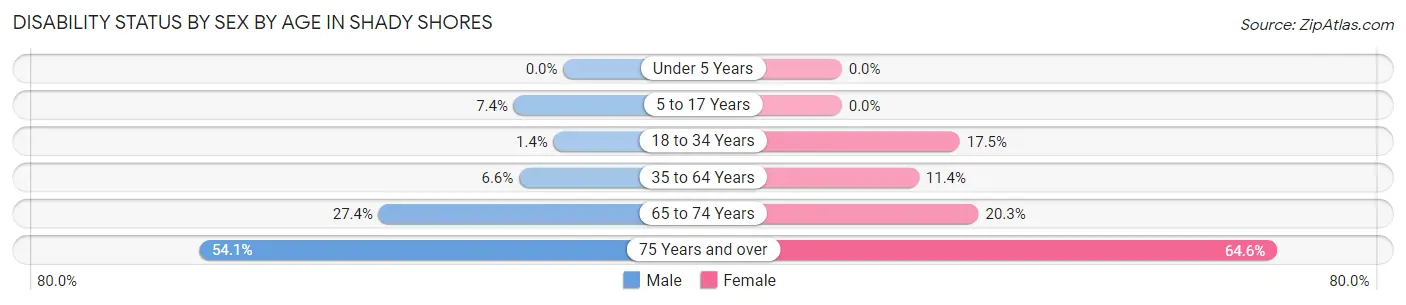
| Age Bracket | Male | Female |
| Under 5 Years | 0 (0.0%) | 0 (0.0%) |
| 5 to 17 Years | 17 (7.4%) | 0 (0.0%) |
| 18 to 34 Years | 4 (1.4%) | 34 (17.5%) |
| 35 to 64 Years | 43 (6.6%) | 77 (11.4%) |
| 65 to 74 Years | 54 (27.4%) | 26 (20.3%) |
| 75 Years and over | 33 (54.1%) | 53 (64.6%) |
Disability Class by Sex by Age in Shady Shores
Disability Class: Hearing Difficulty
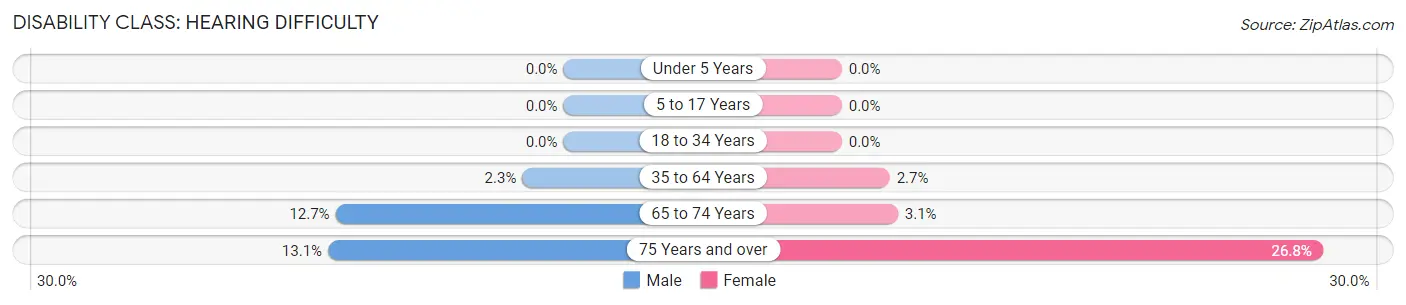
| Age Bracket | Male | Female |
| Under 5 Years | 0 (0.0%) | 0 (0.0%) |
| 5 to 17 Years | 0 (0.0%) | 0 (0.0%) |
| 18 to 34 Years | 0 (0.0%) | 0 (0.0%) |
| 35 to 64 Years | 15 (2.3%) | 18 (2.7%) |
| 65 to 74 Years | 25 (12.7%) | 4 (3.1%) |
| 75 Years and over | 8 (13.1%) | 22 (26.8%) |
Disability Class: Vision Difficulty
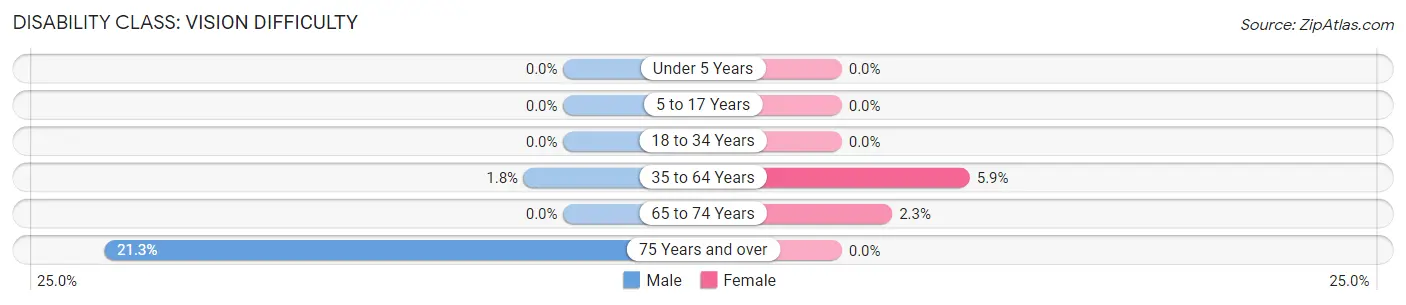
| Age Bracket | Male | Female |
| Under 5 Years | 0 (0.0%) | 0 (0.0%) |
| 5 to 17 Years | 0 (0.0%) | 0 (0.0%) |
| 18 to 34 Years | 0 (0.0%) | 0 (0.0%) |
| 35 to 64 Years | 12 (1.8%) | 40 (5.9%) |
| 65 to 74 Years | 0 (0.0%) | 3 (2.3%) |
| 75 Years and over | 13 (21.3%) | 0 (0.0%) |
Disability Class: Cognitive Difficulty
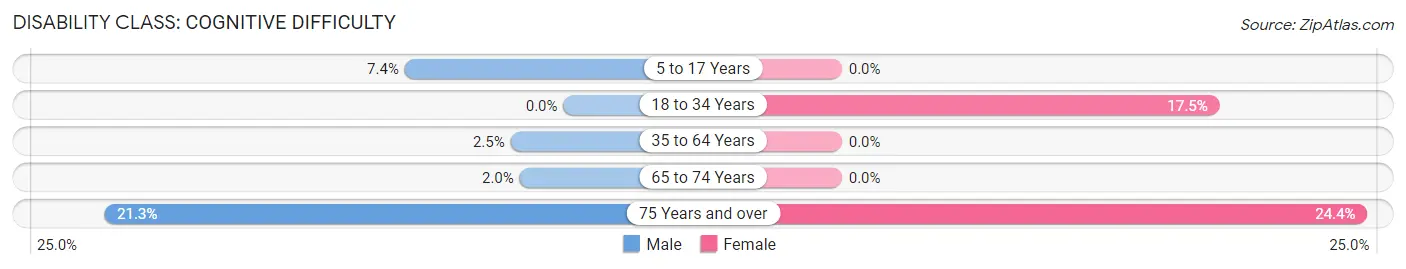
| Age Bracket | Male | Female |
| 5 to 17 Years | 17 (7.4%) | 0 (0.0%) |
| 18 to 34 Years | 0 (0.0%) | 34 (17.5%) |
| 35 to 64 Years | 16 (2.5%) | 0 (0.0%) |
| 65 to 74 Years | 4 (2.0%) | 0 (0.0%) |
| 75 Years and over | 13 (21.3%) | 20 (24.4%) |
Disability Class: Ambulatory Difficulty
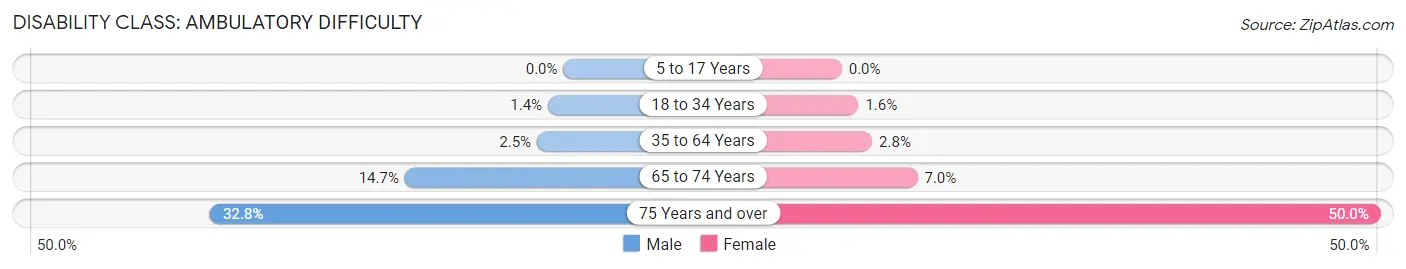
| Age Bracket | Male | Female |
| 5 to 17 Years | 0 (0.0%) | 0 (0.0%) |
| 18 to 34 Years | 4 (1.4%) | 3 (1.5%) |
| 35 to 64 Years | 16 (2.5%) | 19 (2.8%) |
| 65 to 74 Years | 29 (14.7%) | 9 (7.0%) |
| 75 Years and over | 20 (32.8%) | 41 (50.0%) |
Disability Class: Self-Care Difficulty
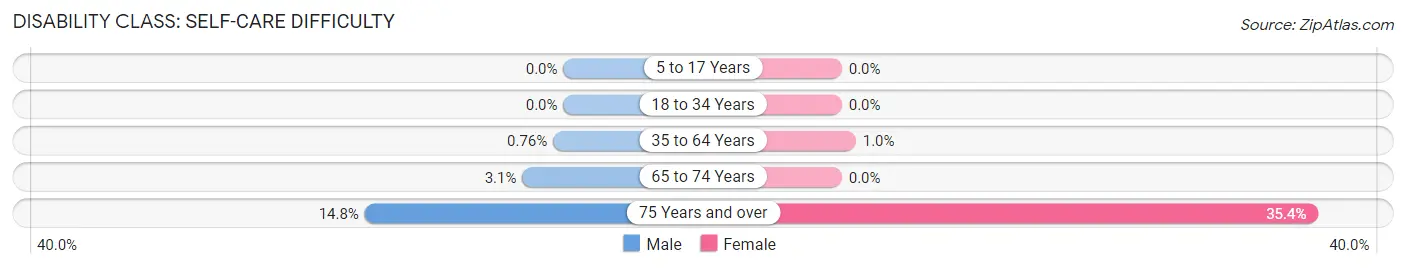
| Age Bracket | Male | Female |
| 5 to 17 Years | 0 (0.0%) | 0 (0.0%) |
| 18 to 34 Years | 0 (0.0%) | 0 (0.0%) |
| 35 to 64 Years | 5 (0.8%) | 7 (1.0%) |
| 65 to 74 Years | 6 (3.0%) | 0 (0.0%) |
| 75 Years and over | 9 (14.7%) | 29 (35.4%) |
Technology Access in Shady Shores
Computing Device Access in Shady Shores
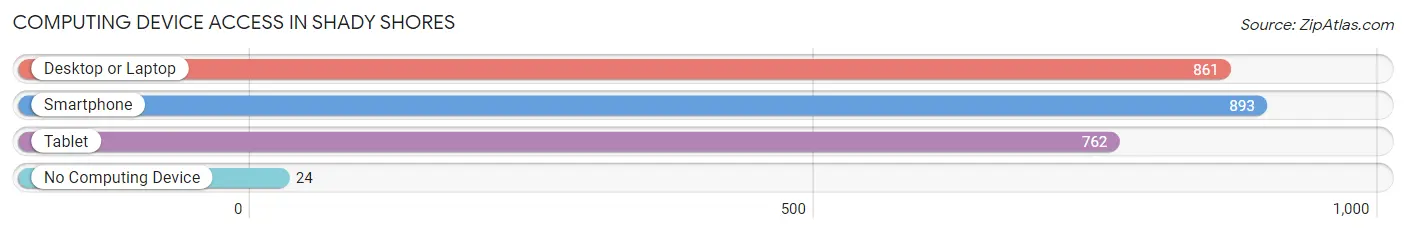
| Device Type | # Households | % Households |
| Desktop or Laptop | 861 | 91.8% |
| Smartphone | 893 | 95.2% |
| Tablet | 762 | 81.2% |
| No Computing Device | 24 | 2.6% |
| Total | 938 | 100.0% |
Internet Access in Shady Shores
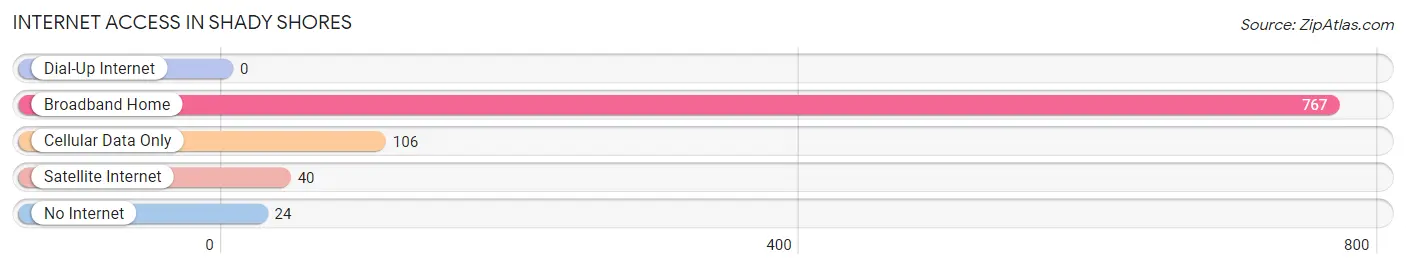
| Internet Type | # Households | % Households |
| Dial-Up Internet | 0 | 0.0% |
| Broadband Home | 767 | 81.8% |
| Cellular Data Only | 106 | 11.3% |
| Satellite Internet | 40 | 4.3% |
| No Internet | 24 | 2.6% |
| Total | 938 | 100.0% |
Shady Shores Summary
Shady Shores, Texas is a small town located in Denton County, Texas, United States. It is situated on the eastern shore of Lake Lewisville, approximately 25 miles north of Dallas. The town was founded in the late 1950s and has since grown to a population of approximately 4,000 people.
History
Shady Shores was founded in the late 1950s by a group of developers who wanted to create a small, rural community on the eastern shore of Lake Lewisville. The town was originally named “Shady Shores Estates” and was intended to be a retirement community. The developers purchased the land from the local Native American tribes and began to build the town. The first homes were built in 1959 and the town was officially incorporated in 1961.
The town quickly grew in popularity and by the 1970s, it had become a popular destination for vacationers and retirees. The town was also home to a number of businesses, including a grocery store, a gas station, and a post office.
Geography
Shady Shores is located in Denton County, Texas, approximately 25 miles north of Dallas. The town is situated on the eastern shore of Lake Lewisville, which is a large reservoir created by the damming of the Elm Fork of the Trinity River. The lake is a popular destination for fishing, boating, and other recreational activities.
The town is located in a rural area and is surrounded by rolling hills and farmland. The climate in Shady Shores is generally mild, with hot summers and cool winters.
Economy
The economy of Shady Shores is largely based on tourism and retirement. The town is a popular destination for vacationers and retirees, and there are a number of businesses that cater to these visitors. These businesses include restaurants, hotels, and retail stores.
The town is also home to a number of small businesses, including a grocery store, a gas station, and a post office. The town is also home to a number of manufacturing and industrial businesses, including a plastics factory and a metal fabrication plant.
Demographics
As of the 2010 census, the population of Shady Shores was 4,000. The town is predominantly white, with approximately 75% of the population identifying as Caucasian. The remaining 25% of the population is made up of African Americans, Hispanics, and other ethnicities.
The median household income in Shady Shores is approximately $50,000, and the median home value is approximately $150,000. The town has a low unemployment rate and a high rate of homeownership.
Conclusion
Shady Shores, Texas is a small town located in Denton County, Texas, United States. It is situated on the eastern shore of Lake Lewisville, approximately 25 miles north of Dallas. The town was founded in the late 1950s and has since grown to a population of approximately 4,000 people. The economy of Shady Shores is largely based on tourism and retirement, and the town is a popular destination for vacationers and retirees. The town is predominantly white, with approximately 75% of the population identifying as Caucasian. The median household income in Shady Shores is approximately $50,000, and the median home value is approximately $150,000.
Common Questions
What is Per Capita Income in Shady Shores?
Per Capita income in Shady Shores is $54,793.
What is the Median Family Income in Shady Shores?
Median Family Income in Shady Shores is $153,036.
What is the Median Household income in Shady Shores?
Median Household Income in Shady Shores is $149,333.
What is Income or Wage Gap in Shady Shores?
Income or Wage Gap in Shady Shores is 22.5%.
Women in Shady Shores earn 77.5 cents for every dollar earned by a man.
What is Family Income Deficit in Shady Shores?
Family Income Deficit in Shady Shores is $10,128.
Families that are below poverty line in Shady Shores earn $10,128 less on average than the poverty threshold level.
What is Inequality or Gini Index in Shady Shores?
Inequality or Gini Index in Shady Shores is 0.36.
What is the Total Population of Shady Shores?
Total Population of Shady Shores is 2,811.
What is the Total Male Population of Shady Shores?
Total Male Population of Shady Shores is 1,465.
What is the Total Female Population of Shady Shores?
Total Female Population of Shady Shores is 1,346.
What is the Ratio of Males per 100 Females in Shady Shores?
There are 108.84 Males per 100 Females in Shady Shores.
What is the Ratio of Females per 100 Males in Shady Shores?
There are 91.88 Females per 100 Males in Shady Shores.
What is the Median Population Age in Shady Shores?
Median Population Age in Shady Shores is 45.6 Years.
What is the Average Family Size in Shady Shores
Average Family Size in Shady Shores is 3.3 People.
What is the Average Household Size in Shady Shores
Average Household Size in Shady Shores is 3.0 People.
How Large is the Labor Force in Shady Shores?
There are 1,511 People in the Labor Forcein in Shady Shores.
What is the Percentage of People in the Labor Force in Shady Shores?
65.1% of People are in the Labor Force in Shady Shores.
What is the Unemployment Rate in Shady Shores?
Unemployment Rate in Shady Shores is 7.3%.