Garden Ridge, TX Map & Demographics
Garden Ridge Map
Garden Ridge Overview
$61,427
PER CAPITA INCOME
$163,879
AVG FAMILY INCOME
$156,711
AVG HOUSEHOLD INCOME
19.8%
WAGE / INCOME GAP [ % ]
80.2¢/ $1
WAGE / INCOME GAP [ $ ]
0.31
INEQUALITY / GINI INDEX
4,155
TOTAL POPULATION
2,311
MALE POPULATION
1,844
FEMALE POPULATION
125.33
MALES / 100 FEMALES
79.79
FEMALES / 100 MALES
50.4
MEDIAN AGE
3.1
AVG FAMILY SIZE
2.9
AVG HOUSEHOLD SIZE
2,061
LABOR FORCE [ PEOPLE ]
59.3%
PERCENT IN LABOR FORCE
2.6%
UNEMPLOYMENT RATE
Garden Ridge Area Codes
Income in Garden Ridge
Income Overview in Garden Ridge
Per Capita Income in Garden Ridge is $61,427, while median incomes of families and households are $163,879 and $156,711 respectively.
| Characteristic | Number | Measure |
| Per Capita Income | 4,155 | $61,427 |
| Median Family Income | 1,308 | $163,879 |
| Mean Family Income | 1,308 | $187,009 |
| Median Household Income | 1,450 | $156,711 |
| Mean Household Income | 1,450 | $174,003 |
| Income Deficit | 1,308 | $0 |
| Wage / Income Gap (%) | 4,155 | 19.76% |
| Wage / Income Gap ($) | 4,155 | 80.24¢ per $1 |
| Gini / Inequality Index | 4,155 | 0.31 |
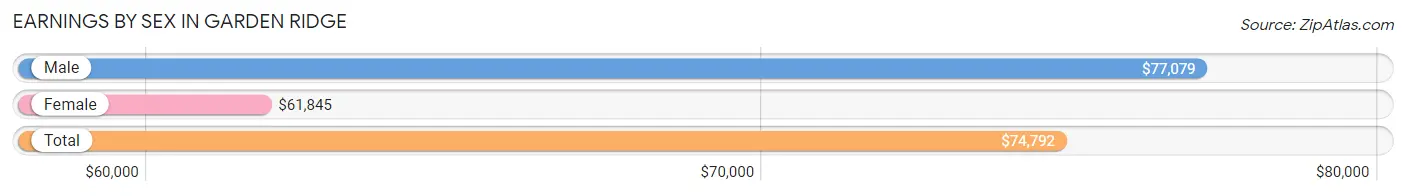
Earnings by Sex in Garden Ridge
Average Earnings in Garden Ridge are $74,792, $77,079 for men and $61,845 for women, a difference of 19.8%.
| Sex | Number | Average Earnings |
| Male | 1,388 (64.6%) | $77,079 |
| Female | 761 (35.4%) | $61,845 |
| Total | 2,149 (100.0%) | $74,792 |
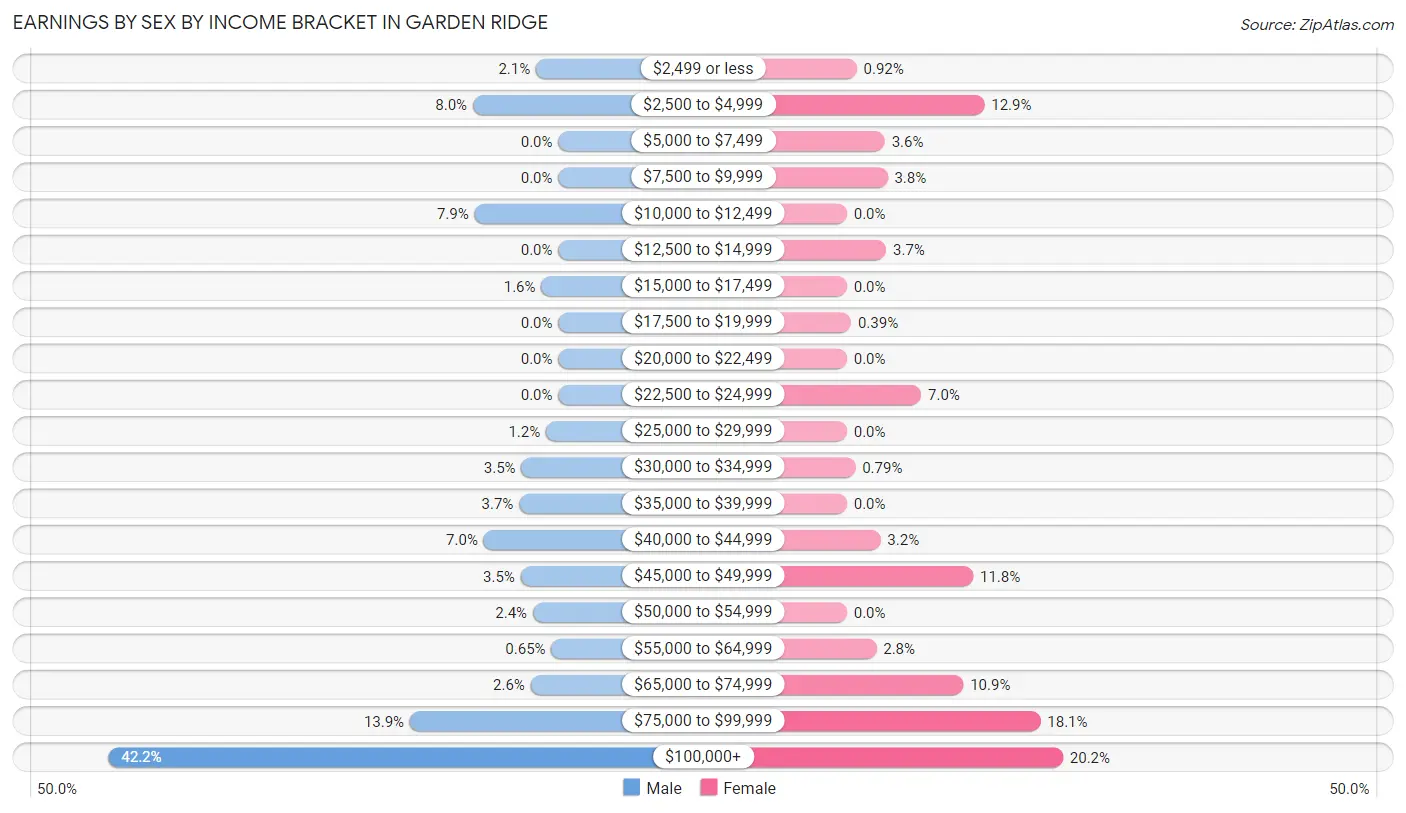
Earnings by Sex by Income Bracket in Garden Ridge
The most common earnings brackets in Garden Ridge are $100,000+ for men (585 | 42.1%) and $100,000+ for women (154 | 20.2%).
| Income | Male | Female |
| $2,499 or less | 29 (2.1%) | 7 (0.9%) |
| $2,500 to $4,999 | 111 (8.0%) | 98 (12.9%) |
| $5,000 to $7,499 | 0 (0.0%) | 27 (3.5%) |
| $7,500 to $9,999 | 0 (0.0%) | 29 (3.8%) |
| $10,000 to $12,499 | 109 (7.9%) | 0 (0.0%) |
| $12,500 to $14,999 | 0 (0.0%) | 28 (3.7%) |
| $15,000 to $17,499 | 22 (1.6%) | 0 (0.0%) |
| $17,500 to $19,999 | 0 (0.0%) | 3 (0.4%) |
| $20,000 to $22,499 | 0 (0.0%) | 0 (0.0%) |
| $22,500 to $24,999 | 0 (0.0%) | 53 (7.0%) |
| $25,000 to $29,999 | 16 (1.1%) | 0 (0.0%) |
| $30,000 to $34,999 | 48 (3.5%) | 6 (0.8%) |
| $35,000 to $39,999 | 51 (3.7%) | 0 (0.0%) |
| $40,000 to $44,999 | 97 (7.0%) | 24 (3.2%) |
| $45,000 to $49,999 | 49 (3.5%) | 90 (11.8%) |
| $50,000 to $54,999 | 33 (2.4%) | 0 (0.0%) |
| $55,000 to $64,999 | 9 (0.6%) | 21 (2.8%) |
| $65,000 to $74,999 | 36 (2.6%) | 83 (10.9%) |
| $75,000 to $99,999 | 193 (13.9%) | 138 (18.1%) |
| $100,000+ | 585 (42.1%) | 154 (20.2%) |
| Total | 1,388 (100.0%) | 761 (100.0%) |
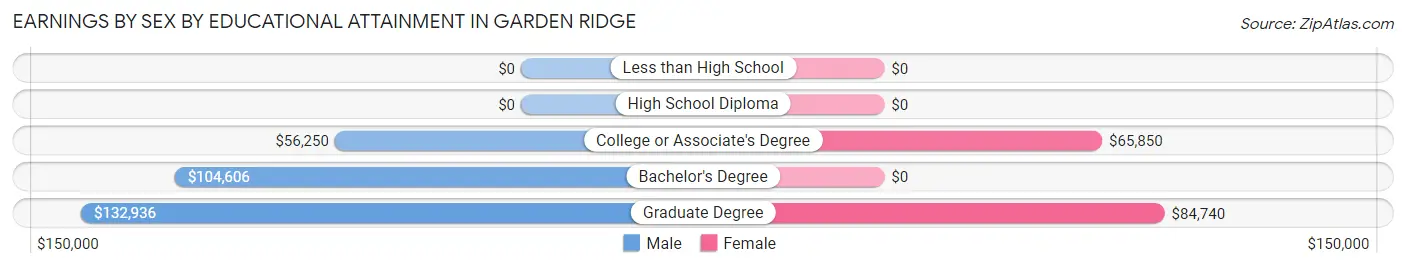
Earnings by Sex by Educational Attainment in Garden Ridge
Average earnings in Garden Ridge are $93,250 for men and $65,900 for women, a difference of 29.3%. Men with an educational attainment of graduate degree enjoy the highest average annual earnings of $132,936, while those with college or associate's degree education earn the least with $56,250. Women with an educational attainment of graduate degree earn the most with the average annual earnings of $84,740, while those with college or associate's degree education have the smallest earnings of $65,850.
| Educational Attainment | Male Income | Female Income |
| Less than High School | - | - |
| High School Diploma | - | - |
| College or Associate's Degree | $56,250 | $65,850 |
| Bachelor's Degree | $104,606 | $0 |
| Graduate Degree | $132,936 | $84,740 |
| Total | $93,250 | $65,900 |
Family Income in Garden Ridge
Family Income Brackets in Garden Ridge
According to the Garden Ridge family income data, there are 494 families falling into the $200,000+ income range, which is the most common income bracket and makes up 37.8% of all families.
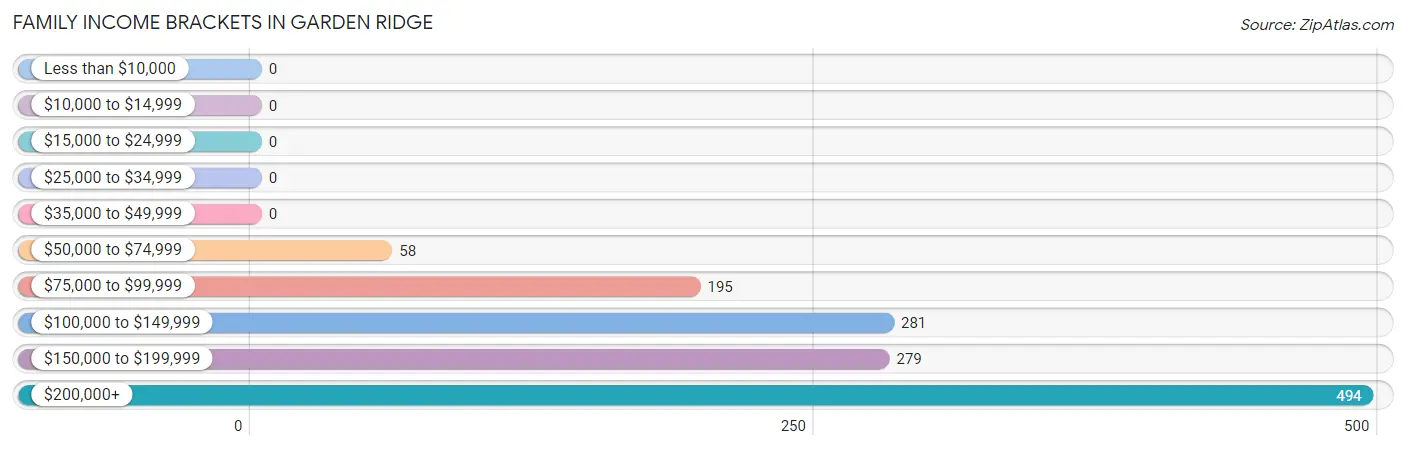
| Income Bracket | # Families | % Families |
| Less than $10,000 | 0 | 0.0% |
| $10,000 to $14,999 | 0 | 0.0% |
| $15,000 to $24,999 | 0 | 0.0% |
| $25,000 to $34,999 | 0 | 0.0% |
| $35,000 to $49,999 | 0 | 0.0% |
| $50,000 to $74,999 | 58 | 4.4% |
| $75,000 to $99,999 | 195 | 14.9% |
| $100,000 to $149,999 | 281 | 21.5% |
| $150,000 to $199,999 | 279 | 21.3% |
| $200,000+ | 494 | 37.8% |
Family Income by Famaliy Size in Garden Ridge
6-person families (17 | 1.3%) account for the highest median family income in Garden Ridge with $224,219 per family, while 2-person families (715 | 54.7%) have the highest median income of $68,912 per family member.
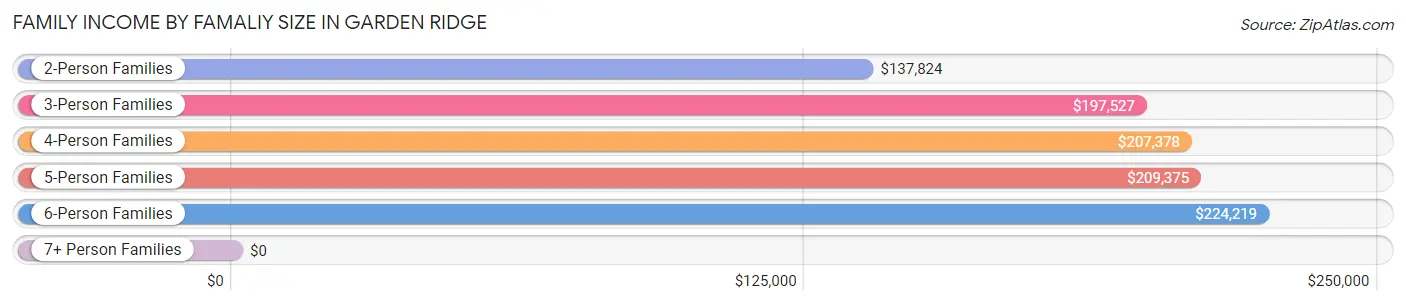
| Income Bracket | # Families | Median Income |
| 2-Person Families | 715 (54.7%) | $137,824 |
| 3-Person Families | 321 (24.5%) | $197,527 |
| 4-Person Families | 116 (8.9%) | $207,378 |
| 5-Person Families | 118 (9.0%) | $209,375 |
| 6-Person Families | 17 (1.3%) | $224,219 |
| 7+ Person Families | 21 (1.6%) | $0 |
| Total | 1,308 (100.0%) | $163,879 |
Family Income by Number of Earners in Garden Ridge
The median family income in Garden Ridge is $163,879, with families comprising 2 earners (459) having the highest median family income of $198,047, while families with no earners (201) have the lowest median family income of $126,149, accounting for 35.1% and 15.4% of families, respectively.
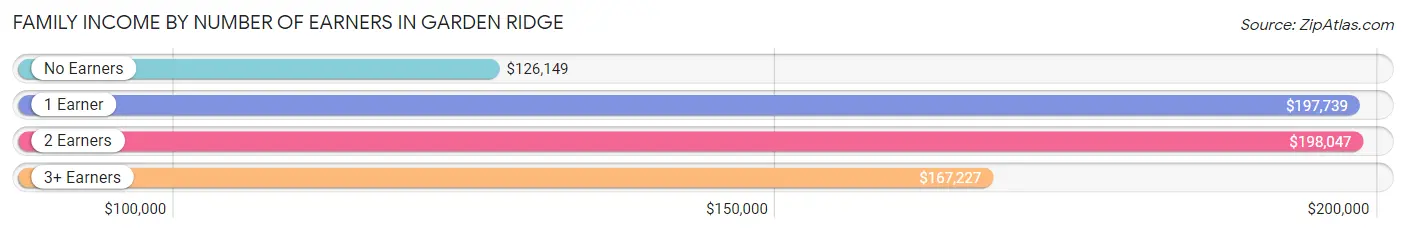
| Number of Earners | # Families | Median Income |
| No Earners | 201 (15.4%) | $126,149 |
| 1 Earner | 499 (38.2%) | $197,739 |
| 2 Earners | 459 (35.1%) | $198,047 |
| 3+ Earners | 149 (11.4%) | $167,227 |
| Total | 1,308 (100.0%) | $163,879 |
Household Income in Garden Ridge
Household Income Brackets in Garden Ridge
With 494 households falling in the category, the $200,000+ income range is the most frequent in Garden Ridge, accounting for 34.1% of all households.
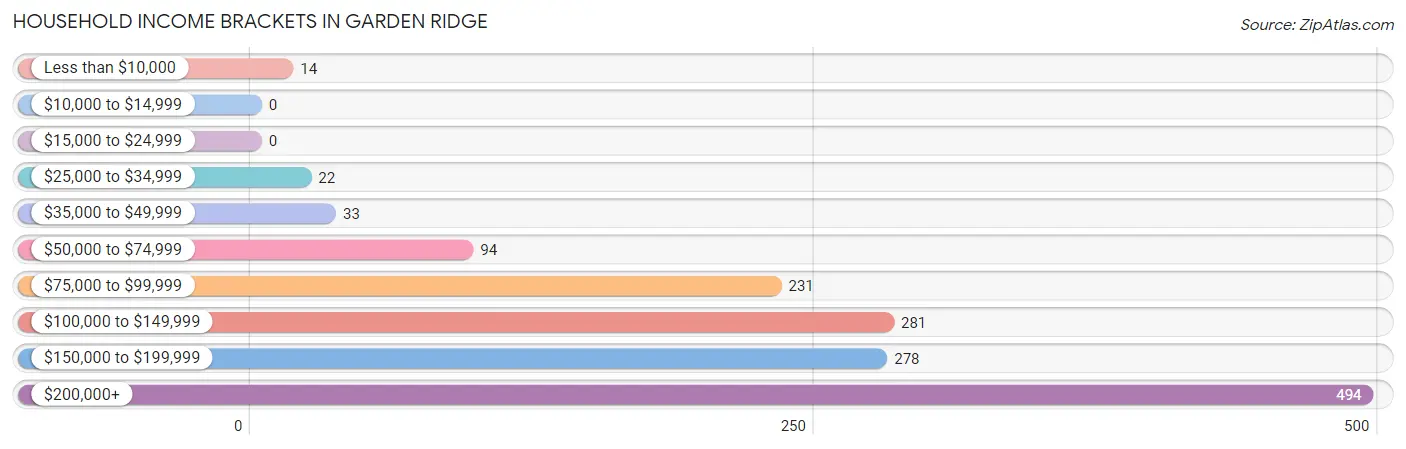
| Income Bracket | # Households | % Households |
| Less than $10,000 | 14 | 1.0% |
| $10,000 to $14,999 | 0 | 0.0% |
| $15,000 to $24,999 | 0 | 0.0% |
| $25,000 to $34,999 | 22 | 1.5% |
| $35,000 to $49,999 | 33 | 2.3% |
| $50,000 to $74,999 | 94 | 6.5% |
| $75,000 to $99,999 | 231 | 15.9% |
| $100,000 to $149,999 | 281 | 19.4% |
| $150,000 to $199,999 | 278 | 19.2% |
| $200,000+ | 494 | 34.1% |
Household Income by Householder Age in Garden Ridge
The median household income in Garden Ridge is $156,711, with the highest median household income of $198,831 found in the 45 to 64 years age bracket for the primary householder. A total of 619 households (42.7%) fall into this category. Meanwhile, the 15 to 24 years age bracket for the primary householder has the lowest median household income of $0, with 22 households (1.5%) in this group.
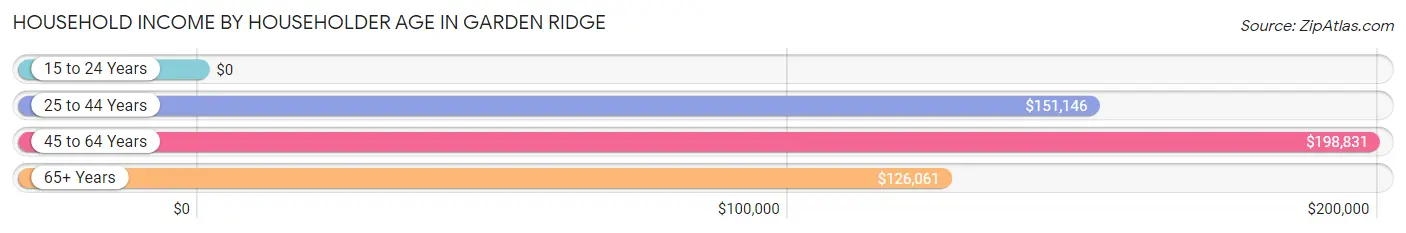
| Income Bracket | # Households | Median Income |
| 15 to 24 Years | 22 (1.5%) | $0 |
| 25 to 44 Years | 277 (19.1%) | $151,146 |
| 45 to 64 Years | 619 (42.7%) | $198,831 |
| 65+ Years | 532 (36.7%) | $126,061 |
| Total | 1,450 (100.0%) | $156,711 |
Poverty in Garden Ridge
Income Below Poverty by Sex and Age in Garden Ridge
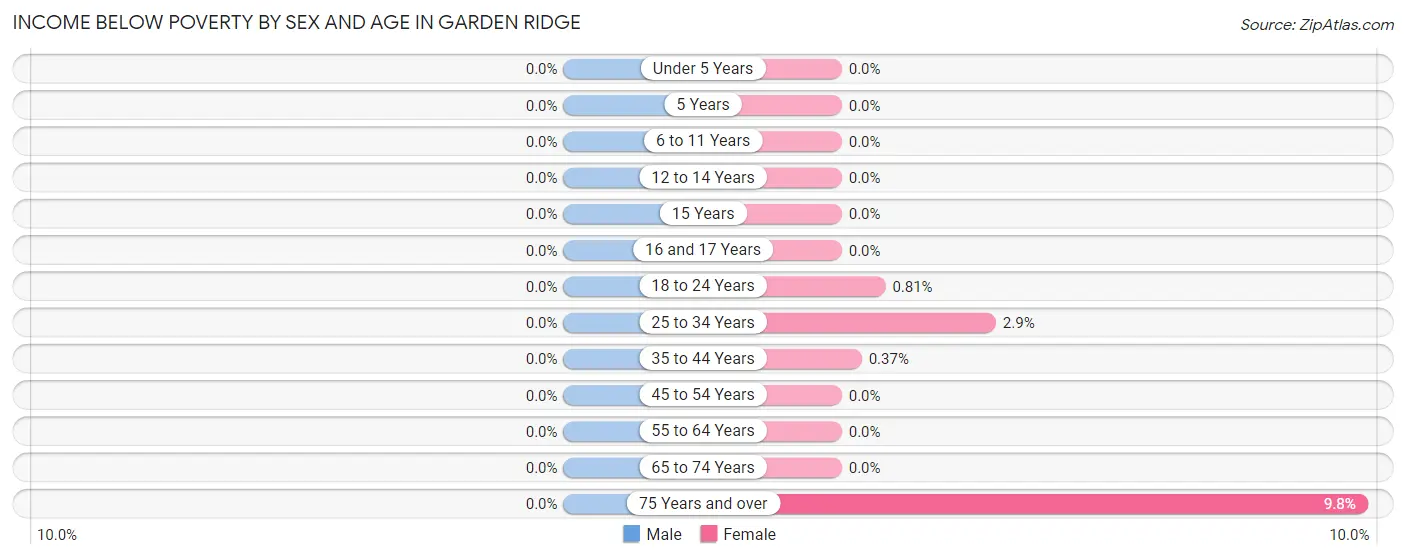
| Age Bracket | Male | Female |
| Under 5 Years | 0 (0.0%) | 0 (0.0%) |
| 5 Years | 0 (0.0%) | 0 (0.0%) |
| 6 to 11 Years | 0 (0.0%) | 0 (0.0%) |
| 12 to 14 Years | 0 (0.0%) | 0 (0.0%) |
| 15 Years | 0 (0.0%) | 0 (0.0%) |
| 16 and 17 Years | 0 (0.0%) | 0 (0.0%) |
| 18 to 24 Years | 0 (0.0%) | 1 (0.8%) |
| 25 to 34 Years | 0 (0.0%) | 1 (2.9%) |
| 35 to 44 Years | 0 (0.0%) | 1 (0.4%) |
| 45 to 54 Years | 0 (0.0%) | 0 (0.0%) |
| 55 to 64 Years | 0 (0.0%) | 0 (0.0%) |
| 65 to 74 Years | 0 (0.0%) | 0 (0.0%) |
| 75 Years and over | 0 (0.0%) | 16 (9.8%) |
| Total | 0 (0.0%) | 19 (1.0%) |
Income Above Poverty by Sex and Age in Garden Ridge
According to the poverty statistics in Garden Ridge, males aged under 5 years and females aged under 5 years are the age groups that are most secure financially, with 100.0% of males and 100.0% of females in these age groups living above the poverty line.
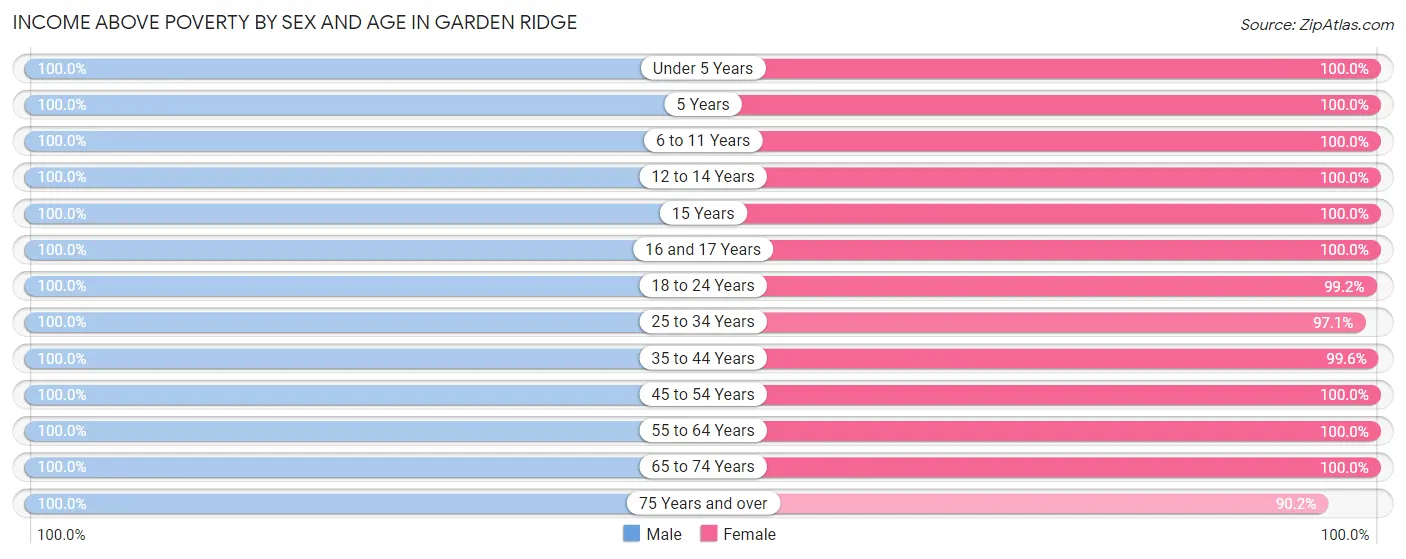
| Age Bracket | Male | Female |
| Under 5 Years | 184 (100.0%) | 44 (100.0%) |
| 5 Years | 8 (100.0%) | 17 (100.0%) |
| 6 to 11 Years | 66 (100.0%) | 140 (100.0%) |
| 12 to 14 Years | 94 (100.0%) | 75 (100.0%) |
| 15 Years | 31 (100.0%) | 20 (100.0%) |
| 16 and 17 Years | 130 (100.0%) | 23 (100.0%) |
| 18 to 24 Years | 186 (100.0%) | 122 (99.2%) |
| 25 to 34 Years | 113 (100.0%) | 34 (97.1%) |
| 35 to 44 Years | 373 (100.0%) | 269 (99.6%) |
| 45 to 54 Years | 170 (100.0%) | 226 (100.0%) |
| 55 to 64 Years | 433 (100.0%) | 447 (100.0%) |
| 65 to 74 Years | 341 (100.0%) | 255 (100.0%) |
| 75 Years and over | 178 (100.0%) | 148 (90.2%) |
| Total | 2,307 (100.0%) | 1,820 (99.0%) |
Income Below Poverty Among Married-Couple Families in Garden Ridge
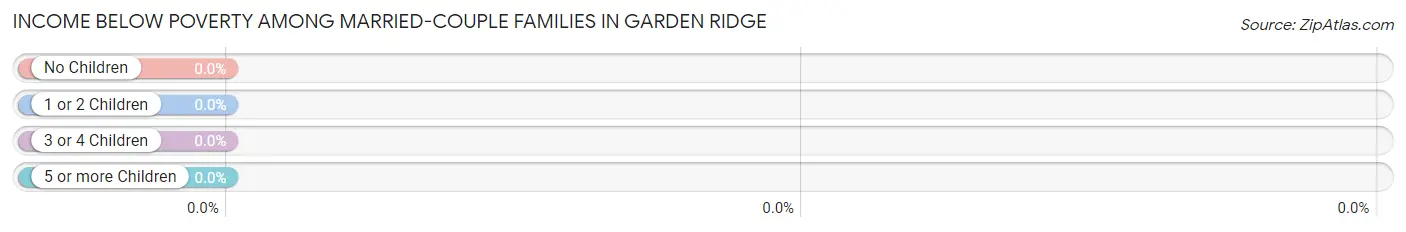
| Children | Above Poverty | Below Poverty |
| No Children | 917 (100.0%) | 0 (0.0%) |
| 1 or 2 Children | 285 (100.0%) | 0 (0.0%) |
| 3 or 4 Children | 85 (100.0%) | 0 (0.0%) |
| 5 or more Children | 21 (100.0%) | 0 (0.0%) |
| Total | 1,308 (100.0%) | 0 (0.0%) |
Income Below Poverty Among Single-Parent Households in Garden Ridge
| Children | Single Father | Single Mother |
| No Children | 0 (0.0%) | 0 (0.0%) |
| 1 or 2 Children | 0 (0.0%) | 0 (0.0%) |
| 3 or 4 Children | 0 (0.0%) | 0 (0.0%) |
| 5 or more Children | 0 (0.0%) | 0 (0.0%) |
| Total | 0 (0.0%) | 0 (0.0%) |
Income Below Poverty Among Married-Couple vs Single-Parent Households in Garden Ridge
| Children | Married-Couple Families | Single-Parent Households |
| No Children | 0 (0.0%) | 0 (0.0%) |
| 1 or 2 Children | 0 (0.0%) | 0 (0.0%) |
| 3 or 4 Children | 0 (0.0%) | 0 (0.0%) |
| 5 or more Children | 0 (0.0%) | 0 (0.0%) |
| Total | 0 (0.0%) | 0 (0.0%) |
Race in Garden Ridge
The most populous races in Garden Ridge are White / Caucasian (2,524 | 60.8%), Two or more Races (1,118 | 26.9%), and Hispanic or Latino (897 | 21.6%).
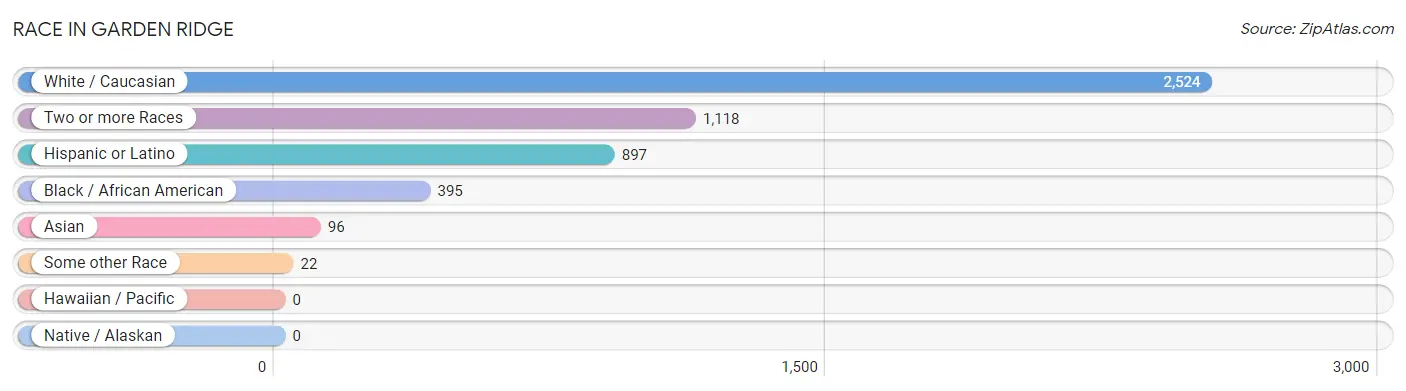
| Race | # Population | % Population |
| Asian | 96 | 2.3% |
| Black / African American | 395 | 9.5% |
| Hawaiian / Pacific | 0 | 0.0% |
| Hispanic or Latino | 897 | 21.6% |
| Native / Alaskan | 0 | 0.0% |
| White / Caucasian | 2,524 | 60.8% |
| Two or more Races | 1,118 | 26.9% |
| Some other Race | 22 | 0.5% |
| Total | 4,155 | 100.0% |
Ancestry in Garden Ridge
The most populous ancestries reported in Garden Ridge are Mexican (795 | 19.1%), German (510 | 12.3%), Irish (365 | 8.8%), English (330 | 7.9%), and Burmese (212 | 5.1%), together accounting for 53.2% of all Garden Ridge residents.
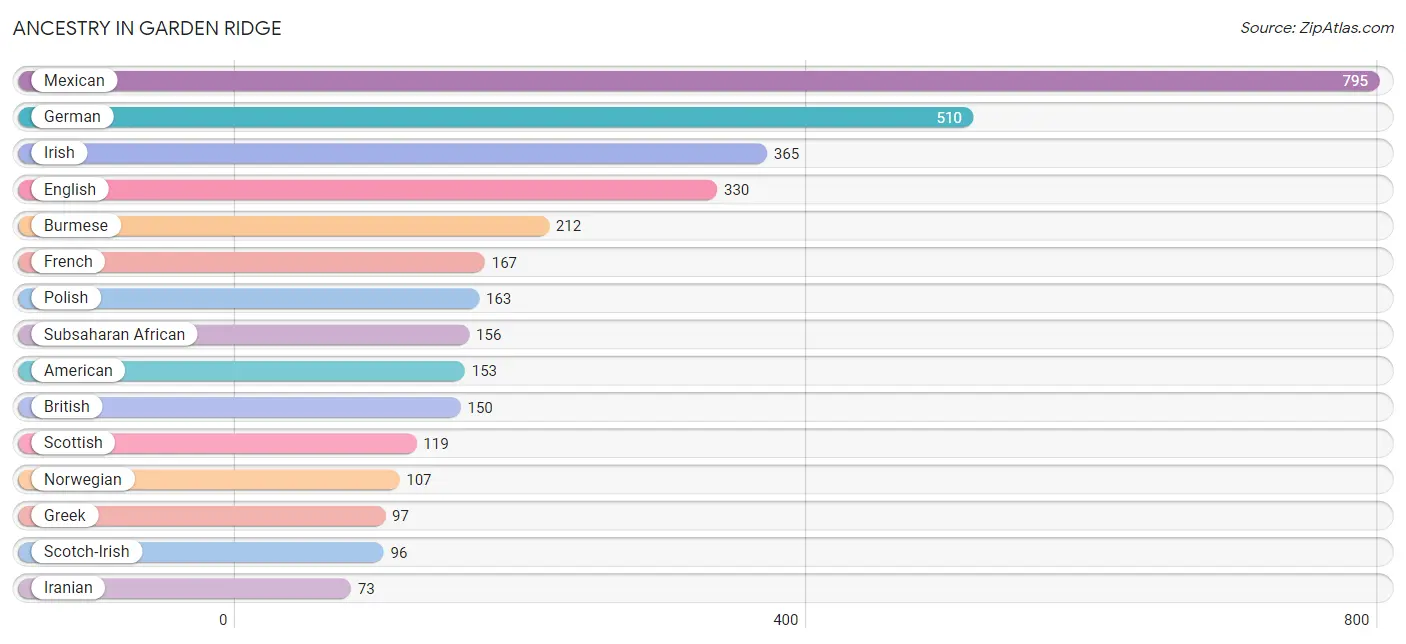
| Ancestry | # Population | % Population |
| American | 153 | 3.7% |
| Australian | 41 | 1.0% |
| British | 150 | 3.6% |
| Burmese | 212 | 5.1% |
| Central American | 38 | 0.9% |
| Czech | 64 | 1.5% |
| Dutch | 51 | 1.2% |
| Eastern European | 34 | 0.8% |
| English | 330 | 7.9% |
| European | 14 | 0.3% |
| Finnish | 33 | 0.8% |
| French | 167 | 4.0% |
| German | 510 | 12.3% |
| Greek | 97 | 2.3% |
| Iranian | 73 | 1.8% |
| Irish | 365 | 8.8% |
| Italian | 46 | 1.1% |
| Korean | 33 | 0.8% |
| Laotian | 31 | 0.7% |
| Mexican | 795 | 19.1% |
| Nicaraguan | 16 | 0.4% |
| Norwegian | 107 | 2.6% |
| Polish | 163 | 3.9% |
| Puerto Rican | 64 | 1.5% |
| Russian | 22 | 0.5% |
| Salvadoran | 22 | 0.5% |
| Scotch-Irish | 96 | 2.3% |
| Scottish | 119 | 2.9% |
| Subsaharan African | 156 | 3.7% |
| Swiss | 10 | 0.2% |
| Ukrainian | 36 | 0.9% | View All 31 Rows |
Immigrants in Garden Ridge
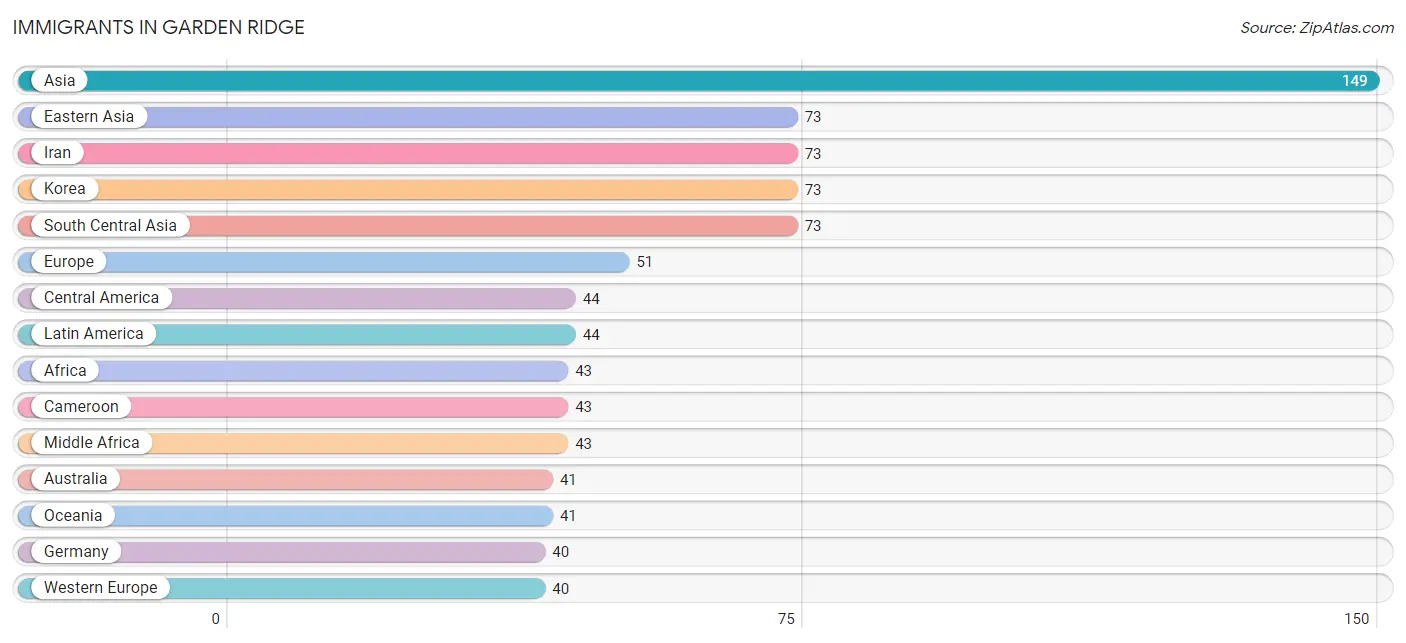
The most numerous immigrant groups reported in Garden Ridge came from Asia (149 | 3.6%), Eastern Asia (73 | 1.8%), Iran (73 | 1.8%), Korea (73 | 1.8%), and South Central Asia (73 | 1.8%), together accounting for 10.6% of all Garden Ridge residents.
| Immigration Origin | # Population | % Population |
| Africa | 43 | 1.0% |
| Asia | 149 | 3.6% |
| Australia | 41 | 1.0% |
| Cameroon | 43 | 1.0% |
| Central America | 44 | 1.1% |
| Eastern Asia | 73 | 1.8% |
| England | 11 | 0.3% |
| Europe | 51 | 1.2% |
| Germany | 40 | 1.0% |
| Iran | 73 | 1.8% |
| Korea | 73 | 1.8% |
| Latin America | 44 | 1.1% |
| Mexico | 28 | 0.7% |
| Middle Africa | 43 | 1.0% |
| Nicaragua | 16 | 0.4% |
| Northern Europe | 11 | 0.3% |
| Oceania | 41 | 1.0% |
| Philippines | 1 | 0.0% |
| South Central Asia | 73 | 1.8% |
| South Eastern Asia | 1 | 0.0% |
| Western Asia | 2 | 0.1% |
| Western Europe | 40 | 1.0% | View All 22 Rows |
Sex and Age in Garden Ridge
Sex and Age in Garden Ridge
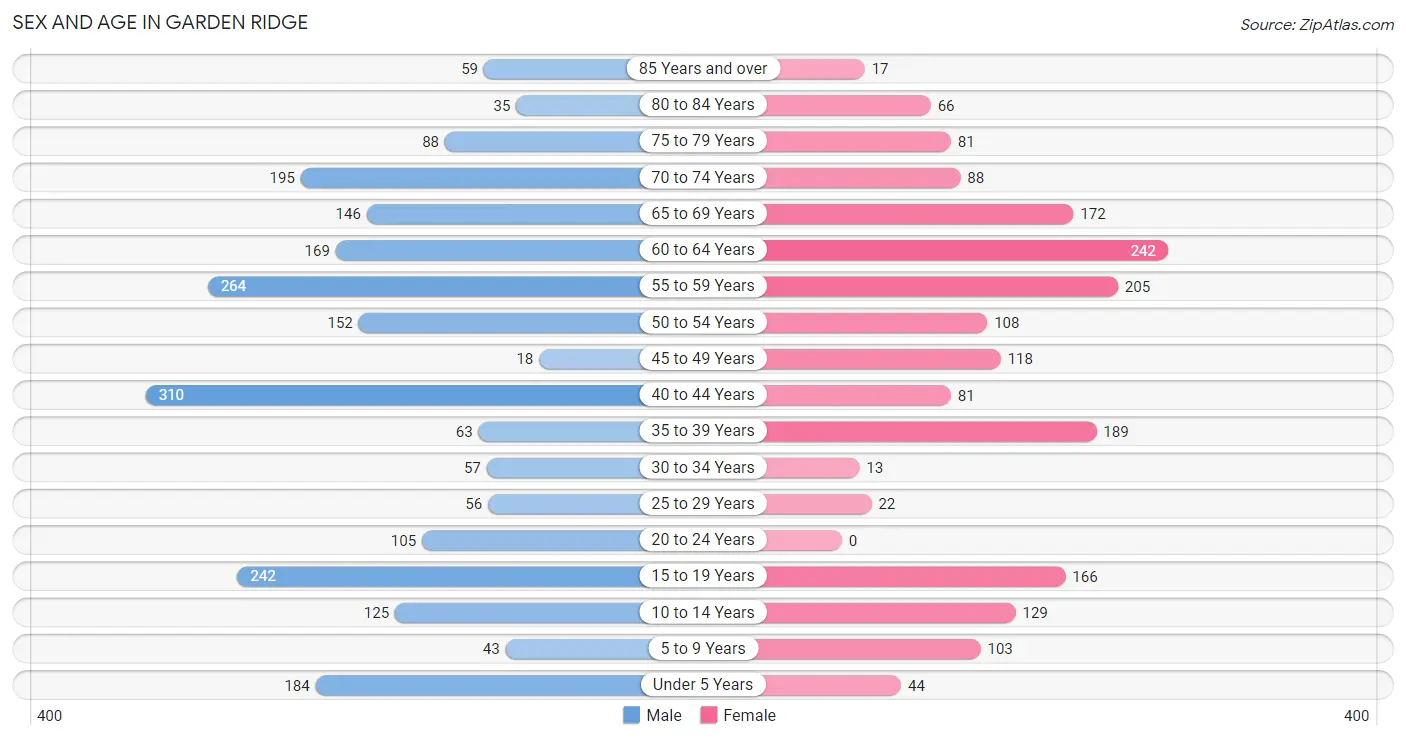
The most populous age groups in Garden Ridge are 40 to 44 Years (310 | 13.4%) for men and 60 to 64 Years (242 | 13.1%) for women.
| Age Bracket | Male | Female |
| Under 5 Years | 184 (8.0%) | 44 (2.4%) |
| 5 to 9 Years | 43 (1.9%) | 103 (5.6%) |
| 10 to 14 Years | 125 (5.4%) | 129 (7.0%) |
| 15 to 19 Years | 242 (10.5%) | 166 (9.0%) |
| 20 to 24 Years | 105 (4.5%) | 0 (0.0%) |
| 25 to 29 Years | 56 (2.4%) | 22 (1.2%) |
| 30 to 34 Years | 57 (2.5%) | 13 (0.7%) |
| 35 to 39 Years | 63 (2.7%) | 189 (10.2%) |
| 40 to 44 Years | 310 (13.4%) | 81 (4.4%) |
| 45 to 49 Years | 18 (0.8%) | 118 (6.4%) |
| 50 to 54 Years | 152 (6.6%) | 108 (5.9%) |
| 55 to 59 Years | 264 (11.4%) | 205 (11.1%) |
| 60 to 64 Years | 169 (7.3%) | 242 (13.1%) |
| 65 to 69 Years | 146 (6.3%) | 172 (9.3%) |
| 70 to 74 Years | 195 (8.4%) | 88 (4.8%) |
| 75 to 79 Years | 88 (3.8%) | 81 (4.4%) |
| 80 to 84 Years | 35 (1.5%) | 66 (3.6%) |
| 85 Years and over | 59 (2.5%) | 17 (0.9%) |
| Total | 2,311 (100.0%) | 1,844 (100.0%) |
Families and Households in Garden Ridge
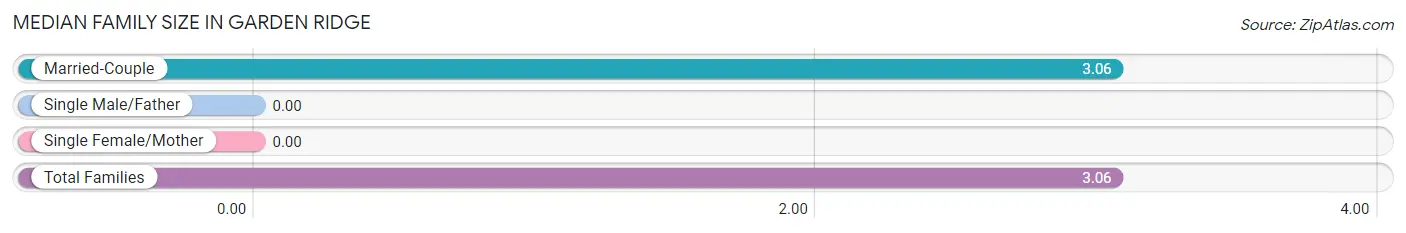
Median Family Size in Garden Ridge
| Family Type | # Families | Family Size |
| Married-Couple | 1,308 (100.0%) | 3.06 |
| Single Male/Father | 0 (0.0%) | - |
| Single Female/Mother | 0 (0.0%) | - |
| Total Families | 1,308 (100.0%) | 3.06 |
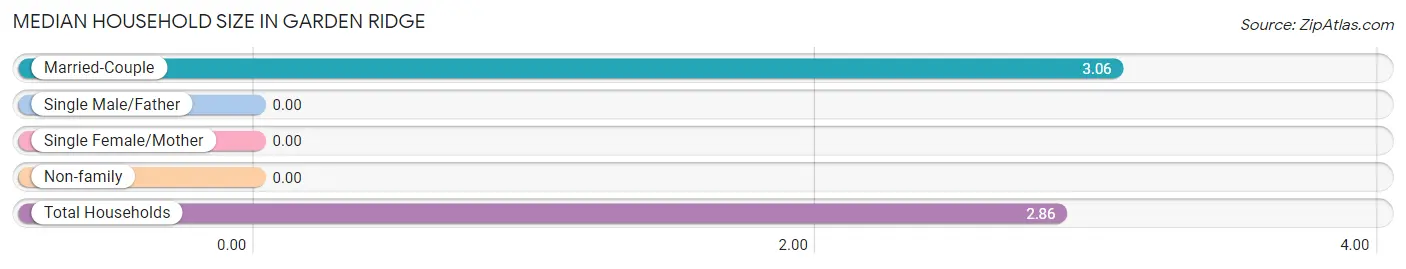
Median Household Size in Garden Ridge
| Household Type | # Households | Household Size |
| Married-Couple | 1,308 (90.2%) | 3.06 |
| Single Male/Father | 0 (0.0%) | - |
| Single Female/Mother | 0 (0.0%) | - |
| Non-family | 142 (9.8%) | - |
| Total Households | 1,450 (100.0%) | 2.86 |
Household Size by Marriage Status in Garden Ridge
Out of a total of 1,450 households in Garden Ridge, 1,308 (90.2%) are family households, while 142 (9.8%) are nonfamily households. The most numerous type of family households are 2-person households, comprising 715, and the most common type of nonfamily households are 1-person households, comprising 142.
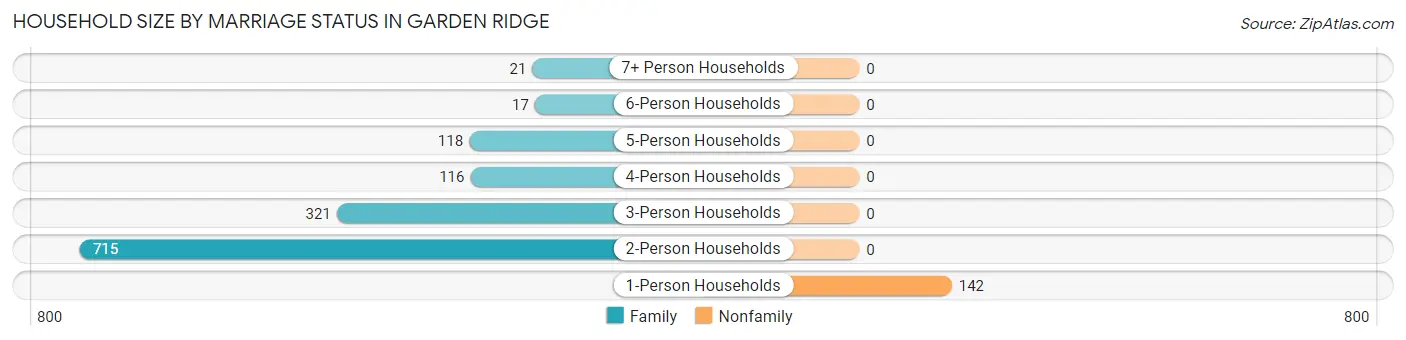
| Household Size | Family Households | Nonfamily Households |
| 1-Person Households | - | 142 (9.8%) |
| 2-Person Households | 715 (49.3%) | 0 (0.0%) |
| 3-Person Households | 321 (22.1%) | 0 (0.0%) |
| 4-Person Households | 116 (8.0%) | 0 (0.0%) |
| 5-Person Households | 118 (8.1%) | 0 (0.0%) |
| 6-Person Households | 17 (1.2%) | 0 (0.0%) |
| 7+ Person Households | 21 (1.5%) | 0 (0.0%) |
| Total | 1,308 (90.2%) | 142 (9.8%) |
Female Fertility in Garden Ridge
Fertility by Age in Garden Ridge
Average fertility rate in Garden Ridge is 24.0 births per 1,000 women. Women in the age bracket of 35 to 50 years have the highest fertility rate with 36.0 births per 1,000 women. Women in the age bracket of 35 to 50 years acount for 100.0% of all women with births.
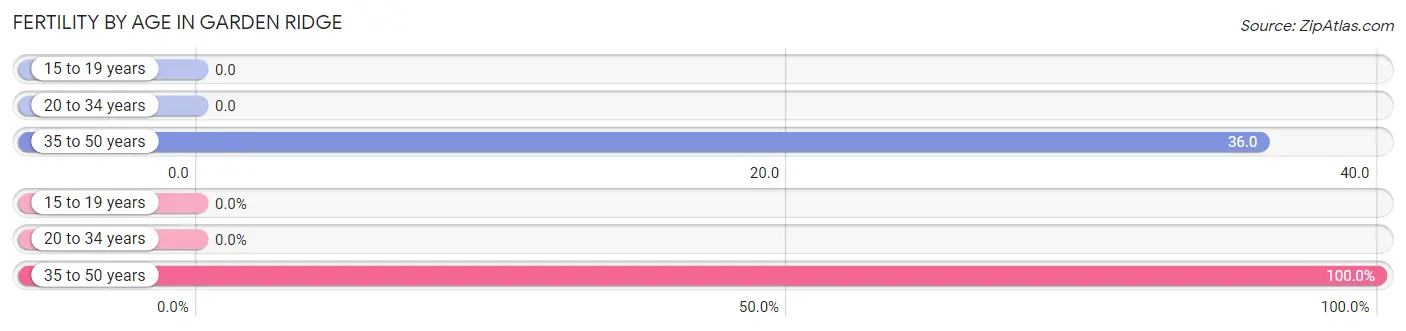
| Age Bracket | Women with Births | Births / 1,000 Women |
| 15 to 19 years | 0 (0.0%) | 0.0 |
| 20 to 34 years | 0 (0.0%) | 0.0 |
| 35 to 50 years | 15 (100.0%) | 36.0 |
| Total | 15 (100.0%) | 24.0 |
Fertility by Age by Marriage Status in Garden Ridge
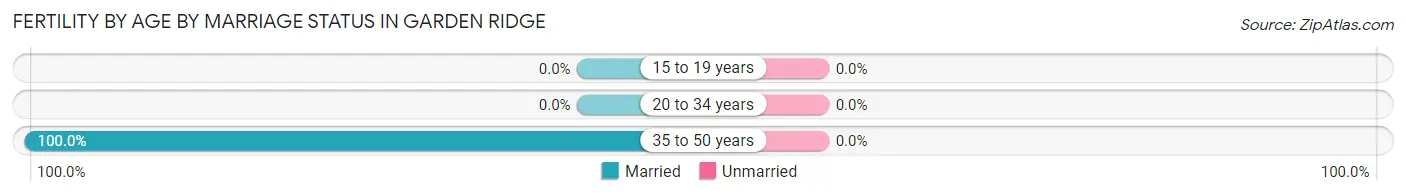
| Age Bracket | Married | Unmarried |
| 15 to 19 years | 0 (0.0%) | 0 (0.0%) |
| 20 to 34 years | 0 (0.0%) | 0 (0.0%) |
| 35 to 50 years | 15 (100.0%) | 0 (0.0%) |
| Total | 15 (100.0%) | 0 (0.0%) |
Fertility by Education in Garden Ridge
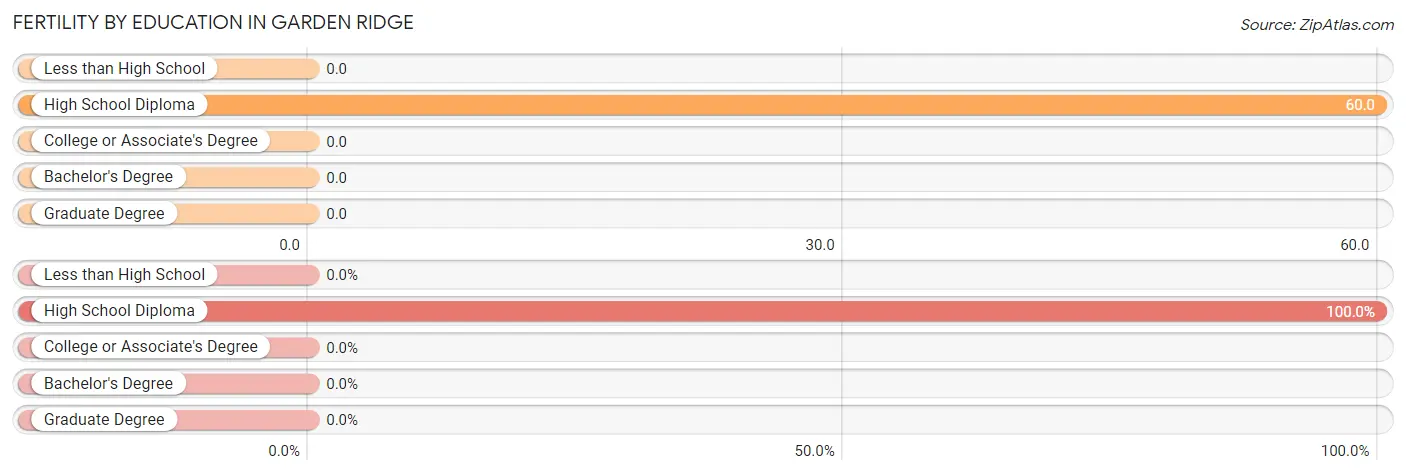
| Educational Attainment | Women with Births | Births / 1,000 Women |
| Less than High School | 0 (0.0%) | 0.0 |
| High School Diploma | 15 (100.0%) | 60.0 |
| College or Associate's Degree | 0 (0.0%) | 0.0 |
| Bachelor's Degree | 0 (0.0%) | 0.0 |
| Graduate Degree | 0 (0.0%) | 0.0 |
| Total | 15 (100.0%) | 24.0 |
Fertility by Education by Marriage Status in Garden Ridge
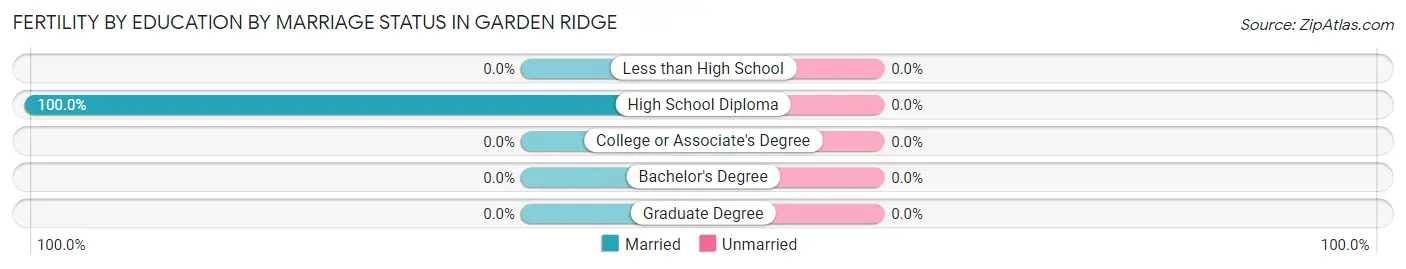
| Educational Attainment | Married | Unmarried |
| Less than High School | 0 (0.0%) | 0 (0.0%) |
| High School Diploma | 15 (100.0%) | 0 (0.0%) |
| College or Associate's Degree | 0 (0.0%) | 0 (0.0%) |
| Bachelor's Degree | 0 (0.0%) | 0 (0.0%) |
| Graduate Degree | 0 (0.0%) | 0 (0.0%) |
| Total | 15 (100.0%) | 0 (0.0%) |
Employment Characteristics in Garden Ridge
Employment by Class of Employer in Garden Ridge
Among the 2,008 employed individuals in Garden Ridge, private company employees (1,240 | 61.8%), self-employed (incorporated) (205 | 10.2%), and not-for-profit organizations (130 | 6.5%) make up the most common classes of employment.
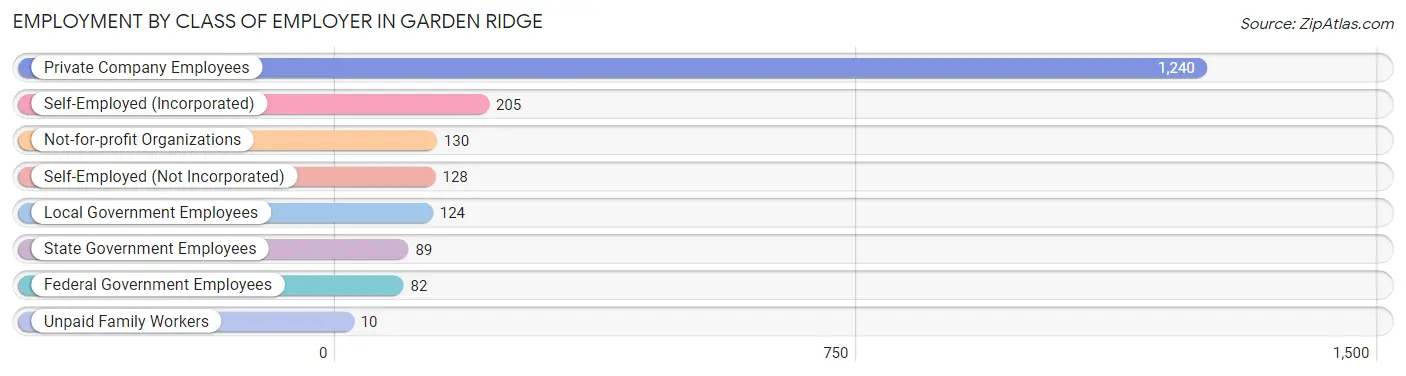
| Employer Class | # Employees | % Employees |
| Private Company Employees | 1,240 | 61.8% |
| Self-Employed (Incorporated) | 205 | 10.2% |
| Self-Employed (Not Incorporated) | 128 | 6.4% |
| Not-for-profit Organizations | 130 | 6.5% |
| Local Government Employees | 124 | 6.2% |
| State Government Employees | 89 | 4.4% |
| Federal Government Employees | 82 | 4.1% |
| Unpaid Family Workers | 10 | 0.5% |
| Total | 2,008 | 100.0% |
Employment Status by Age in Garden Ridge
According to the labor force statistics for Garden Ridge, out of the total population over 16 years of age (3,476), 59.3% or 2,061 individuals are in the labor force, with 2.6% or 54 of them unemployed. The age group with the highest labor force participation rate is 25 to 29 years, with 100.0% or 78 individuals in the labor force. Within the labor force, the 25 to 29 years age range has the highest percentage of unemployed individuals, with 43.6% or 34 of them being unemployed.
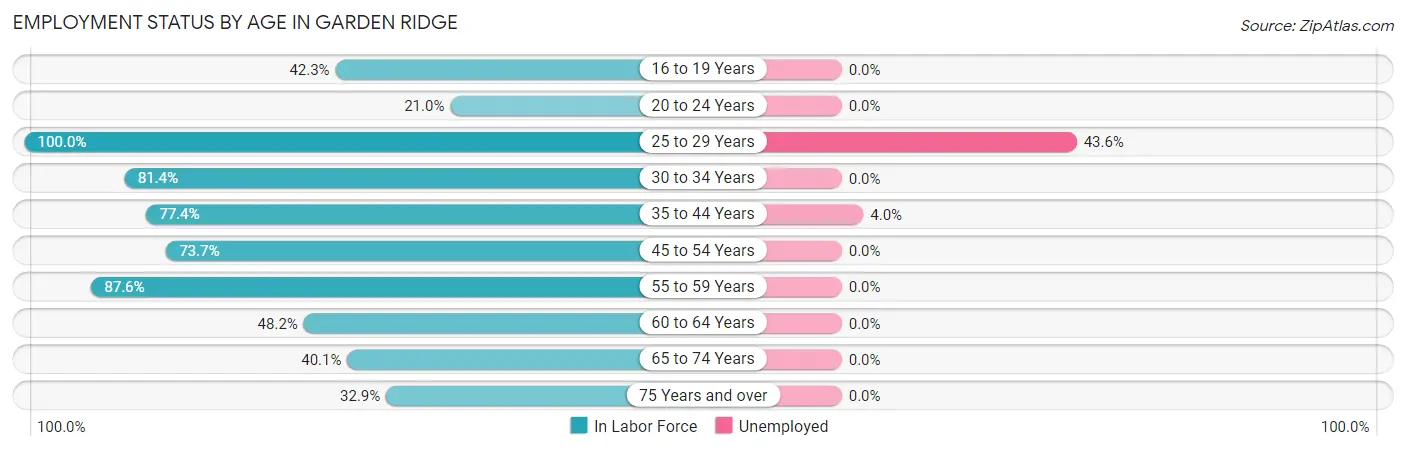
| Age Bracket | In Labor Force | Unemployed |
| 16 to 19 Years | 151 (42.3%) | 0 (0.0%) |
| 20 to 24 Years | 22 (21.0%) | 0 (0.0%) |
| 25 to 29 Years | 78 (100.0%) | 34 (43.6%) |
| 30 to 34 Years | 57 (81.4%) | 0 (0.0%) |
| 35 to 44 Years | 498 (77.4%) | 20 (4.0%) |
| 45 to 54 Years | 292 (73.7%) | 0 (0.0%) |
| 55 to 59 Years | 411 (87.6%) | 0 (0.0%) |
| 60 to 64 Years | 198 (48.2%) | 0 (0.0%) |
| 65 to 74 Years | 241 (40.1%) | 0 (0.0%) |
| 75 Years and over | 114 (32.9%) | 0 (0.0%) |
| Total | 2,061 (59.3%) | 54 (2.6%) |
Employment Status by Educational Attainment in Garden Ridge
According to labor force statistics for Garden Ridge, 74.2% of individuals (1,534) out of the total population between 25 and 64 years of age (2,067) are in the labor force, with 3.5% or 54 of them being unemployed. The group with the highest labor force participation rate are those with the educational attainment of college / associate degree, with 85.2% or 427 individuals in the labor force. Within the labor force, individuals with high school diploma education have the highest percentage of unemployment, with 22.4% or 15 of them being unemployed.
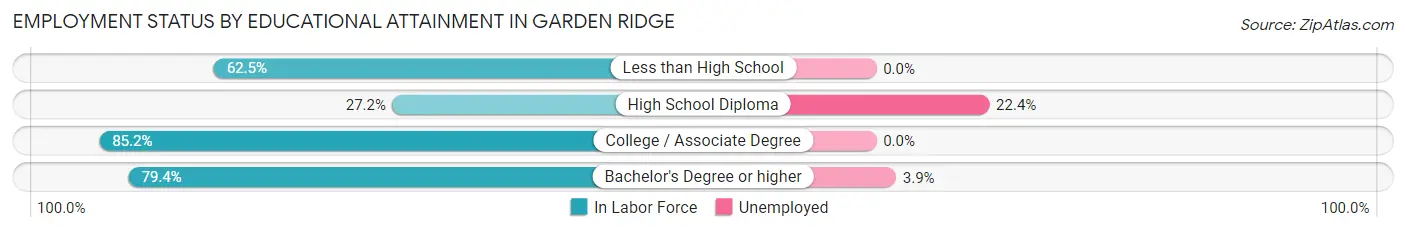
| Educational Attainment | In Labor Force | Unemployed |
| Less than High School | 30 (62.5%) | 0 (0.0%) |
| High School Diploma | 67 (27.2%) | 55 (22.4%) |
| College / Associate Degree | 427 (85.2%) | 0 (0.0%) |
| Bachelor's Degree or higher | 1,010 (79.4%) | 50 (3.9%) |
| Total | 1,534 (74.2%) | 72 (3.5%) |
Employment Occupations by Sex in Garden Ridge
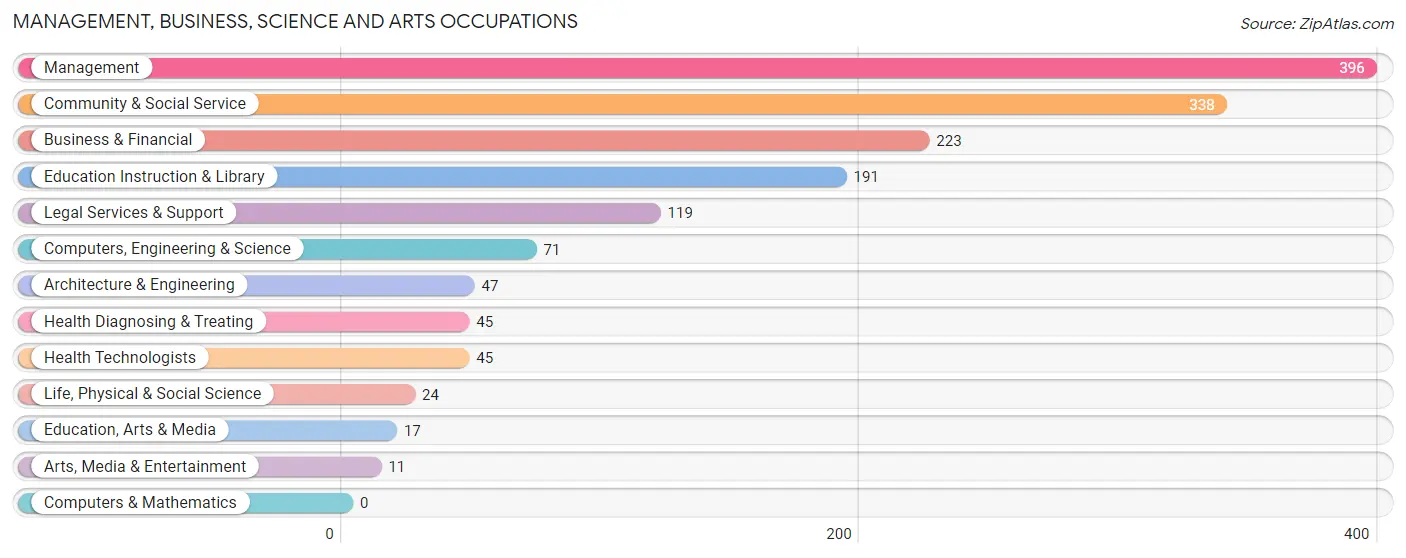
Management, Business, Science and Arts Occupations
The most common Management, Business, Science and Arts occupations in Garden Ridge are Management (396 | 19.7%), Community & Social Service (338 | 16.8%), Business & Financial (223 | 11.1%), Education Instruction & Library (191 | 9.5%), and Legal Services & Support (119 | 5.9%).
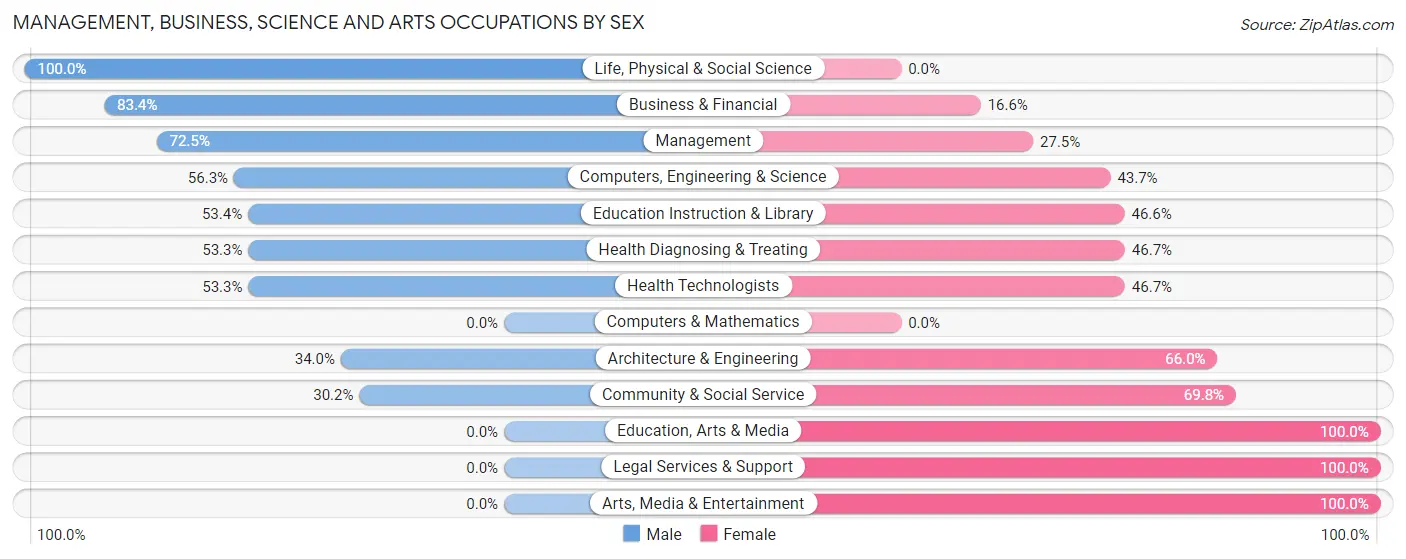
Management, Business, Science and Arts Occupations by Sex
Within the Management, Business, Science and Arts occupations in Garden Ridge, the most male-oriented occupations are Life, Physical & Social Science (100.0%), Business & Financial (83.4%), and Management (72.5%), while the most female-oriented occupations are Education, Arts & Media (100.0%), Legal Services & Support (100.0%), and Arts, Media & Entertainment (100.0%).
| Occupation | Male | Female |
| Management | 287 (72.5%) | 109 (27.5%) |
| Business & Financial | 186 (83.4%) | 37 (16.6%) |
| Computers, Engineering & Science | 40 (56.3%) | 31 (43.7%) |
| Computers & Mathematics | 0 (0.0%) | 0 (0.0%) |
| Architecture & Engineering | 16 (34.0%) | 31 (66.0%) |
| Life, Physical & Social Science | 24 (100.0%) | 0 (0.0%) |
| Community & Social Service | 102 (30.2%) | 236 (69.8%) |
| Education, Arts & Media | 0 (0.0%) | 17 (100.0%) |
| Legal Services & Support | 0 (0.0%) | 119 (100.0%) |
| Education Instruction & Library | 102 (53.4%) | 89 (46.6%) |
| Arts, Media & Entertainment | 0 (0.0%) | 11 (100.0%) |
| Health Diagnosing & Treating | 24 (53.3%) | 21 (46.7%) |
| Health Technologists | 24 (53.3%) | 21 (46.7%) |
| Total (Category) | 639 (59.6%) | 434 (40.5%) |
| Total (Overall) | 1,289 (64.2%) | 719 (35.8%) |
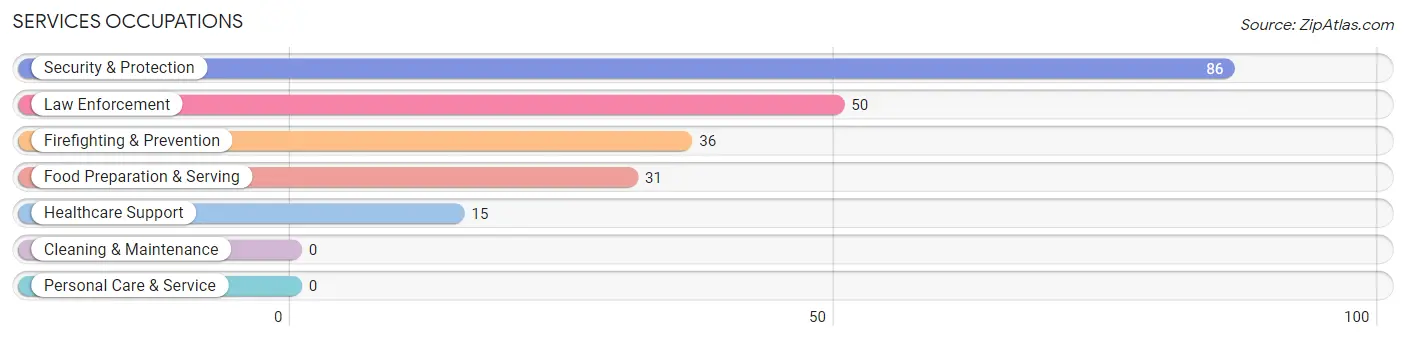
Services Occupations
The most common Services occupations in Garden Ridge are Security & Protection (86 | 4.3%), Law Enforcement (50 | 2.5%), Firefighting & Prevention (36 | 1.8%), Food Preparation & Serving (31 | 1.5%), and Healthcare Support (15 | 0.7%).
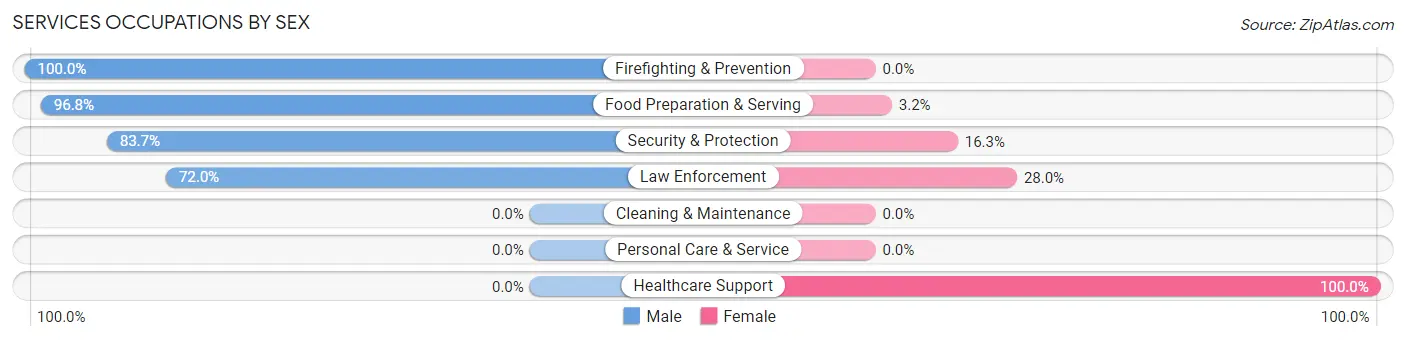
Services Occupations by Sex
Within the Services occupations in Garden Ridge, the most male-oriented occupations are Firefighting & Prevention (100.0%), Food Preparation & Serving (96.8%), and Security & Protection (83.7%), while the most female-oriented occupations are Healthcare Support (100.0%), Law Enforcement (28.0%), and Security & Protection (16.3%).
| Occupation | Male | Female |
| Healthcare Support | 0 (0.0%) | 15 (100.0%) |
| Security & Protection | 72 (83.7%) | 14 (16.3%) |
| Firefighting & Prevention | 36 (100.0%) | 0 (0.0%) |
| Law Enforcement | 36 (72.0%) | 14 (28.0%) |
| Food Preparation & Serving | 30 (96.8%) | 1 (3.2%) |
| Cleaning & Maintenance | 0 (0.0%) | 0 (0.0%) |
| Personal Care & Service | 0 (0.0%) | 0 (0.0%) |
| Total (Category) | 102 (77.3%) | 30 (22.7%) |
| Total (Overall) | 1,289 (64.2%) | 719 (35.8%) |
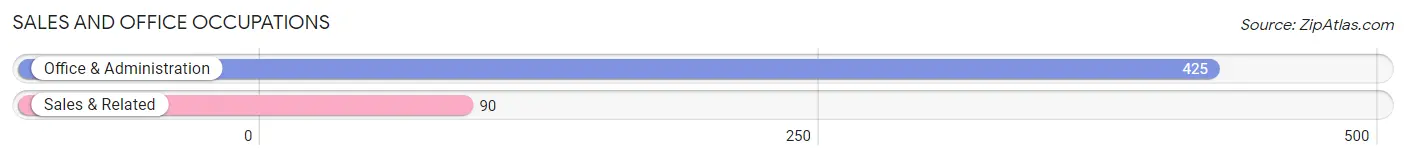
Sales and Office Occupations
The most common Sales and Office occupations in Garden Ridge are Office & Administration (425 | 21.2%), and Sales & Related (90 | 4.5%).
Sales and Office Occupations by Sex
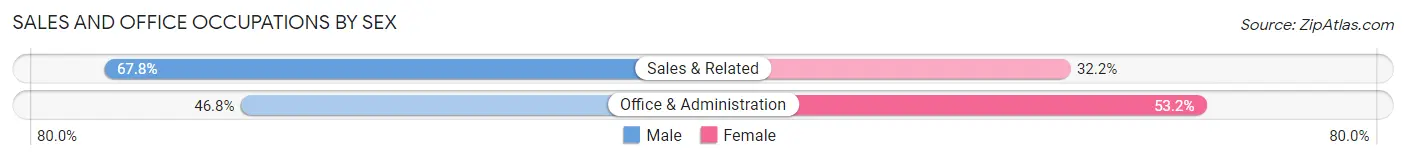
| Occupation | Male | Female |
| Sales & Related | 61 (67.8%) | 29 (32.2%) |
| Office & Administration | 199 (46.8%) | 226 (53.2%) |
| Total (Category) | 260 (50.5%) | 255 (49.5%) |
| Total (Overall) | 1,289 (64.2%) | 719 (35.8%) |
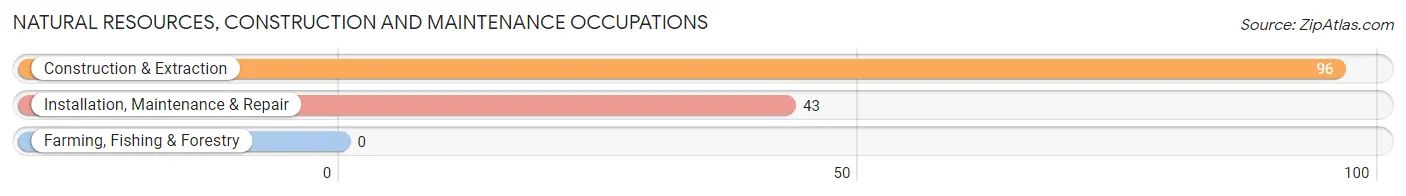
Natural Resources, Construction and Maintenance Occupations
The most common Natural Resources, Construction and Maintenance occupations in Garden Ridge are Construction & Extraction (96 | 4.8%), and Installation, Maintenance & Repair (43 | 2.1%).
Natural Resources, Construction and Maintenance Occupations by Sex
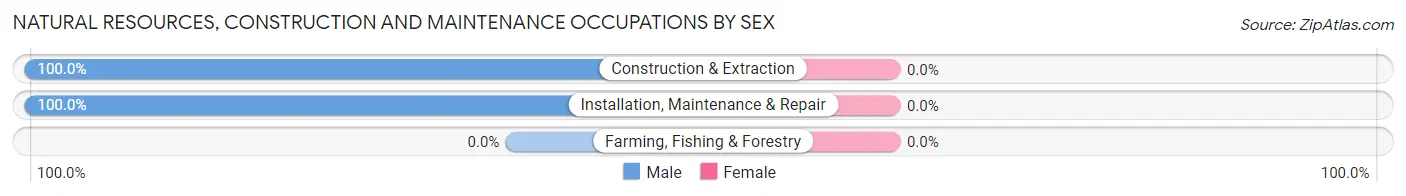
| Occupation | Male | Female |
| Farming, Fishing & Forestry | 0 (0.0%) | 0 (0.0%) |
| Construction & Extraction | 96 (100.0%) | 0 (0.0%) |
| Installation, Maintenance & Repair | 43 (100.0%) | 0 (0.0%) |
| Total (Category) | 139 (100.0%) | 0 (0.0%) |
| Total (Overall) | 1,289 (64.2%) | 719 (35.8%) |
Production, Transportation and Moving Occupations
The most common Production, Transportation and Moving occupations in Garden Ridge are Transportation (120 | 6.0%), and Material Moving (29 | 1.4%).
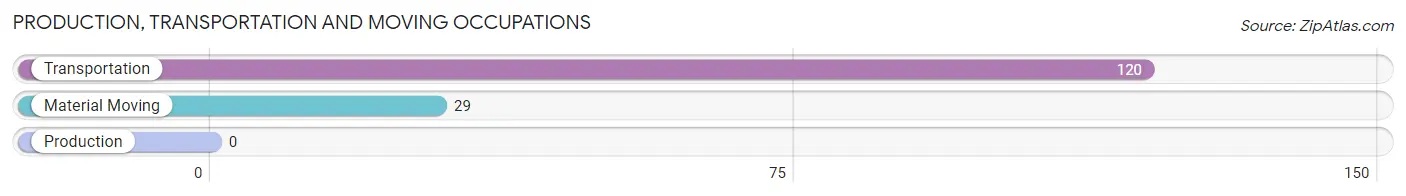
Production, Transportation and Moving Occupations by Sex
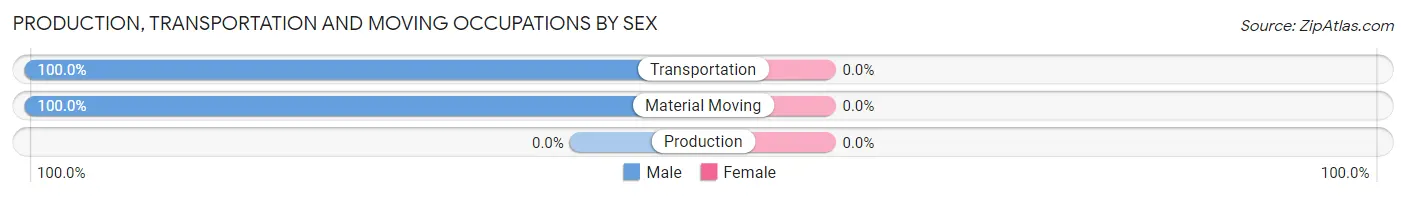
| Occupation | Male | Female |
| Production | 0 (0.0%) | 0 (0.0%) |
| Transportation | 120 (100.0%) | 0 (0.0%) |
| Material Moving | 29 (100.0%) | 0 (0.0%) |
| Total (Category) | 149 (100.0%) | 0 (0.0%) |
| Total (Overall) | 1,289 (64.2%) | 719 (35.8%) |
Employment Industries by Sex in Garden Ridge
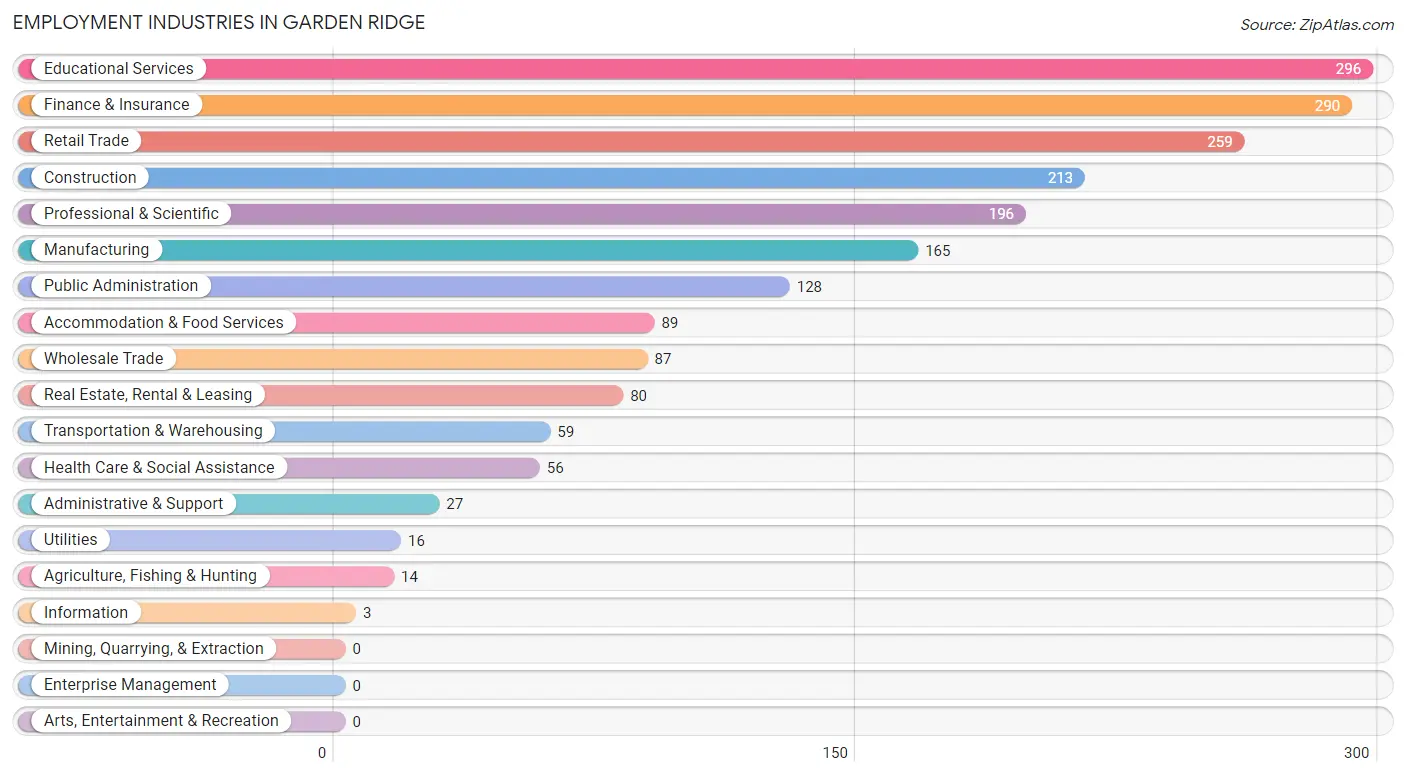
Employment Industries in Garden Ridge
The major employment industries in Garden Ridge include Educational Services (296 | 14.7%), Finance & Insurance (290 | 14.4%), Retail Trade (259 | 12.9%), Construction (213 | 10.6%), and Professional & Scientific (196 | 9.8%).
Employment Industries by Sex in Garden Ridge
The Garden Ridge industries that see more men than women are Agriculture, Fishing & Hunting (100.0%), Transportation & Warehousing (100.0%), and Utilities (100.0%), whereas the industries that tend to have a higher number of women are Information (100.0%), Health Care & Social Assistance (75.0%), and Administrative & Support (66.7%).
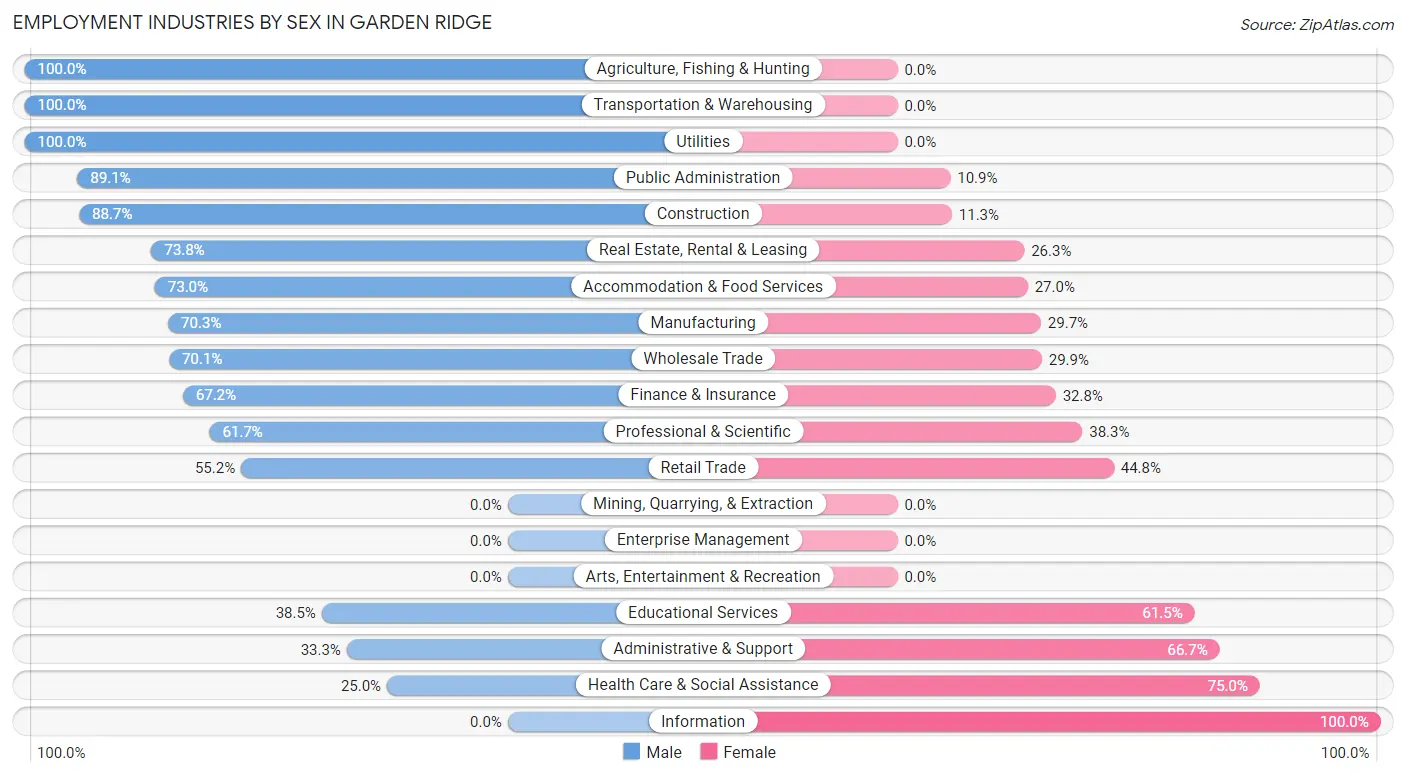
| Industry | Male | Female |
| Agriculture, Fishing & Hunting | 14 (100.0%) | 0 (0.0%) |
| Mining, Quarrying, & Extraction | 0 (0.0%) | 0 (0.0%) |
| Construction | 189 (88.7%) | 24 (11.3%) |
| Manufacturing | 116 (70.3%) | 49 (29.7%) |
| Wholesale Trade | 61 (70.1%) | 26 (29.9%) |
| Retail Trade | 143 (55.2%) | 116 (44.8%) |
| Transportation & Warehousing | 59 (100.0%) | 0 (0.0%) |
| Utilities | 16 (100.0%) | 0 (0.0%) |
| Information | 0 (0.0%) | 3 (100.0%) |
| Finance & Insurance | 195 (67.2%) | 95 (32.8%) |
| Real Estate, Rental & Leasing | 59 (73.8%) | 21 (26.3%) |
| Professional & Scientific | 121 (61.7%) | 75 (38.3%) |
| Enterprise Management | 0 (0.0%) | 0 (0.0%) |
| Administrative & Support | 9 (33.3%) | 18 (66.7%) |
| Educational Services | 114 (38.5%) | 182 (61.5%) |
| Health Care & Social Assistance | 14 (25.0%) | 42 (75.0%) |
| Arts, Entertainment & Recreation | 0 (0.0%) | 0 (0.0%) |
| Accommodation & Food Services | 65 (73.0%) | 24 (27.0%) |
| Public Administration | 114 (89.1%) | 14 (10.9%) |
| Total | 1,289 (64.2%) | 719 (35.8%) |
Education in Garden Ridge
School Enrollment in Garden Ridge
The most common levels of schooling among the 1,023 students in Garden Ridge are college / undergraduate (312 | 30.5%), high school (240 | 23.5%), and middle school (203 | 19.8%).
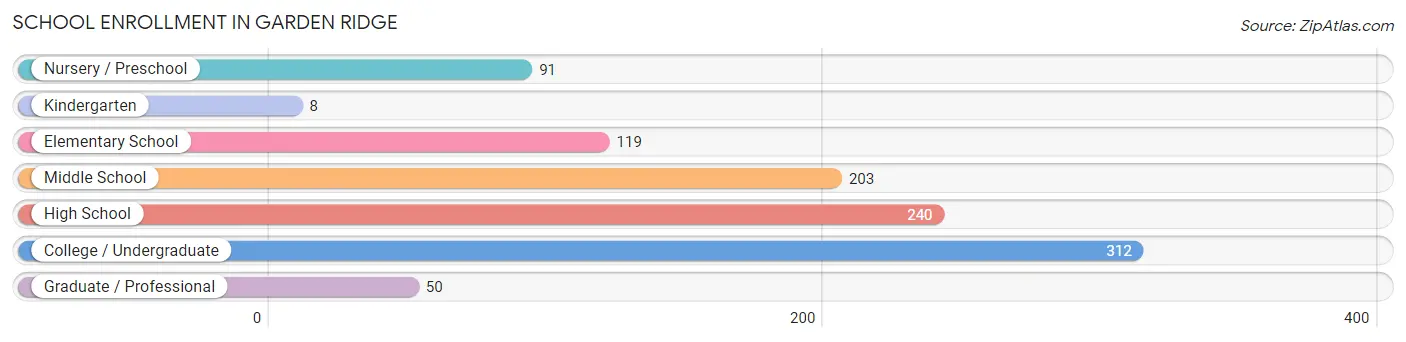
| School Level | # Students | % Students |
| Nursery / Preschool | 91 | 8.9% |
| Kindergarten | 8 | 0.8% |
| Elementary School | 119 | 11.6% |
| Middle School | 203 | 19.8% |
| High School | 240 | 23.5% |
| College / Undergraduate | 312 | 30.5% |
| Graduate / Professional | 50 | 4.9% |
| Total | 1,023 | 100.0% |
School Enrollment by Age by Funding Source in Garden Ridge
Out of a total of 1,023 students who are enrolled in schools in Garden Ridge, 123 (12.0%) attend a private institution, while the remaining 900 (88.0%) are enrolled in public schools. The age group of 3 to 4 year olds has the highest likelihood of being enrolled in private schools, with 35 (53.0% in the age bracket) enrolled. Conversely, the age group of 18 to 19 year olds has the lowest likelihood of being enrolled in a private school, with 204 (100.0% in the age bracket) attending a public institution.
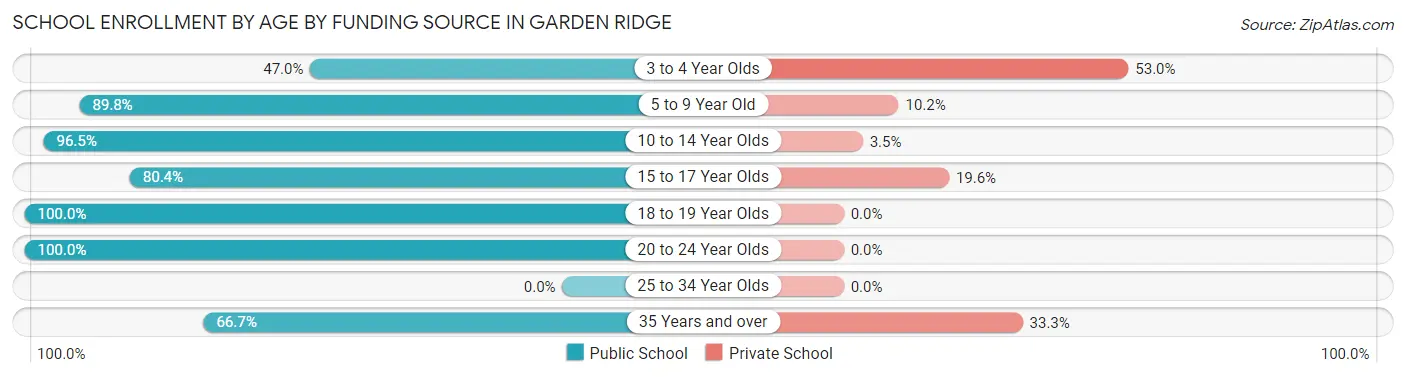
| Age Bracket | Public School | Private School |
| 3 to 4 Year Olds | 31 (47.0%) | 35 (53.0%) |
| 5 to 9 Year Old | 123 (89.8%) | 14 (10.2%) |
| 10 to 14 Year Olds | 245 (96.5%) | 9 (3.5%) |
| 15 to 17 Year Olds | 164 (80.4%) | 40 (19.6%) |
| 18 to 19 Year Olds | 204 (100.0%) | 0 (0.0%) |
| 20 to 24 Year Olds | 83 (100.0%) | 0 (0.0%) |
| 25 to 34 Year Olds | 0 (0.0%) | 0 (0.0%) |
| 35 Years and over | 50 (66.7%) | 25 (33.3%) |
| Total | 900 (88.0%) | 123 (12.0%) |
Educational Attainment by Field of Study in Garden Ridge
Business (505 | 25.6%), education (395 | 20.0%), engineering (185 | 9.4%), liberal arts & history (185 | 9.4%), and science & technology (102 | 5.2%) are the most common fields of study among 1,976 individuals in Garden Ridge who have obtained a bachelor's degree or higher.
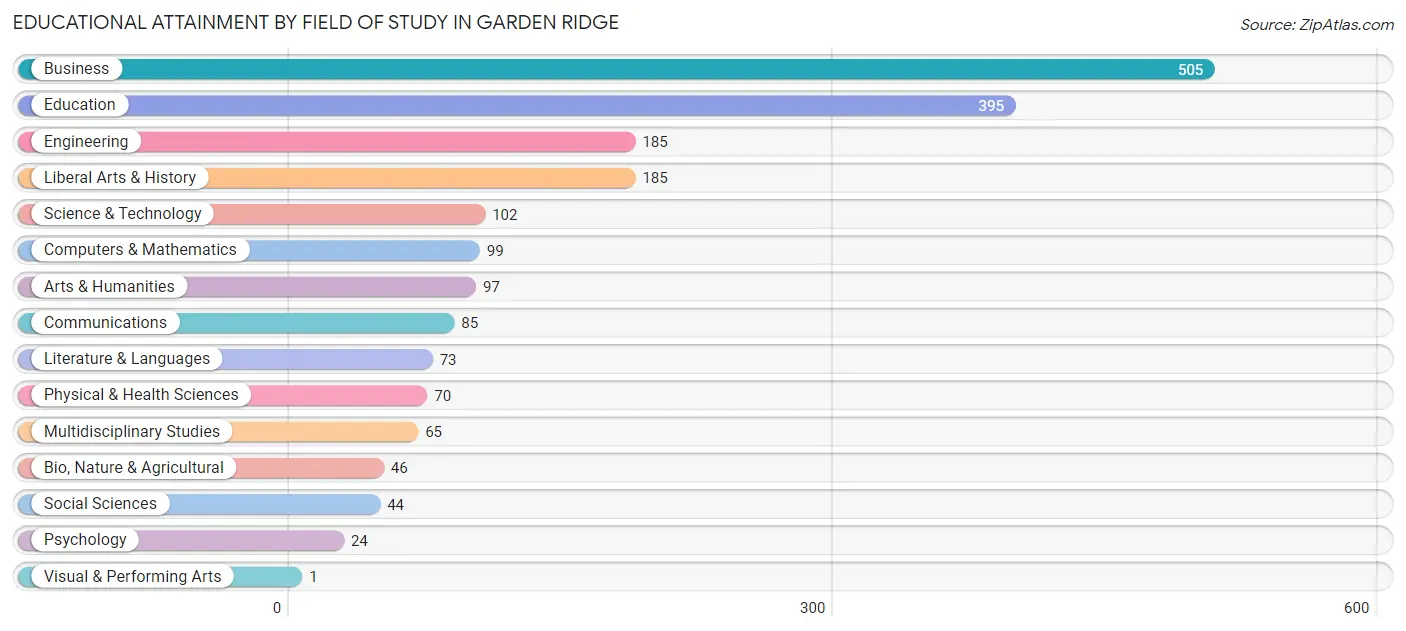
| Field of Study | # Graduates | % Graduates |
| Computers & Mathematics | 99 | 5.0% |
| Bio, Nature & Agricultural | 46 | 2.3% |
| Physical & Health Sciences | 70 | 3.5% |
| Psychology | 24 | 1.2% |
| Social Sciences | 44 | 2.2% |
| Engineering | 185 | 9.4% |
| Multidisciplinary Studies | 65 | 3.3% |
| Science & Technology | 102 | 5.2% |
| Business | 505 | 25.6% |
| Education | 395 | 20.0% |
| Literature & Languages | 73 | 3.7% |
| Liberal Arts & History | 185 | 9.4% |
| Visual & Performing Arts | 1 | 0.1% |
| Communications | 85 | 4.3% |
| Arts & Humanities | 97 | 4.9% |
| Total | 1,976 | 100.0% |
Transportation & Commute in Garden Ridge
Vehicle Availability by Sex in Garden Ridge
The most prevalent vehicle ownership categories in Garden Ridge are males with 2 vehicles (521, accounting for 40.4%) and females with 2 vehicles (220, making up 72.6%).
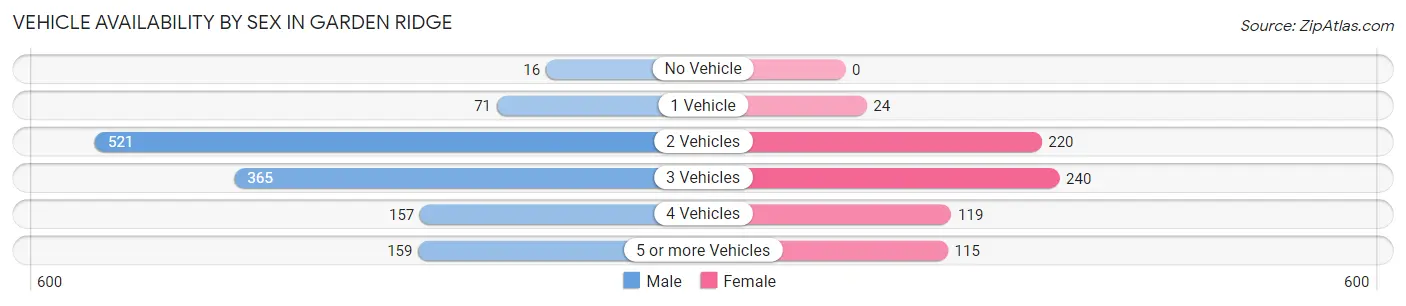
| Vehicles Available | Male | Female |
| No Vehicle | 16 (1.2%) | 0 (0.0%) |
| 1 Vehicle | 71 (5.5%) | 24 (3.3%) |
| 2 Vehicles | 521 (40.4%) | 220 (30.6%) |
| 3 Vehicles | 365 (28.3%) | 240 (33.4%) |
| 4 Vehicles | 157 (12.2%) | 119 (16.6%) |
| 5 or more Vehicles | 159 (12.3%) | 115 (16.0%) |
| Total | 1,289 (100.0%) | 718 (100.0%) |
Commute Time in Garden Ridge
The most frequently occuring commute durations in Garden Ridge are 30 to 34 minutes (452 commuters, 27.1%), 45 to 59 minutes (285 commuters, 17.1%), and 20 to 24 minutes (248 commuters, 14.9%).
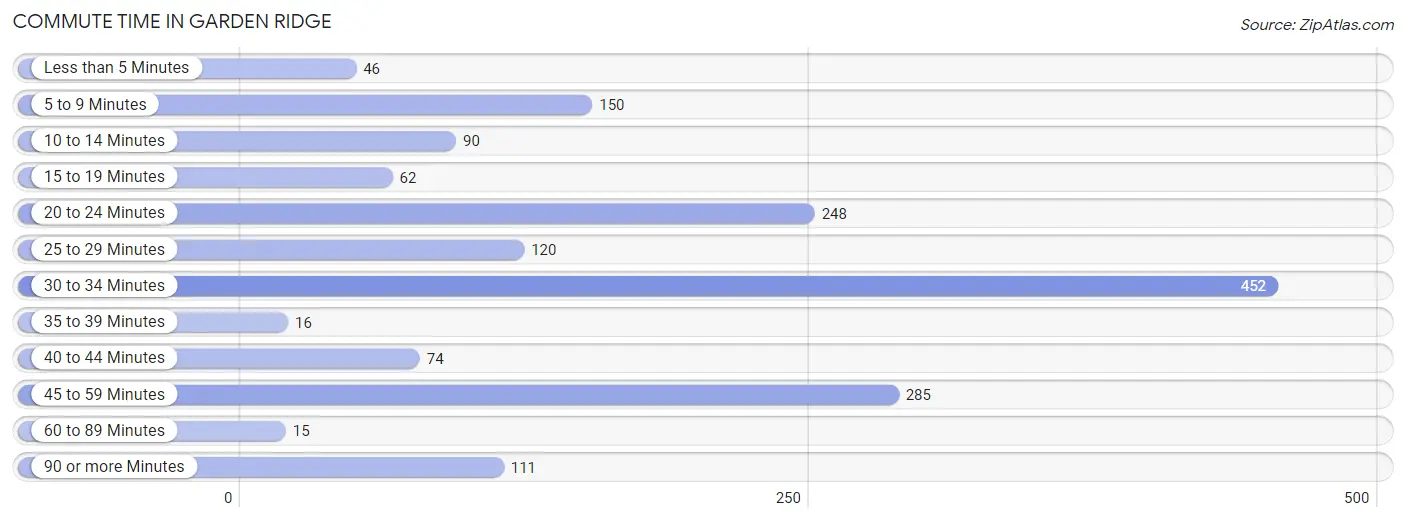
| Commute Time | # Commuters | % Commuters |
| Less than 5 Minutes | 46 | 2.8% |
| 5 to 9 Minutes | 150 | 9.0% |
| 10 to 14 Minutes | 90 | 5.4% |
| 15 to 19 Minutes | 62 | 3.7% |
| 20 to 24 Minutes | 248 | 14.9% |
| 25 to 29 Minutes | 120 | 7.2% |
| 30 to 34 Minutes | 452 | 27.1% |
| 35 to 39 Minutes | 16 | 1.0% |
| 40 to 44 Minutes | 74 | 4.4% |
| 45 to 59 Minutes | 285 | 17.1% |
| 60 to 89 Minutes | 15 | 0.9% |
| 90 or more Minutes | 111 | 6.7% |
Commute Time by Sex in Garden Ridge
The most common commute times in Garden Ridge are 30 to 34 minutes (267 commuters, 25.1%) for males and 30 to 34 minutes (185 commuters, 30.5%) for females.
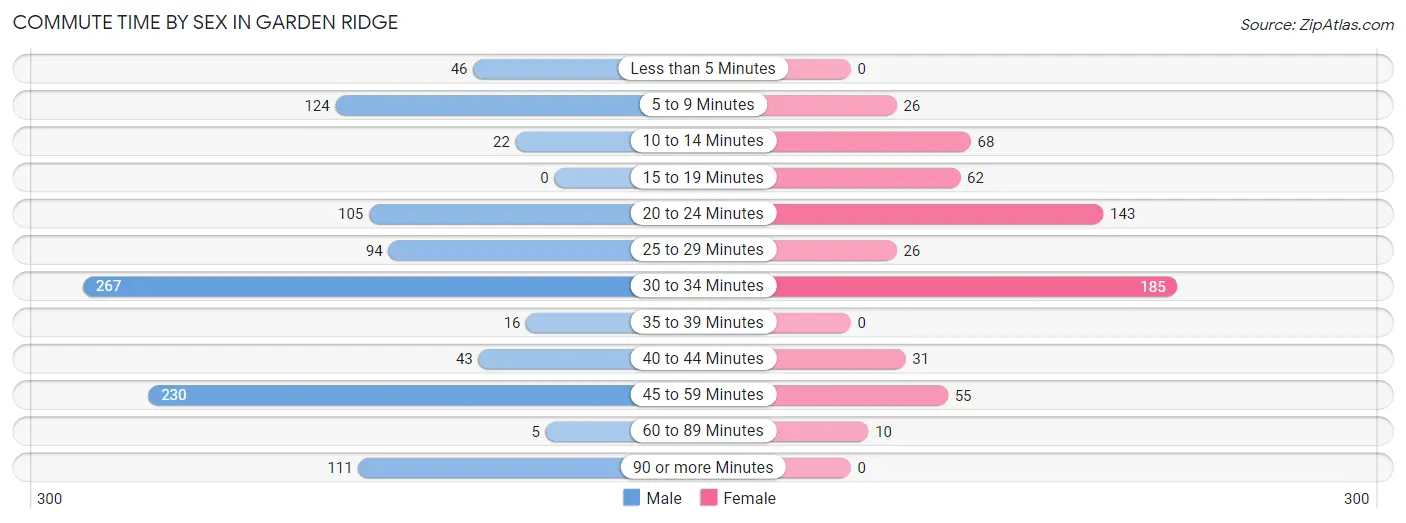
| Commute Time | Male | Female |
| Less than 5 Minutes | 46 (4.3%) | 0 (0.0%) |
| 5 to 9 Minutes | 124 (11.7%) | 26 (4.3%) |
| 10 to 14 Minutes | 22 (2.1%) | 68 (11.2%) |
| 15 to 19 Minutes | 0 (0.0%) | 62 (10.2%) |
| 20 to 24 Minutes | 105 (9.9%) | 143 (23.6%) |
| 25 to 29 Minutes | 94 (8.8%) | 26 (4.3%) |
| 30 to 34 Minutes | 267 (25.1%) | 185 (30.5%) |
| 35 to 39 Minutes | 16 (1.5%) | 0 (0.0%) |
| 40 to 44 Minutes | 43 (4.1%) | 31 (5.1%) |
| 45 to 59 Minutes | 230 (21.6%) | 55 (9.1%) |
| 60 to 89 Minutes | 5 (0.5%) | 10 (1.7%) |
| 90 or more Minutes | 111 (10.4%) | 0 (0.0%) |
Time of Departure to Work by Sex in Garden Ridge
The most frequent times of departure to work in Garden Ridge are 7:00 AM to 7:29 AM (300, 28.2%) for males and 7:30 AM to 7:59 AM (171, 28.2%) for females.
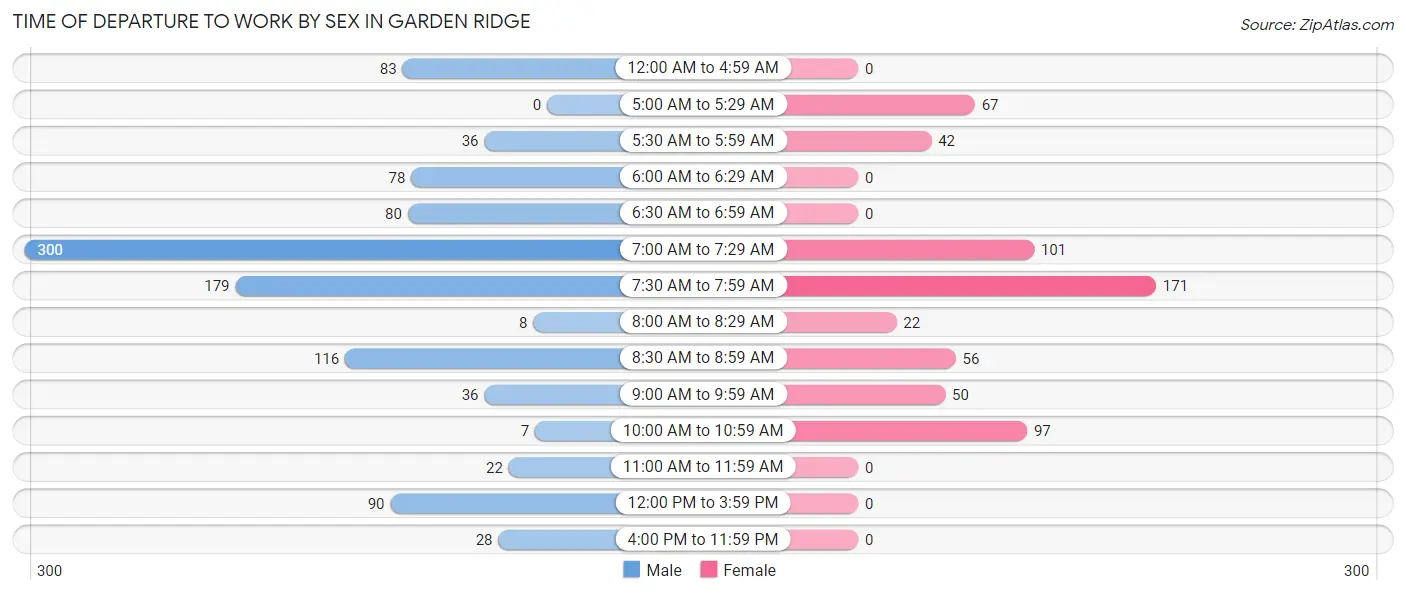
| Time of Departure | Male | Female |
| 12:00 AM to 4:59 AM | 83 (7.8%) | 0 (0.0%) |
| 5:00 AM to 5:29 AM | 0 (0.0%) | 67 (11.1%) |
| 5:30 AM to 5:59 AM | 36 (3.4%) | 42 (6.9%) |
| 6:00 AM to 6:29 AM | 78 (7.3%) | 0 (0.0%) |
| 6:30 AM to 6:59 AM | 80 (7.5%) | 0 (0.0%) |
| 7:00 AM to 7:29 AM | 300 (28.2%) | 101 (16.7%) |
| 7:30 AM to 7:59 AM | 179 (16.8%) | 171 (28.2%) |
| 8:00 AM to 8:29 AM | 8 (0.7%) | 22 (3.6%) |
| 8:30 AM to 8:59 AM | 116 (10.9%) | 56 (9.2%) |
| 9:00 AM to 9:59 AM | 36 (3.4%) | 50 (8.3%) |
| 10:00 AM to 10:59 AM | 7 (0.7%) | 97 (16.0%) |
| 11:00 AM to 11:59 AM | 22 (2.1%) | 0 (0.0%) |
| 12:00 PM to 3:59 PM | 90 (8.5%) | 0 (0.0%) |
| 4:00 PM to 11:59 PM | 28 (2.6%) | 0 (0.0%) |
| Total | 1,063 (100.0%) | 606 (100.0%) |
Housing Occupancy in Garden Ridge
Occupancy by Ownership in Garden Ridge
Of the total 1,450 dwellings in Garden Ridge, owner-occupied units account for 1,385 (95.5%), while renter-occupied units make up 65 (4.5%).
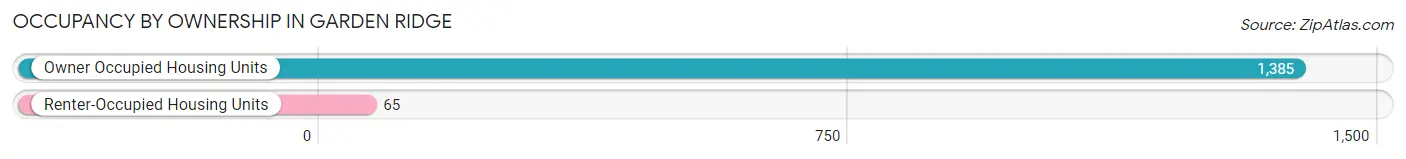
| Occupancy | # Housing Units | % Housing Units |
| Owner Occupied Housing Units | 1,385 | 95.5% |
| Renter-Occupied Housing Units | 65 | 4.5% |
| Total Occupied Housing Units | 1,450 | 100.0% |
Occupancy by Household Size in Garden Ridge
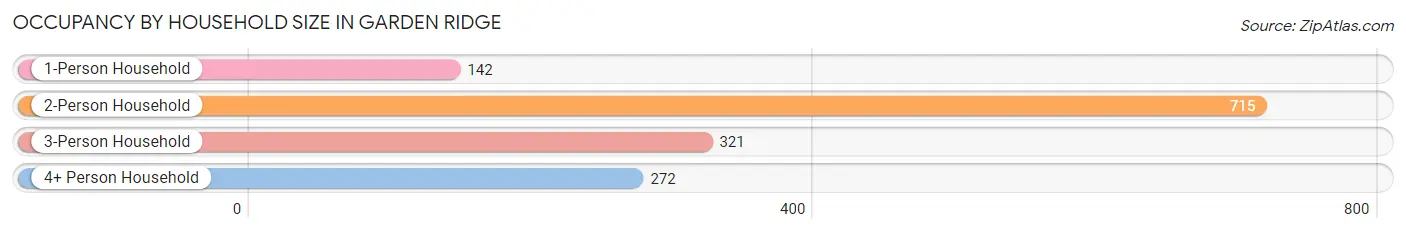
| Household Size | # Housing Units | % Housing Units |
| 1-Person Household | 142 | 9.8% |
| 2-Person Household | 715 | 49.3% |
| 3-Person Household | 321 | 22.1% |
| 4+ Person Household | 272 | 18.8% |
| Total Housing Units | 1,450 | 100.0% |
Occupancy by Ownership by Household Size in Garden Ridge
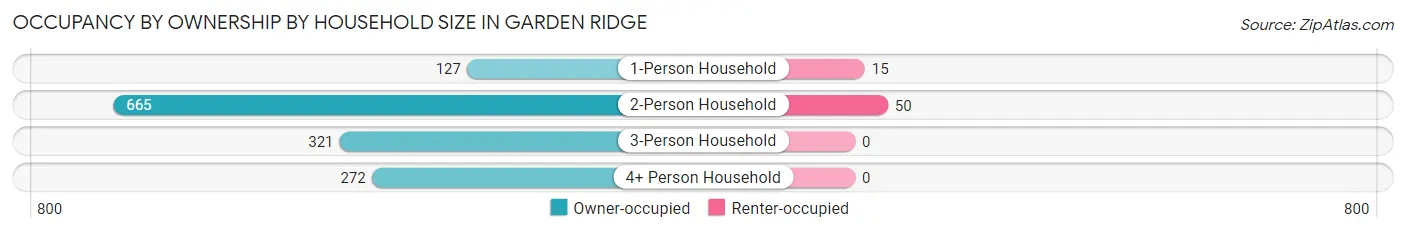
| Household Size | Owner-occupied | Renter-occupied |
| 1-Person Household | 127 (89.4%) | 15 (10.6%) |
| 2-Person Household | 665 (93.0%) | 50 (7.0%) |
| 3-Person Household | 321 (100.0%) | 0 (0.0%) |
| 4+ Person Household | 272 (100.0%) | 0 (0.0%) |
| Total Housing Units | 1,385 (95.5%) | 65 (4.5%) |
Occupancy by Educational Attainment in Garden Ridge
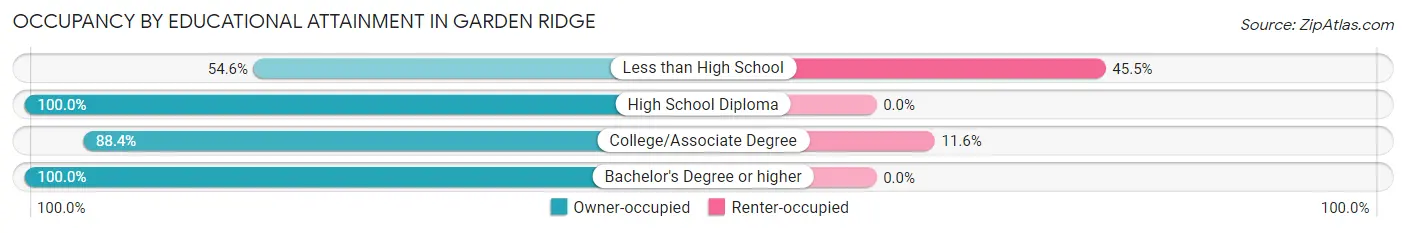
| Household Size | Owner-occupied | Renter-occupied |
| Less than High School | 18 (54.5%) | 15 (45.5%) |
| High School Diploma | 44 (100.0%) | 0 (0.0%) |
| College/Associate Degree | 382 (88.4%) | 50 (11.6%) |
| Bachelor's Degree or higher | 941 (100.0%) | 0 (0.0%) |
Occupancy by Age of Householder in Garden Ridge
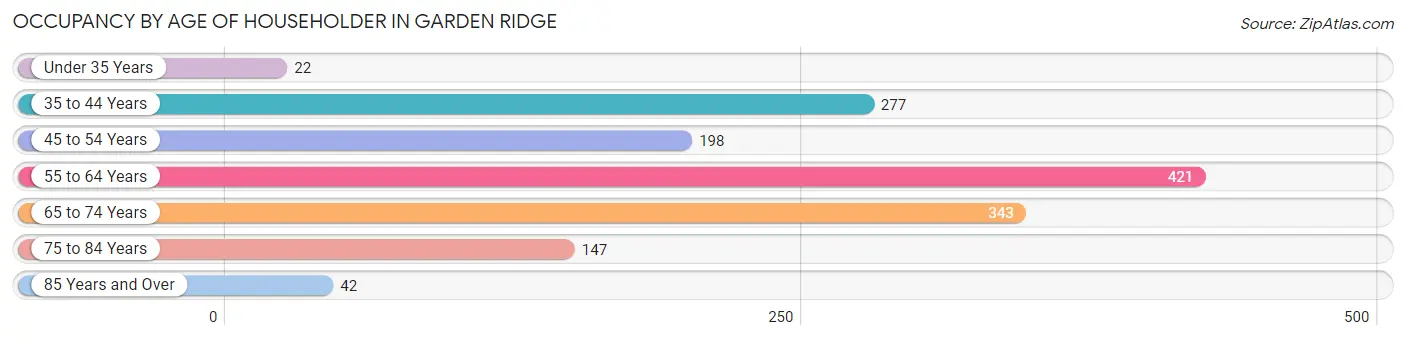
| Age Bracket | # Households | % Households |
| Under 35 Years | 22 | 1.5% |
| 35 to 44 Years | 277 | 19.1% |
| 45 to 54 Years | 198 | 13.7% |
| 55 to 64 Years | 421 | 29.0% |
| 65 to 74 Years | 343 | 23.7% |
| 75 to 84 Years | 147 | 10.1% |
| 85 Years and Over | 42 | 2.9% |
| Total | 1,450 | 100.0% |
Housing Finances in Garden Ridge
Median Income by Occupancy in Garden Ridge
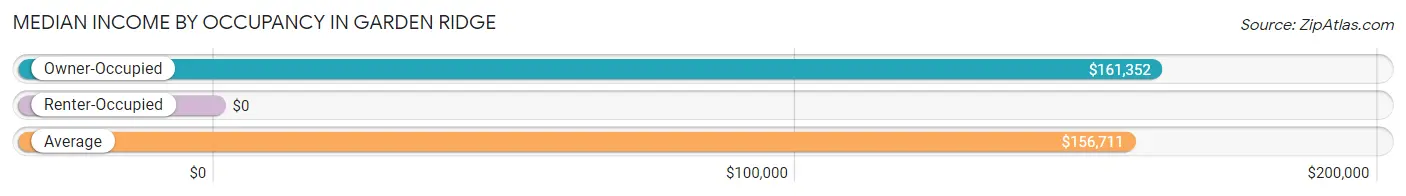
| Occupancy Type | # Households | Median Income |
| Owner-Occupied | 1,385 (95.5%) | $161,352 |
| Renter-Occupied | 65 (4.5%) | $0 |
| Average | 1,450 (100.0%) | $156,711 |
Occupancy by Householder Income Bracket in Garden Ridge
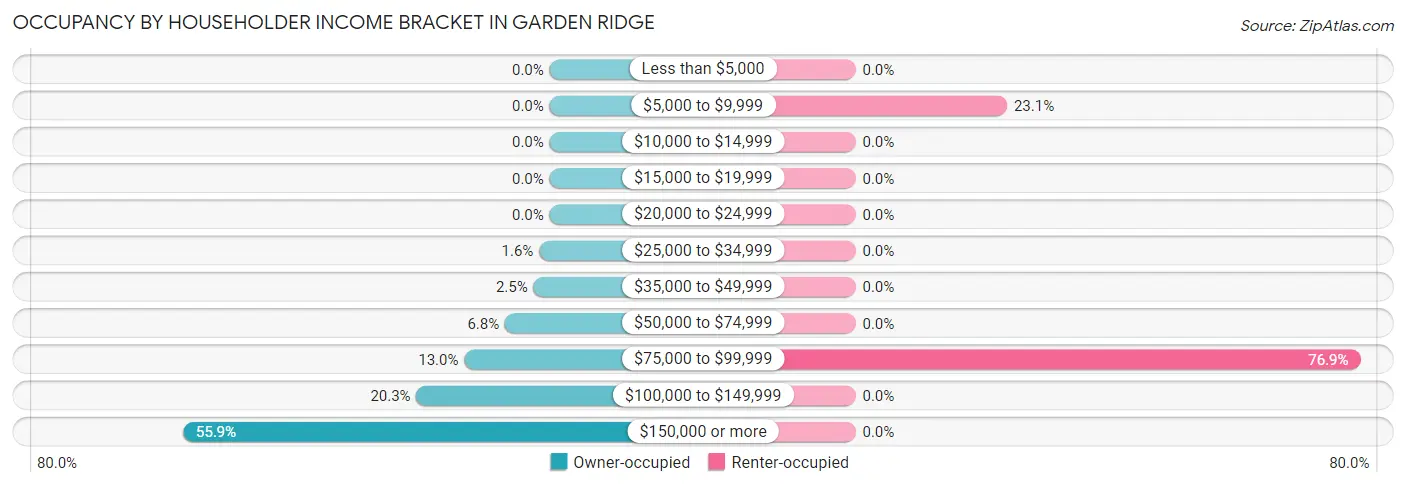
| Income Bracket | Owner-occupied | Renter-occupied |
| Less than $5,000 | 0 (0.0%) | 0 (0.0%) |
| $5,000 to $9,999 | 0 (0.0%) | 15 (23.1%) |
| $10,000 to $14,999 | 0 (0.0%) | 0 (0.0%) |
| $15,000 to $19,999 | 0 (0.0%) | 0 (0.0%) |
| $20,000 to $24,999 | 0 (0.0%) | 0 (0.0%) |
| $25,000 to $34,999 | 22 (1.6%) | 0 (0.0%) |
| $35,000 to $49,999 | 34 (2.5%) | 0 (0.0%) |
| $50,000 to $74,999 | 94 (6.8%) | 0 (0.0%) |
| $75,000 to $99,999 | 180 (13.0%) | 50 (76.9%) |
| $100,000 to $149,999 | 281 (20.3%) | 0 (0.0%) |
| $150,000 or more | 774 (55.9%) | 0 (0.0%) |
| Total | 1,385 (100.0%) | 65 (100.0%) |
Monthly Housing Cost Tiers in Garden Ridge
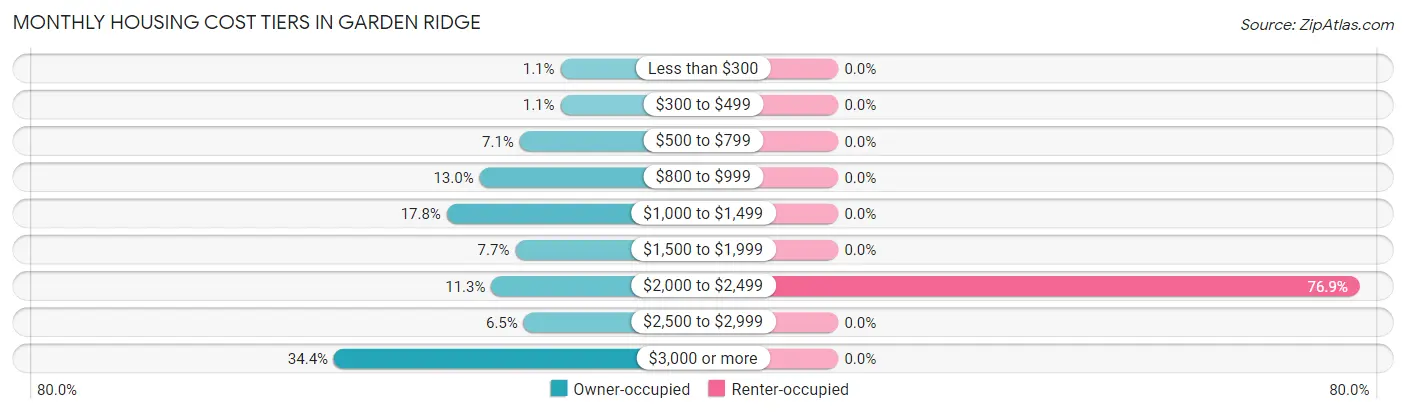
| Monthly Cost | Owner-occupied | Renter-occupied |
| Less than $300 | 15 (1.1%) | 0 (0.0%) |
| $300 to $499 | 15 (1.1%) | 0 (0.0%) |
| $500 to $799 | 98 (7.1%) | 0 (0.0%) |
| $800 to $999 | 180 (13.0%) | 0 (0.0%) |
| $1,000 to $1,499 | 247 (17.8%) | 0 (0.0%) |
| $1,500 to $1,999 | 107 (7.7%) | 0 (0.0%) |
| $2,000 to $2,499 | 156 (11.3%) | 50 (76.9%) |
| $2,500 to $2,999 | 90 (6.5%) | 0 (0.0%) |
| $3,000 or more | 477 (34.4%) | 0 (0.0%) |
| Total | 1,385 (100.0%) | 65 (100.0%) |
Physical Housing Characteristics in Garden Ridge
Housing Structures in Garden Ridge
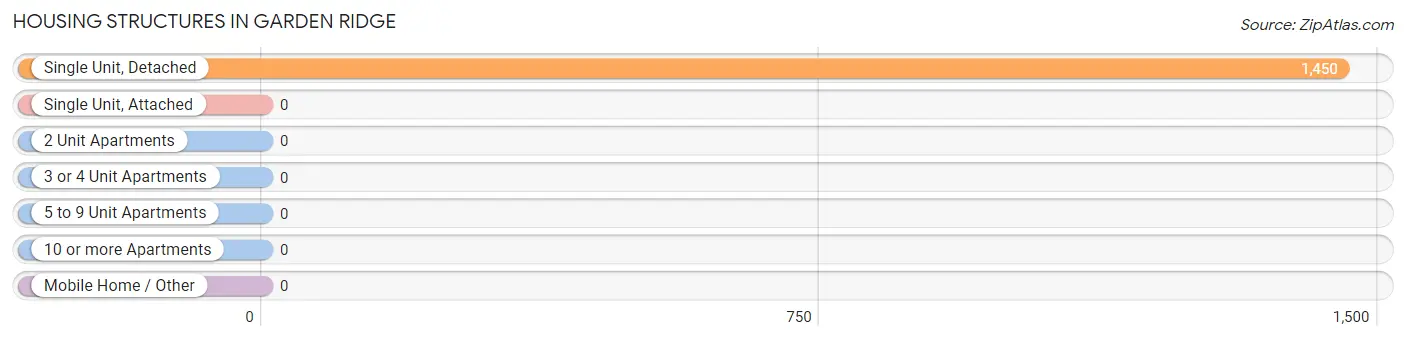
| Structure Type | # Housing Units | % Housing Units |
| Single Unit, Detached | 1,450 | 100.0% |
| Single Unit, Attached | 0 | 0.0% |
| 2 Unit Apartments | 0 | 0.0% |
| 3 or 4 Unit Apartments | 0 | 0.0% |
| 5 to 9 Unit Apartments | 0 | 0.0% |
| 10 or more Apartments | 0 | 0.0% |
| Mobile Home / Other | 0 | 0.0% |
| Total | 1,450 | 100.0% |
Housing Structures by Occupancy in Garden Ridge
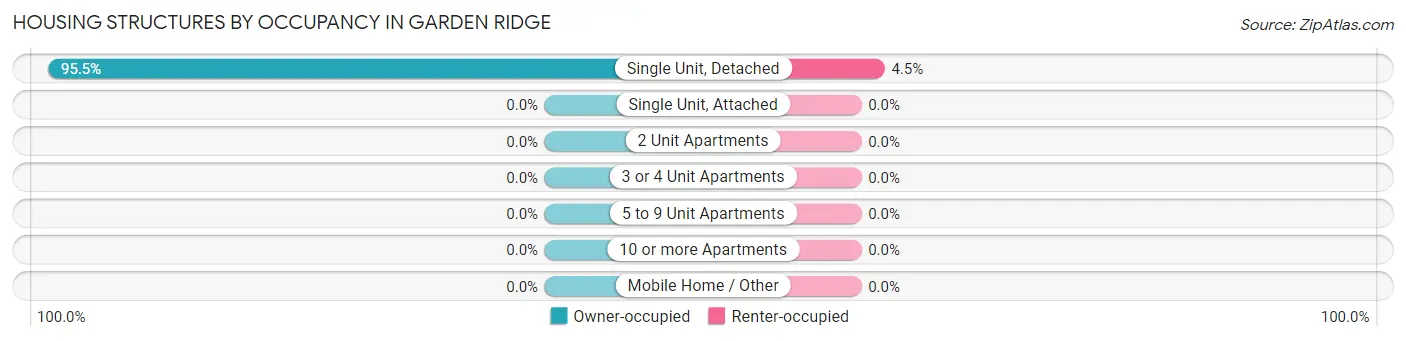
| Structure Type | Owner-occupied | Renter-occupied |
| Single Unit, Detached | 1,385 (95.5%) | 65 (4.5%) |
| Single Unit, Attached | 0 (0.0%) | 0 (0.0%) |
| 2 Unit Apartments | 0 (0.0%) | 0 (0.0%) |
| 3 or 4 Unit Apartments | 0 (0.0%) | 0 (0.0%) |
| 5 to 9 Unit Apartments | 0 (0.0%) | 0 (0.0%) |
| 10 or more Apartments | 0 (0.0%) | 0 (0.0%) |
| Mobile Home / Other | 0 (0.0%) | 0 (0.0%) |
| Total | 1,385 (95.5%) | 65 (4.5%) |
Housing Structures by Number of Rooms in Garden Ridge
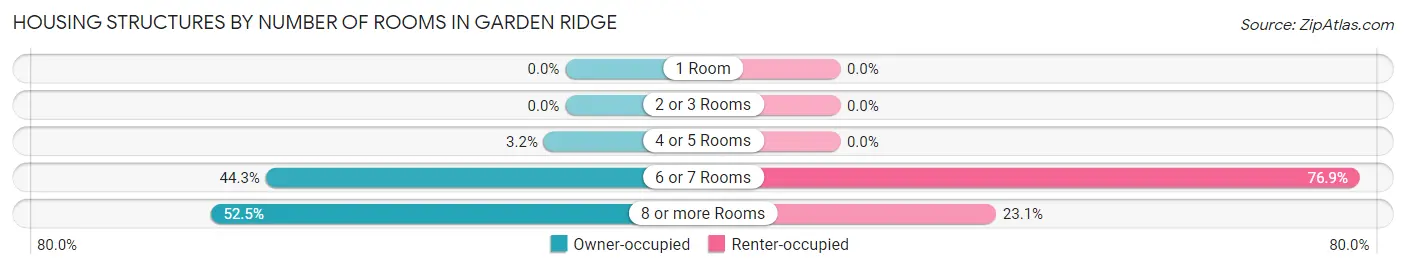
| Number of Rooms | Owner-occupied | Renter-occupied |
| 1 Room | 0 (0.0%) | 0 (0.0%) |
| 2 or 3 Rooms | 0 (0.0%) | 0 (0.0%) |
| 4 or 5 Rooms | 44 (3.2%) | 0 (0.0%) |
| 6 or 7 Rooms | 614 (44.3%) | 50 (76.9%) |
| 8 or more Rooms | 727 (52.5%) | 15 (23.1%) |
| Total | 1,385 (100.0%) | 65 (100.0%) |
Housing Structure by Heating Type in Garden Ridge
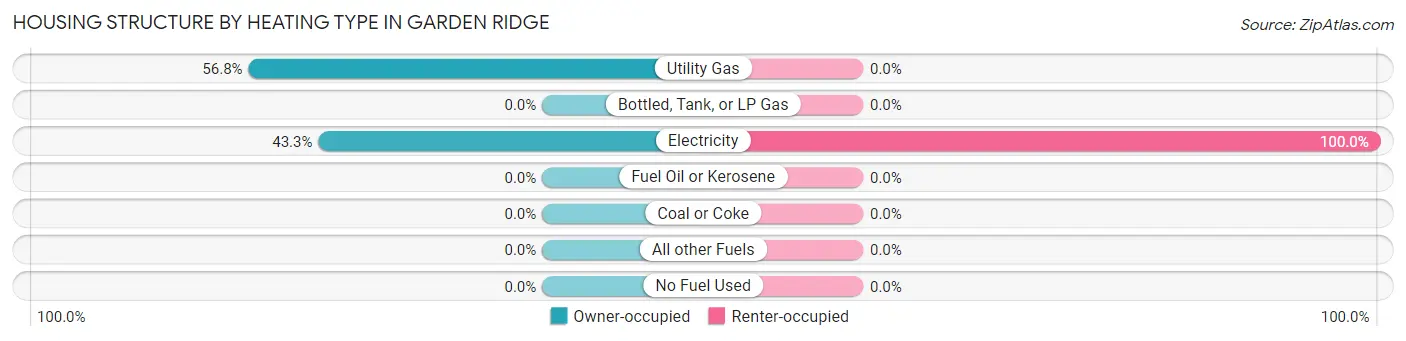
| Heating Type | Owner-occupied | Renter-occupied |
| Utility Gas | 786 (56.8%) | 0 (0.0%) |
| Bottled, Tank, or LP Gas | 0 (0.0%) | 0 (0.0%) |
| Electricity | 599 (43.2%) | 65 (100.0%) |
| Fuel Oil or Kerosene | 0 (0.0%) | 0 (0.0%) |
| Coal or Coke | 0 (0.0%) | 0 (0.0%) |
| All other Fuels | 0 (0.0%) | 0 (0.0%) |
| No Fuel Used | 0 (0.0%) | 0 (0.0%) |
| Total | 1,385 (100.0%) | 65 (100.0%) |
Household Vehicle Usage in Garden Ridge
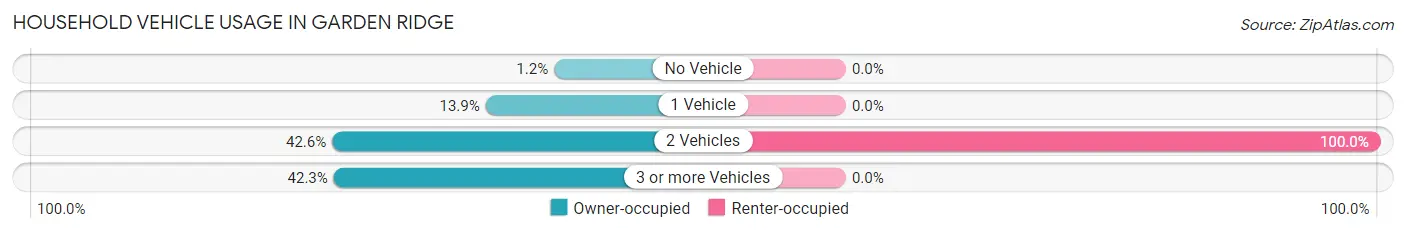
| Vehicles per Household | Owner-occupied | Renter-occupied |
| No Vehicle | 16 (1.2%) | 0 (0.0%) |
| 1 Vehicle | 193 (13.9%) | 0 (0.0%) |
| 2 Vehicles | 590 (42.6%) | 65 (100.0%) |
| 3 or more Vehicles | 586 (42.3%) | 0 (0.0%) |
| Total | 1,385 (100.0%) | 65 (100.0%) |
Real Estate & Mortgages in Garden Ridge
Real Estate and Mortgage Overview in Garden Ridge
| Characteristic | Without Mortgage | With Mortgage |
| Housing Units | 554 | 831 |
| Median Property Value | $469,100 | $614,700 |
| Median Household Income | $127,449 | $559 |
| Monthly Housing Costs | $1,027 | $477 |
| Real Estate Taxes | $6,550 | $35 |
Property Value by Mortgage Status in Garden Ridge
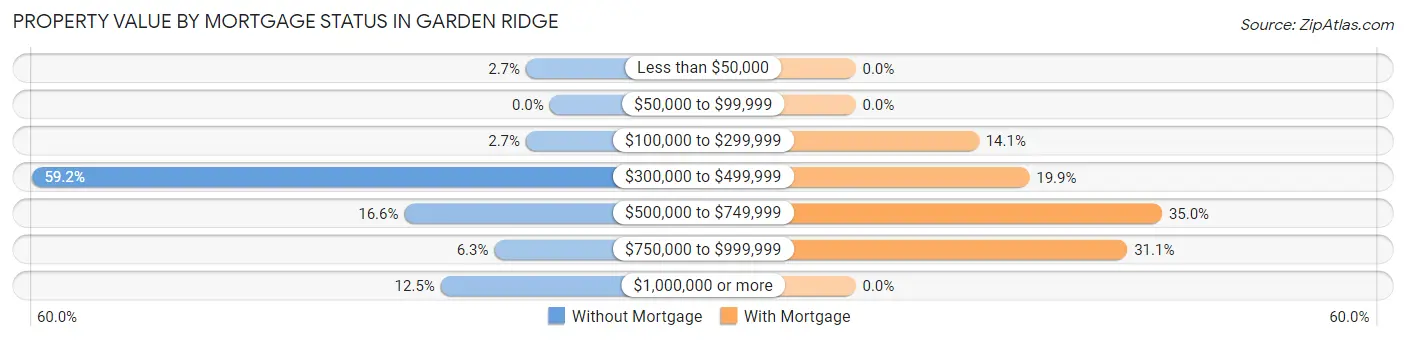
| Property Value | Without Mortgage | With Mortgage |
| Less than $50,000 | 15 (2.7%) | 0 (0.0%) |
| $50,000 to $99,999 | 0 (0.0%) | 0 (0.0%) |
| $100,000 to $299,999 | 15 (2.7%) | 117 (14.1%) |
| $300,000 to $499,999 | 328 (59.2%) | 165 (19.9%) |
| $500,000 to $749,999 | 92 (16.6%) | 291 (35.0%) |
| $750,000 to $999,999 | 35 (6.3%) | 258 (31.0%) |
| $1,000,000 or more | 69 (12.4%) | 0 (0.0%) |
| Total | 554 (100.0%) | 831 (100.0%) |
Household Income by Mortgage Status in Garden Ridge
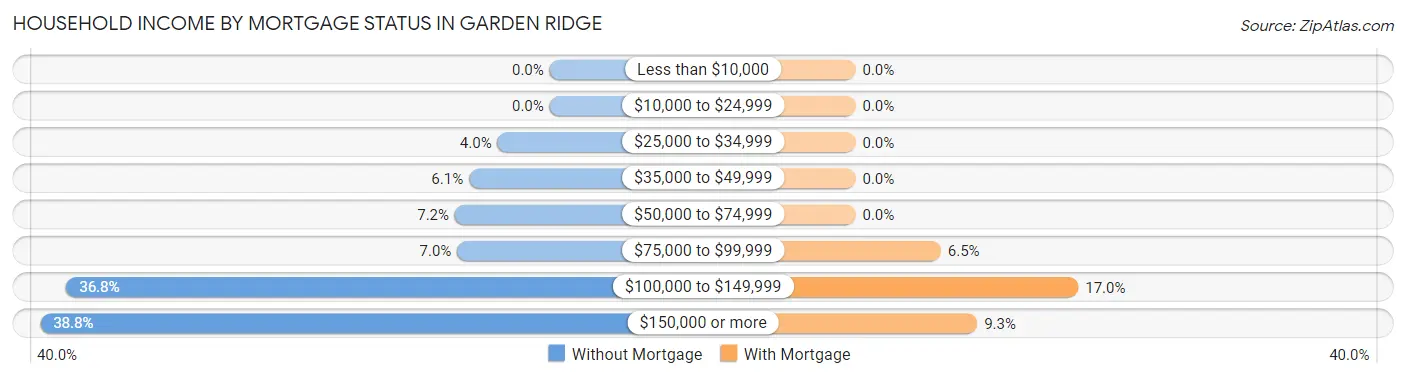
| Household Income | Without Mortgage | With Mortgage |
| Less than $10,000 | 0 (0.0%) | 0 (0.0%) |
| $10,000 to $24,999 | 0 (0.0%) | 0 (0.0%) |
| $25,000 to $34,999 | 22 (4.0%) | 0 (0.0%) |
| $35,000 to $49,999 | 34 (6.1%) | 0 (0.0%) |
| $50,000 to $74,999 | 40 (7.2%) | 0 (0.0%) |
| $75,000 to $99,999 | 39 (7.0%) | 54 (6.5%) |
| $100,000 to $149,999 | 204 (36.8%) | 141 (17.0%) |
| $150,000 or more | 215 (38.8%) | 77 (9.3%) |
| Total | 554 (100.0%) | 831 (100.0%) |
Property Value to Household Income Ratio in Garden Ridge
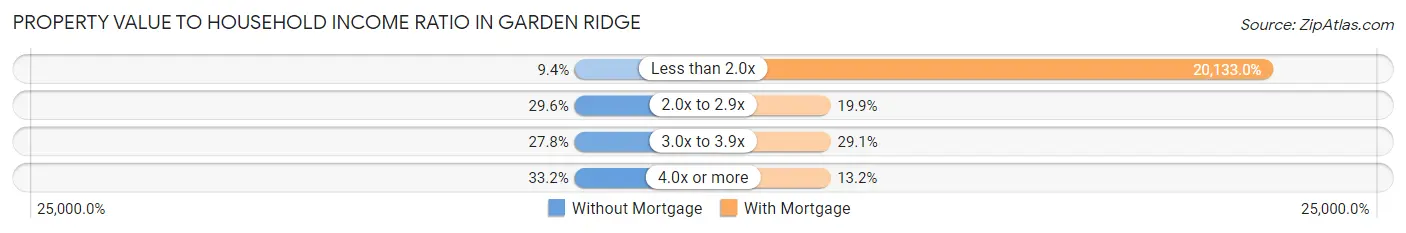
| Value-to-Income Ratio | Without Mortgage | With Mortgage |
| Less than 2.0x | 52 (9.4%) | 167,305 (20,133.0%) |
| 2.0x to 2.9x | 164 (29.6%) | 165 (19.9%) |
| 3.0x to 3.9x | 154 (27.8%) | 242 (29.1%) |
| 4.0x or more | 184 (33.2%) | 110 (13.2%) |
| Total | 554 (100.0%) | 831 (100.0%) |
Real Estate Taxes by Mortgage Status in Garden Ridge
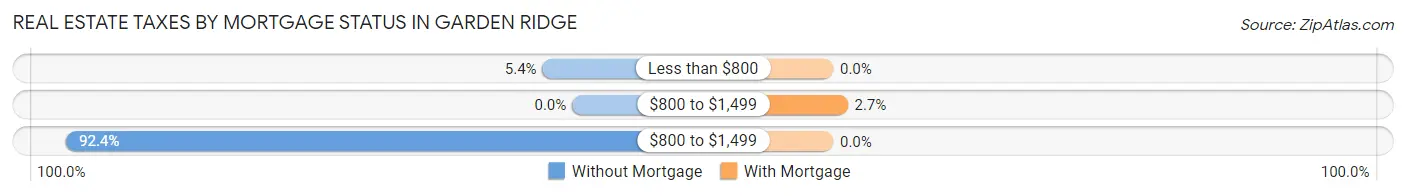
| Property Taxes | Without Mortgage | With Mortgage |
| Less than $800 | 30 (5.4%) | 0 (0.0%) |
| $800 to $1,499 | 0 (0.0%) | 22 (2.6%) |
| $800 to $1,499 | 512 (92.4%) | 0 (0.0%) |
| Total | 554 (100.0%) | 831 (100.0%) |
Health & Disability in Garden Ridge
Health Insurance Coverage by Age in Garden Ridge
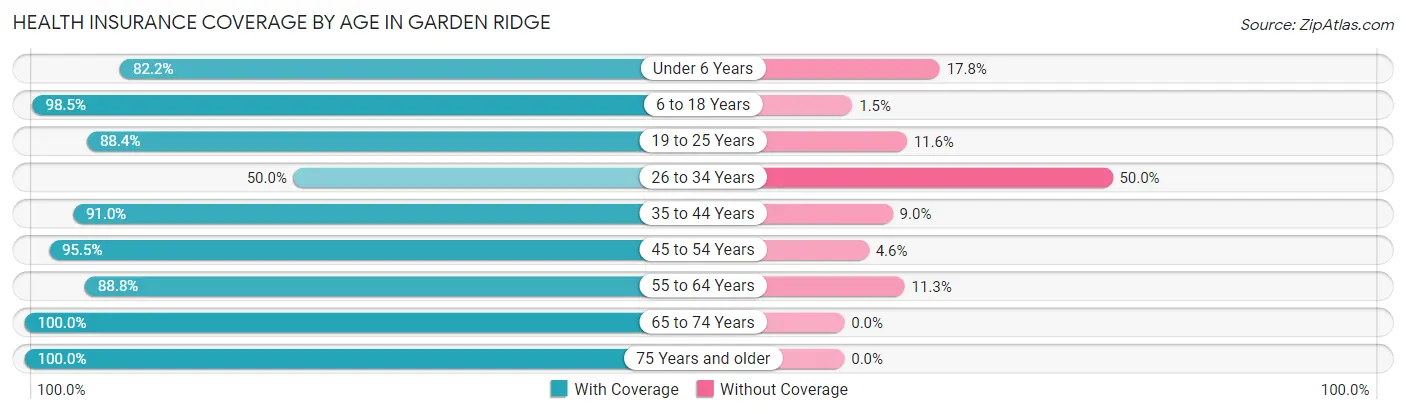
| Age Bracket | With Coverage | Without Coverage |
| Under 6 Years | 208 (82.2%) | 45 (17.8%) |
| 6 to 18 Years | 595 (98.5%) | 9 (1.5%) |
| 19 to 25 Years | 281 (88.4%) | 37 (11.6%) |
| 26 to 34 Years | 57 (50.0%) | 57 (50.0%) |
| 35 to 44 Years | 585 (91.0%) | 58 (9.0%) |
| 45 to 54 Years | 378 (95.5%) | 18 (4.5%) |
| 55 to 64 Years | 781 (88.7%) | 99 (11.3%) |
| 65 to 74 Years | 596 (100.0%) | 0 (0.0%) |
| 75 Years and older | 342 (100.0%) | 0 (0.0%) |
| Total | 3,823 (92.2%) | 323 (7.8%) |
Health Insurance Coverage by Citizenship Status in Garden Ridge
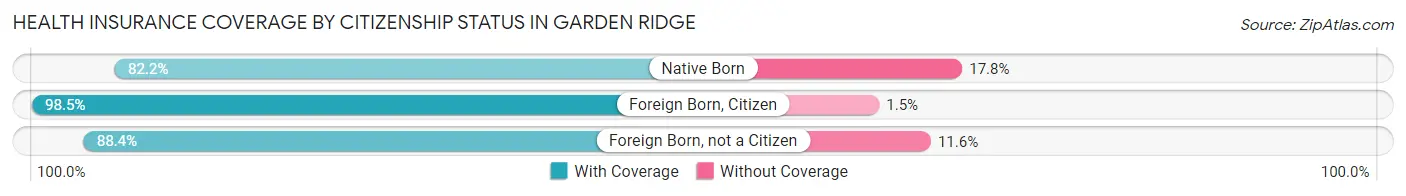
| Citizenship Status | With Coverage | Without Coverage |
| Native Born | 208 (82.2%) | 45 (17.8%) |
| Foreign Born, Citizen | 595 (98.5%) | 9 (1.5%) |
| Foreign Born, not a Citizen | 281 (88.4%) | 37 (11.6%) |
Health Insurance Coverage by Household Income in Garden Ridge
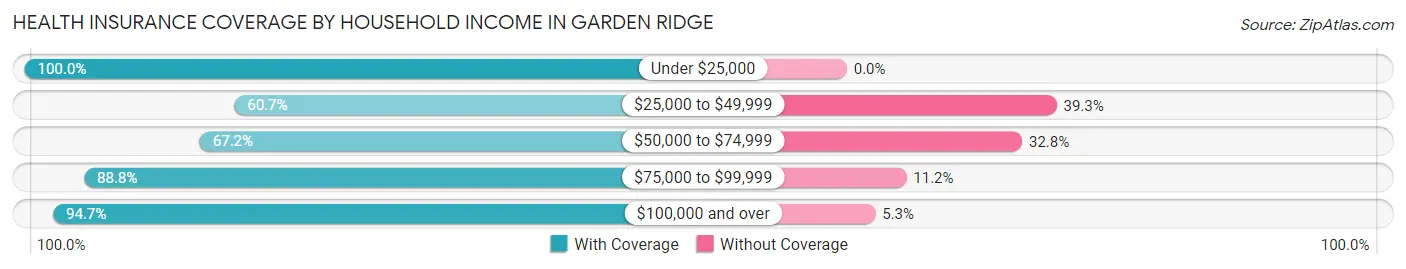
| Household Income | With Coverage | Without Coverage |
| Under $25,000 | 15 (100.0%) | 0 (0.0%) |
| $25,000 to $49,999 | 34 (60.7%) | 22 (39.3%) |
| $50,000 to $74,999 | 137 (67.2%) | 67 (32.8%) |
| $75,000 to $99,999 | 406 (88.8%) | 51 (11.2%) |
| $100,000 and over | 3,228 (94.7%) | 182 (5.3%) |
Public vs Private Health Insurance Coverage by Age in Garden Ridge
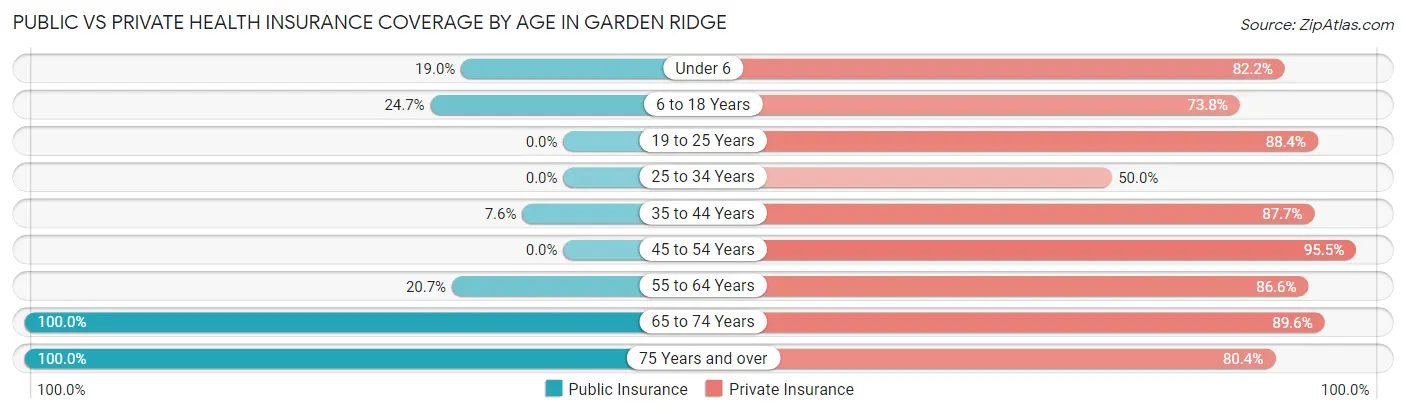
| Age Bracket | Public Insurance | Private Insurance |
| Under 6 | 48 (19.0%) | 208 (82.2%) |
| 6 to 18 Years | 149 (24.7%) | 446 (73.8%) |
| 19 to 25 Years | 0 (0.0%) | 281 (88.4%) |
| 25 to 34 Years | 0 (0.0%) | 57 (50.0%) |
| 35 to 44 Years | 49 (7.6%) | 564 (87.7%) |
| 45 to 54 Years | 0 (0.0%) | 378 (95.5%) |
| 55 to 64 Years | 182 (20.7%) | 762 (86.6%) |
| 65 to 74 Years | 596 (100.0%) | 534 (89.6%) |
| 75 Years and over | 342 (100.0%) | 275 (80.4%) |
| Total | 1,366 (33.0%) | 3,505 (84.5%) |
Disability Status by Sex by Age in Garden Ridge
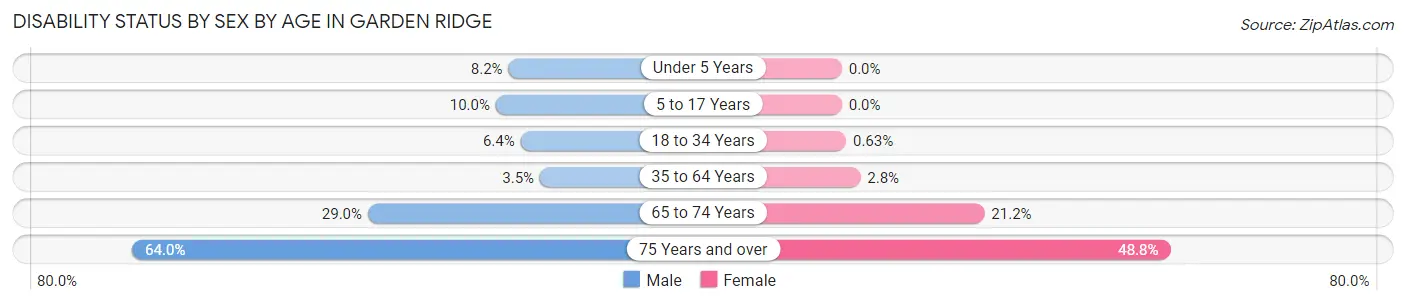
| Age Bracket | Male | Female |
| Under 5 Years | 15 (8.2%) | 0 (0.0%) |
| 5 to 17 Years | 33 (10.0%) | 0 (0.0%) |
| 18 to 34 Years | 19 (6.4%) | 1 (0.6%) |
| 35 to 64 Years | 34 (3.5%) | 26 (2.8%) |
| 65 to 74 Years | 99 (29.0%) | 54 (21.2%) |
| 75 Years and over | 114 (64.0%) | 80 (48.8%) |
Disability Class by Sex by Age in Garden Ridge
Disability Class: Hearing Difficulty
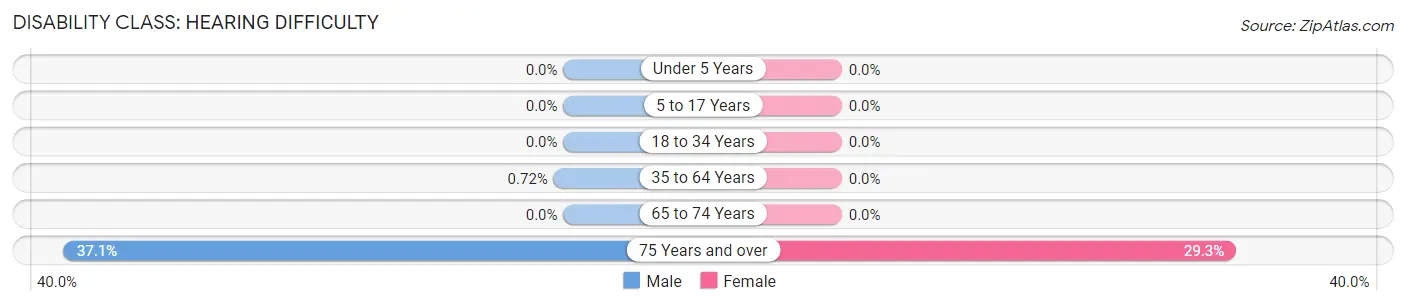
| Age Bracket | Male | Female |
| Under 5 Years | 0 (0.0%) | 0 (0.0%) |
| 5 to 17 Years | 0 (0.0%) | 0 (0.0%) |
| 18 to 34 Years | 0 (0.0%) | 0 (0.0%) |
| 35 to 64 Years | 7 (0.7%) | 0 (0.0%) |
| 65 to 74 Years | 0 (0.0%) | 0 (0.0%) |
| 75 Years and over | 66 (37.1%) | 48 (29.3%) |
Disability Class: Vision Difficulty
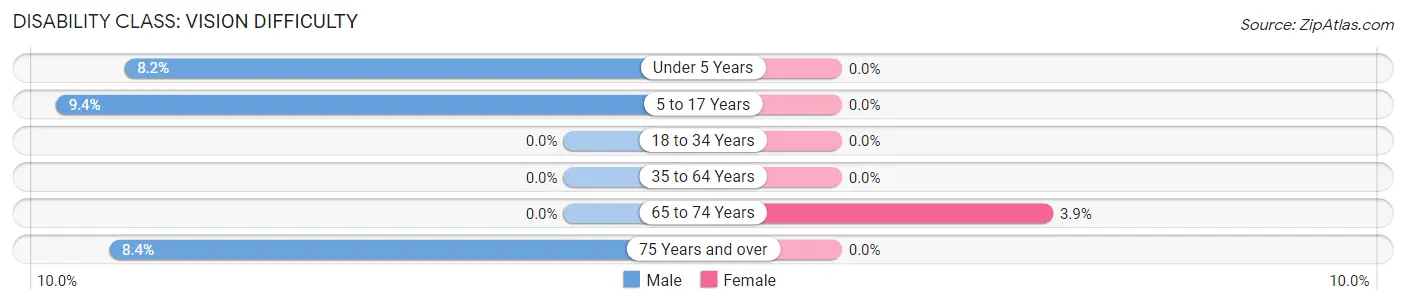
| Age Bracket | Male | Female |
| Under 5 Years | 15 (8.2%) | 0 (0.0%) |
| 5 to 17 Years | 31 (9.4%) | 0 (0.0%) |
| 18 to 34 Years | 0 (0.0%) | 0 (0.0%) |
| 35 to 64 Years | 0 (0.0%) | 0 (0.0%) |
| 65 to 74 Years | 0 (0.0%) | 10 (3.9%) |
| 75 Years and over | 15 (8.4%) | 0 (0.0%) |
Disability Class: Cognitive Difficulty
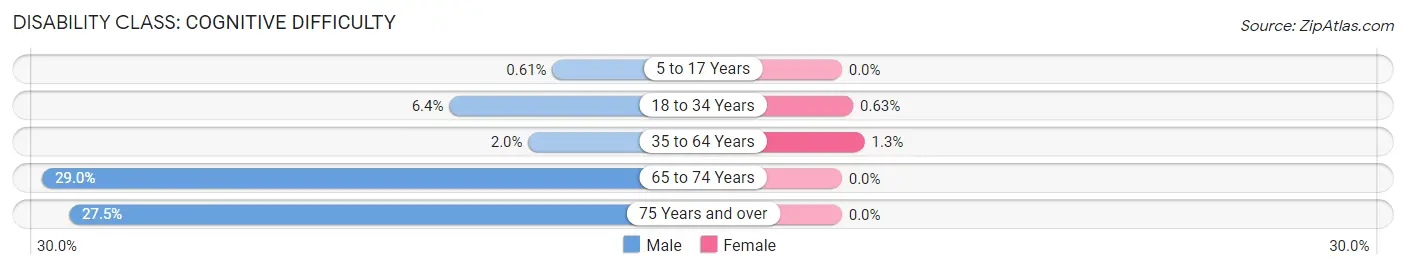
| Age Bracket | Male | Female |
| 5 to 17 Years | 2 (0.6%) | 0 (0.0%) |
| 18 to 34 Years | 19 (6.4%) | 1 (0.6%) |
| 35 to 64 Years | 19 (1.9%) | 12 (1.3%) |
| 65 to 74 Years | 99 (29.0%) | 0 (0.0%) |
| 75 Years and over | 49 (27.5%) | 0 (0.0%) |
Disability Class: Ambulatory Difficulty
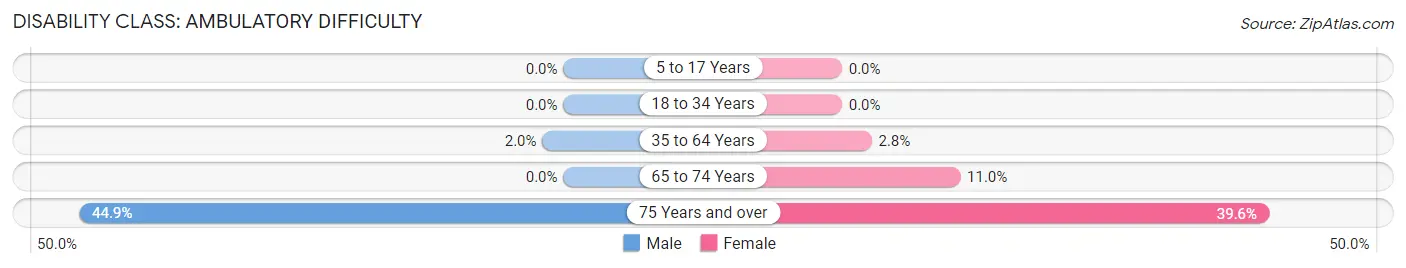
| Age Bracket | Male | Female |
| 5 to 17 Years | 0 (0.0%) | 0 (0.0%) |
| 18 to 34 Years | 0 (0.0%) | 0 (0.0%) |
| 35 to 64 Years | 19 (1.9%) | 26 (2.8%) |
| 65 to 74 Years | 0 (0.0%) | 28 (11.0%) |
| 75 Years and over | 80 (44.9%) | 65 (39.6%) |
Disability Class: Self-Care Difficulty
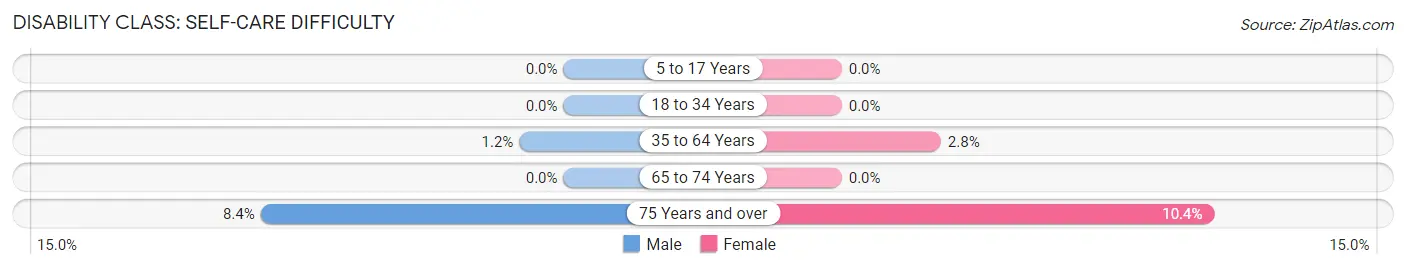
| Age Bracket | Male | Female |
| 5 to 17 Years | 0 (0.0%) | 0 (0.0%) |
| 18 to 34 Years | 0 (0.0%) | 0 (0.0%) |
| 35 to 64 Years | 12 (1.2%) | 26 (2.8%) |
| 65 to 74 Years | 0 (0.0%) | 0 (0.0%) |
| 75 Years and over | 15 (8.4%) | 17 (10.4%) |
Technology Access in Garden Ridge
Computing Device Access in Garden Ridge
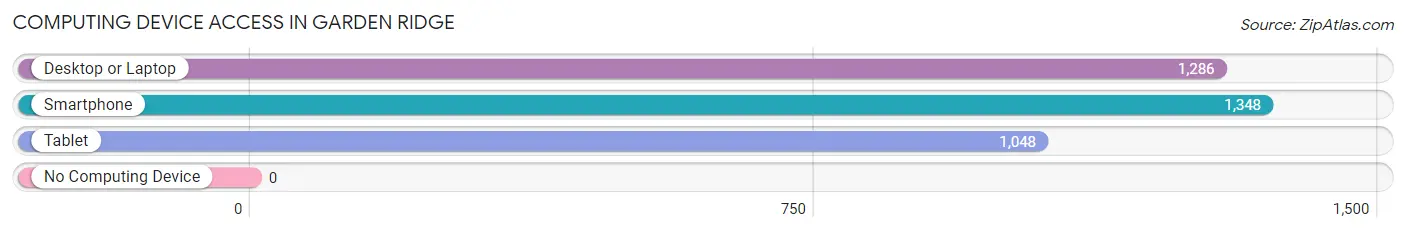
| Device Type | # Households | % Households |
| Desktop or Laptop | 1,286 | 88.7% |
| Smartphone | 1,348 | 93.0% |
| Tablet | 1,048 | 72.3% |
| No Computing Device | 0 | 0.0% |
| Total | 1,450 | 100.0% |
Internet Access in Garden Ridge
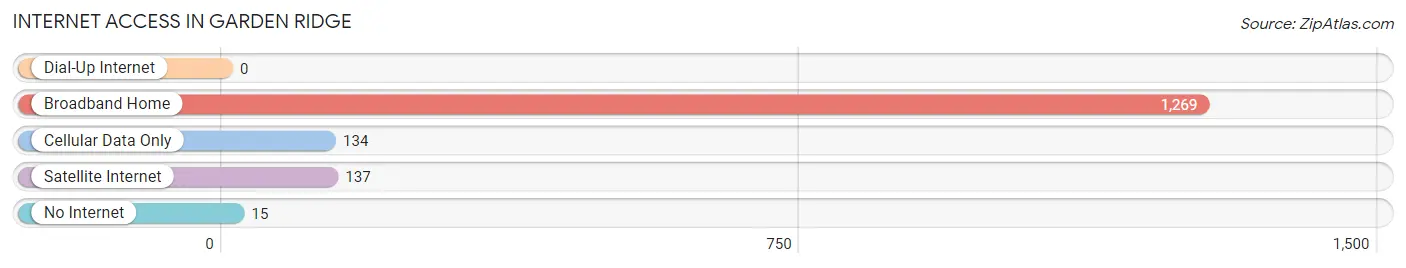
| Internet Type | # Households | % Households |
| Dial-Up Internet | 0 | 0.0% |
| Broadband Home | 1,269 | 87.5% |
| Cellular Data Only | 134 | 9.2% |
| Satellite Internet | 137 | 9.5% |
| No Internet | 15 | 1.0% |
| Total | 1,450 | 100.0% |
Garden Ridge Summary
Garden Ridge is a small city located in Comal County, Texas, United States. It is situated about 25 miles northeast of San Antonio and is part of the San Antonio Metropolitan Statistical Area. The city was incorporated in 1978 and has a population of approximately 5,000 people.
History
Garden Ridge was originally settled in the late 1800s by German immigrants who were attracted to the area by its fertile soil and abundant water supply. The city was originally known as “Garden Valley” and was later changed to “Garden Ridge” in the early 1900s. The city was officially incorporated in 1978 and has since grown to become a popular residential community.
Geography
Garden Ridge is located in Comal County, Texas, approximately 25 miles northeast of San Antonio. The city is situated on the Balcones Escarpment, a geological formation that runs through Central Texas. The city is surrounded by rolling hills and is home to several creeks and rivers, including the Guadalupe River. The city has a total area of 4.2 square miles, all of which is land.
Economy
Garden Ridge is primarily a residential community, but it does have a few businesses. The city is home to several retail stores, restaurants, and other small businesses. The city is also home to a number of manufacturing and industrial businesses, including a concrete plant and a metal fabrication plant.
Demographics
As of the 2010 census, Garden Ridge had a population of 5,000 people. The racial makeup of the city was 94.3% White, 0.7% African American, 0.3% Native American, 0.7% Asian, 0.1% Pacific Islander, 2.2% from other races, and 1.9% from two or more races. Hispanic or Latino of any race were 6.2% of the population.
The median income for a household in Garden Ridge was $76,250, and the median income for a family was $86,250. The per capita income for the city was $31,945. About 4.2% of families and 5.2% of the population were below the poverty line, including 6.2% of those under age 18 and 4.2% of those age 65 or over.
Conclusion
Garden Ridge is a small city located in Comal County, Texas, United States. It is situated about 25 miles northeast of San Antonio and is part of the San Antonio Metropolitan Statistical Area. The city was originally settled in the late 1800s by German immigrants and was officially incorporated in 1978. Garden Ridge is primarily a residential community, but it does have a few businesses. The city has a population of approximately 5,000 people and has a median household income of $76,250.
Common Questions
What is Per Capita Income in Garden Ridge?
Per Capita income in Garden Ridge is $61,427.
What is the Median Family Income in Garden Ridge?
Median Family Income in Garden Ridge is $163,879.
What is the Median Household income in Garden Ridge?
Median Household Income in Garden Ridge is $156,711.
What is Income or Wage Gap in Garden Ridge?
Income or Wage Gap in Garden Ridge is 19.8%.
Women in Garden Ridge earn 80.2 cents for every dollar earned by a man.
What is Inequality or Gini Index in Garden Ridge?
Inequality or Gini Index in Garden Ridge is 0.31.
What is the Total Population of Garden Ridge?
Total Population of Garden Ridge is 4,155.
What is the Total Male Population of Garden Ridge?
Total Male Population of Garden Ridge is 2,311.
What is the Total Female Population of Garden Ridge?
Total Female Population of Garden Ridge is 1,844.
What is the Ratio of Males per 100 Females in Garden Ridge?
There are 125.33 Males per 100 Females in Garden Ridge.
What is the Ratio of Females per 100 Males in Garden Ridge?
There are 79.79 Females per 100 Males in Garden Ridge.
What is the Median Population Age in Garden Ridge?
Median Population Age in Garden Ridge is 50.4 Years.
What is the Average Family Size in Garden Ridge
Average Family Size in Garden Ridge is 3.1 People.
What is the Average Household Size in Garden Ridge
Average Household Size in Garden Ridge is 2.9 People.
How Large is the Labor Force in Garden Ridge?
There are 2,061 People in the Labor Forcein in Garden Ridge.
What is the Percentage of People in the Labor Force in Garden Ridge?
59.3% of People are in the Labor Force in Garden Ridge.
What is the Unemployment Rate in Garden Ridge?
Unemployment Rate in Garden Ridge is 2.6%.