Highland Village, TX Map & Demographics
Highland Village Map
Highland Village Overview
$64,032
PER CAPITA INCOME
$177,478
AVG FAMILY INCOME
$162,879
AVG HOUSEHOLD INCOME
42.3%
WAGE / INCOME GAP [ % ]
57.7¢/ $1
WAGE / INCOME GAP [ $ ]
0.36
INEQUALITY / GINI INDEX
15,883
TOTAL POPULATION
8,330
MALE POPULATION
7,553
FEMALE POPULATION
110.29
MALES / 100 FEMALES
90.67
FEMALES / 100 MALES
42.9
MEDIAN AGE
3.3
AVG FAMILY SIZE
3.0
AVG HOUSEHOLD SIZE
8,553
LABOR FORCE [ PEOPLE ]
67.1%
PERCENT IN LABOR FORCE
3.0%
UNEMPLOYMENT RATE
Income in Highland Village
Income Overview in Highland Village
Per Capita Income in Highland Village is $64,032, while median incomes of families and households are $177,478 and $162,879 respectively.
| Characteristic | Number | Measure |
| Per Capita Income | 15,883 | $64,032 |
| Median Family Income | 4,471 | $177,478 |
| Mean Family Income | 4,471 | $204,065 |
| Median Household Income | 5,316 | $162,879 |
| Mean Household Income | 5,316 | $186,322 |
| Income Deficit | 4,471 | $0 |
| Wage / Income Gap (%) | 15,883 | 42.27% |
| Wage / Income Gap ($) | 15,883 | 57.73¢ per $1 |
| Gini / Inequality Index | 15,883 | 0.36 |
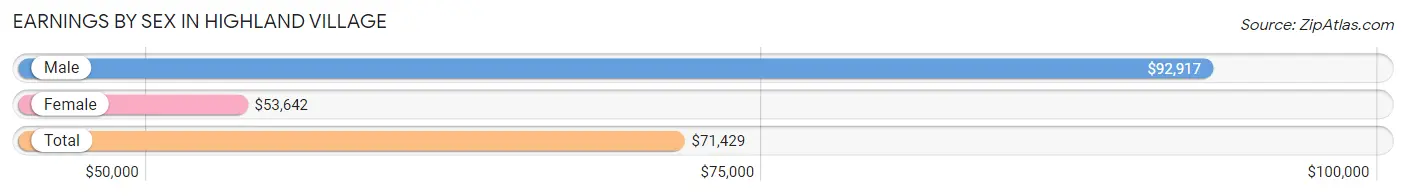
Earnings by Sex in Highland Village
Average Earnings in Highland Village are $71,429, $92,917 for men and $53,642 for women, a difference of 42.3%.
| Sex | Number | Average Earnings |
| Male | 5,152 (56.5%) | $92,917 |
| Female | 3,975 (43.5%) | $53,642 |
| Total | 9,127 (100.0%) | $71,429 |
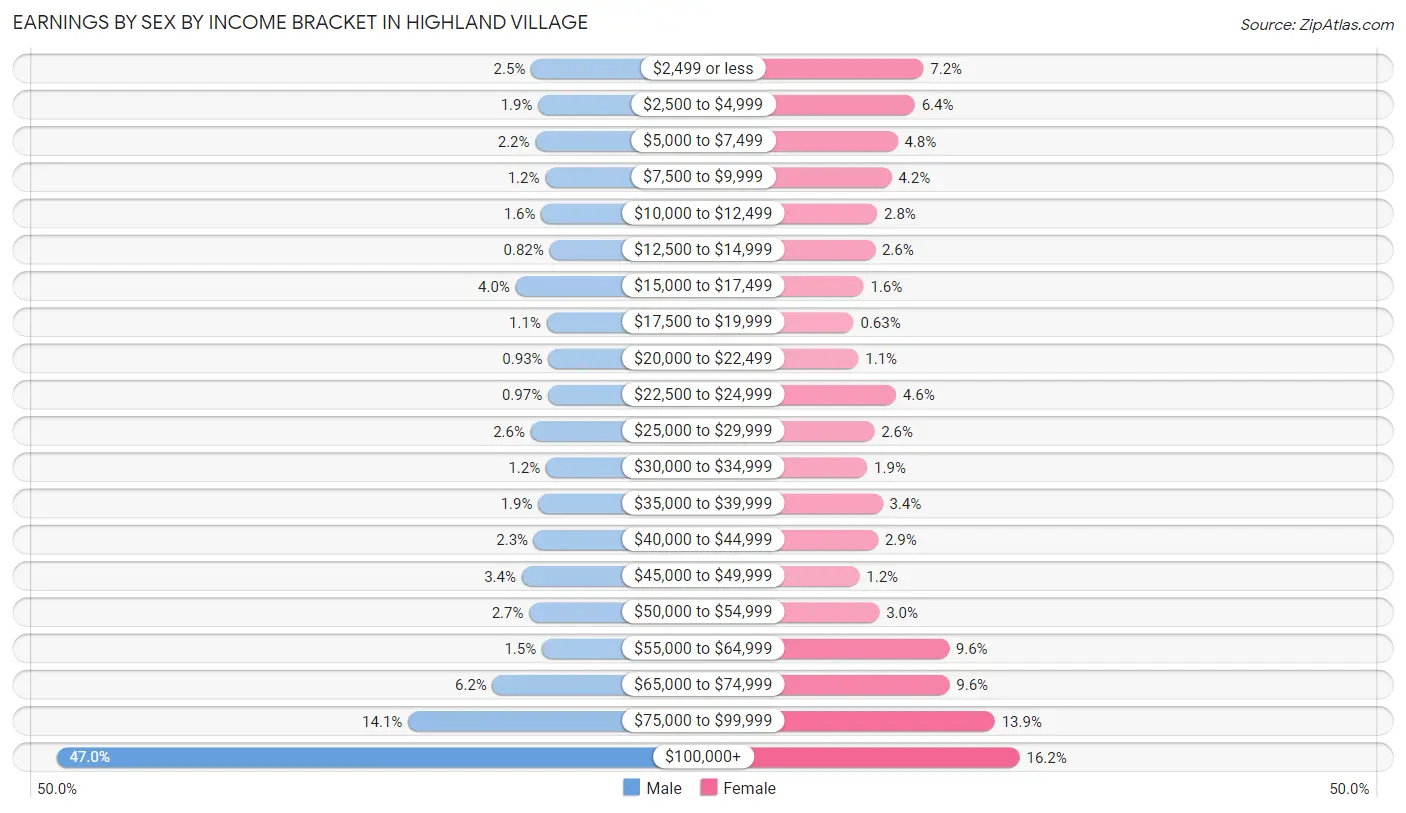
Earnings by Sex by Income Bracket in Highland Village
The most common earnings brackets in Highland Village are $100,000+ for men (2,422 | 47.0%) and $100,000+ for women (643 | 16.2%).
| Income | Male | Female |
| $2,499 or less | 131 (2.5%) | 285 (7.2%) |
| $2,500 to $4,999 | 97 (1.9%) | 253 (6.4%) |
| $5,000 to $7,499 | 111 (2.1%) | 189 (4.8%) |
| $7,500 to $9,999 | 63 (1.2%) | 166 (4.2%) |
| $10,000 to $12,499 | 82 (1.6%) | 113 (2.8%) |
| $12,500 to $14,999 | 42 (0.8%) | 105 (2.6%) |
| $15,000 to $17,499 | 206 (4.0%) | 62 (1.6%) |
| $17,500 to $19,999 | 56 (1.1%) | 25 (0.6%) |
| $20,000 to $22,499 | 48 (0.9%) | 43 (1.1%) |
| $22,500 to $24,999 | 50 (1.0%) | 183 (4.6%) |
| $25,000 to $29,999 | 133 (2.6%) | 102 (2.6%) |
| $30,000 to $34,999 | 59 (1.1%) | 76 (1.9%) |
| $35,000 to $39,999 | 97 (1.9%) | 133 (3.4%) |
| $40,000 to $44,999 | 118 (2.3%) | 116 (2.9%) |
| $45,000 to $49,999 | 176 (3.4%) | 47 (1.2%) |
| $50,000 to $54,999 | 140 (2.7%) | 121 (3.0%) |
| $55,000 to $64,999 | 79 (1.5%) | 380 (9.6%) |
| $65,000 to $74,999 | 317 (6.1%) | 382 (9.6%) |
| $75,000 to $99,999 | 725 (14.1%) | 551 (13.9%) |
| $100,000+ | 2,422 (47.0%) | 643 (16.2%) |
| Total | 5,152 (100.0%) | 3,975 (100.0%) |
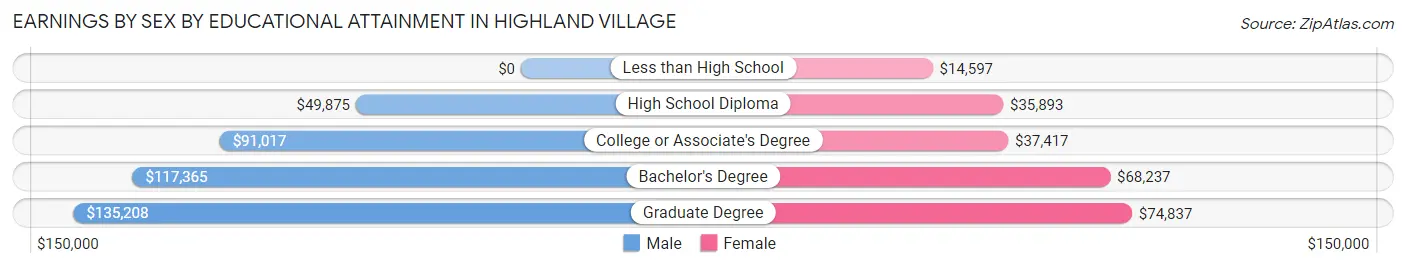
Earnings by Sex by Educational Attainment in Highland Village
Average earnings in Highland Village are $103,633 for men and $62,771 for women, a difference of 39.4%. Men with an educational attainment of graduate degree enjoy the highest average annual earnings of $135,208, while those with high school diploma education earn the least with $49,875. Women with an educational attainment of graduate degree earn the most with the average annual earnings of $74,837, while those with less than high school education have the smallest earnings of $14,597.
| Educational Attainment | Male Income | Female Income |
| Less than High School | - | - |
| High School Diploma | $49,875 | $35,893 |
| College or Associate's Degree | $91,017 | $37,417 |
| Bachelor's Degree | $117,365 | $68,237 |
| Graduate Degree | $135,208 | $74,837 |
| Total | $103,633 | $62,771 |
Family Income in Highland Village
Family Income Brackets in Highland Village
According to the Highland Village family income data, there are 1,721 families falling into the $200,000+ income range, which is the most common income bracket and makes up 38.5% of all families. Conversely, the $10,000 to $14,999 income bracket is the least frequent group with only 4 families (0.1%) belonging to this category.
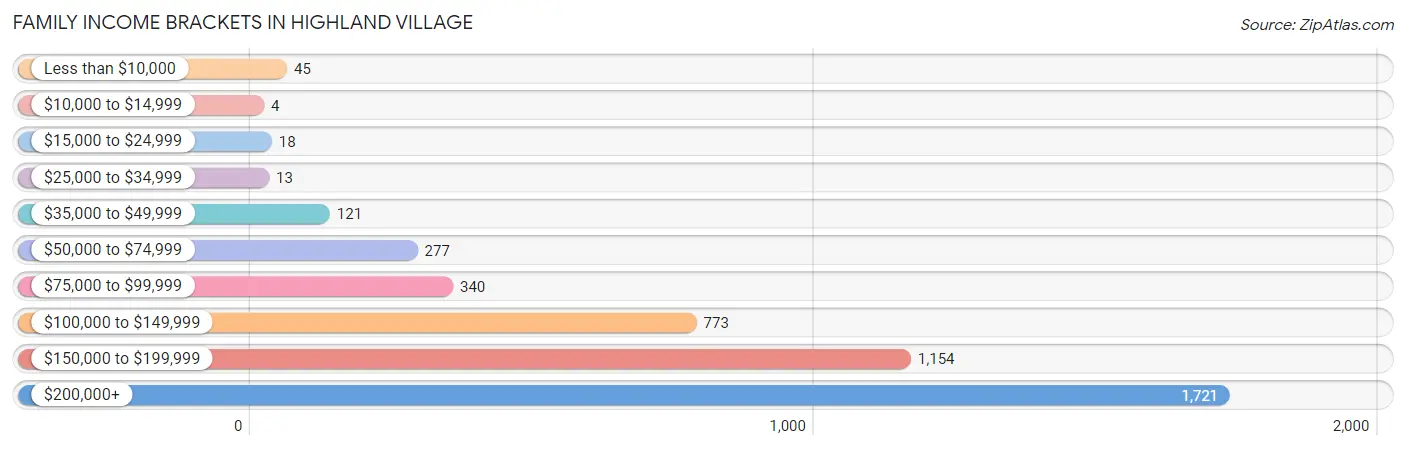
| Income Bracket | # Families | % Families |
| Less than $10,000 | 45 | 1.0% |
| $10,000 to $14,999 | 4 | 0.1% |
| $15,000 to $24,999 | 18 | 0.4% |
| $25,000 to $34,999 | 13 | 0.3% |
| $35,000 to $49,999 | 121 | 2.7% |
| $50,000 to $74,999 | 277 | 6.2% |
| $75,000 to $99,999 | 340 | 7.6% |
| $100,000 to $149,999 | 773 | 17.3% |
| $150,000 to $199,999 | 1,154 | 25.8% |
| $200,000+ | 1,721 | 38.5% |
Family Income by Famaliy Size in Highland Village
7+ person families (24 | 0.5%) account for the highest median family income in Highland Village with $250,001 per family, while 2-person families (1,697 | 38.0%) have the highest median income of $80,671 per family member.
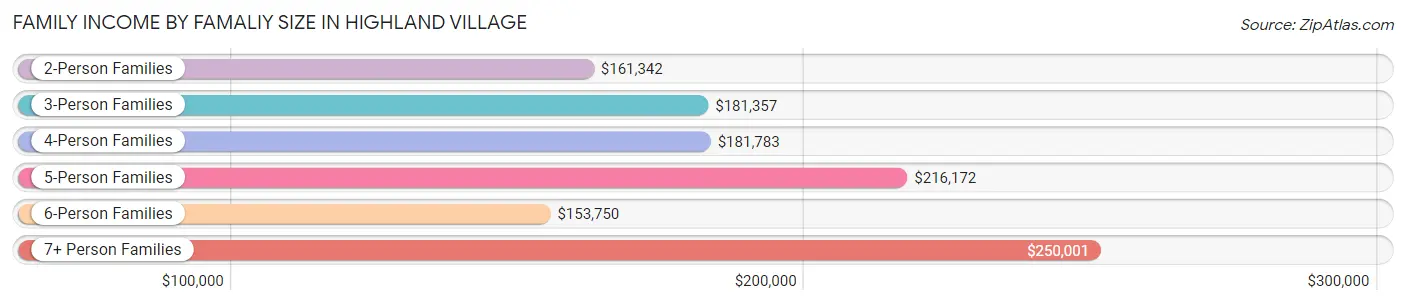
| Income Bracket | # Families | Median Income |
| 2-Person Families | 1,697 (38.0%) | $161,342 |
| 3-Person Families | 958 (21.4%) | $181,357 |
| 4-Person Families | 1,218 (27.2%) | $181,783 |
| 5-Person Families | 455 (10.2%) | $216,172 |
| 6-Person Families | 119 (2.7%) | $153,750 |
| 7+ Person Families | 24 (0.5%) | $250,001 |
| Total | 4,471 (100.0%) | $177,478 |
Family Income by Number of Earners in Highland Village
The median family income in Highland Village is $177,478, with families comprising 3+ earners (760) having the highest median family income of $219,688, while families with no earners (296) have the lowest median family income of $98,214, accounting for 17.0% and 6.6% of families, respectively.
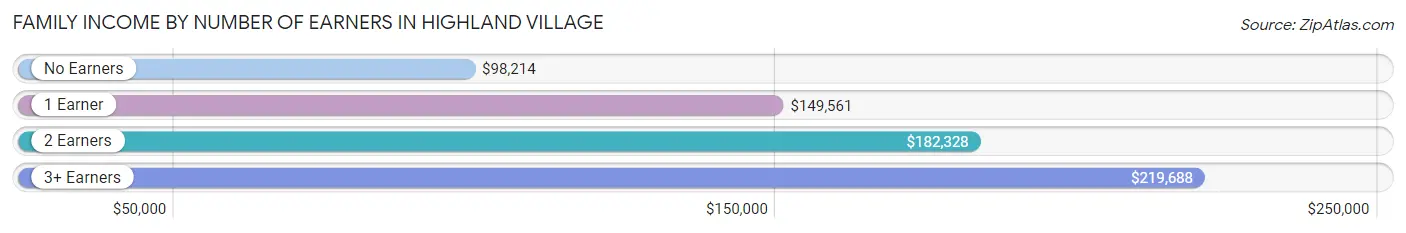
| Number of Earners | # Families | Median Income |
| No Earners | 296 (6.6%) | $98,214 |
| 1 Earner | 1,209 (27.0%) | $149,561 |
| 2 Earners | 2,206 (49.3%) | $182,328 |
| 3+ Earners | 760 (17.0%) | $219,688 |
| Total | 4,471 (100.0%) | $177,478 |
Household Income in Highland Village
Household Income Brackets in Highland Village
With 1,776 households falling in the category, the $200,000+ income range is the most frequent in Highland Village, accounting for 33.4% of all households. In contrast, only 5 households (0.1%) fall into the $10,000 to $14,999 income bracket, making it the least populous group.
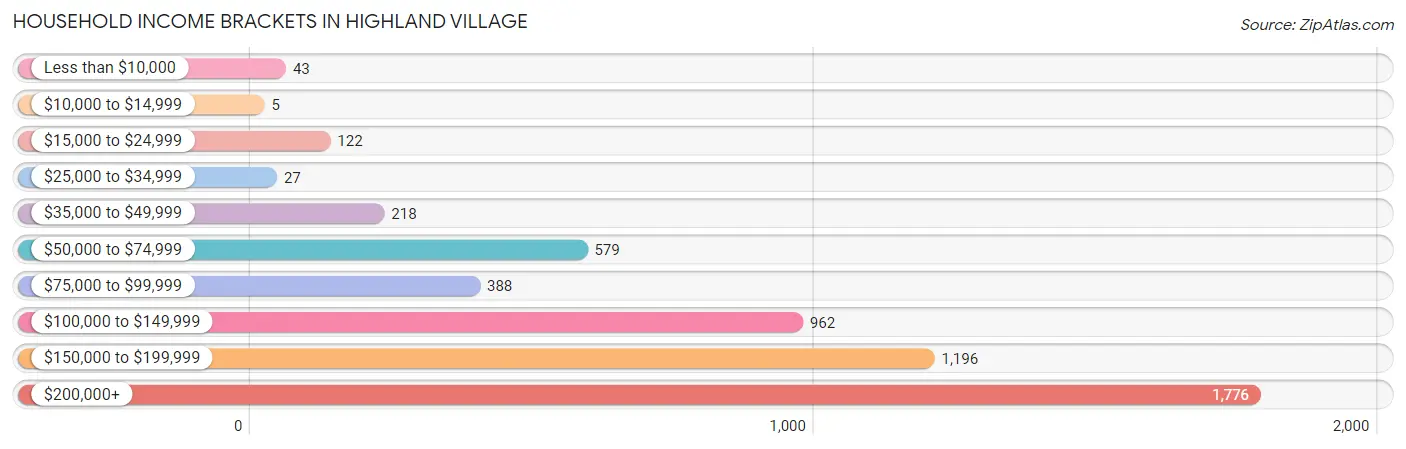
| Income Bracket | # Households | % Households |
| Less than $10,000 | 43 | 0.8% |
| $10,000 to $14,999 | 5 | 0.1% |
| $15,000 to $24,999 | 122 | 2.3% |
| $25,000 to $34,999 | 27 | 0.5% |
| $35,000 to $49,999 | 218 | 4.1% |
| $50,000 to $74,999 | 579 | 10.9% |
| $75,000 to $99,999 | 388 | 7.3% |
| $100,000 to $149,999 | 962 | 18.1% |
| $150,000 to $199,999 | 1,196 | 22.5% |
| $200,000+ | 1,776 | 33.4% |
Household Income by Householder Age in Highland Village
The median household income in Highland Village is $162,879, with the highest median household income of $192,794 found in the 45 to 64 years age bracket for the primary householder. A total of 2,754 households (51.8%) fall into this category. Meanwhile, the 15 to 24 years age bracket for the primary householder has the lowest median household income of $0, with 14 households (0.3%) in this group.
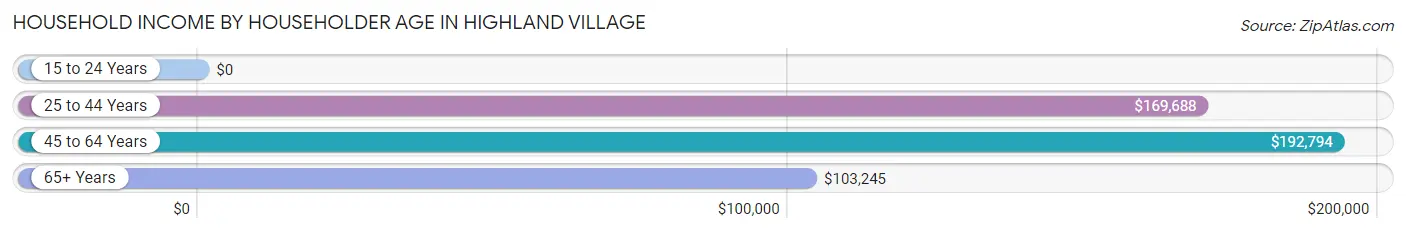
| Income Bracket | # Households | Median Income |
| 15 to 24 Years | 14 (0.3%) | $0 |
| 25 to 44 Years | 1,333 (25.1%) | $169,688 |
| 45 to 64 Years | 2,754 (51.8%) | $192,794 |
| 65+ Years | 1,215 (22.9%) | $103,245 |
| Total | 5,316 (100.0%) | $162,879 |
Poverty in Highland Village
Income Below Poverty by Sex and Age in Highland Village
With 0.9% poverty level for males and 2.8% for females among the residents of Highland Village, 45 to 54 year old males and 18 to 24 year old females are the most vulnerable to poverty, with 27 males (1.8%) and 70 females (12.5%) in their respective age groups living below the poverty level.
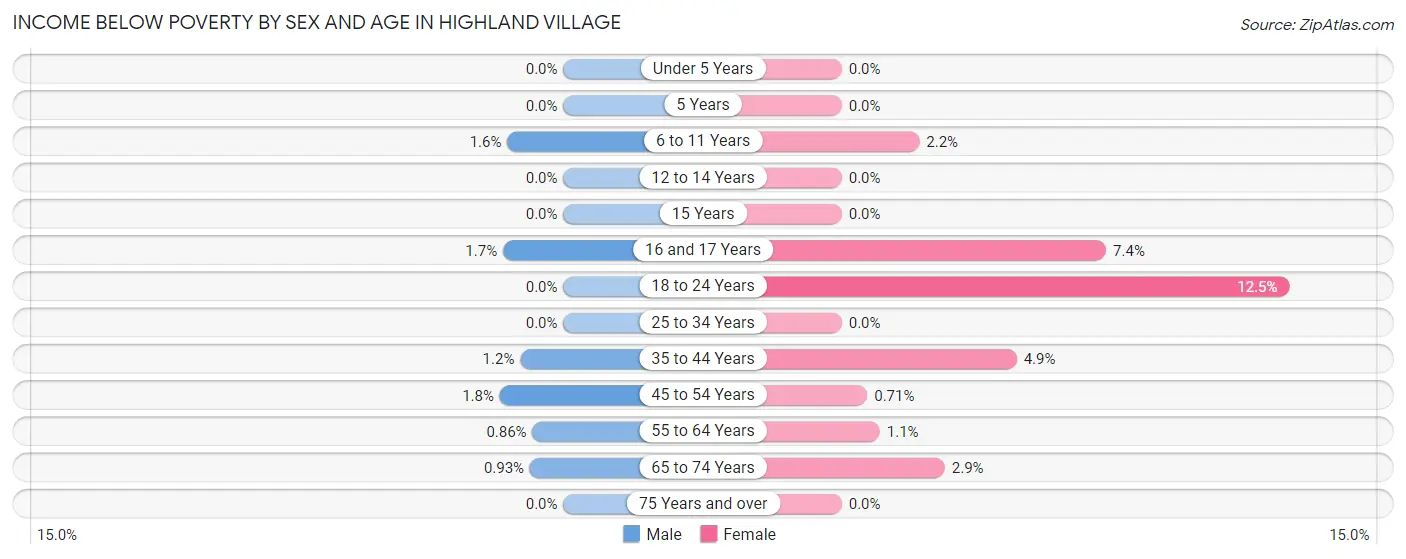
| Age Bracket | Male | Female |
| Under 5 Years | 0 (0.0%) | 0 (0.0%) |
| 5 Years | 0 (0.0%) | 0 (0.0%) |
| 6 to 11 Years | 11 (1.6%) | 10 (2.2%) |
| 12 to 14 Years | 0 (0.0%) | 0 (0.0%) |
| 15 Years | 0 (0.0%) | 0 (0.0%) |
| 16 and 17 Years | 9 (1.7%) | 27 (7.4%) |
| 18 to 24 Years | 0 (0.0%) | 70 (12.5%) |
| 25 to 34 Years | 0 (0.0%) | 0 (0.0%) |
| 35 to 44 Years | 14 (1.2%) | 55 (4.9%) |
| 45 to 54 Years | 27 (1.8%) | 9 (0.7%) |
| 55 to 64 Years | 10 (0.9%) | 13 (1.1%) |
| 65 to 74 Years | 7 (0.9%) | 24 (2.9%) |
| 75 Years and over | 0 (0.0%) | 0 (0.0%) |
| Total | 78 (0.9%) | 208 (2.8%) |
Income Above Poverty by Sex and Age in Highland Village
According to the poverty statistics in Highland Village, males aged under 5 years and females aged under 5 years are the age groups that are most secure financially, with 100.0% of males and 100.0% of females in these age groups living above the poverty line.
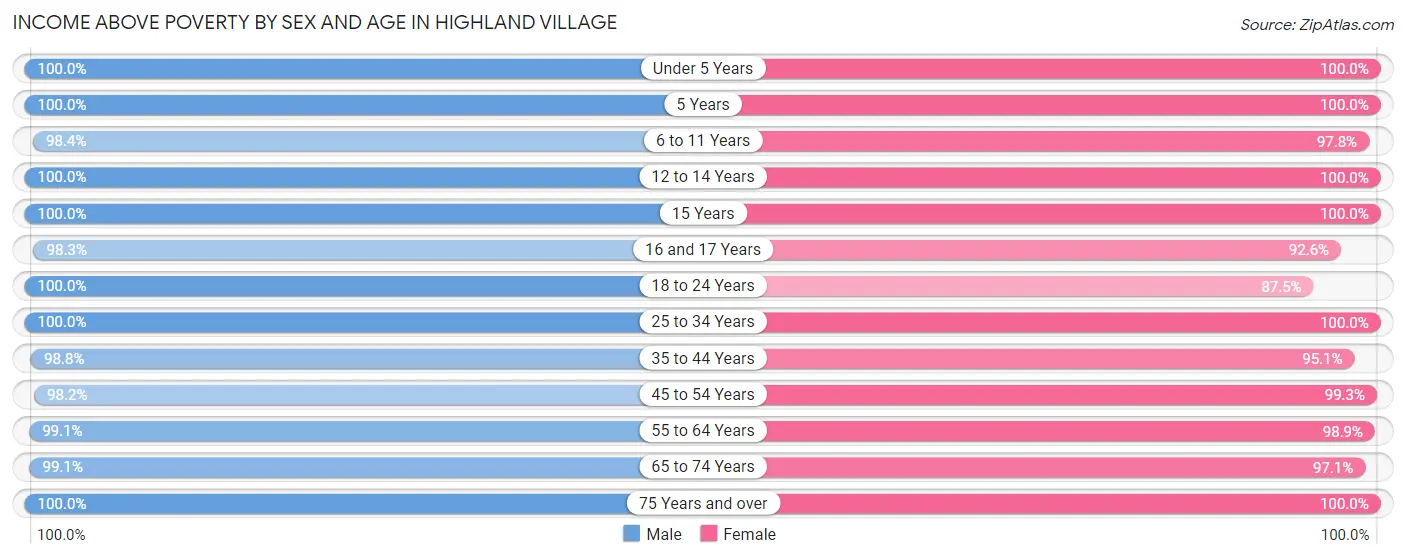
| Age Bracket | Male | Female |
| Under 5 Years | 483 (100.0%) | 206 (100.0%) |
| 5 Years | 120 (100.0%) | 67 (100.0%) |
| 6 to 11 Years | 696 (98.4%) | 453 (97.8%) |
| 12 to 14 Years | 466 (100.0%) | 263 (100.0%) |
| 15 Years | 182 (100.0%) | 129 (100.0%) |
| 16 and 17 Years | 528 (98.3%) | 340 (92.6%) |
| 18 to 24 Years | 430 (100.0%) | 492 (87.5%) |
| 25 to 34 Years | 482 (100.0%) | 595 (100.0%) |
| 35 to 44 Years | 1,151 (98.8%) | 1,074 (95.1%) |
| 45 to 54 Years | 1,495 (98.2%) | 1,260 (99.3%) |
| 55 to 64 Years | 1,148 (99.1%) | 1,213 (98.9%) |
| 65 to 74 Years | 742 (99.1%) | 812 (97.1%) |
| 75 Years and over | 313 (100.0%) | 359 (100.0%) |
| Total | 8,236 (99.1%) | 7,263 (97.2%) |
Income Below Poverty Among Married-Couple Families in Highland Village
The poverty statistics for married-couple families in Highland Village show that 1.2% or 47 of the total 4,063 families live below the poverty line. Families with 1 or 2 children have the highest poverty rate of 2.4%, comprising of 41 families. On the other hand, families with 3 or 4 children have the lowest poverty rate of 0.0%, which includes 0 families.
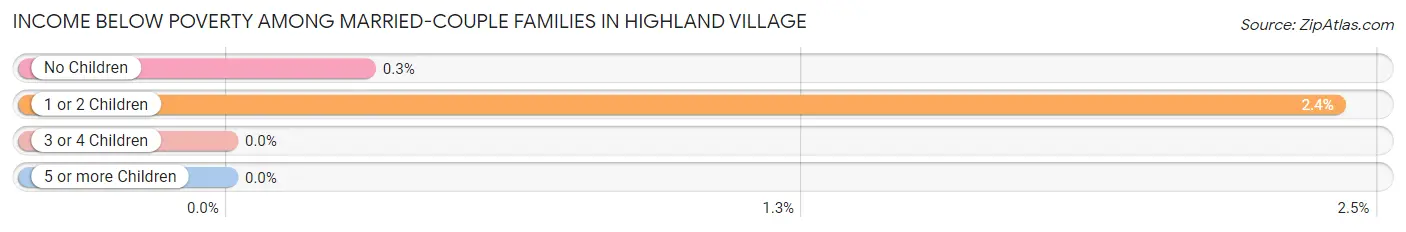
| Children | Above Poverty | Below Poverty |
| No Children | 2,003 (99.7%) | 6 (0.3%) |
| 1 or 2 Children | 1,657 (97.6%) | 41 (2.4%) |
| 3 or 4 Children | 345 (100.0%) | 0 (0.0%) |
| 5 or more Children | 11 (100.0%) | 0 (0.0%) |
| Total | 4,016 (98.8%) | 47 (1.2%) |
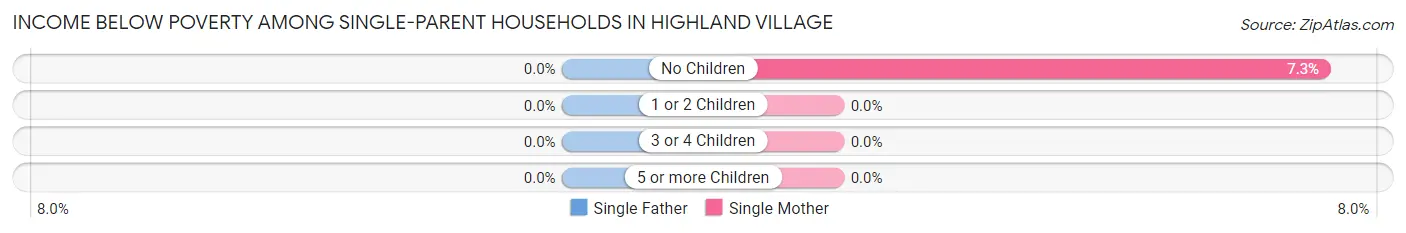
Income Below Poverty Among Single-Parent Households in Highland Village
| Children | Single Father | Single Mother |
| No Children | 0 (0.0%) | 13 (7.3%) |
| 1 or 2 Children | 0 (0.0%) | 0 (0.0%) |
| 3 or 4 Children | 0 (0.0%) | 0 (0.0%) |
| 5 or more Children | 0 (0.0%) | 0 (0.0%) |
| Total | 0 (0.0%) | 13 (3.8%) |
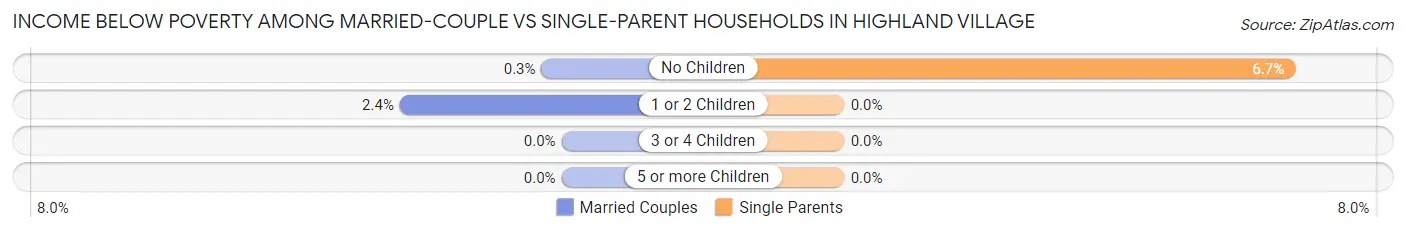
Income Below Poverty Among Married-Couple vs Single-Parent Households in Highland Village
The poverty data for Highland Village shows that 47 of the married-couple family households (1.2%) and 13 of the single-parent households (3.2%) are living below the poverty level. Within the married-couple family households, those with 1 or 2 children have the highest poverty rate, with 41 households (2.4%) falling below the poverty line. Among the single-parent households, those with no children have the highest poverty rate, with 13 household (6.7%) living below poverty.
| Children | Married-Couple Families | Single-Parent Households |
| No Children | 6 (0.3%) | 13 (6.7%) |
| 1 or 2 Children | 41 (2.4%) | 0 (0.0%) |
| 3 or 4 Children | 0 (0.0%) | 0 (0.0%) |
| 5 or more Children | 0 (0.0%) | 0 (0.0%) |
| Total | 47 (1.2%) | 13 (3.2%) |
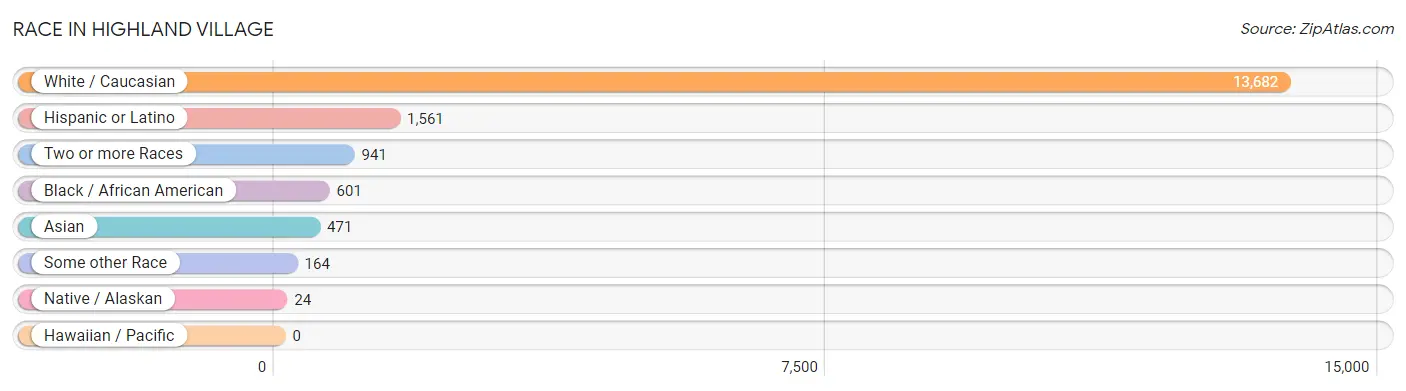
Race in Highland Village
The most populous races in Highland Village are White / Caucasian (13,682 | 86.1%), Hispanic or Latino (1,561 | 9.8%), and Two or more Races (941 | 5.9%).
| Race | # Population | % Population |
| Asian | 471 | 3.0% |
| Black / African American | 601 | 3.8% |
| Hawaiian / Pacific | 0 | 0.0% |
| Hispanic or Latino | 1,561 | 9.8% |
| Native / Alaskan | 24 | 0.2% |
| White / Caucasian | 13,682 | 86.1% |
| Two or more Races | 941 | 5.9% |
| Some other Race | 164 | 1.0% |
| Total | 15,883 | 100.0% |
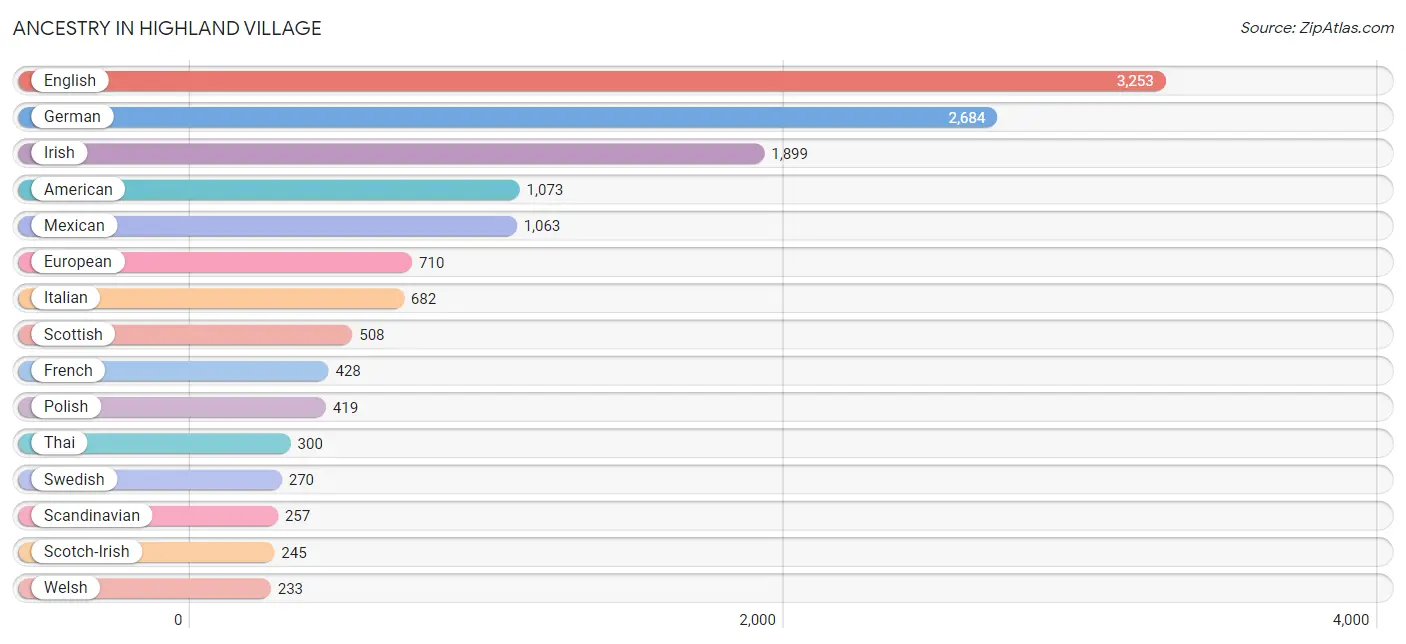
Ancestry in Highland Village
The most populous ancestries reported in Highland Village are English (3,253 | 20.5%), German (2,684 | 16.9%), Irish (1,899 | 12.0%), American (1,073 | 6.8%), and Mexican (1,063 | 6.7%), together accounting for 62.8% of all Highland Village residents.
| Ancestry | # Population | % Population |
| African | 18 | 0.1% |
| Albanian | 78 | 0.5% |
| American | 1,073 | 6.8% |
| Arab | 98 | 0.6% |
| Argentinean | 10 | 0.1% |
| Austrian | 19 | 0.1% |
| Belgian | 40 | 0.3% |
| Bhutanese | 115 | 0.7% |
| Bolivian | 9 | 0.1% |
| British | 111 | 0.7% |
| Burmese | 107 | 0.7% |
| Canadian | 8 | 0.1% |
| Cape Verdean | 31 | 0.2% |
| Central American | 78 | 0.5% |
| Cherokee | 79 | 0.5% |
| Chickasaw | 15 | 0.1% |
| Choctaw | 1 | 0.0% |
| Colombian | 50 | 0.3% |
| Croatian | 19 | 0.1% |
| Cuban | 19 | 0.1% |
| Czech | 168 | 1.1% |
| Czechoslovakian | 37 | 0.2% |
| Danish | 7 | 0.0% |
| Dutch | 144 | 0.9% |
| Eastern European | 11 | 0.1% |
| Egyptian | 8 | 0.1% |
| English | 3,253 | 20.5% |
| Ethiopian | 13 | 0.1% |
| European | 710 | 4.5% |
| Filipino | 12 | 0.1% |
| Finnish | 12 | 0.1% |
| French | 428 | 2.7% |
| French Canadian | 28 | 0.2% |
| German | 2,684 | 16.9% |
| Guamanian / Chamorro | 25 | 0.2% |
| Guatemalan | 11 | 0.1% |
| Honduran | 28 | 0.2% |
| Hungarian | 34 | 0.2% |
| Indian (Asian) | 155 | 1.0% |
| Irish | 1,899 | 12.0% |
| Italian | 682 | 4.3% |
| Korean | 79 | 0.5% |
| Lebanese | 44 | 0.3% |
| Liberian | 18 | 0.1% |
| Mexican | 1,063 | 6.7% |
| Native Hawaiian | 25 | 0.2% |
| Nigerian | 38 | 0.2% |
| Northern European | 64 | 0.4% |
| Norwegian | 165 | 1.0% |
| Panamanian | 39 | 0.3% |
| Peruvian | 60 | 0.4% |
| Polish | 419 | 2.6% |
| Portuguese | 45 | 0.3% |
| Puerto Rican | 87 | 0.5% |
| Russian | 120 | 0.8% |
| Samoan | 25 | 0.2% |
| Scandinavian | 257 | 1.6% |
| Scotch-Irish | 245 | 1.5% |
| Scottish | 508 | 3.2% |
| Serbian | 22 | 0.1% |
| Slovak | 42 | 0.3% |
| South American | 149 | 0.9% |
| Spaniard | 27 | 0.2% |
| Spanish | 98 | 0.6% |
| Sri Lankan | 57 | 0.4% |
| Subsaharan African | 157 | 1.0% |
| Swedish | 270 | 1.7% |
| Swiss | 12 | 0.1% |
| Thai | 300 | 1.9% |
| Turkish | 64 | 0.4% |
| Ukrainian | 34 | 0.2% |
| Venezuelan | 20 | 0.1% |
| Welsh | 233 | 1.5% | View All 73 Rows |
Immigrants in Highland Village
The most numerous immigrant groups reported in Highland Village came from Asia (349 | 2.2%), Europe (321 | 2.0%), Latin America (232 | 1.5%), Eastern Asia (214 | 1.3%), and South America (141 | 0.9%), together accounting for 7.9% of all Highland Village residents.
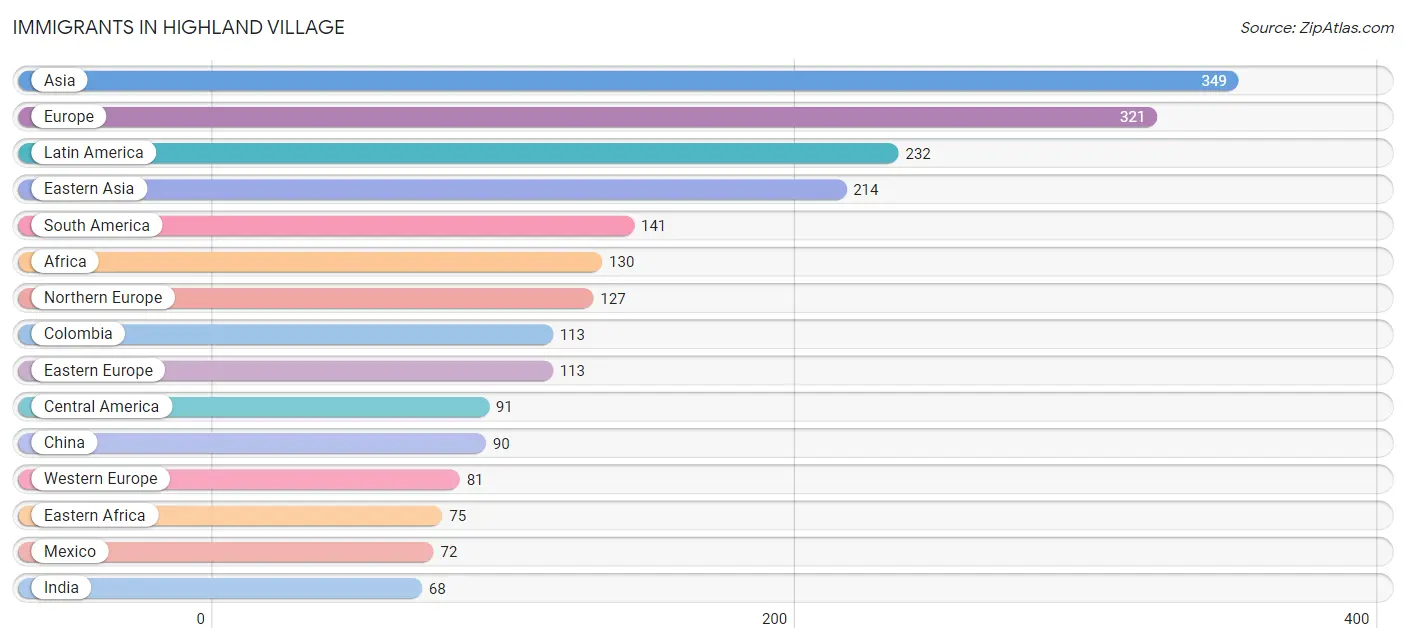
| Immigration Origin | # Population | % Population |
| Africa | 130 | 0.8% |
| Albania | 14 | 0.1% |
| Argentina | 10 | 0.1% |
| Asia | 349 | 2.2% |
| Australia | 7 | 0.0% |
| Bolivia | 9 | 0.1% |
| Brazil | 9 | 0.1% |
| Cabo Verde | 25 | 0.2% |
| Canada | 17 | 0.1% |
| Central America | 91 | 0.6% |
| China | 90 | 0.6% |
| Colombia | 113 | 0.7% |
| Eastern Africa | 75 | 0.5% |
| Eastern Asia | 214 | 1.3% |
| Eastern Europe | 113 | 0.7% |
| England | 35 | 0.2% |
| Ethiopia | 13 | 0.1% |
| Europe | 321 | 2.0% |
| France | 10 | 0.1% |
| Germany | 51 | 0.3% |
| Guatemala | 11 | 0.1% |
| Honduras | 8 | 0.1% |
| Hong Kong | 17 | 0.1% |
| India | 68 | 0.4% |
| Japan | 65 | 0.4% |
| Kenya | 5 | 0.0% |
| Korea | 59 | 0.4% |
| Latin America | 232 | 1.5% |
| Lebanon | 32 | 0.2% |
| Liberia | 18 | 0.1% |
| Mexico | 72 | 0.4% |
| Nigeria | 12 | 0.1% |
| North Macedonia | 33 | 0.2% |
| Northern Europe | 127 | 0.8% |
| Oceania | 7 | 0.0% |
| Philippines | 16 | 0.1% |
| Poland | 41 | 0.3% |
| Russia | 25 | 0.2% |
| Scotland | 40 | 0.3% |
| South America | 141 | 0.9% |
| South Central Asia | 68 | 0.4% |
| South Eastern Asia | 25 | 0.2% |
| Switzerland | 20 | 0.1% |
| Taiwan | 17 | 0.1% |
| Uganda | 8 | 0.1% |
| Vietnam | 9 | 0.1% |
| Western Africa | 55 | 0.4% |
| Western Asia | 42 | 0.3% |
| Western Europe | 81 | 0.5% | View All 49 Rows |
Sex and Age in Highland Village
Sex and Age in Highland Village
The most populous age groups in Highland Village are 15 to 19 Years (820 | 9.8%) for men and 40 to 44 Years (711 | 9.4%) for women.
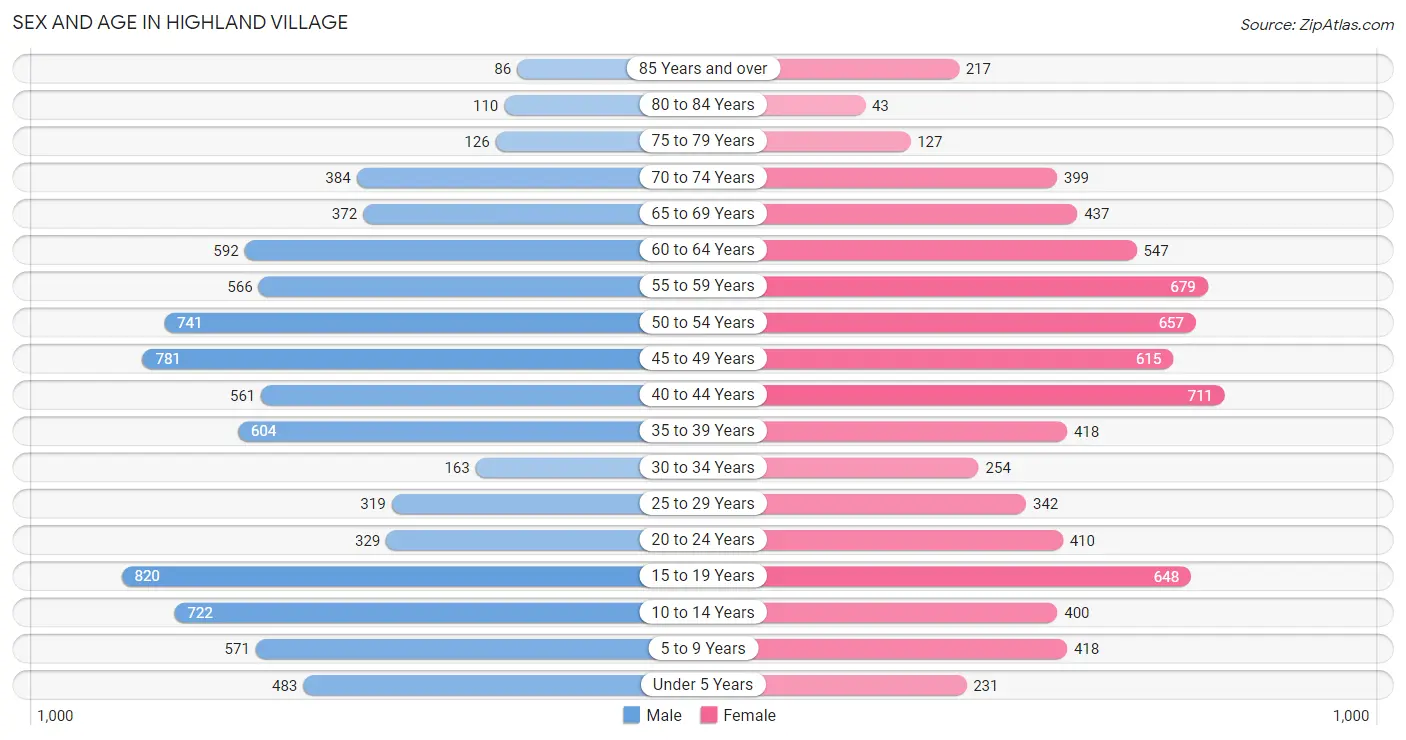
| Age Bracket | Male | Female |
| Under 5 Years | 483 (5.8%) | 231 (3.1%) |
| 5 to 9 Years | 571 (6.9%) | 418 (5.5%) |
| 10 to 14 Years | 722 (8.7%) | 400 (5.3%) |
| 15 to 19 Years | 820 (9.8%) | 648 (8.6%) |
| 20 to 24 Years | 329 (4.0%) | 410 (5.4%) |
| 25 to 29 Years | 319 (3.8%) | 342 (4.5%) |
| 30 to 34 Years | 163 (2.0%) | 254 (3.4%) |
| 35 to 39 Years | 604 (7.2%) | 418 (5.5%) |
| 40 to 44 Years | 561 (6.7%) | 711 (9.4%) |
| 45 to 49 Years | 781 (9.4%) | 615 (8.1%) |
| 50 to 54 Years | 741 (8.9%) | 657 (8.7%) |
| 55 to 59 Years | 566 (6.8%) | 679 (9.0%) |
| 60 to 64 Years | 592 (7.1%) | 547 (7.2%) |
| 65 to 69 Years | 372 (4.5%) | 437 (5.8%) |
| 70 to 74 Years | 384 (4.6%) | 399 (5.3%) |
| 75 to 79 Years | 126 (1.5%) | 127 (1.7%) |
| 80 to 84 Years | 110 (1.3%) | 43 (0.6%) |
| 85 Years and over | 86 (1.0%) | 217 (2.9%) |
| Total | 8,330 (100.0%) | 7,553 (100.0%) |
Families and Households in Highland Village
Median Family Size in Highland Village
The median family size in Highland Village is 3.28 persons per family, with married-couple families (4,063 | 90.9%) accounting for the largest median family size of 3.31 persons per family. On the other hand, single male/father families (69 | 1.5%) represent the smallest median family size with 2.88 persons per family.
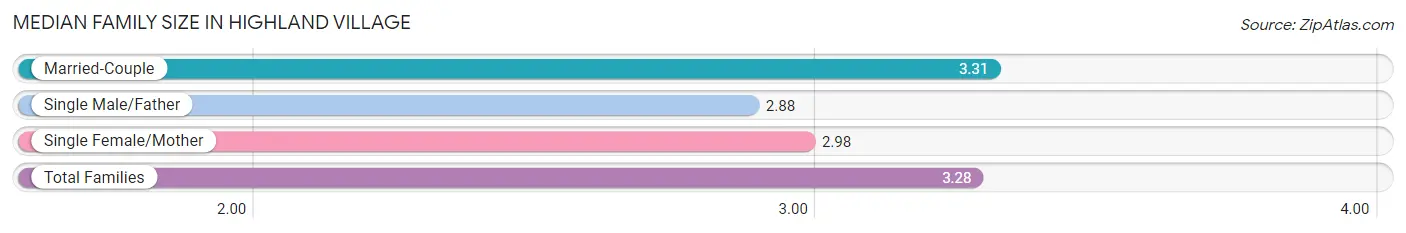
| Family Type | # Families | Family Size |
| Married-Couple | 4,063 (90.9%) | 3.31 |
| Single Male/Father | 69 (1.5%) | 2.88 |
| Single Female/Mother | 339 (7.6%) | 2.98 |
| Total Families | 4,471 (100.0%) | 3.28 |
Median Household Size in Highland Village
The median household size in Highland Village is 2.98 persons per household, with married-couple households (4,063 | 76.4%) accounting for the largest median household size of 3.34 persons per household. non-family households (845 | 15.9%) represent the smallest median household size with 1.17 persons per household.
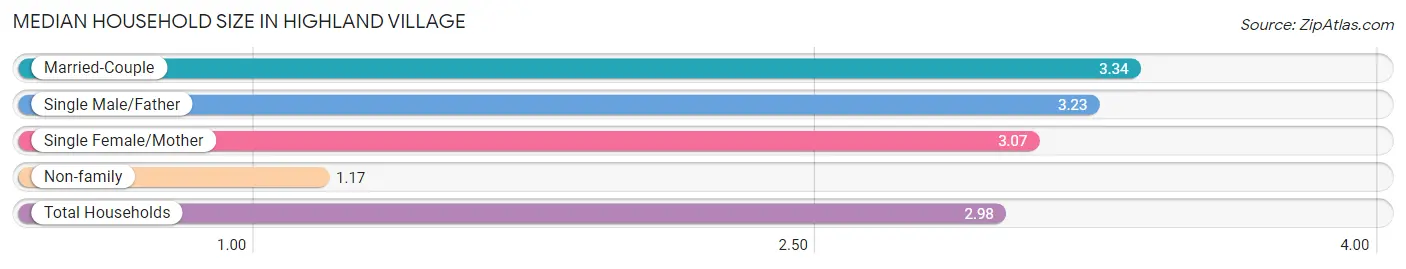
| Household Type | # Households | Household Size |
| Married-Couple | 4,063 (76.4%) | 3.34 |
| Single Male/Father | 69 (1.3%) | 3.23 |
| Single Female/Mother | 339 (6.4%) | 3.07 |
| Non-family | 845 (15.9%) | 1.17 |
| Total Households | 5,316 (100.0%) | 2.98 |
Household Size by Marriage Status in Highland Village
Out of a total of 5,316 households in Highland Village, 4,471 (84.1%) are family households, while 845 (15.9%) are nonfamily households. The most numerous type of family households are 2-person households, comprising 1,655, and the most common type of nonfamily households are 1-person households, comprising 757.
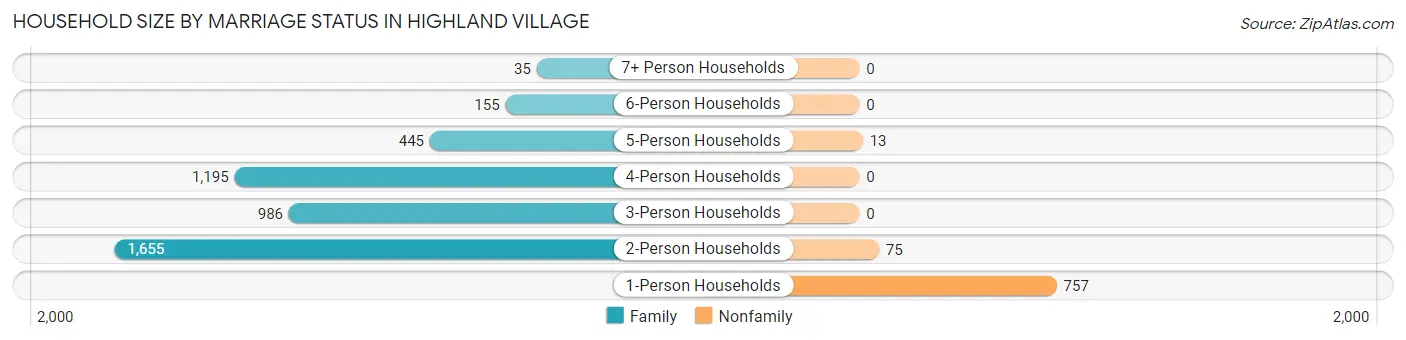
| Household Size | Family Households | Nonfamily Households |
| 1-Person Households | - | 757 (14.2%) |
| 2-Person Households | 1,655 (31.1%) | 75 (1.4%) |
| 3-Person Households | 986 (18.5%) | 0 (0.0%) |
| 4-Person Households | 1,195 (22.5%) | 0 (0.0%) |
| 5-Person Households | 445 (8.4%) | 13 (0.2%) |
| 6-Person Households | 155 (2.9%) | 0 (0.0%) |
| 7+ Person Households | 35 (0.7%) | 0 (0.0%) |
| Total | 4,471 (84.1%) | 845 (15.9%) |
Female Fertility in Highland Village
Fertility by Age in Highland Village
Average fertility rate in Highland Village is 77.0 births per 1,000 women. Women in the age bracket of 20 to 34 years have the highest fertility rate with 227.0 births per 1,000 women. Women in the age bracket of 20 to 34 years acount for 82.0% of all women with births.
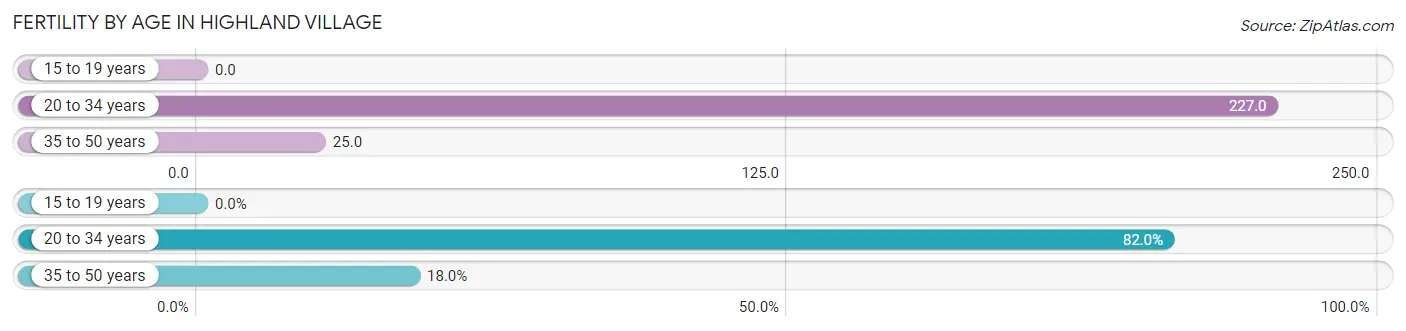
| Age Bracket | Women with Births | Births / 1,000 Women |
| 15 to 19 years | 0 (0.0%) | 0.0 |
| 20 to 34 years | 228 (82.0%) | 227.0 |
| 35 to 50 years | 50 (18.0%) | 25.0 |
| Total | 278 (100.0%) | 77.0 |
Fertility by Age by Marriage Status in Highland Village
68.7% of women with births (278) in Highland Village are married. The highest percentage of unmarried women with births falls into 20 to 34 years age bracket with 38.2% of them unmarried at the time of birth, while the lowest percentage of unmarried women with births belong to 35 to 50 years age bracket with 0.0% of them unmarried.
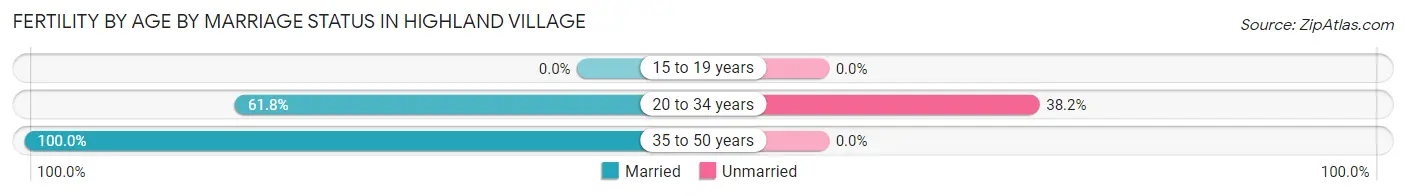
| Age Bracket | Married | Unmarried |
| 15 to 19 years | 0 (0.0%) | 0 (0.0%) |
| 20 to 34 years | 141 (61.8%) | 87 (38.2%) |
| 35 to 50 years | 50 (100.0%) | 0 (0.0%) |
| Total | 191 (68.7%) | 87 (31.3%) |
Fertility by Education in Highland Village
Average fertility rate in Highland Village is 77.0 births per 1,000 women. Women with the education attainment of college or associate's degree have the highest fertility rate of 141.0 births per 1,000 women, while women with the education attainment of less than high school have the lowest fertility at 16.0 births per 1,000 women. Women with the education attainment of college or associate's degree represent 36.7% of all women with births.
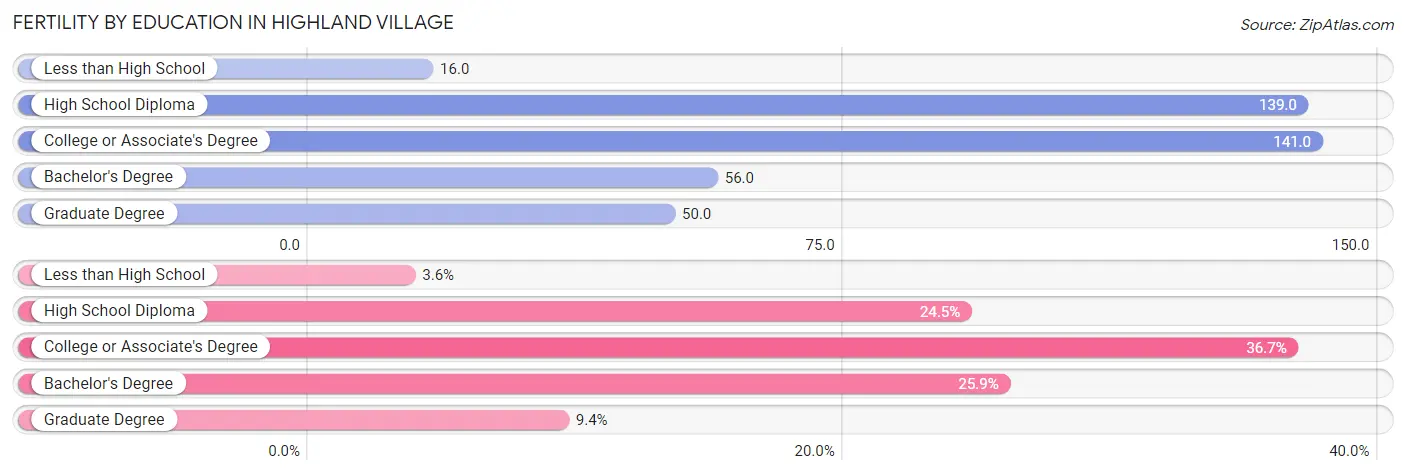
| Educational Attainment | Women with Births | Births / 1,000 Women |
| Less than High School | 10 (3.6%) | 16.0 |
| High School Diploma | 68 (24.5%) | 139.0 |
| College or Associate's Degree | 102 (36.7%) | 141.0 |
| Bachelor's Degree | 72 (25.9%) | 56.0 |
| Graduate Degree | 26 (9.3%) | 50.0 |
| Total | 278 (100.0%) | 77.0 |
Fertility by Education by Marriage Status in Highland Village
31.3% of women with births in Highland Village are unmarried. Women with the educational attainment of less than high school are most likely to be married with 100.0% of them married at childbirth, while women with the educational attainment of high school diploma are least likely to be married with 100.0% of them unmarried at childbirth.
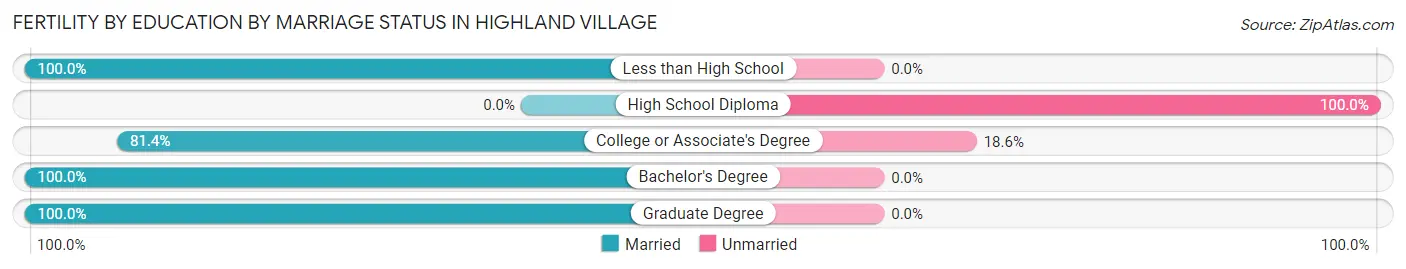
| Educational Attainment | Married | Unmarried |
| Less than High School | 10 (100.0%) | 0 (0.0%) |
| High School Diploma | 0 (0.0%) | 68 (100.0%) |
| College or Associate's Degree | 83 (81.4%) | 19 (18.6%) |
| Bachelor's Degree | 72 (100.0%) | 0 (0.0%) |
| Graduate Degree | 26 (100.0%) | 0 (0.0%) |
| Total | 191 (68.7%) | 87 (31.3%) |
Employment Characteristics in Highland Village
Employment by Class of Employer in Highland Village
Among the 8,192 employed individuals in Highland Village, private company employees (5,852 | 71.4%), local government employees (614 | 7.5%), and not-for-profit organizations (580 | 7.1%) make up the most common classes of employment.
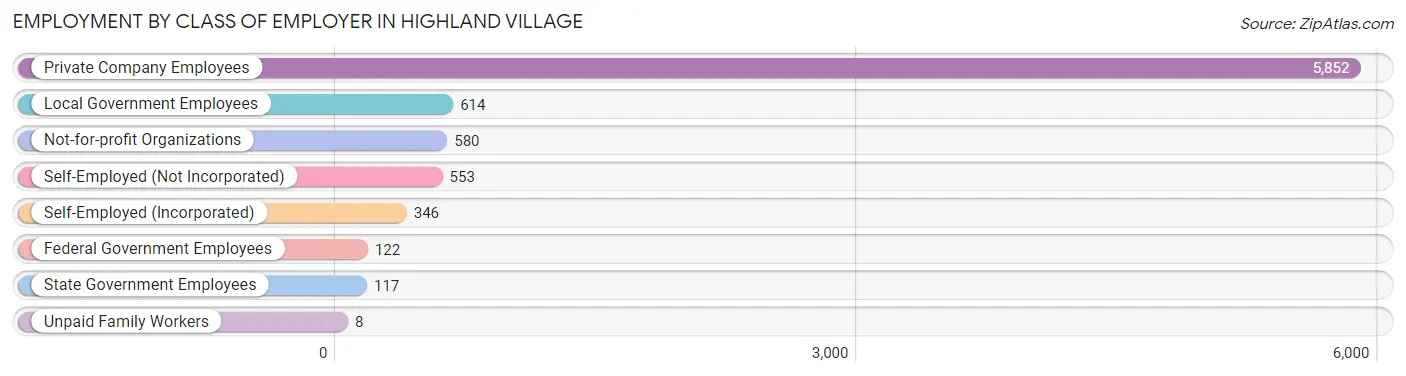
| Employer Class | # Employees | % Employees |
| Private Company Employees | 5,852 | 71.4% |
| Self-Employed (Incorporated) | 346 | 4.2% |
| Self-Employed (Not Incorporated) | 553 | 6.8% |
| Not-for-profit Organizations | 580 | 7.1% |
| Local Government Employees | 614 | 7.5% |
| State Government Employees | 117 | 1.4% |
| Federal Government Employees | 122 | 1.5% |
| Unpaid Family Workers | 8 | 0.1% |
| Total | 8,192 | 100.0% |
Employment Status by Age in Highland Village
According to the labor force statistics for Highland Village, out of the total population over 16 years of age (12,747), 67.1% or 8,553 individuals are in the labor force, with 3.0% or 257 of them unemployed. The age group with the highest labor force participation rate is 25 to 29 years, with 88.2% or 583 individuals in the labor force. Within the labor force, the 16 to 19 years age range has the highest percentage of unemployed individuals, with 14.0% or 68 of them being unemployed.
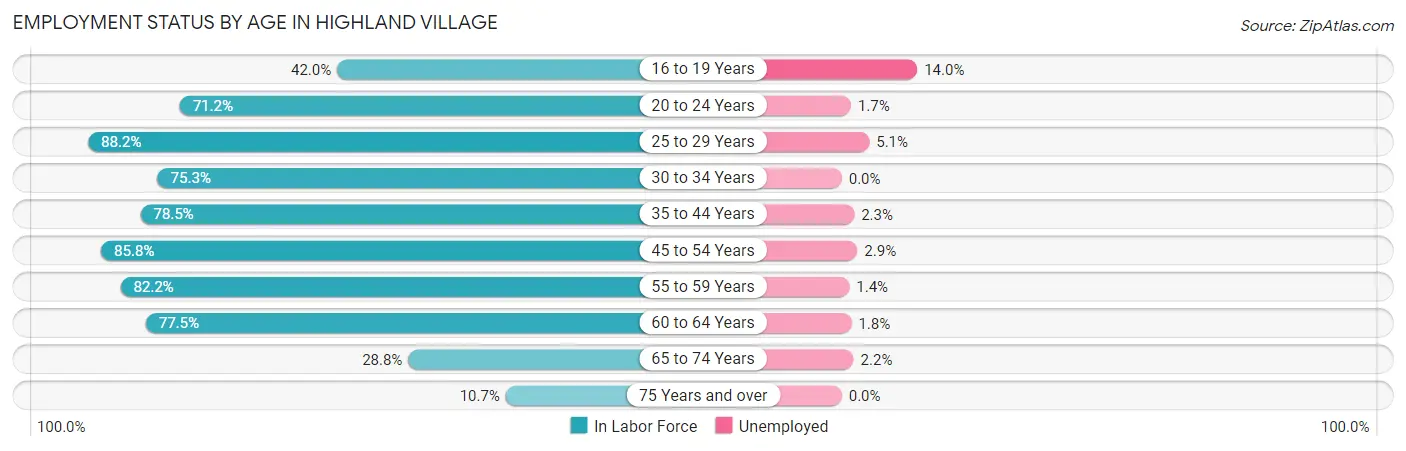
| Age Bracket | In Labor Force | Unemployed |
| 16 to 19 Years | 486 (42.0%) | 68 (14.0%) |
| 20 to 24 Years | 526 (71.2%) | 9 (1.7%) |
| 25 to 29 Years | 583 (88.2%) | 30 (5.1%) |
| 30 to 34 Years | 314 (75.3%) | 0 (0.0%) |
| 35 to 44 Years | 1,801 (78.5%) | 41 (2.3%) |
| 45 to 54 Years | 2,397 (85.8%) | 70 (2.9%) |
| 55 to 59 Years | 1,023 (82.2%) | 14 (1.4%) |
| 60 to 64 Years | 883 (77.5%) | 16 (1.8%) |
| 65 to 74 Years | 458 (28.8%) | 10 (2.2%) |
| 75 Years and over | 76 (10.7%) | 0 (0.0%) |
| Total | 8,553 (67.1%) | 257 (3.0%) |
Employment Status by Educational Attainment in Highland Village
According to labor force statistics for Highland Village, 81.9% of individuals (7,002) out of the total population between 25 and 64 years of age (8,550) are in the labor force, with 2.4% or 168 of them being unemployed. The group with the highest labor force participation rate are those with the educational attainment of bachelor's degree or higher, with 85.2% or 4,295 individuals in the labor force. Within the labor force, individuals with college / associate degree education have the highest percentage of unemployment, with 4.6% or 89 of them being unemployed.
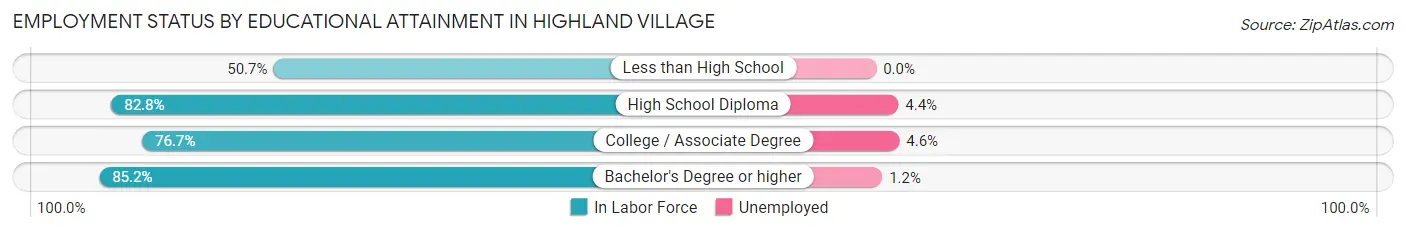
| Educational Attainment | In Labor Force | Unemployed |
| Less than High School | 74 (50.7%) | 0 (0.0%) |
| High School Diploma | 688 (82.8%) | 37 (4.4%) |
| College / Associate Degree | 1,942 (76.7%) | 116 (4.6%) |
| Bachelor's Degree or higher | 4,295 (85.2%) | 60 (1.2%) |
| Total | 7,002 (81.9%) | 205 (2.4%) |
Employment Occupations by Sex in Highland Village
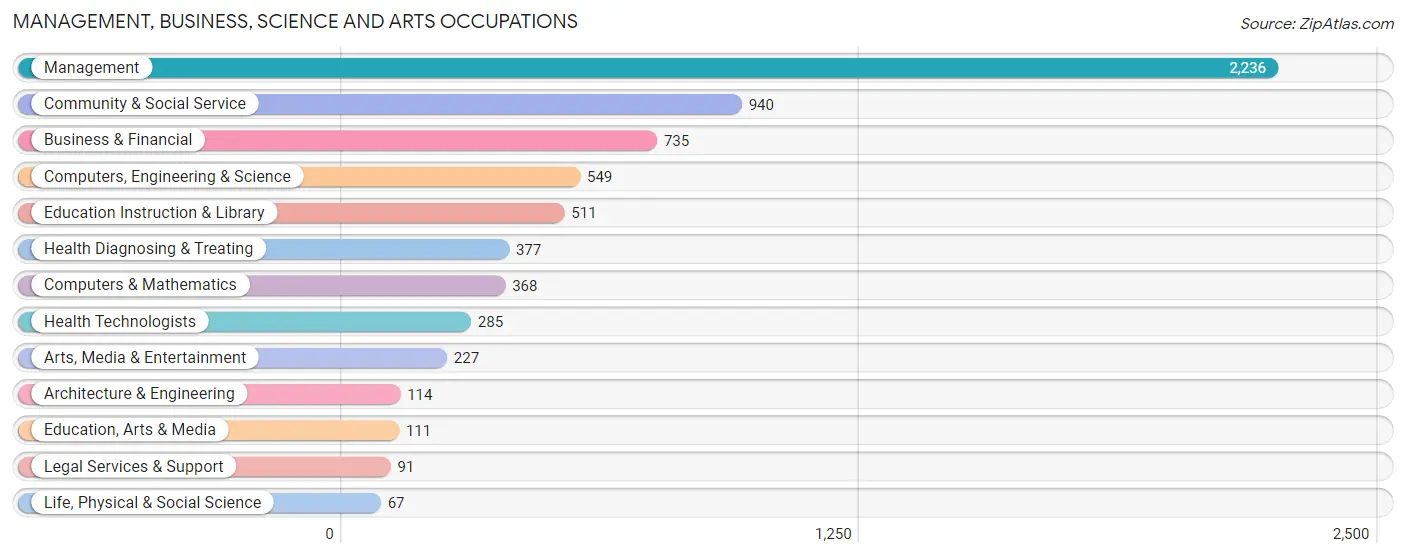
Management, Business, Science and Arts Occupations
The most common Management, Business, Science and Arts occupations in Highland Village are Management (2,236 | 27.0%), Community & Social Service (940 | 11.4%), Business & Financial (735 | 8.9%), Computers, Engineering & Science (549 | 6.6%), and Education Instruction & Library (511 | 6.2%).
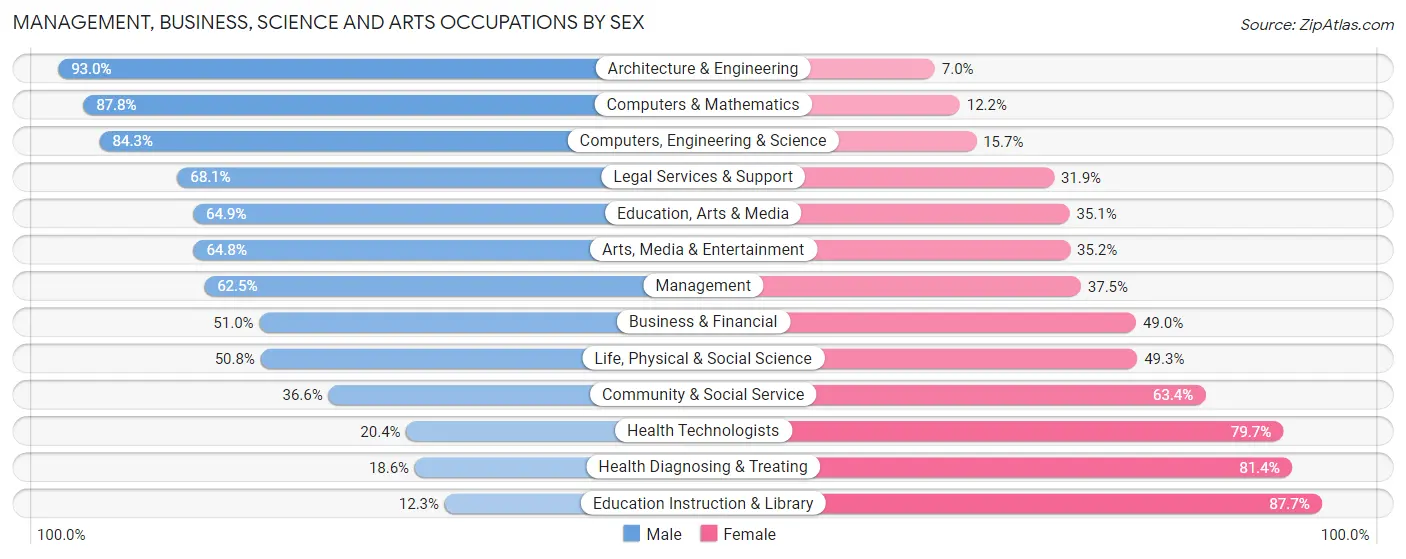
Management, Business, Science and Arts Occupations by Sex
Within the Management, Business, Science and Arts occupations in Highland Village, the most male-oriented occupations are Architecture & Engineering (93.0%), Computers & Mathematics (87.8%), and Computers, Engineering & Science (84.3%), while the most female-oriented occupations are Education Instruction & Library (87.7%), Health Diagnosing & Treating (81.4%), and Health Technologists (79.6%).
| Occupation | Male | Female |
| Management | 1,398 (62.5%) | 838 (37.5%) |
| Business & Financial | 375 (51.0%) | 360 (49.0%) |
| Computers, Engineering & Science | 463 (84.3%) | 86 (15.7%) |
| Computers & Mathematics | 323 (87.8%) | 45 (12.2%) |
| Architecture & Engineering | 106 (93.0%) | 8 (7.0%) |
| Life, Physical & Social Science | 34 (50.7%) | 33 (49.2%) |
| Community & Social Service | 344 (36.6%) | 596 (63.4%) |
| Education, Arts & Media | 72 (64.9%) | 39 (35.1%) |
| Legal Services & Support | 62 (68.1%) | 29 (31.9%) |
| Education Instruction & Library | 63 (12.3%) | 448 (87.7%) |
| Arts, Media & Entertainment | 147 (64.8%) | 80 (35.2%) |
| Health Diagnosing & Treating | 70 (18.6%) | 307 (81.4%) |
| Health Technologists | 58 (20.3%) | 227 (79.6%) |
| Total (Category) | 2,650 (54.8%) | 2,187 (45.2%) |
| Total (Overall) | 4,583 (55.3%) | 3,699 (44.7%) |
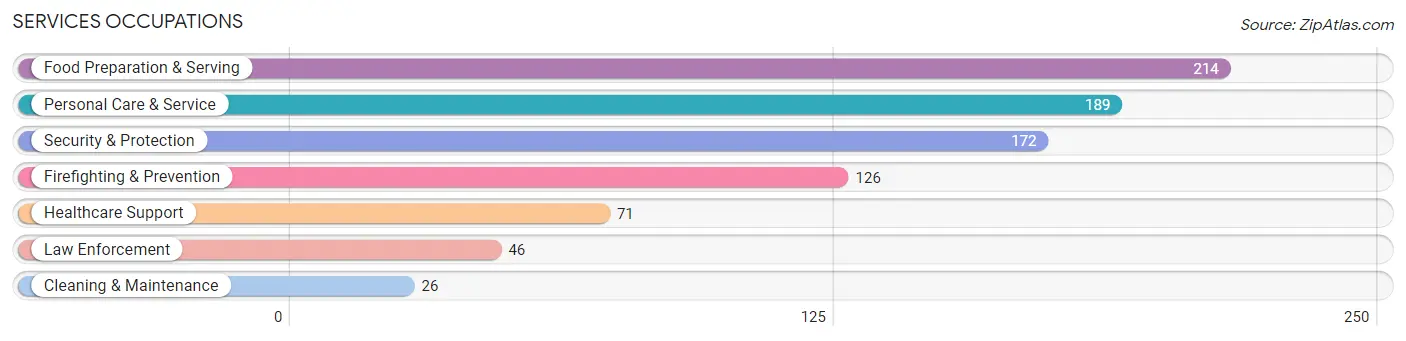
Services Occupations
The most common Services occupations in Highland Village are Food Preparation & Serving (214 | 2.6%), Personal Care & Service (189 | 2.3%), Security & Protection (172 | 2.1%), Firefighting & Prevention (126 | 1.5%), and Healthcare Support (71 | 0.9%).
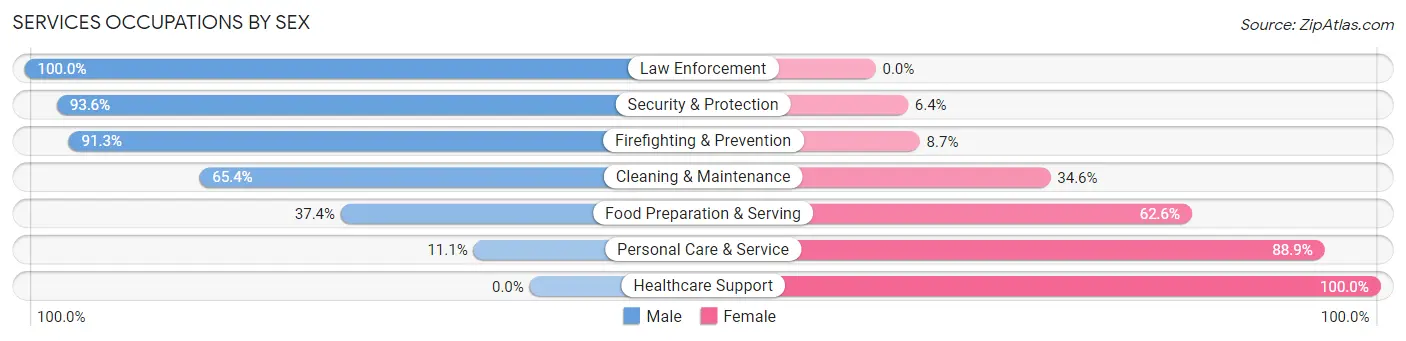
Services Occupations by Sex
Within the Services occupations in Highland Village, the most male-oriented occupations are Law Enforcement (100.0%), Security & Protection (93.6%), and Firefighting & Prevention (91.3%), while the most female-oriented occupations are Healthcare Support (100.0%), Personal Care & Service (88.9%), and Food Preparation & Serving (62.6%).
| Occupation | Male | Female |
| Healthcare Support | 0 (0.0%) | 71 (100.0%) |
| Security & Protection | 161 (93.6%) | 11 (6.4%) |
| Firefighting & Prevention | 115 (91.3%) | 11 (8.7%) |
| Law Enforcement | 46 (100.0%) | 0 (0.0%) |
| Food Preparation & Serving | 80 (37.4%) | 134 (62.6%) |
| Cleaning & Maintenance | 17 (65.4%) | 9 (34.6%) |
| Personal Care & Service | 21 (11.1%) | 168 (88.9%) |
| Total (Category) | 279 (41.5%) | 393 (58.5%) |
| Total (Overall) | 4,583 (55.3%) | 3,699 (44.7%) |
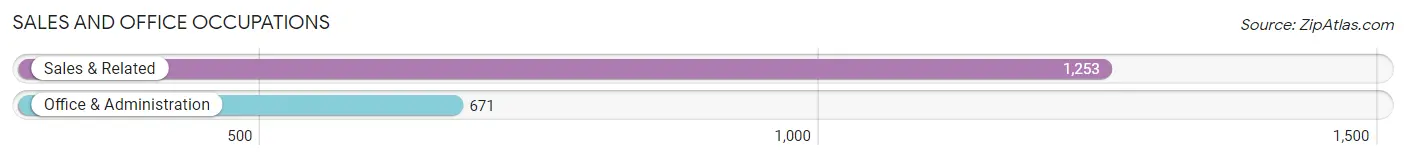
Sales and Office Occupations
The most common Sales and Office occupations in Highland Village are Sales & Related (1,253 | 15.1%), and Office & Administration (671 | 8.1%).
Sales and Office Occupations by Sex
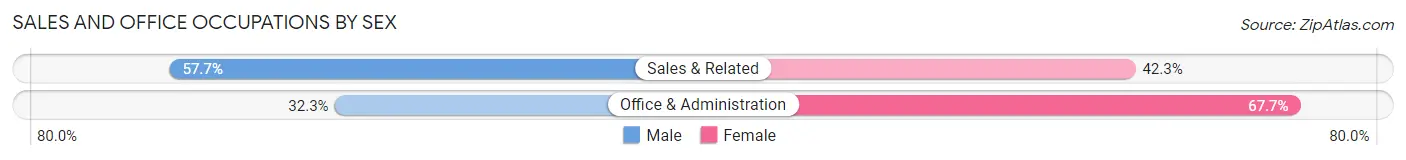
| Occupation | Male | Female |
| Sales & Related | 723 (57.7%) | 530 (42.3%) |
| Office & Administration | 217 (32.3%) | 454 (67.7%) |
| Total (Category) | 940 (48.9%) | 984 (51.1%) |
| Total (Overall) | 4,583 (55.3%) | 3,699 (44.7%) |
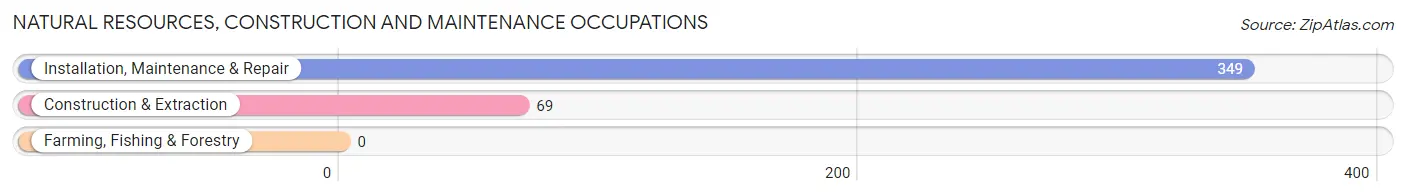
Natural Resources, Construction and Maintenance Occupations
The most common Natural Resources, Construction and Maintenance occupations in Highland Village are Installation, Maintenance & Repair (349 | 4.2%), and Construction & Extraction (69 | 0.8%).
Natural Resources, Construction and Maintenance Occupations by Sex
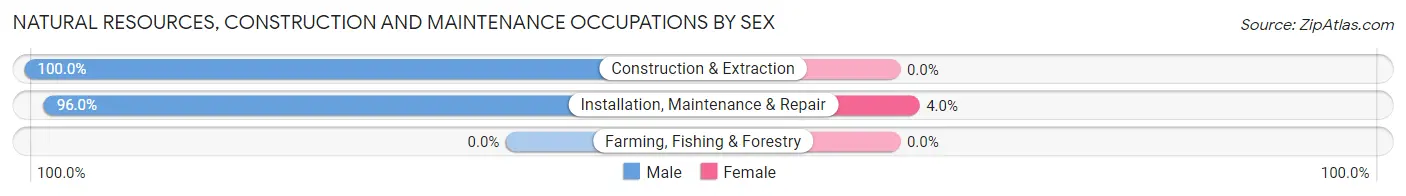
| Occupation | Male | Female |
| Farming, Fishing & Forestry | 0 (0.0%) | 0 (0.0%) |
| Construction & Extraction | 69 (100.0%) | 0 (0.0%) |
| Installation, Maintenance & Repair | 335 (96.0%) | 14 (4.0%) |
| Total (Category) | 404 (96.7%) | 14 (3.4%) |
| Total (Overall) | 4,583 (55.3%) | 3,699 (44.7%) |
Production, Transportation and Moving Occupations
The most common Production, Transportation and Moving occupations in Highland Village are Transportation (190 | 2.3%), Production (124 | 1.5%), and Material Moving (117 | 1.4%).
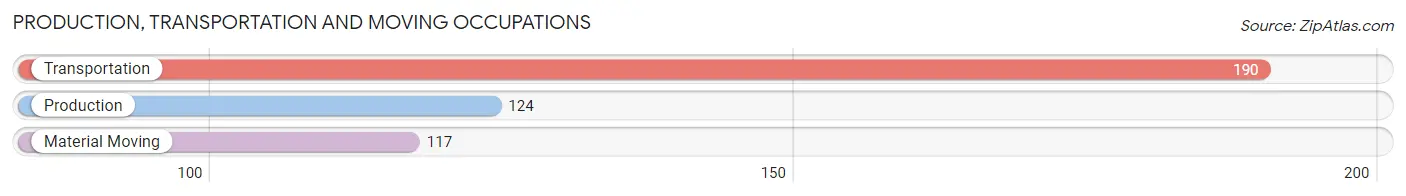
Production, Transportation and Moving Occupations by Sex
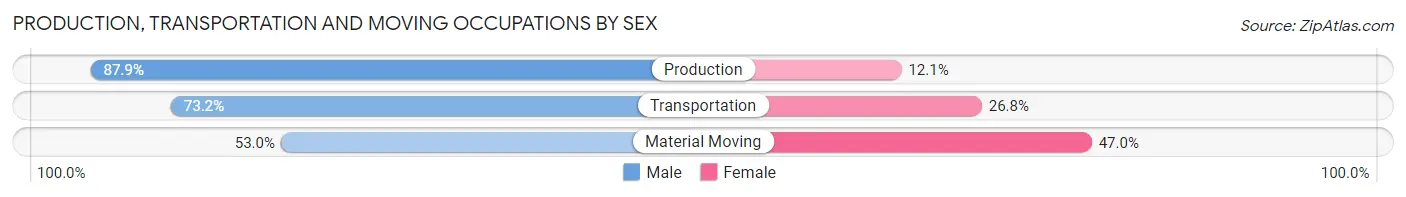
| Occupation | Male | Female |
| Production | 109 (87.9%) | 15 (12.1%) |
| Transportation | 139 (73.2%) | 51 (26.8%) |
| Material Moving | 62 (53.0%) | 55 (47.0%) |
| Total (Category) | 310 (71.9%) | 121 (28.1%) |
| Total (Overall) | 4,583 (55.3%) | 3,699 (44.7%) |
Employment Industries by Sex in Highland Village
Employment Industries in Highland Village
The major employment industries in Highland Village include Finance & Insurance (1,086 | 13.1%), Professional & Scientific (1,056 | 12.8%), Retail Trade (800 | 9.7%), Educational Services (690 | 8.3%), and Health Care & Social Assistance (621 | 7.5%).

Employment Industries by Sex in Highland Village
The Highland Village industries that see more men than women are Agriculture, Fishing & Hunting (100.0%), Mining, Quarrying, & Extraction (100.0%), and Utilities (100.0%), whereas the industries that tend to have a higher number of women are Health Care & Social Assistance (82.9%), Educational Services (81.5%), and Retail Trade (62.7%).
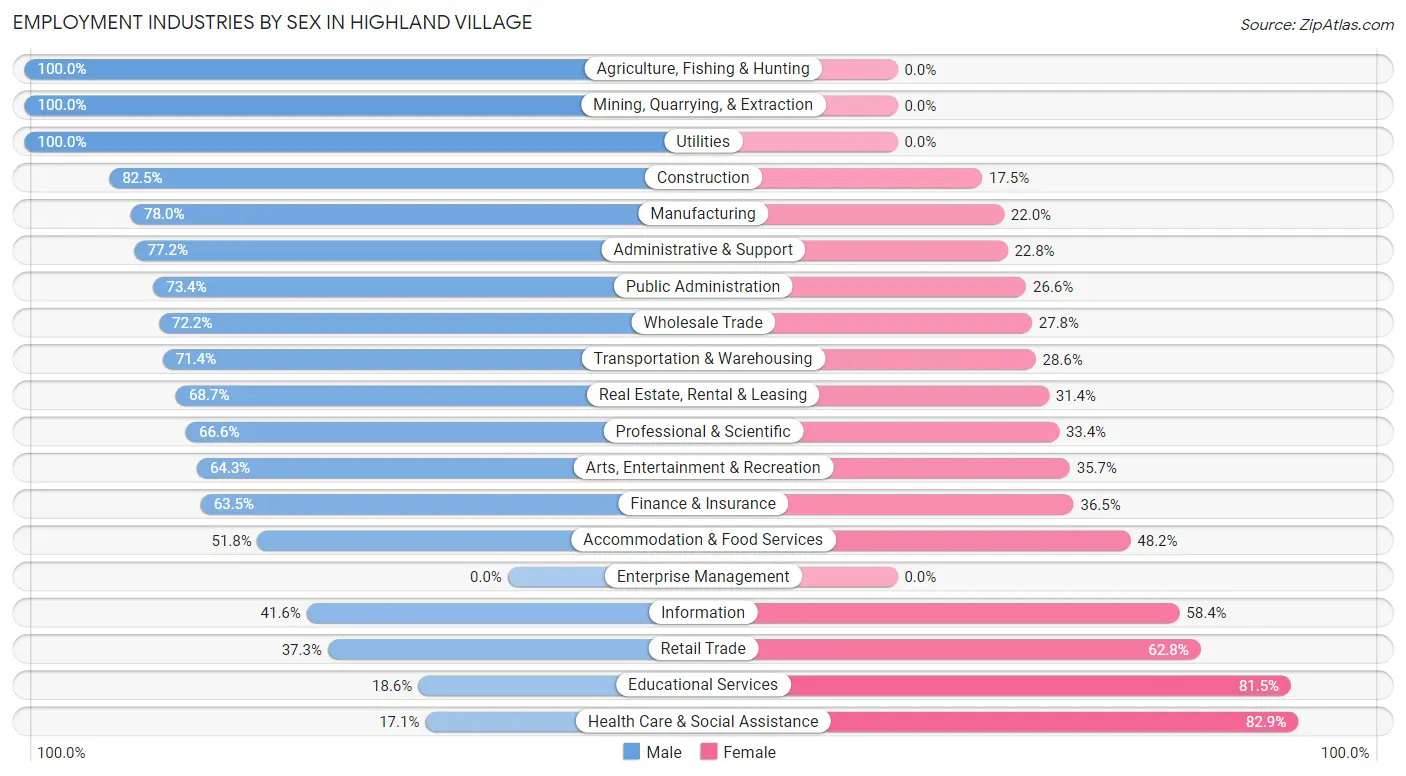
| Industry | Male | Female |
| Agriculture, Fishing & Hunting | 21 (100.0%) | 0 (0.0%) |
| Mining, Quarrying, & Extraction | 18 (100.0%) | 0 (0.0%) |
| Construction | 339 (82.5%) | 72 (17.5%) |
| Manufacturing | 435 (78.0%) | 123 (22.0%) |
| Wholesale Trade | 249 (72.2%) | 96 (27.8%) |
| Retail Trade | 298 (37.2%) | 502 (62.7%) |
| Transportation & Warehousing | 347 (71.4%) | 139 (28.6%) |
| Utilities | 27 (100.0%) | 0 (0.0%) |
| Information | 92 (41.6%) | 129 (58.4%) |
| Finance & Insurance | 690 (63.5%) | 396 (36.5%) |
| Real Estate, Rental & Leasing | 208 (68.6%) | 95 (31.4%) |
| Professional & Scientific | 703 (66.6%) | 353 (33.4%) |
| Enterprise Management | 0 (0.0%) | 0 (0.0%) |
| Administrative & Support | 173 (77.2%) | 51 (22.8%) |
| Educational Services | 128 (18.5%) | 562 (81.5%) |
| Health Care & Social Assistance | 106 (17.1%) | 515 (82.9%) |
| Arts, Entertainment & Recreation | 137 (64.3%) | 76 (35.7%) |
| Accommodation & Food Services | 204 (51.8%) | 190 (48.2%) |
| Public Administration | 157 (73.4%) | 57 (26.6%) |
| Total | 4,583 (55.3%) | 3,699 (44.7%) |
Education in Highland Village
School Enrollment in Highland Village
The most common levels of schooling among the 4,115 students in Highland Village are high school (1,415 | 34.4%), middle school (977 | 23.7%), and elementary school (743 | 18.1%).
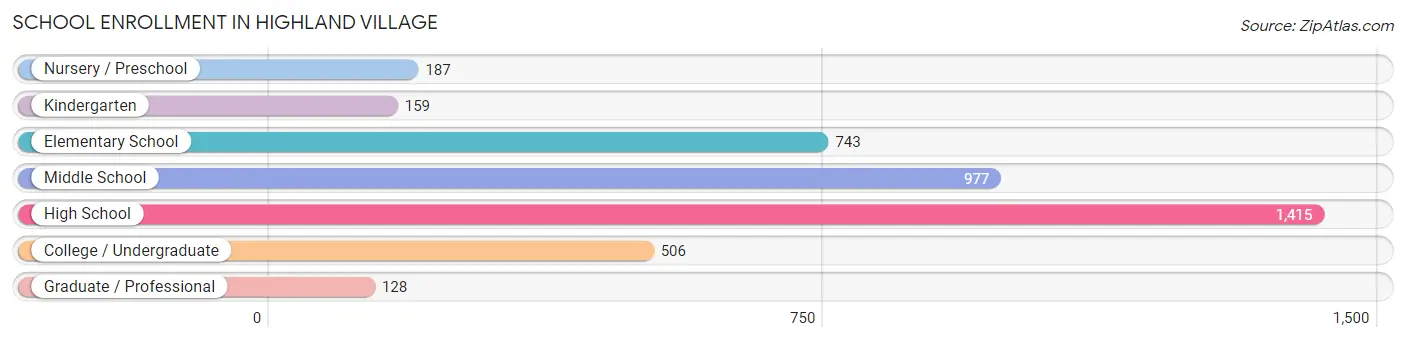
| School Level | # Students | % Students |
| Nursery / Preschool | 187 | 4.5% |
| Kindergarten | 159 | 3.9% |
| Elementary School | 743 | 18.1% |
| Middle School | 977 | 23.7% |
| High School | 1,415 | 34.4% |
| College / Undergraduate | 506 | 12.3% |
| Graduate / Professional | 128 | 3.1% |
| Total | 4,115 | 100.0% |
School Enrollment by Age by Funding Source in Highland Village
Out of a total of 4,115 students who are enrolled in schools in Highland Village, 498 (12.1%) attend a private institution, while the remaining 3,617 (87.9%) are enrolled in public schools. The age group of 3 to 4 year olds has the highest likelihood of being enrolled in private schools, with 97 (100.0% in the age bracket) enrolled. Conversely, the age group of 35 years and over has the lowest likelihood of being enrolled in a private school, with 108 (94.7% in the age bracket) attending a public institution.
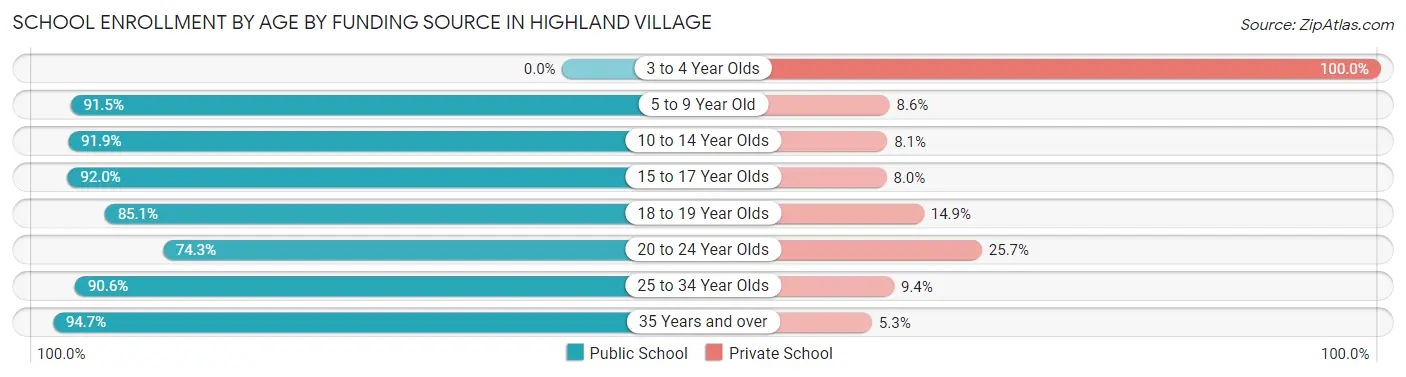
| Age Bracket | Public School | Private School |
| 3 to 4 Year Olds | 0 (0.0%) | 97 (100.0%) |
| 5 to 9 Year Old | 834 (91.4%) | 78 (8.6%) |
| 10 to 14 Year Olds | 1,031 (91.9%) | 91 (8.1%) |
| 15 to 17 Year Olds | 1,118 (92.0%) | 97 (8.0%) |
| 18 to 19 Year Olds | 188 (85.1%) | 33 (14.9%) |
| 20 to 24 Year Olds | 251 (74.3%) | 87 (25.7%) |
| 25 to 34 Year Olds | 87 (90.6%) | 9 (9.4%) |
| 35 Years and over | 108 (94.7%) | 6 (5.3%) |
| Total | 3,617 (87.9%) | 498 (12.1%) |
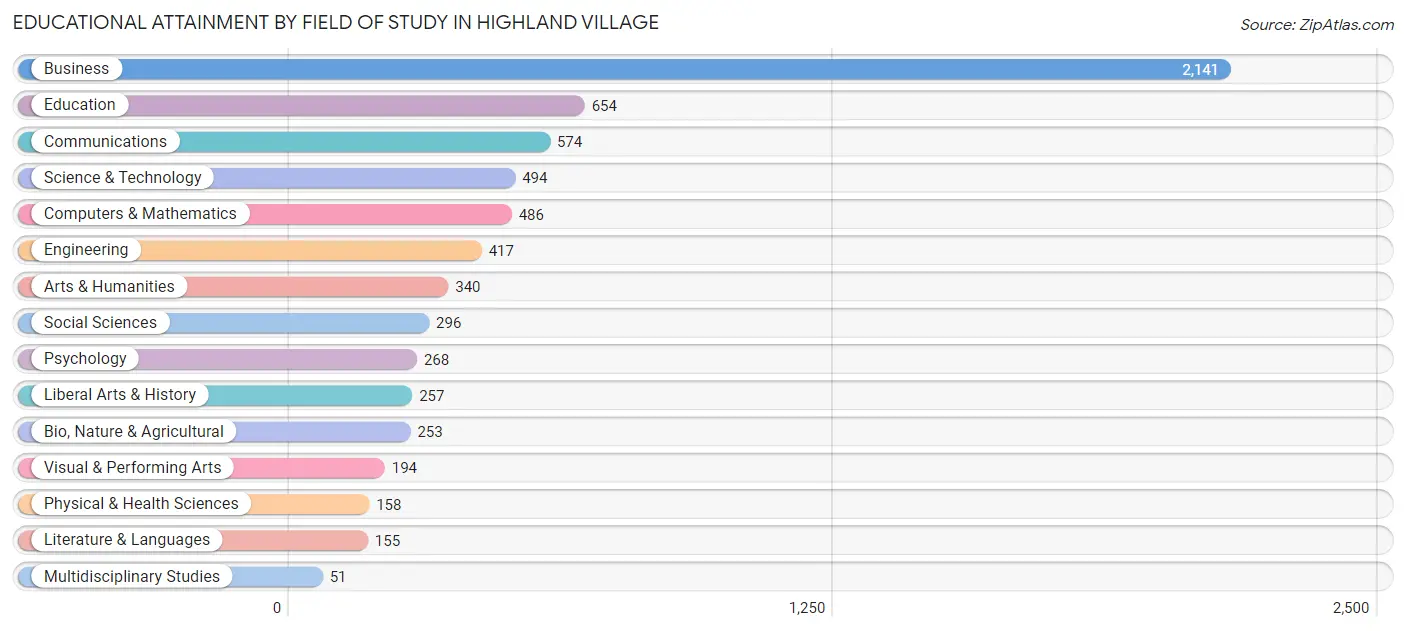
Educational Attainment by Field of Study in Highland Village
Business (2,141 | 31.8%), education (654 | 9.7%), communications (574 | 8.5%), science & technology (494 | 7.3%), and computers & mathematics (486 | 7.2%) are the most common fields of study among 6,738 individuals in Highland Village who have obtained a bachelor's degree or higher.
| Field of Study | # Graduates | % Graduates |
| Computers & Mathematics | 486 | 7.2% |
| Bio, Nature & Agricultural | 253 | 3.7% |
| Physical & Health Sciences | 158 | 2.3% |
| Psychology | 268 | 4.0% |
| Social Sciences | 296 | 4.4% |
| Engineering | 417 | 6.2% |
| Multidisciplinary Studies | 51 | 0.8% |
| Science & Technology | 494 | 7.3% |
| Business | 2,141 | 31.8% |
| Education | 654 | 9.7% |
| Literature & Languages | 155 | 2.3% |
| Liberal Arts & History | 257 | 3.8% |
| Visual & Performing Arts | 194 | 2.9% |
| Communications | 574 | 8.5% |
| Arts & Humanities | 340 | 5.1% |
| Total | 6,738 | 100.0% |
Transportation & Commute in Highland Village
Vehicle Availability by Sex in Highland Village
The most prevalent vehicle ownership categories in Highland Village are males with 2 vehicles (1,890, accounting for 41.8%) and females with 2 vehicles (1,420, making up 51.6%).
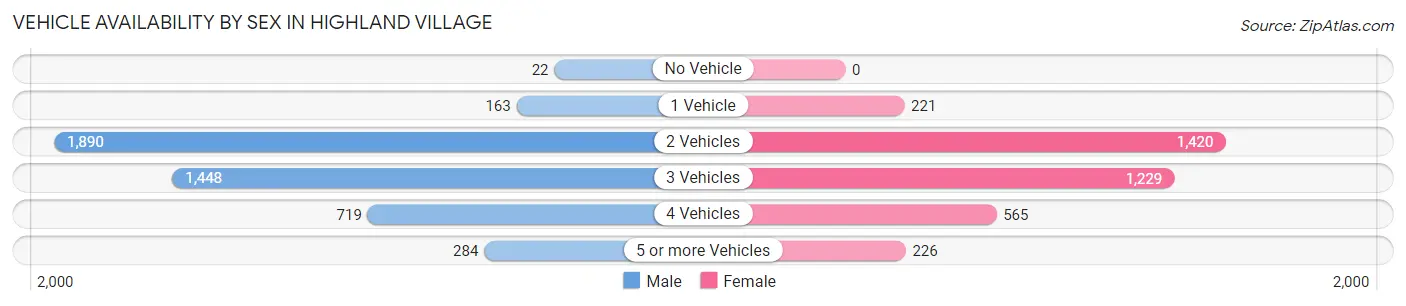
| Vehicles Available | Male | Female |
| No Vehicle | 22 (0.5%) | 0 (0.0%) |
| 1 Vehicle | 163 (3.6%) | 221 (6.0%) |
| 2 Vehicles | 1,890 (41.8%) | 1,420 (38.8%) |
| 3 Vehicles | 1,448 (32.0%) | 1,229 (33.6%) |
| 4 Vehicles | 719 (15.9%) | 565 (15.4%) |
| 5 or more Vehicles | 284 (6.3%) | 226 (6.2%) |
| Total | 4,526 (100.0%) | 3,661 (100.0%) |
Commute Time in Highland Village
The most frequently occuring commute durations in Highland Village are 30 to 34 minutes (1,416 commuters, 23.3%), 5 to 9 minutes (640 commuters, 10.5%), and 20 to 24 minutes (626 commuters, 10.3%).
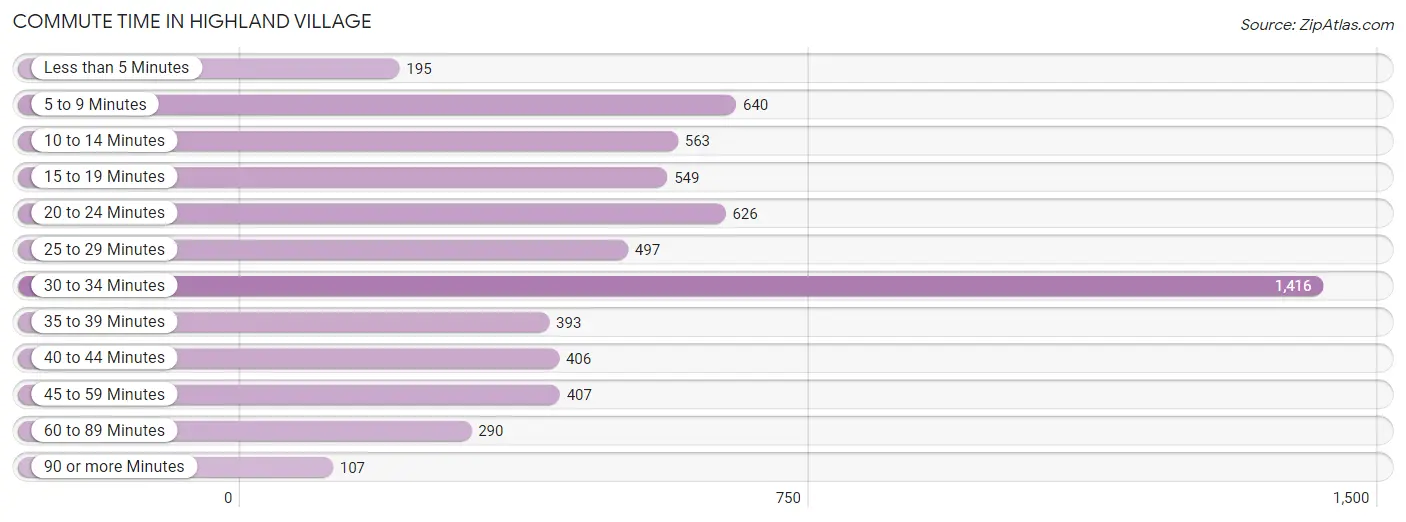
| Commute Time | # Commuters | % Commuters |
| Less than 5 Minutes | 195 | 3.2% |
| 5 to 9 Minutes | 640 | 10.5% |
| 10 to 14 Minutes | 563 | 9.2% |
| 15 to 19 Minutes | 549 | 9.0% |
| 20 to 24 Minutes | 626 | 10.3% |
| 25 to 29 Minutes | 497 | 8.2% |
| 30 to 34 Minutes | 1,416 | 23.3% |
| 35 to 39 Minutes | 393 | 6.5% |
| 40 to 44 Minutes | 406 | 6.7% |
| 45 to 59 Minutes | 407 | 6.7% |
| 60 to 89 Minutes | 290 | 4.8% |
| 90 or more Minutes | 107 | 1.8% |
Commute Time by Sex in Highland Village
The most common commute times in Highland Village are 30 to 34 minutes (887 commuters, 27.3%) for males and 30 to 34 minutes (529 commuters, 18.6%) for females.
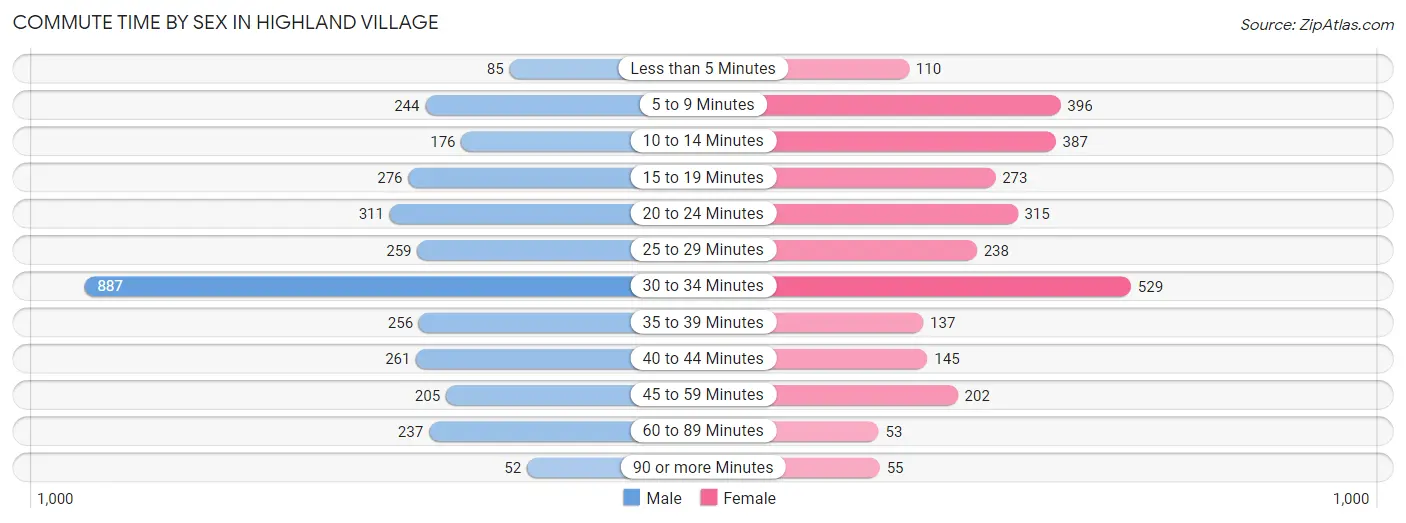
| Commute Time | Male | Female |
| Less than 5 Minutes | 85 (2.6%) | 110 (3.9%) |
| 5 to 9 Minutes | 244 (7.5%) | 396 (13.9%) |
| 10 to 14 Minutes | 176 (5.4%) | 387 (13.6%) |
| 15 to 19 Minutes | 276 (8.5%) | 273 (9.6%) |
| 20 to 24 Minutes | 311 (9.6%) | 315 (11.1%) |
| 25 to 29 Minutes | 259 (8.0%) | 238 (8.4%) |
| 30 to 34 Minutes | 887 (27.3%) | 529 (18.6%) |
| 35 to 39 Minutes | 256 (7.9%) | 137 (4.8%) |
| 40 to 44 Minutes | 261 (8.0%) | 145 (5.1%) |
| 45 to 59 Minutes | 205 (6.3%) | 202 (7.1%) |
| 60 to 89 Minutes | 237 (7.3%) | 53 (1.9%) |
| 90 or more Minutes | 52 (1.6%) | 55 (1.9%) |
Time of Departure to Work by Sex in Highland Village
The most frequent times of departure to work in Highland Village are 7:00 AM to 7:29 AM (520, 16.0%) for males and 8:00 AM to 8:29 AM (562, 19.8%) for females.
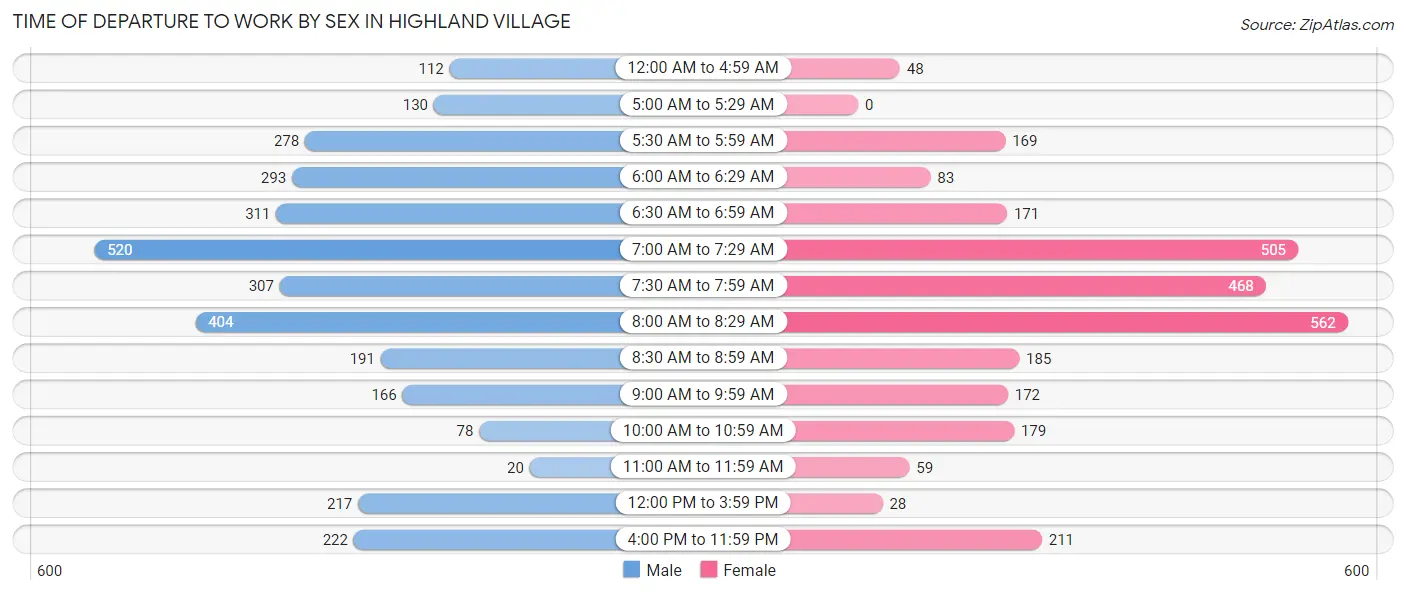
| Time of Departure | Male | Female |
| 12:00 AM to 4:59 AM | 112 (3.5%) | 48 (1.7%) |
| 5:00 AM to 5:29 AM | 130 (4.0%) | 0 (0.0%) |
| 5:30 AM to 5:59 AM | 278 (8.6%) | 169 (5.9%) |
| 6:00 AM to 6:29 AM | 293 (9.0%) | 83 (2.9%) |
| 6:30 AM to 6:59 AM | 311 (9.6%) | 171 (6.0%) |
| 7:00 AM to 7:29 AM | 520 (16.0%) | 505 (17.8%) |
| 7:30 AM to 7:59 AM | 307 (9.5%) | 468 (16.5%) |
| 8:00 AM to 8:29 AM | 404 (12.4%) | 562 (19.8%) |
| 8:30 AM to 8:59 AM | 191 (5.9%) | 185 (6.5%) |
| 9:00 AM to 9:59 AM | 166 (5.1%) | 172 (6.1%) |
| 10:00 AM to 10:59 AM | 78 (2.4%) | 179 (6.3%) |
| 11:00 AM to 11:59 AM | 20 (0.6%) | 59 (2.1%) |
| 12:00 PM to 3:59 PM | 217 (6.7%) | 28 (1.0%) |
| 4:00 PM to 11:59 PM | 222 (6.8%) | 211 (7.4%) |
| Total | 3,249 (100.0%) | 2,840 (100.0%) |
Housing Occupancy in Highland Village
Occupancy by Ownership in Highland Village
Of the total 5,316 dwellings in Highland Village, owner-occupied units account for 4,956 (93.2%), while renter-occupied units make up 360 (6.8%).
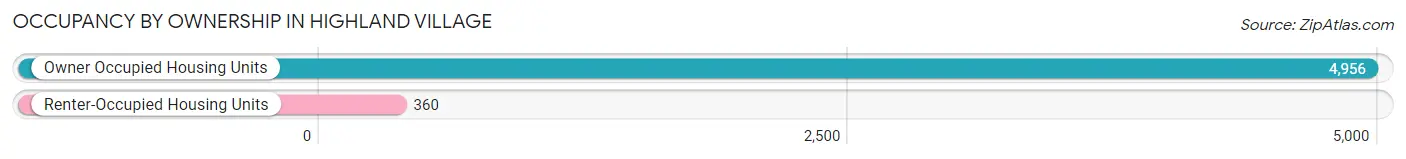
| Occupancy | # Housing Units | % Housing Units |
| Owner Occupied Housing Units | 4,956 | 93.2% |
| Renter-Occupied Housing Units | 360 | 6.8% |
| Total Occupied Housing Units | 5,316 | 100.0% |
Occupancy by Household Size in Highland Village
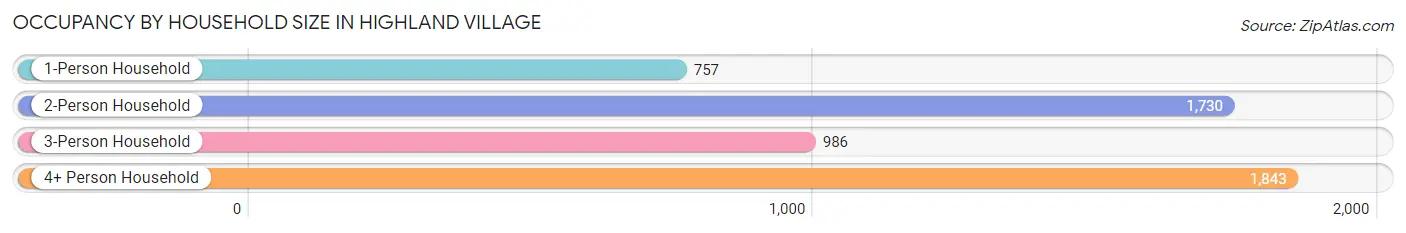
| Household Size | # Housing Units | % Housing Units |
| 1-Person Household | 757 | 14.2% |
| 2-Person Household | 1,730 | 32.5% |
| 3-Person Household | 986 | 18.5% |
| 4+ Person Household | 1,843 | 34.7% |
| Total Housing Units | 5,316 | 100.0% |
Occupancy by Ownership by Household Size in Highland Village
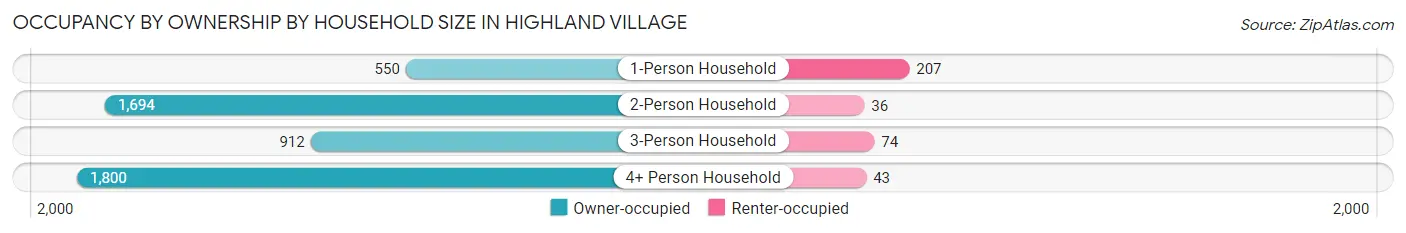
| Household Size | Owner-occupied | Renter-occupied |
| 1-Person Household | 550 (72.7%) | 207 (27.3%) |
| 2-Person Household | 1,694 (97.9%) | 36 (2.1%) |
| 3-Person Household | 912 (92.5%) | 74 (7.5%) |
| 4+ Person Household | 1,800 (97.7%) | 43 (2.3%) |
| Total Housing Units | 4,956 (93.2%) | 360 (6.8%) |
Occupancy by Educational Attainment in Highland Village
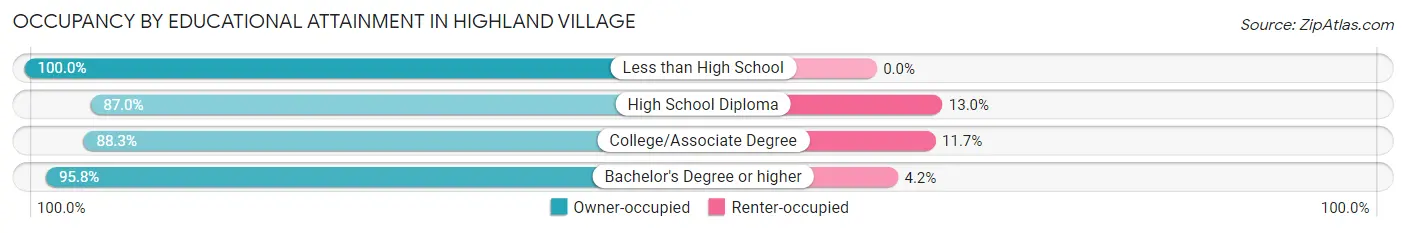
| Household Size | Owner-occupied | Renter-occupied |
| Less than High School | 41 (100.0%) | 0 (0.0%) |
| High School Diploma | 367 (87.0%) | 55 (13.0%) |
| College/Associate Degree | 1,179 (88.3%) | 156 (11.7%) |
| Bachelor's Degree or higher | 3,369 (95.8%) | 149 (4.2%) |
Occupancy by Age of Householder in Highland Village
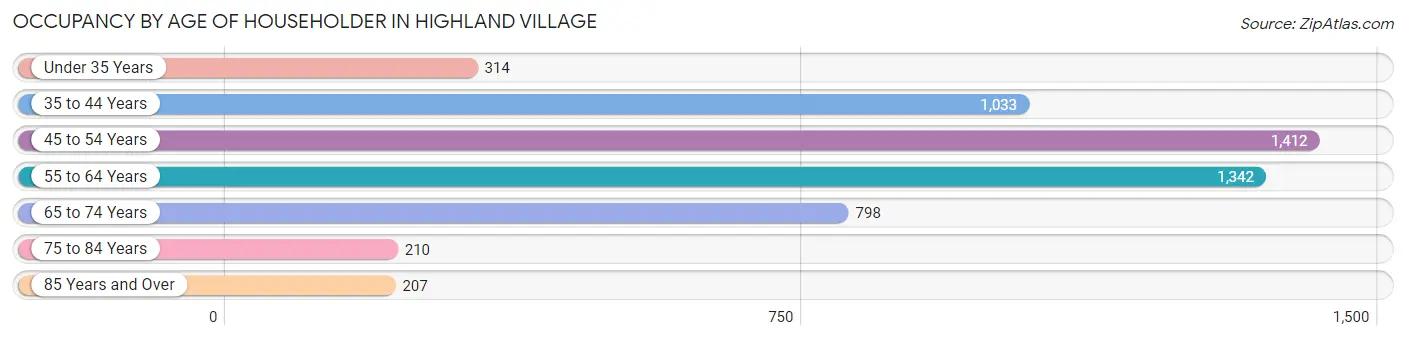
| Age Bracket | # Households | % Households |
| Under 35 Years | 314 | 5.9% |
| 35 to 44 Years | 1,033 | 19.4% |
| 45 to 54 Years | 1,412 | 26.6% |
| 55 to 64 Years | 1,342 | 25.2% |
| 65 to 74 Years | 798 | 15.0% |
| 75 to 84 Years | 210 | 4.0% |
| 85 Years and Over | 207 | 3.9% |
| Total | 5,316 | 100.0% |
Housing Finances in Highland Village
Median Income by Occupancy in Highland Village
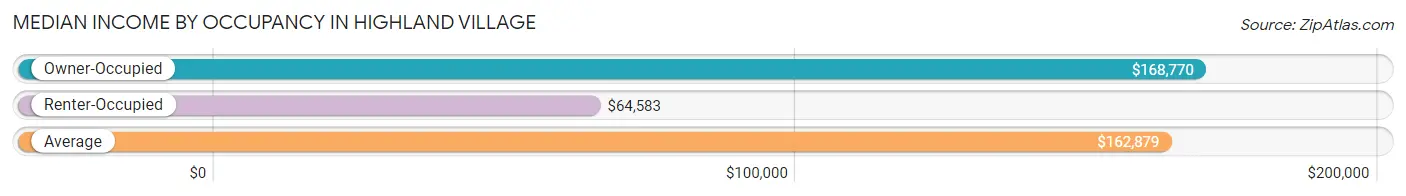
| Occupancy Type | # Households | Median Income |
| Owner-Occupied | 4,956 (93.2%) | $168,770 |
| Renter-Occupied | 360 (6.8%) | $64,583 |
| Average | 5,316 (100.0%) | $162,879 |
Occupancy by Householder Income Bracket in Highland Village
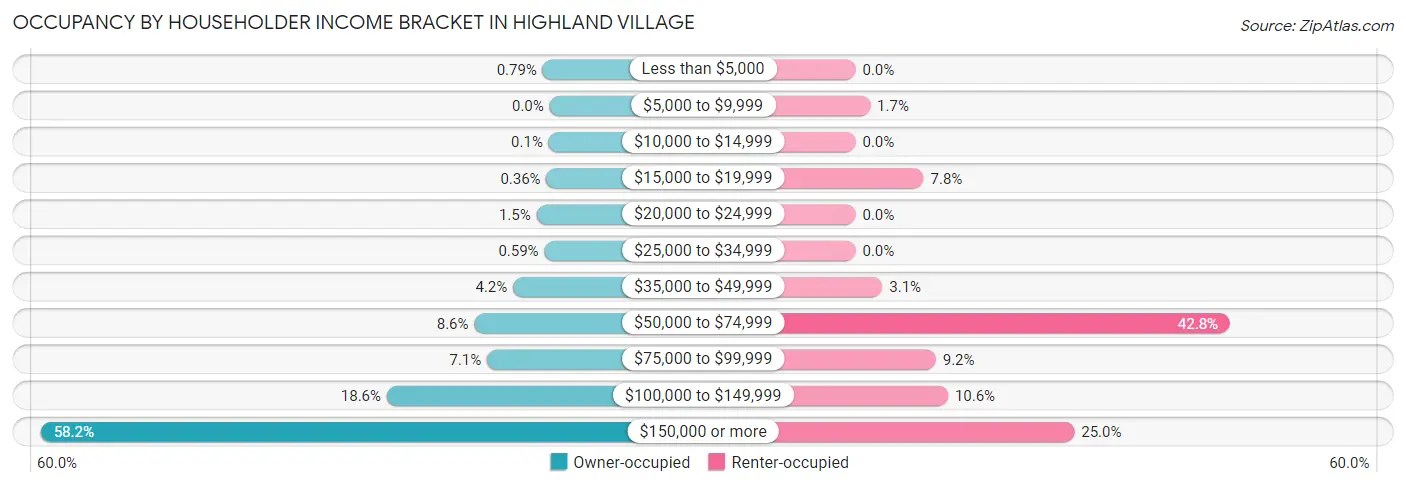
| Income Bracket | Owner-occupied | Renter-occupied |
| Less than $5,000 | 39 (0.8%) | 0 (0.0%) |
| $5,000 to $9,999 | 0 (0.0%) | 6 (1.7%) |
| $10,000 to $14,999 | 5 (0.1%) | 0 (0.0%) |
| $15,000 to $19,999 | 18 (0.4%) | 28 (7.8%) |
| $20,000 to $24,999 | 74 (1.5%) | 0 (0.0%) |
| $25,000 to $34,999 | 29 (0.6%) | 0 (0.0%) |
| $35,000 to $49,999 | 207 (4.2%) | 11 (3.1%) |
| $50,000 to $74,999 | 426 (8.6%) | 154 (42.8%) |
| $75,000 to $99,999 | 354 (7.1%) | 33 (9.2%) |
| $100,000 to $149,999 | 922 (18.6%) | 38 (10.6%) |
| $150,000 or more | 2,882 (58.2%) | 90 (25.0%) |
| Total | 4,956 (100.0%) | 360 (100.0%) |
Monthly Housing Cost Tiers in Highland Village
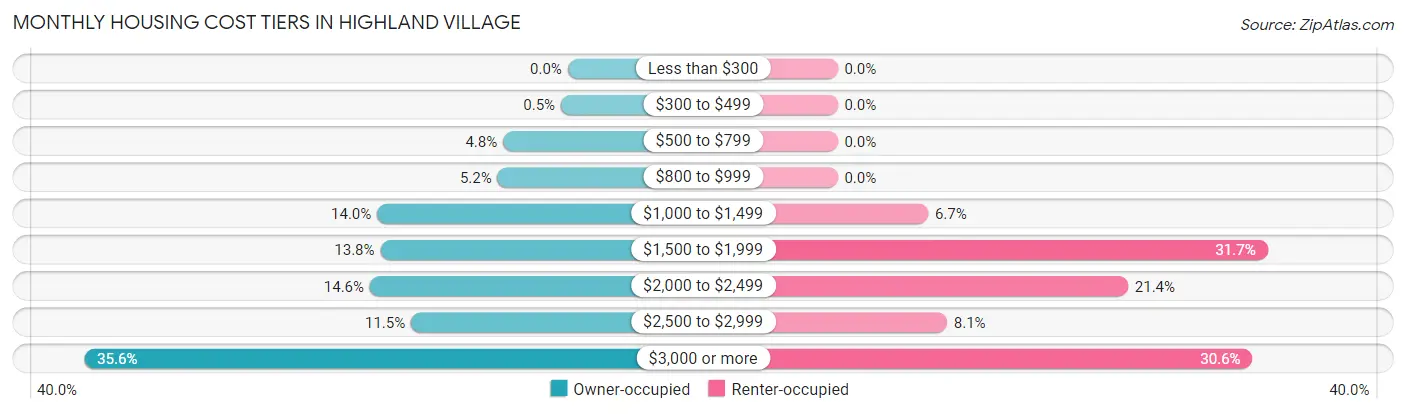
| Monthly Cost | Owner-occupied | Renter-occupied |
| Less than $300 | 0 (0.0%) | 0 (0.0%) |
| $300 to $499 | 25 (0.5%) | 0 (0.0%) |
| $500 to $799 | 236 (4.8%) | 0 (0.0%) |
| $800 to $999 | 256 (5.2%) | 0 (0.0%) |
| $1,000 to $1,499 | 696 (14.0%) | 24 (6.7%) |
| $1,500 to $1,999 | 684 (13.8%) | 114 (31.7%) |
| $2,000 to $2,499 | 722 (14.6%) | 77 (21.4%) |
| $2,500 to $2,999 | 572 (11.5%) | 29 (8.1%) |
| $3,000 or more | 1,765 (35.6%) | 110 (30.6%) |
| Total | 4,956 (100.0%) | 360 (100.0%) |
Physical Housing Characteristics in Highland Village
Housing Structures in Highland Village
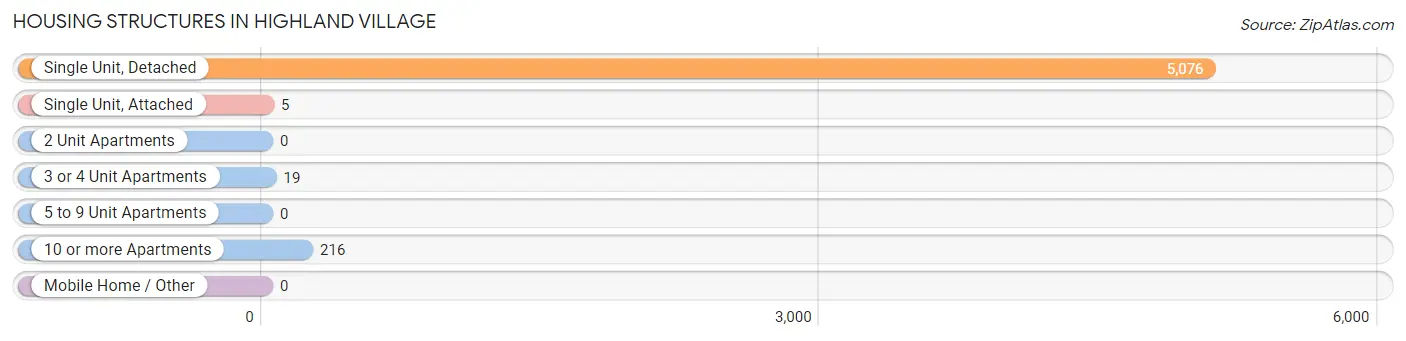
| Structure Type | # Housing Units | % Housing Units |
| Single Unit, Detached | 5,076 | 95.5% |
| Single Unit, Attached | 5 | 0.1% |
| 2 Unit Apartments | 0 | 0.0% |
| 3 or 4 Unit Apartments | 19 | 0.4% |
| 5 to 9 Unit Apartments | 0 | 0.0% |
| 10 or more Apartments | 216 | 4.1% |
| Mobile Home / Other | 0 | 0.0% |
| Total | 5,316 | 100.0% |
Housing Structures by Occupancy in Highland Village
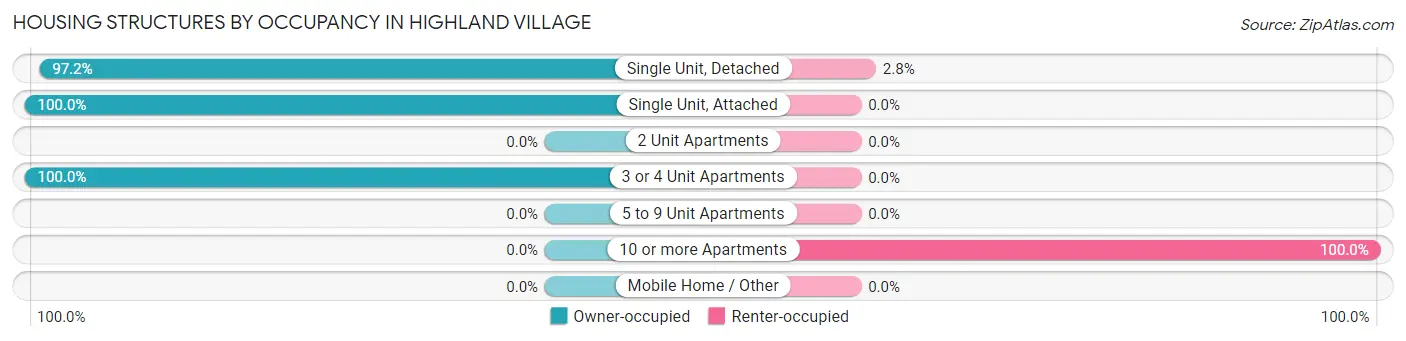
| Structure Type | Owner-occupied | Renter-occupied |
| Single Unit, Detached | 4,932 (97.2%) | 144 (2.8%) |
| Single Unit, Attached | 5 (100.0%) | 0 (0.0%) |
| 2 Unit Apartments | 0 (0.0%) | 0 (0.0%) |
| 3 or 4 Unit Apartments | 19 (100.0%) | 0 (0.0%) |
| 5 to 9 Unit Apartments | 0 (0.0%) | 0 (0.0%) |
| 10 or more Apartments | 0 (0.0%) | 216 (100.0%) |
| Mobile Home / Other | 0 (0.0%) | 0 (0.0%) |
| Total | 4,956 (93.2%) | 360 (6.8%) |
Housing Structures by Number of Rooms in Highland Village
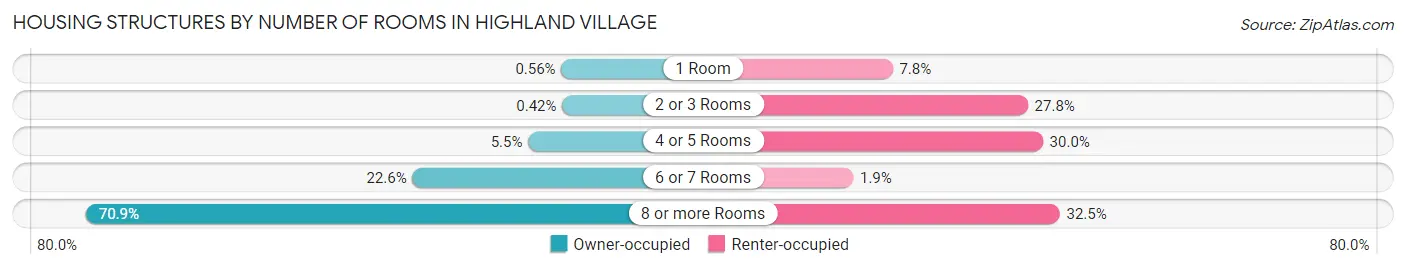
| Number of Rooms | Owner-occupied | Renter-occupied |
| 1 Room | 28 (0.6%) | 28 (7.8%) |
| 2 or 3 Rooms | 21 (0.4%) | 100 (27.8%) |
| 4 or 5 Rooms | 271 (5.5%) | 108 (30.0%) |
| 6 or 7 Rooms | 1,120 (22.6%) | 7 (1.9%) |
| 8 or more Rooms | 3,516 (70.9%) | 117 (32.5%) |
| Total | 4,956 (100.0%) | 360 (100.0%) |
Housing Structure by Heating Type in Highland Village
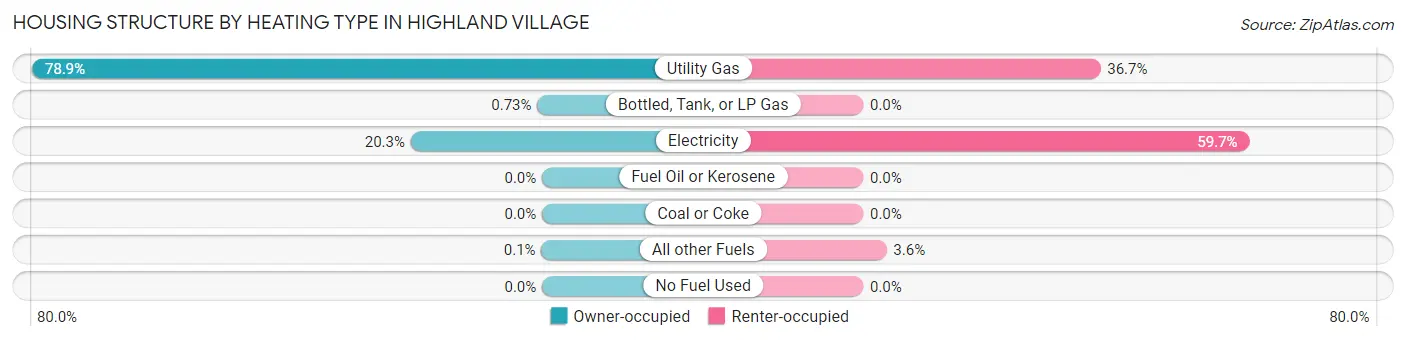
| Heating Type | Owner-occupied | Renter-occupied |
| Utility Gas | 3,909 (78.9%) | 132 (36.7%) |
| Bottled, Tank, or LP Gas | 36 (0.7%) | 0 (0.0%) |
| Electricity | 1,006 (20.3%) | 215 (59.7%) |
| Fuel Oil or Kerosene | 0 (0.0%) | 0 (0.0%) |
| Coal or Coke | 0 (0.0%) | 0 (0.0%) |
| All other Fuels | 5 (0.1%) | 13 (3.6%) |
| No Fuel Used | 0 (0.0%) | 0 (0.0%) |
| Total | 4,956 (100.0%) | 360 (100.0%) |
Household Vehicle Usage in Highland Village
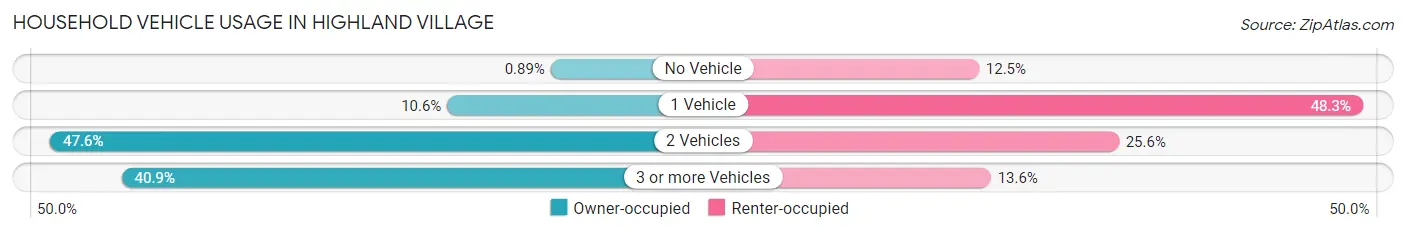
| Vehicles per Household | Owner-occupied | Renter-occupied |
| No Vehicle | 44 (0.9%) | 45 (12.5%) |
| 1 Vehicle | 523 (10.5%) | 174 (48.3%) |
| 2 Vehicles | 2,360 (47.6%) | 92 (25.6%) |
| 3 or more Vehicles | 2,029 (40.9%) | 49 (13.6%) |
| Total | 4,956 (100.0%) | 360 (100.0%) |
Real Estate & Mortgages in Highland Village
Real Estate and Mortgage Overview in Highland Village
| Characteristic | Without Mortgage | With Mortgage |
| Housing Units | 1,351 | 3,605 |
| Median Property Value | $423,900 | $471,200 |
| Median Household Income | $126,375 | $2,295 |
| Monthly Housing Costs | $1,109 | $1,765 |
| Real Estate Taxes | $7,039 | $20 |
Property Value by Mortgage Status in Highland Village
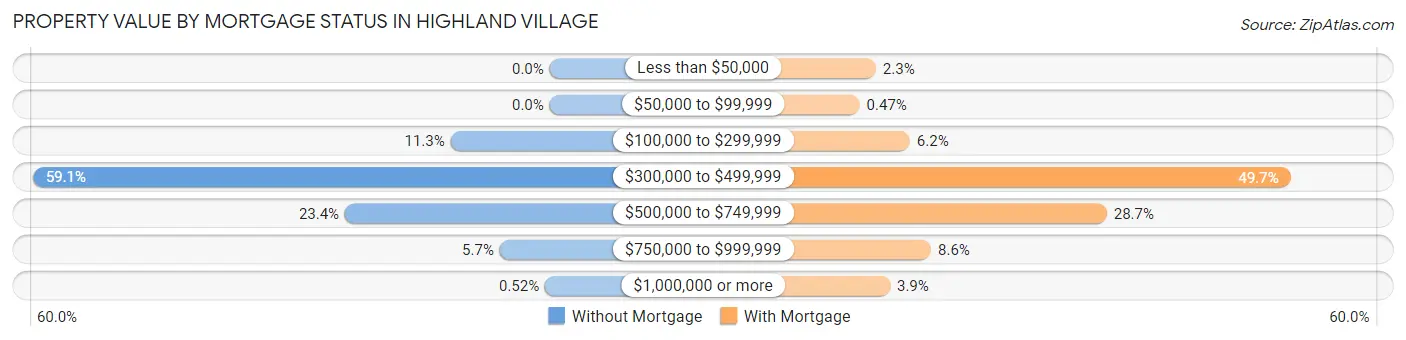
| Property Value | Without Mortgage | With Mortgage |
| Less than $50,000 | 0 (0.0%) | 84 (2.3%) |
| $50,000 to $99,999 | 0 (0.0%) | 17 (0.5%) |
| $100,000 to $299,999 | 153 (11.3%) | 224 (6.2%) |
| $300,000 to $499,999 | 798 (59.1%) | 1,792 (49.7%) |
| $500,000 to $749,999 | 316 (23.4%) | 1,035 (28.7%) |
| $750,000 to $999,999 | 77 (5.7%) | 311 (8.6%) |
| $1,000,000 or more | 7 (0.5%) | 142 (3.9%) |
| Total | 1,351 (100.0%) | 3,605 (100.0%) |
Household Income by Mortgage Status in Highland Village
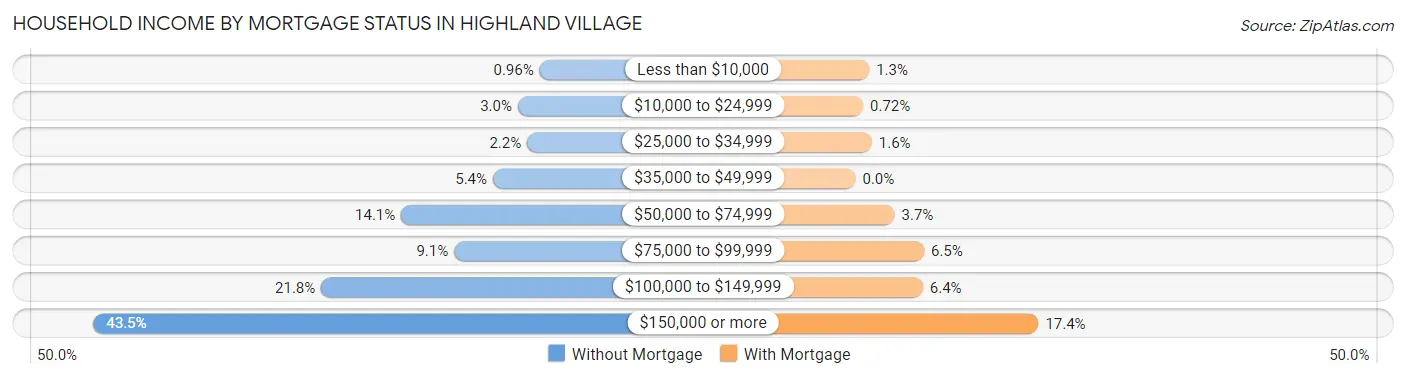
| Household Income | Without Mortgage | With Mortgage |
| Less than $10,000 | 13 (1.0%) | 47 (1.3%) |
| $10,000 to $24,999 | 41 (3.0%) | 26 (0.7%) |
| $25,000 to $34,999 | 29 (2.1%) | 56 (1.5%) |
| $35,000 to $49,999 | 73 (5.4%) | 0 (0.0%) |
| $50,000 to $74,999 | 191 (14.1%) | 134 (3.7%) |
| $75,000 to $99,999 | 123 (9.1%) | 235 (6.5%) |
| $100,000 to $149,999 | 294 (21.8%) | 231 (6.4%) |
| $150,000 or more | 587 (43.4%) | 628 (17.4%) |
| Total | 1,351 (100.0%) | 3,605 (100.0%) |
Property Value to Household Income Ratio in Highland Village
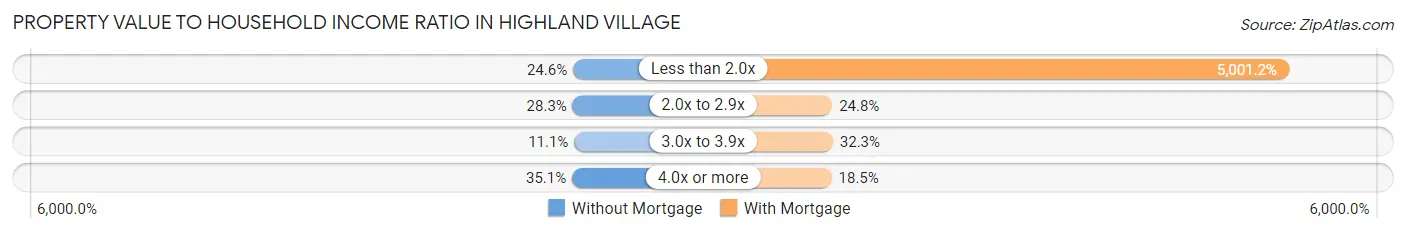
| Value-to-Income Ratio | Without Mortgage | With Mortgage |
| Less than 2.0x | 332 (24.6%) | 180,294 (5,001.2%) |
| 2.0x to 2.9x | 382 (28.3%) | 894 (24.8%) |
| 3.0x to 3.9x | 150 (11.1%) | 1,163 (32.3%) |
| 4.0x or more | 474 (35.1%) | 666 (18.5%) |
| Total | 1,351 (100.0%) | 3,605 (100.0%) |
Real Estate Taxes by Mortgage Status in Highland Village
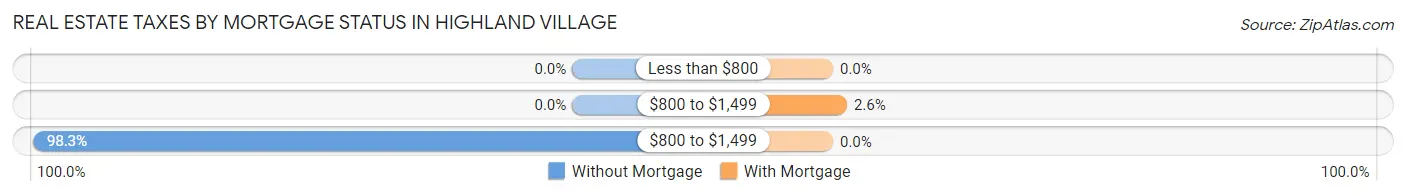
| Property Taxes | Without Mortgage | With Mortgage |
| Less than $800 | 0 (0.0%) | 0 (0.0%) |
| $800 to $1,499 | 0 (0.0%) | 92 (2.5%) |
| $800 to $1,499 | 1,328 (98.3%) | 0 (0.0%) |
| Total | 1,351 (100.0%) | 3,605 (100.0%) |
Health & Disability in Highland Village
Health Insurance Coverage by Age in Highland Village
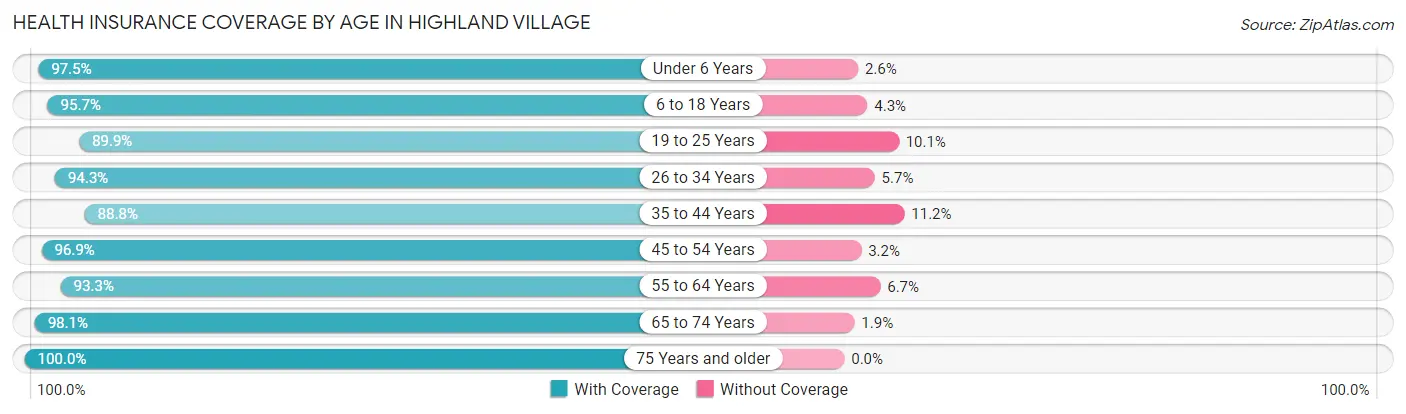
| Age Bracket | With Coverage | Without Coverage |
| Under 6 Years | 878 (97.5%) | 23 (2.5%) |
| 6 to 18 Years | 3,158 (95.7%) | 142 (4.3%) |
| 19 to 25 Years | 833 (89.9%) | 94 (10.1%) |
| 26 to 34 Years | 917 (94.3%) | 55 (5.7%) |
| 35 to 44 Years | 2,037 (88.8%) | 257 (11.2%) |
| 45 to 54 Years | 2,703 (96.9%) | 88 (3.2%) |
| 55 to 64 Years | 2,224 (93.3%) | 160 (6.7%) |
| 65 to 74 Years | 1,555 (98.1%) | 30 (1.9%) |
| 75 Years and older | 672 (100.0%) | 0 (0.0%) |
| Total | 14,977 (94.6%) | 849 (5.4%) |
Health Insurance Coverage by Citizenship Status in Highland Village
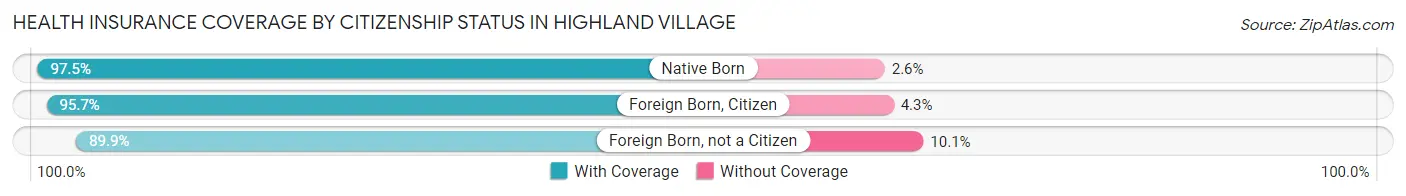
| Citizenship Status | With Coverage | Without Coverage |
| Native Born | 878 (97.5%) | 23 (2.5%) |
| Foreign Born, Citizen | 3,158 (95.7%) | 142 (4.3%) |
| Foreign Born, not a Citizen | 833 (89.9%) | 94 (10.1%) |
Health Insurance Coverage by Household Income in Highland Village
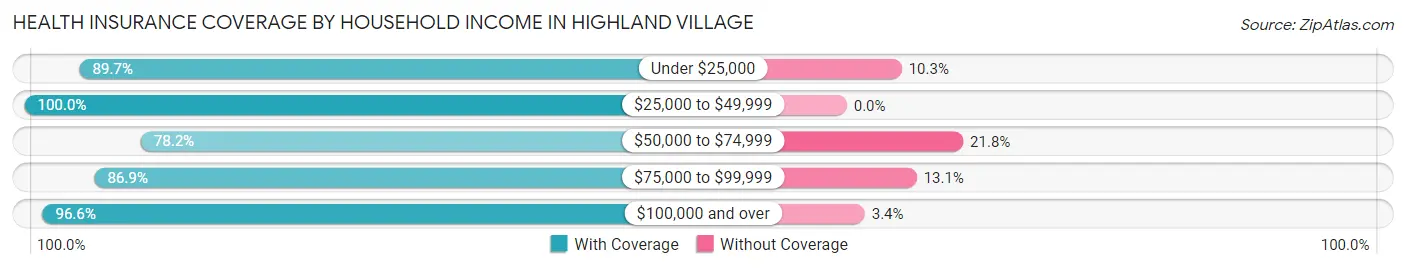
| Household Income | With Coverage | Without Coverage |
| Under $25,000 | 279 (89.7%) | 32 (10.3%) |
| $25,000 to $49,999 | 475 (100.0%) | 0 (0.0%) |
| $50,000 to $74,999 | 861 (78.2%) | 240 (21.8%) |
| $75,000 to $99,999 | 955 (86.9%) | 144 (13.1%) |
| $100,000 and over | 12,398 (96.6%) | 433 (3.4%) |
Public vs Private Health Insurance Coverage by Age in Highland Village
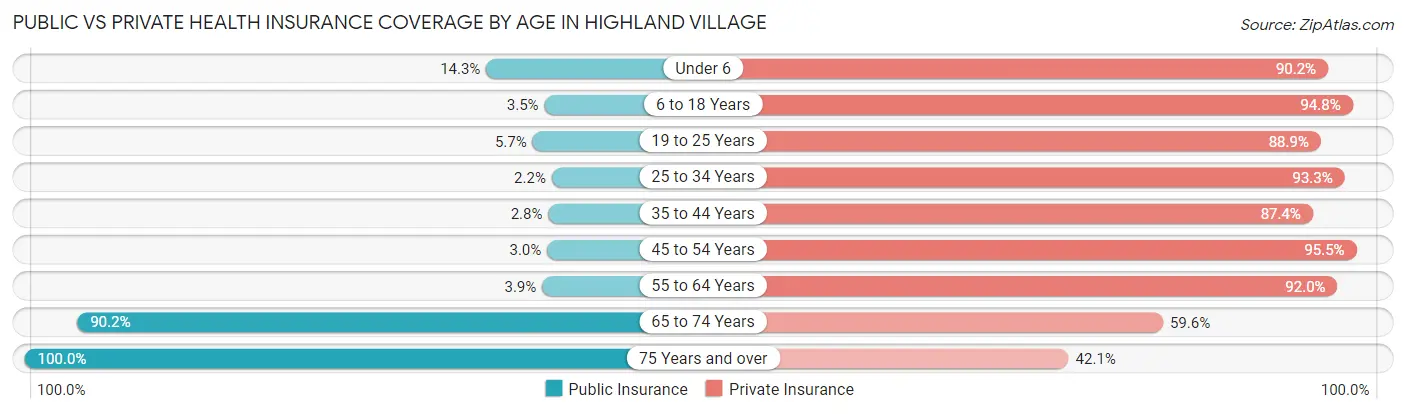
| Age Bracket | Public Insurance | Private Insurance |
| Under 6 | 129 (14.3%) | 813 (90.2%) |
| 6 to 18 Years | 116 (3.5%) | 3,128 (94.8%) |
| 19 to 25 Years | 53 (5.7%) | 824 (88.9%) |
| 25 to 34 Years | 21 (2.2%) | 907 (93.3%) |
| 35 to 44 Years | 64 (2.8%) | 2,005 (87.4%) |
| 45 to 54 Years | 84 (3.0%) | 2,666 (95.5%) |
| 55 to 64 Years | 94 (3.9%) | 2,193 (92.0%) |
| 65 to 74 Years | 1,430 (90.2%) | 945 (59.6%) |
| 75 Years and over | 672 (100.0%) | 283 (42.1%) |
| Total | 2,663 (16.8%) | 13,764 (87.0%) |
Disability Status by Sex by Age in Highland Village
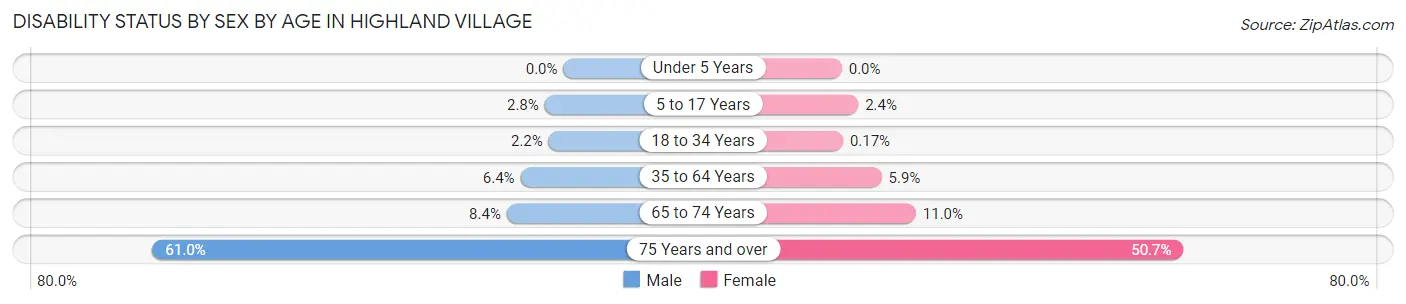
| Age Bracket | Male | Female |
| Under 5 Years | 0 (0.0%) | 0 (0.0%) |
| 5 to 17 Years | 56 (2.8%) | 32 (2.4%) |
| 18 to 34 Years | 20 (2.2%) | 2 (0.2%) |
| 35 to 64 Years | 245 (6.4%) | 214 (5.9%) |
| 65 to 74 Years | 63 (8.4%) | 92 (11.0%) |
| 75 Years and over | 191 (61.0%) | 182 (50.7%) |
Disability Class by Sex by Age in Highland Village
Disability Class: Hearing Difficulty
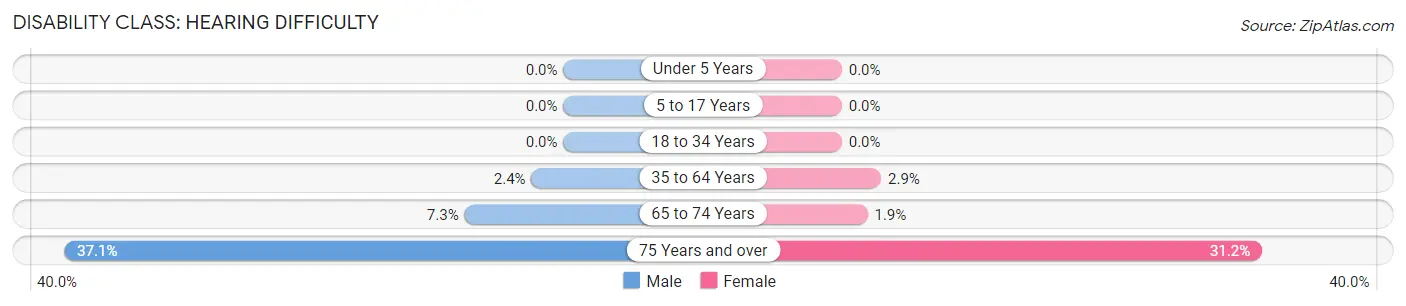
| Age Bracket | Male | Female |
| Under 5 Years | 0 (0.0%) | 0 (0.0%) |
| 5 to 17 Years | 0 (0.0%) | 0 (0.0%) |
| 18 to 34 Years | 0 (0.0%) | 0 (0.0%) |
| 35 to 64 Years | 91 (2.4%) | 106 (2.9%) |
| 65 to 74 Years | 55 (7.3%) | 16 (1.9%) |
| 75 Years and over | 116 (37.1%) | 112 (31.2%) |
Disability Class: Vision Difficulty
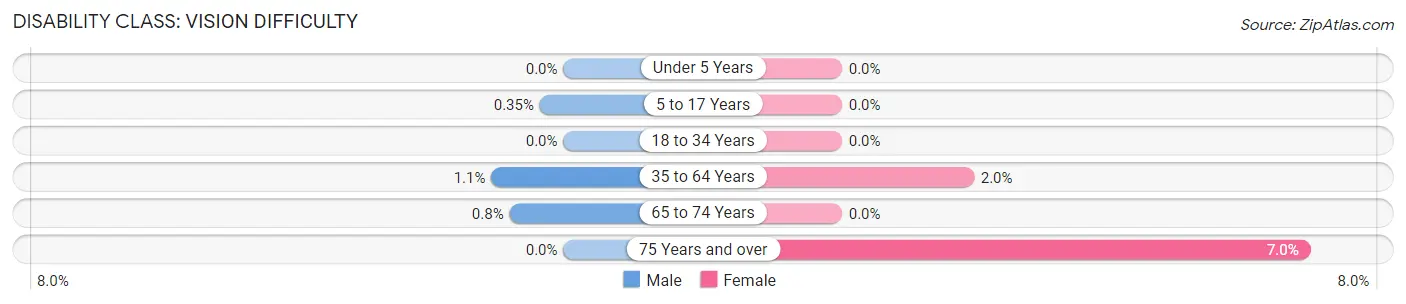
| Age Bracket | Male | Female |
| Under 5 Years | 0 (0.0%) | 0 (0.0%) |
| 5 to 17 Years | 7 (0.4%) | 0 (0.0%) |
| 18 to 34 Years | 0 (0.0%) | 0 (0.0%) |
| 35 to 64 Years | 41 (1.1%) | 71 (2.0%) |
| 65 to 74 Years | 6 (0.8%) | 0 (0.0%) |
| 75 Years and over | 0 (0.0%) | 25 (7.0%) |
Disability Class: Cognitive Difficulty
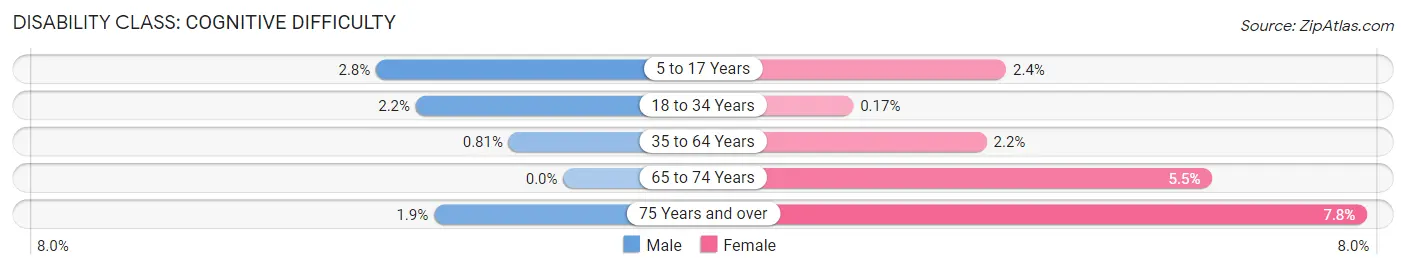
| Age Bracket | Male | Female |
| 5 to 17 Years | 56 (2.8%) | 32 (2.4%) |
| 18 to 34 Years | 20 (2.2%) | 2 (0.2%) |
| 35 to 64 Years | 31 (0.8%) | 78 (2.1%) |
| 65 to 74 Years | 0 (0.0%) | 46 (5.5%) |
| 75 Years and over | 6 (1.9%) | 28 (7.8%) |
Disability Class: Ambulatory Difficulty
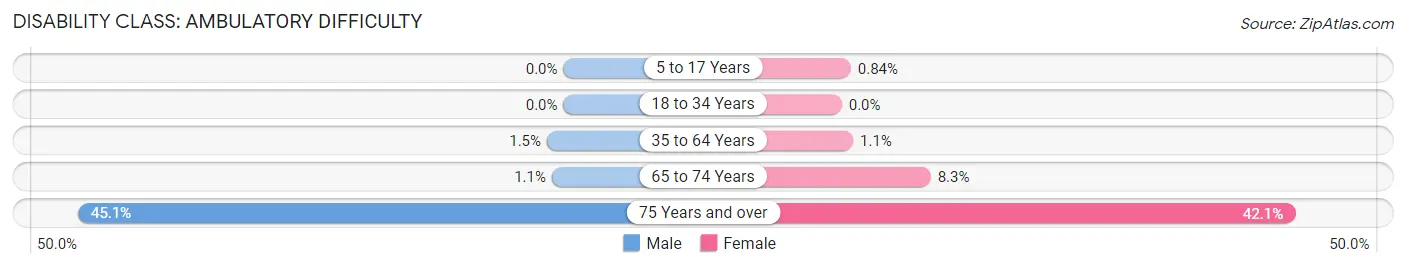
| Age Bracket | Male | Female |
| 5 to 17 Years | 0 (0.0%) | 11 (0.8%) |
| 18 to 34 Years | 0 (0.0%) | 0 (0.0%) |
| 35 to 64 Years | 59 (1.5%) | 38 (1.1%) |
| 65 to 74 Years | 8 (1.1%) | 69 (8.3%) |
| 75 Years and over | 141 (45.1%) | 151 (42.1%) |
Disability Class: Self-Care Difficulty
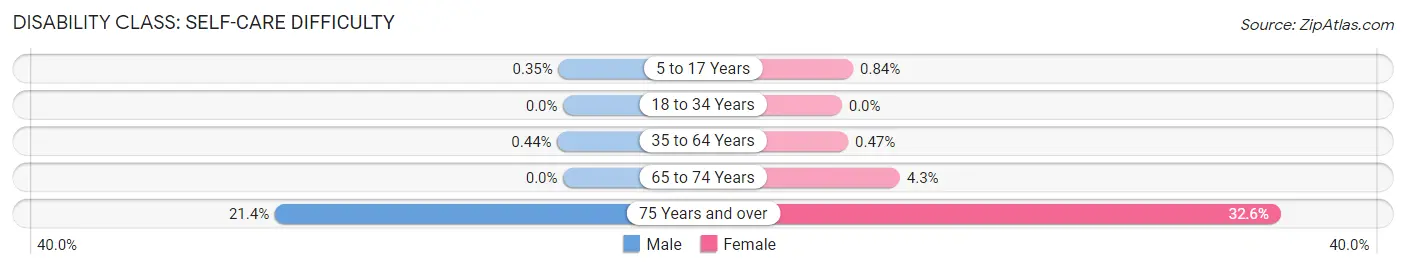
| Age Bracket | Male | Female |
| 5 to 17 Years | 7 (0.4%) | 11 (0.8%) |
| 18 to 34 Years | 0 (0.0%) | 0 (0.0%) |
| 35 to 64 Years | 17 (0.4%) | 17 (0.5%) |
| 65 to 74 Years | 0 (0.0%) | 36 (4.3%) |
| 75 Years and over | 67 (21.4%) | 117 (32.6%) |
Technology Access in Highland Village
Computing Device Access in Highland Village
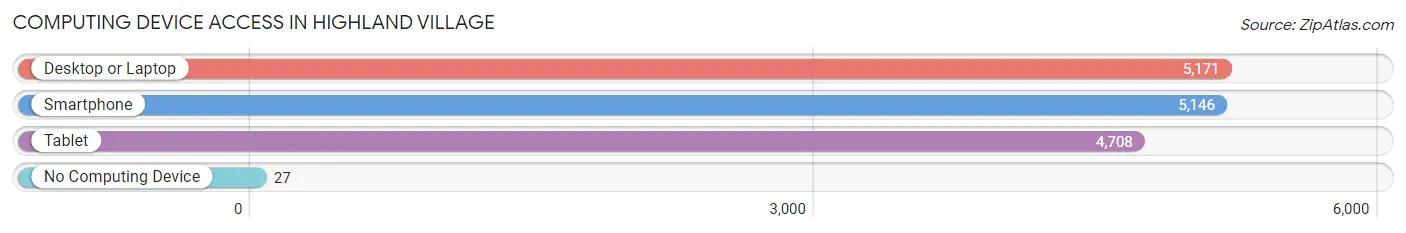
| Device Type | # Households | % Households |
| Desktop or Laptop | 5,171 | 97.3% |
| Smartphone | 5,146 | 96.8% |
| Tablet | 4,708 | 88.6% |
| No Computing Device | 27 | 0.5% |
| Total | 5,316 | 100.0% |
Internet Access in Highland Village
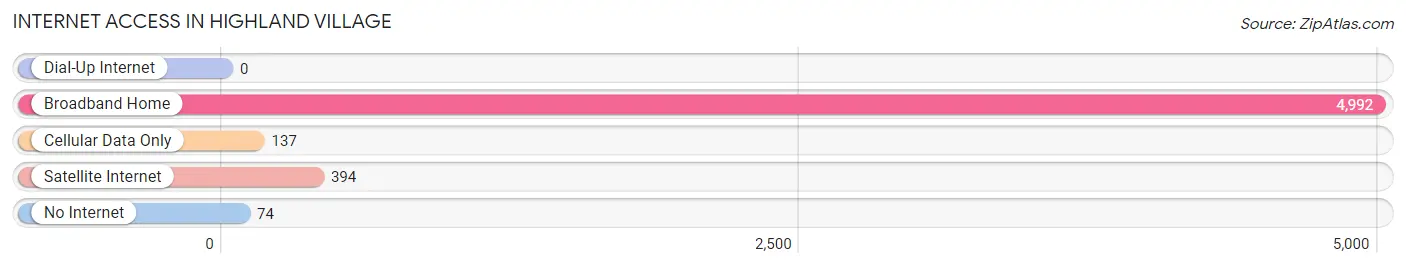
| Internet Type | # Households | % Households |
| Dial-Up Internet | 0 | 0.0% |
| Broadband Home | 4,992 | 93.9% |
| Cellular Data Only | 137 | 2.6% |
| Satellite Internet | 394 | 7.4% |
| No Internet | 74 | 1.4% |
| Total | 5,316 | 100.0% |
Highland Village Summary
Highland Village is a city located in Denton County, Texas, United States. It is a suburb of Dallas and Fort Worth and is part of the Dallas-Fort Worth-Arlington metropolitan area. The population was 15,056 at the 2010 census.
Geography
Highland Village is located at 33°05'25" North, 97°05'45" West (33.0903, -97.0958). It is situated on the north shore of Lake Lewisville, and is bordered by Flower Mound to the north, Double Oak to the east, Copper Canyon to the south, and Lewisville to the west.
According to the United States Census Bureau, the city has a total area of 8.2 square miles, of which 8.1 square miles is land and 0.1 square miles (1.25%) is water.
History
Highland Village was founded in the late 1950s by a group of developers from Dallas. The city was incorporated in 1963 and has grown steadily since then.
The city was named after the Highland Park neighborhood of Dallas, which was developed in the early 1900s. The city was originally intended to be a residential community, but has since grown to include a variety of businesses and services.
Economy
Highland Village is home to a variety of businesses and services. The city is home to several large retail stores, including Target, Home Depot, and Best Buy. The city also has a variety of restaurants, including several chain restaurants.
The city is also home to several corporate offices, including the headquarters of the American Heart Association and the corporate offices of the Dallas Cowboys.
Demographics
As of the 2010 census, there were 15,056 people, 5,717 households, and 4,541 families residing in the city. The population density was 1,845.2 people per square mile. There were 6,072 housing units at an average density of 748.3 per square mile.
The racial makeup of the city was 84.2% White, 5.2% African American, 0.4% Native American, 4.2% Asian, 0.1% Pacific Islander, 4.2% from other races, and 1.9% from two or more races. Hispanic or Latino of any race were 11.2% of the population.
There were 5,717 households, out of which 37.2% had children under the age of 18 living with them, 68.2% were married couples living together, 7.2% had a female householder with no husband present, and 21.3% were non-families. 17.2% of all households were made up of individuals, and 5.2% had someone living alone who was 65 years of age or older. The average household size was 2.62 and the average family size was 2.98.
In the city, the population was spread out, with 25.7% under the age of 18, 6.2% from 18 to 24, 28.2% from 25 to 44, 30.2% from 45 to 64, and 9.7% who were 65 years of age or older. The median age was 39 years. For every 100 females, there were 97.2 males. For every 100 females age 18 and over, there were 94.2 males.
The median income for a household in the city was $90,945, and the median income for a family was $99,945. Males had a median income of $65,945 versus $41,945 for females. The per capita income for the city was $41,945. About 2.2% of families and 3.2% of the population were below the poverty line, including 3.2% of those under age 18 and 4.2% of those age 65 or over.
Common Questions
What is Per Capita Income in Highland Village?
Per Capita income in Highland Village is $64,032.
What is the Median Family Income in Highland Village?
Median Family Income in Highland Village is $177,478.
What is the Median Household income in Highland Village?
Median Household Income in Highland Village is $162,879.
What is Income or Wage Gap in Highland Village?
Income or Wage Gap in Highland Village is 42.3%.
Women in Highland Village earn 57.7 cents for every dollar earned by a man.
What is Inequality or Gini Index in Highland Village?
Inequality or Gini Index in Highland Village is 0.36.
What is the Total Population of Highland Village?
Total Population of Highland Village is 15,883.
What is the Total Male Population of Highland Village?
Total Male Population of Highland Village is 8,330.
What is the Total Female Population of Highland Village?
Total Female Population of Highland Village is 7,553.
What is the Ratio of Males per 100 Females in Highland Village?
There are 110.29 Males per 100 Females in Highland Village.
What is the Ratio of Females per 100 Males in Highland Village?
There are 90.67 Females per 100 Males in Highland Village.
What is the Median Population Age in Highland Village?
Median Population Age in Highland Village is 42.9 Years.
What is the Average Family Size in Highland Village
Average Family Size in Highland Village is 3.3 People.
What is the Average Household Size in Highland Village
Average Household Size in Highland Village is 3.0 People.
How Large is the Labor Force in Highland Village?
There are 8,553 People in the Labor Forcein in Highland Village.
What is the Percentage of People in the Labor Force in Highland Village?
67.1% of People are in the Labor Force in Highland Village.
What is the Unemployment Rate in Highland Village?
Unemployment Rate in Highland Village is 3.0%.