McLendon Chisholm, TX Map & Demographics
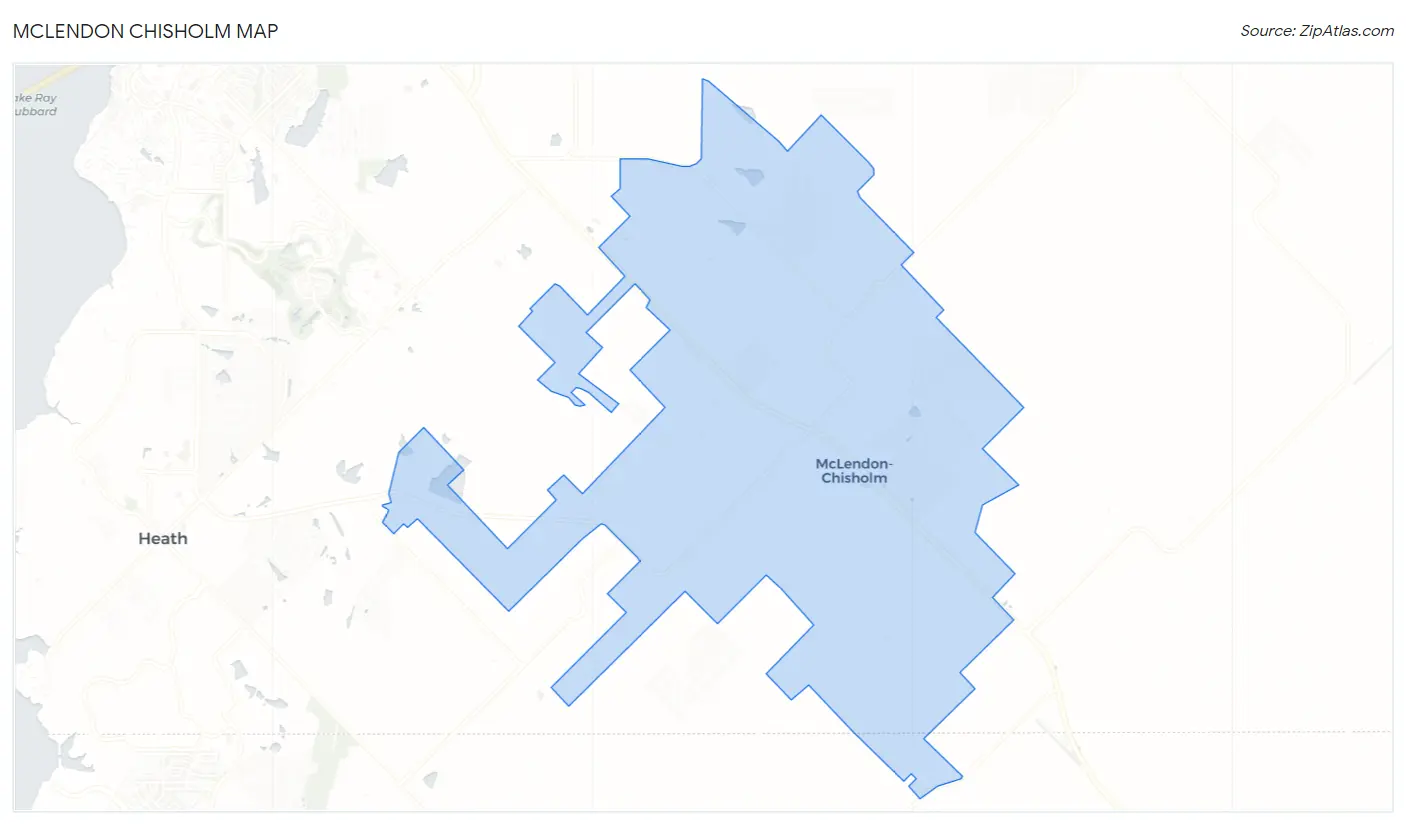
McLendon Chisholm Map
McLendon Chisholm Overview
$74,822
PER CAPITA INCOME
$192,566
AVG FAMILY INCOME
$167,750
AVG HOUSEHOLD INCOME
61.8%
WAGE / INCOME GAP [ % ]
38.2¢/ $1
WAGE / INCOME GAP [ $ ]
0.49
INEQUALITY / GINI INDEX
3,755
TOTAL POPULATION
1,771
MALE POPULATION
1,984
FEMALE POPULATION
89.26
MALES / 100 FEMALES
112.03
FEMALES / 100 MALES
40.3
MEDIAN AGE
3.5
AVG FAMILY SIZE
3.2
AVG HOUSEHOLD SIZE
1,977
LABOR FORCE [ PEOPLE ]
70.9%
PERCENT IN LABOR FORCE
1.9%
UNEMPLOYMENT RATE
Income in McLendon Chisholm
Income Overview in McLendon Chisholm
Per Capita Income in McLendon Chisholm is $74,822, while median incomes of families and households are $192,566 and $167,750 respectively.
| Characteristic | Number | Measure |
| Per Capita Income | 3,755 | $74,822 |
| Median Family Income | 997 | $192,566 |
| Mean Family Income | 997 | $268,382 |
| Median Household Income | 1,155 | $167,750 |
| Mean Household Income | 1,155 | $249,220 |
| Income Deficit | 997 | $0 |
| Wage / Income Gap (%) | 3,755 | 61.77% |
| Wage / Income Gap ($) | 3,755 | 38.23¢ per $1 |
| Gini / Inequality Index | 3,755 | 0.49 |
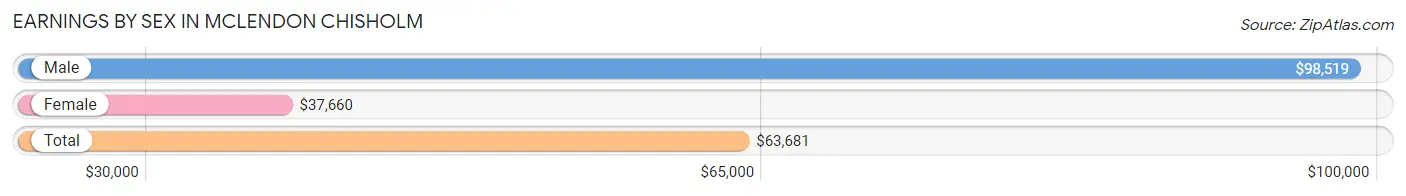
Earnings by Sex in McLendon Chisholm
Average Earnings in McLendon Chisholm are $63,681, $98,519 for men and $37,660 for women, a difference of 61.8%.
| Sex | Number | Average Earnings |
| Male | 1,146 (54.2%) | $98,519 |
| Female | 970 (45.8%) | $37,660 |
| Total | 2,116 (100.0%) | $63,681 |
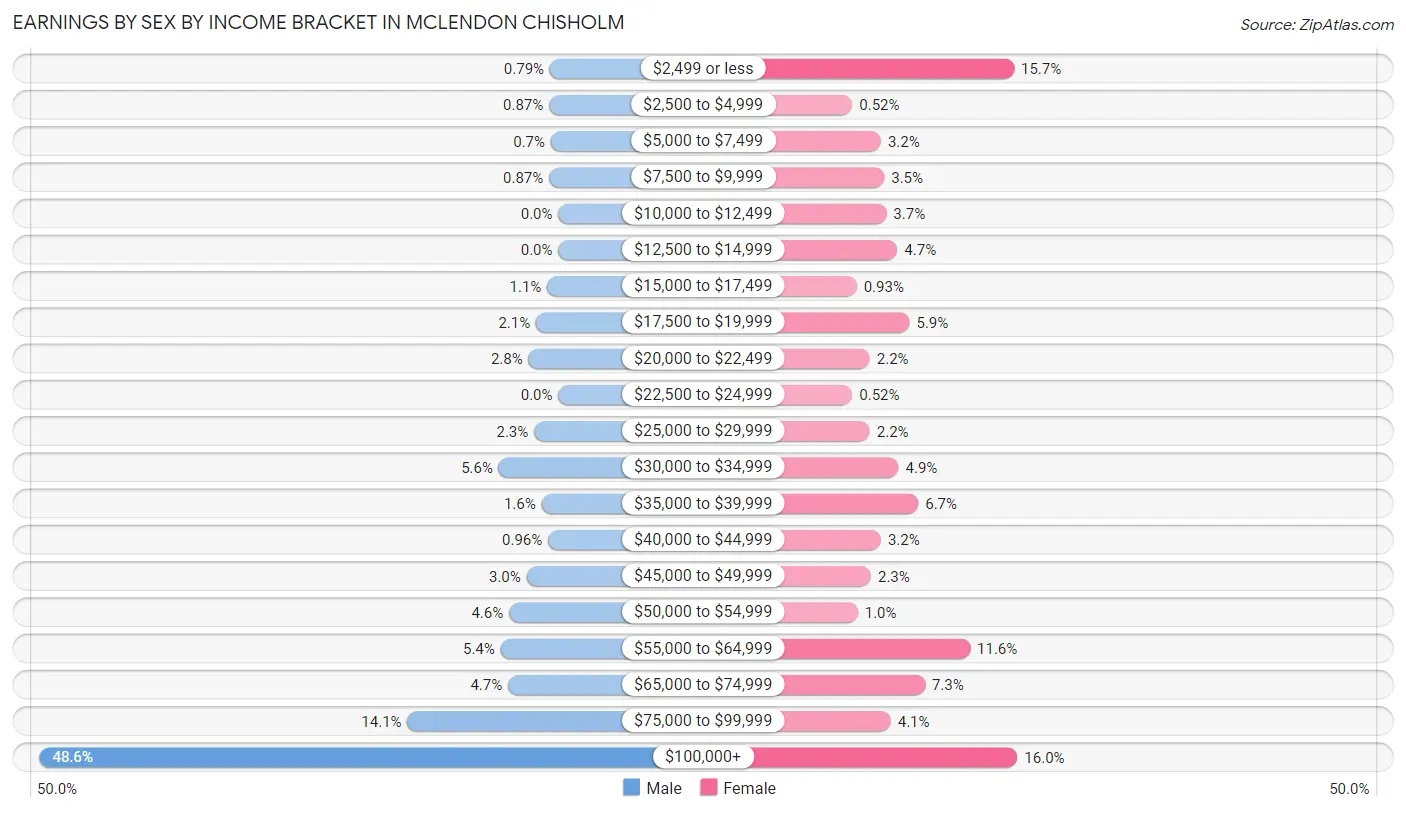
Earnings by Sex by Income Bracket in McLendon Chisholm
The most common earnings brackets in McLendon Chisholm are $100,000+ for men (557 | 48.6%) and $100,000+ for women (155 | 16.0%).
| Income | Male | Female |
| $2,499 or less | 9 (0.8%) | 152 (15.7%) |
| $2,500 to $4,999 | 10 (0.9%) | 5 (0.5%) |
| $5,000 to $7,499 | 8 (0.7%) | 31 (3.2%) |
| $7,500 to $9,999 | 10 (0.9%) | 34 (3.5%) |
| $10,000 to $12,499 | 0 (0.0%) | 36 (3.7%) |
| $12,500 to $14,999 | 0 (0.0%) | 46 (4.7%) |
| $15,000 to $17,499 | 12 (1.1%) | 9 (0.9%) |
| $17,500 to $19,999 | 24 (2.1%) | 57 (5.9%) |
| $20,000 to $22,499 | 32 (2.8%) | 21 (2.2%) |
| $22,500 to $24,999 | 0 (0.0%) | 5 (0.5%) |
| $25,000 to $29,999 | 26 (2.3%) | 21 (2.2%) |
| $30,000 to $34,999 | 64 (5.6%) | 47 (4.9%) |
| $35,000 to $39,999 | 18 (1.6%) | 65 (6.7%) |
| $40,000 to $44,999 | 11 (1.0%) | 31 (3.2%) |
| $45,000 to $49,999 | 34 (3.0%) | 22 (2.3%) |
| $50,000 to $54,999 | 53 (4.6%) | 10 (1.0%) |
| $55,000 to $64,999 | 62 (5.4%) | 112 (11.6%) |
| $65,000 to $74,999 | 54 (4.7%) | 71 (7.3%) |
| $75,000 to $99,999 | 162 (14.1%) | 40 (4.1%) |
| $100,000+ | 557 (48.6%) | 155 (16.0%) |
| Total | 1,146 (100.0%) | 970 (100.0%) |
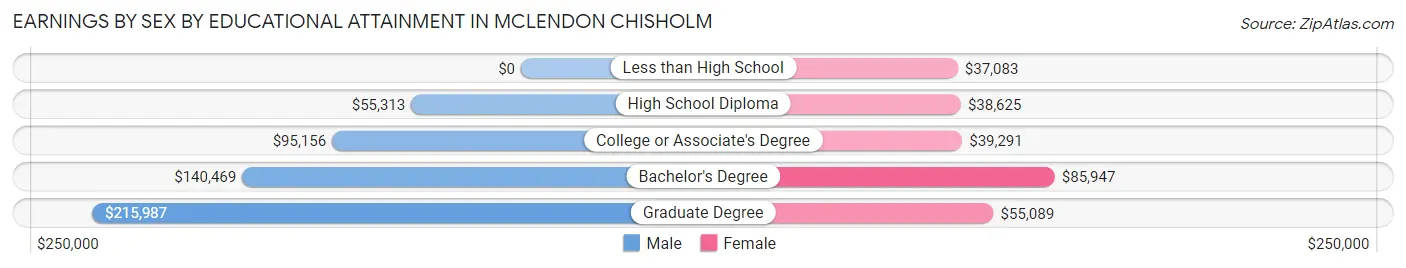
Earnings by Sex by Educational Attainment in McLendon Chisholm
Average earnings in McLendon Chisholm are $102,067 for men and $55,663 for women, a difference of 45.5%. Men with an educational attainment of graduate degree enjoy the highest average annual earnings of $215,987, while those with high school diploma education earn the least with $55,313. Women with an educational attainment of bachelor's degree earn the most with the average annual earnings of $85,947, while those with less than high school education have the smallest earnings of $37,083.
| Educational Attainment | Male Income | Female Income |
| Less than High School | - | - |
| High School Diploma | $55,313 | $38,625 |
| College or Associate's Degree | $95,156 | $39,291 |
| Bachelor's Degree | $140,469 | $85,947 |
| Graduate Degree | $215,987 | $55,089 |
| Total | $102,067 | $55,663 |
Family Income in McLendon Chisholm
Family Income Brackets in McLendon Chisholm
According to the McLendon Chisholm family income data, there are 443 families falling into the $200,000+ income range, which is the most common income bracket and makes up 44.4% of all families.
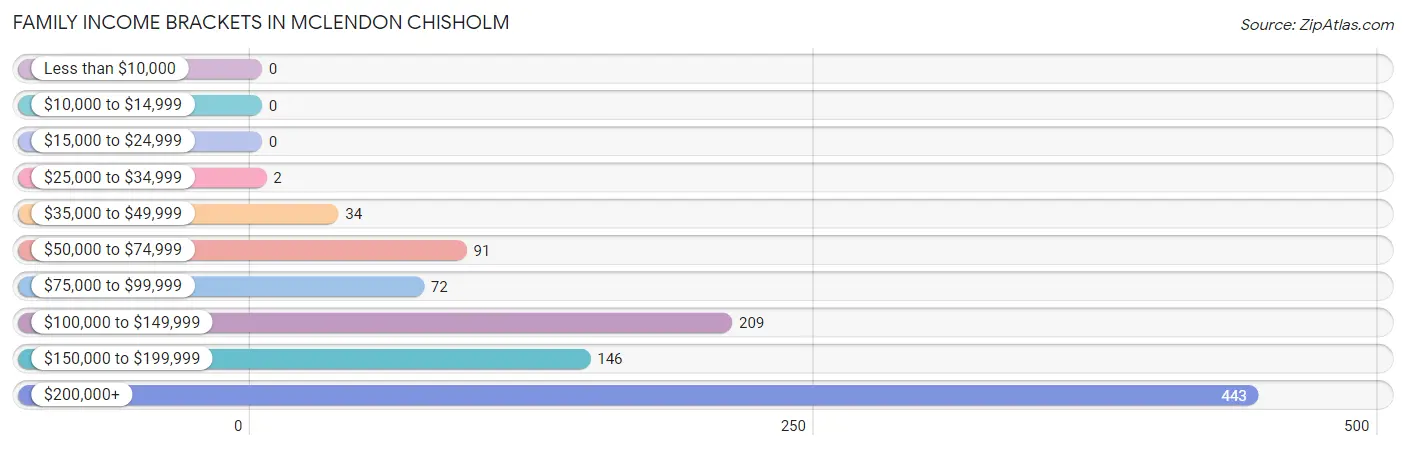
| Income Bracket | # Families | % Families |
| Less than $10,000 | 0 | 0.0% |
| $10,000 to $14,999 | 0 | 0.0% |
| $15,000 to $24,999 | 0 | 0.0% |
| $25,000 to $34,999 | 2 | 0.2% |
| $35,000 to $49,999 | 34 | 3.4% |
| $50,000 to $74,999 | 91 | 9.1% |
| $75,000 to $99,999 | 72 | 7.2% |
| $100,000 to $149,999 | 209 | 21.0% |
| $150,000 to $199,999 | 146 | 14.6% |
| $200,000+ | 443 | 44.4% |
Family Income by Famaliy Size in McLendon Chisholm
6-person families (63 | 6.3%) account for the highest median family income in McLendon Chisholm with $250,001 per family, while 2-person families (210 | 21.1%) have the highest median income of $95,750 per family member.

| Income Bracket | # Families | Median Income |
| 2-Person Families | 210 (21.1%) | $191,500 |
| 3-Person Families | 140 (14.0%) | $143,500 |
| 4-Person Families | 488 (48.9%) | $194,375 |
| 5-Person Families | 92 (9.2%) | $164,821 |
| 6-Person Families | 63 (6.3%) | $250,001 |
| 7+ Person Families | 4 (0.4%) | $0 |
| Total | 997 (100.0%) | $192,566 |
Family Income by Number of Earners in McLendon Chisholm
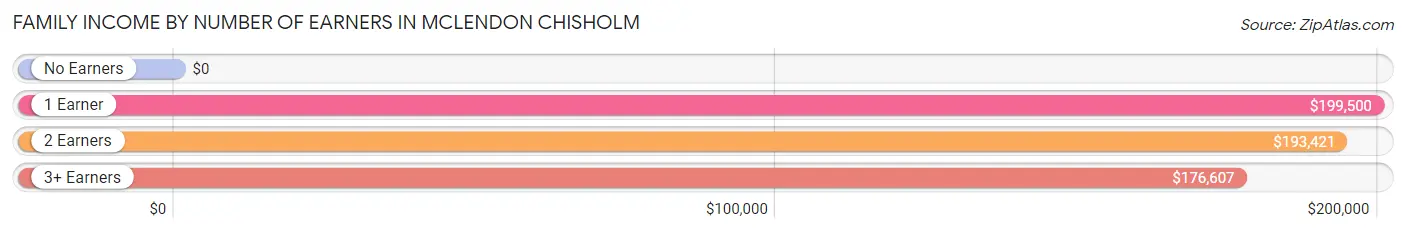
| Number of Earners | # Families | Median Income |
| No Earners | 30 (3.0%) | $0 |
| 1 Earner | 312 (31.3%) | $199,500 |
| 2 Earners | 456 (45.7%) | $193,421 |
| 3+ Earners | 199 (20.0%) | $176,607 |
| Total | 997 (100.0%) | $192,566 |
Household Income in McLendon Chisholm
Household Income Brackets in McLendon Chisholm
With 457 households falling in the category, the $200,000+ income range is the most frequent in McLendon Chisholm, accounting for 39.6% of all households.
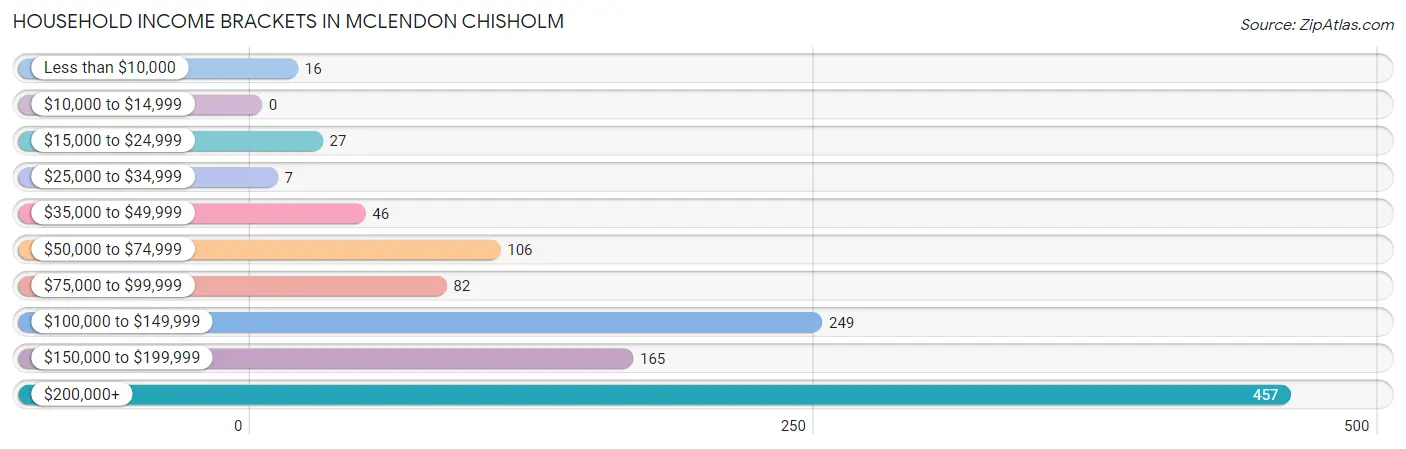
| Income Bracket | # Households | % Households |
| Less than $10,000 | 16 | 1.4% |
| $10,000 to $14,999 | 0 | 0.0% |
| $15,000 to $24,999 | 27 | 2.3% |
| $25,000 to $34,999 | 7 | 0.6% |
| $35,000 to $49,999 | 46 | 4.0% |
| $50,000 to $74,999 | 106 | 9.2% |
| $75,000 to $99,999 | 82 | 7.1% |
| $100,000 to $149,999 | 249 | 21.6% |
| $150,000 to $199,999 | 165 | 14.3% |
| $200,000+ | 457 | 39.6% |
Household Income by Householder Age in McLendon Chisholm
The median household income in McLendon Chisholm is $167,750, with the highest median household income of $193,684 found in the 45 to 64 years age bracket for the primary householder. A total of 712 households (61.7%) fall into this category.
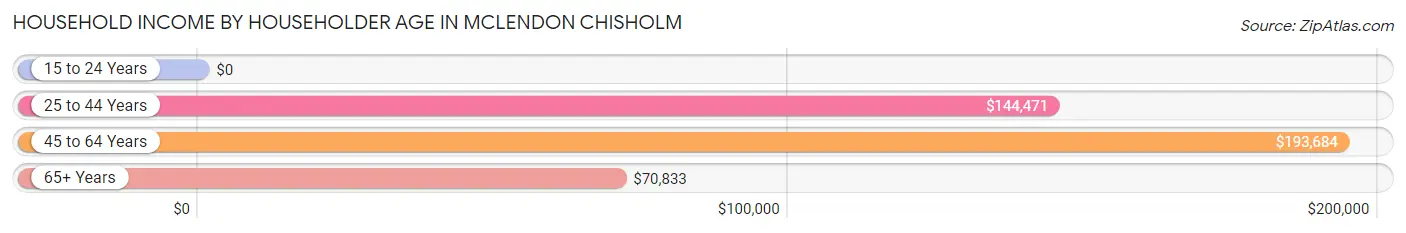
| Income Bracket | # Households | Median Income |
| 15 to 24 Years | 0 (0.0%) | $0 |
| 25 to 44 Years | 321 (27.8%) | $144,471 |
| 45 to 64 Years | 712 (61.7%) | $193,684 |
| 65+ Years | 122 (10.6%) | $70,833 |
| Total | 1,155 (100.0%) | $167,750 |
Poverty in McLendon Chisholm
Income Below Poverty by Sex and Age in McLendon Chisholm
With 1.2% poverty level for males and 0.2% for females among the residents of McLendon Chisholm, 55 to 64 year old males and 25 to 34 year old females are the most vulnerable to poverty, with 21 males (5.8%) and 3 females (2.5%) in their respective age groups living below the poverty level.
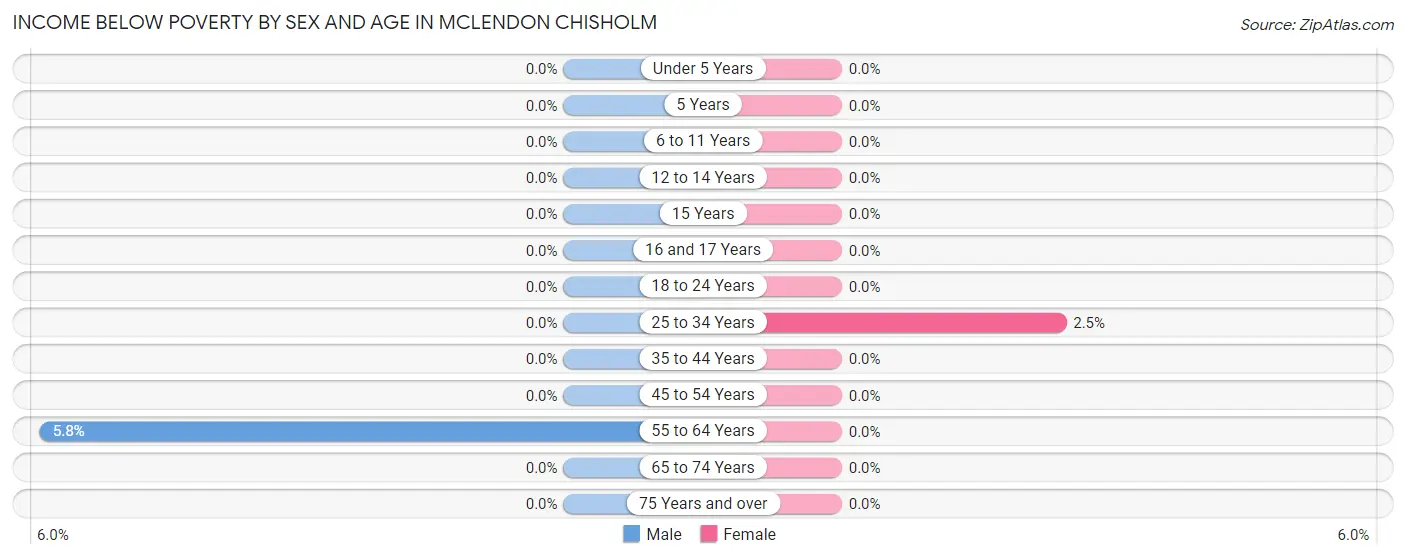
| Age Bracket | Male | Female |
| Under 5 Years | 0 (0.0%) | 0 (0.0%) |
| 5 Years | 0 (0.0%) | 0 (0.0%) |
| 6 to 11 Years | 0 (0.0%) | 0 (0.0%) |
| 12 to 14 Years | 0 (0.0%) | 0 (0.0%) |
| 15 Years | 0 (0.0%) | 0 (0.0%) |
| 16 and 17 Years | 0 (0.0%) | 0 (0.0%) |
| 18 to 24 Years | 0 (0.0%) | 0 (0.0%) |
| 25 to 34 Years | 0 (0.0%) | 3 (2.5%) |
| 35 to 44 Years | 0 (0.0%) | 0 (0.0%) |
| 45 to 54 Years | 0 (0.0%) | 0 (0.0%) |
| 55 to 64 Years | 21 (5.8%) | 0 (0.0%) |
| 65 to 74 Years | 0 (0.0%) | 0 (0.0%) |
| 75 Years and over | 0 (0.0%) | 0 (0.0%) |
| Total | 21 (1.2%) | 3 (0.2%) |
Income Above Poverty by Sex and Age in McLendon Chisholm
According to the poverty statistics in McLendon Chisholm, males aged under 5 years and females aged under 5 years are the age groups that are most secure financially, with 100.0% of males and 100.0% of females in these age groups living above the poverty line.
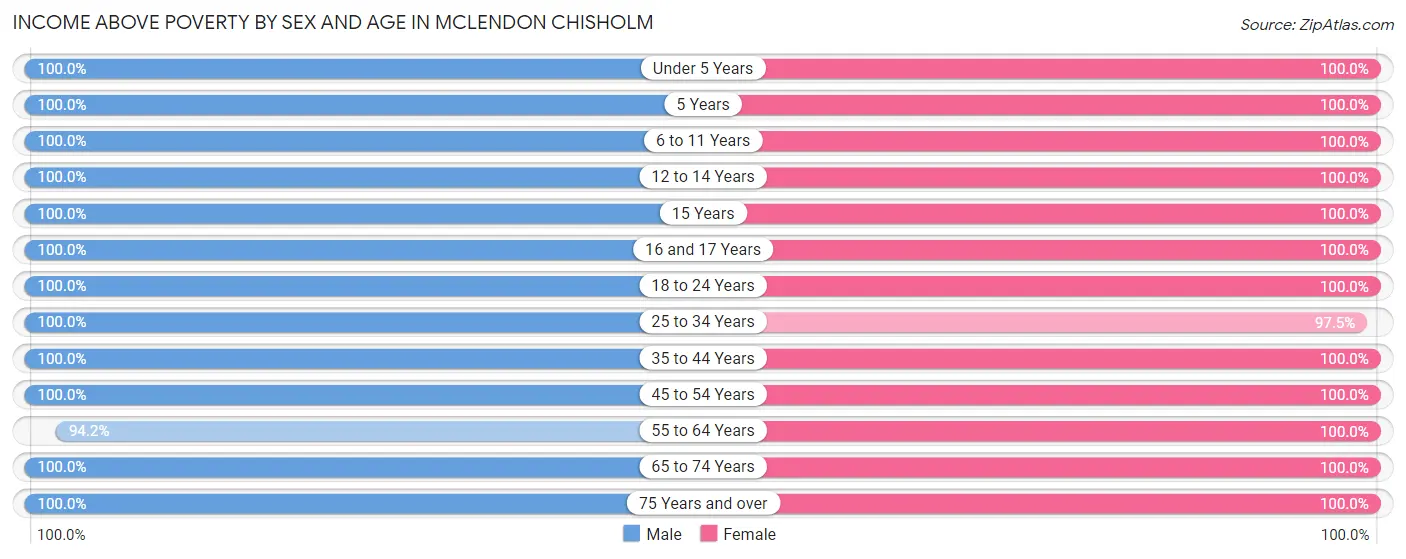
| Age Bracket | Male | Female |
| Under 5 Years | 90 (100.0%) | 95 (100.0%) |
| 5 Years | 29 (100.0%) | 25 (100.0%) |
| 6 to 11 Years | 147 (100.0%) | 240 (100.0%) |
| 12 to 14 Years | 142 (100.0%) | 57 (100.0%) |
| 15 Years | 53 (100.0%) | 88 (100.0%) |
| 16 and 17 Years | 36 (100.0%) | 124 (100.0%) |
| 18 to 24 Years | 80 (100.0%) | 172 (100.0%) |
| 25 to 34 Years | 149 (100.0%) | 117 (97.5%) |
| 35 to 44 Years | 216 (100.0%) | 290 (100.0%) |
| 45 to 54 Years | 367 (100.0%) | 358 (100.0%) |
| 55 to 64 Years | 339 (94.2%) | 246 (100.0%) |
| 65 to 74 Years | 72 (100.0%) | 103 (100.0%) |
| 75 Years and over | 30 (100.0%) | 66 (100.0%) |
| Total | 1,750 (98.8%) | 1,981 (99.9%) |
Income Below Poverty Among Married-Couple Families in McLendon Chisholm
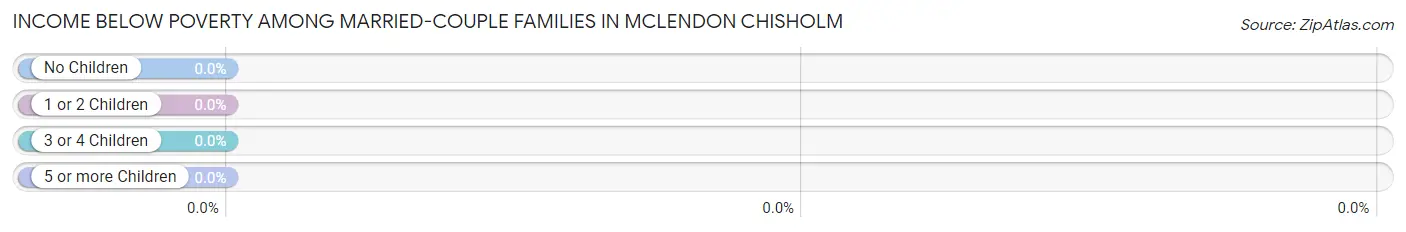
| Children | Above Poverty | Below Poverty |
| No Children | 321 (100.0%) | 0 (0.0%) |
| 1 or 2 Children | 549 (100.0%) | 0 (0.0%) |
| 3 or 4 Children | 86 (100.0%) | 0 (0.0%) |
| 5 or more Children | 4 (100.0%) | 0 (0.0%) |
| Total | 960 (100.0%) | 0 (0.0%) |
Income Below Poverty Among Single-Parent Households in McLendon Chisholm
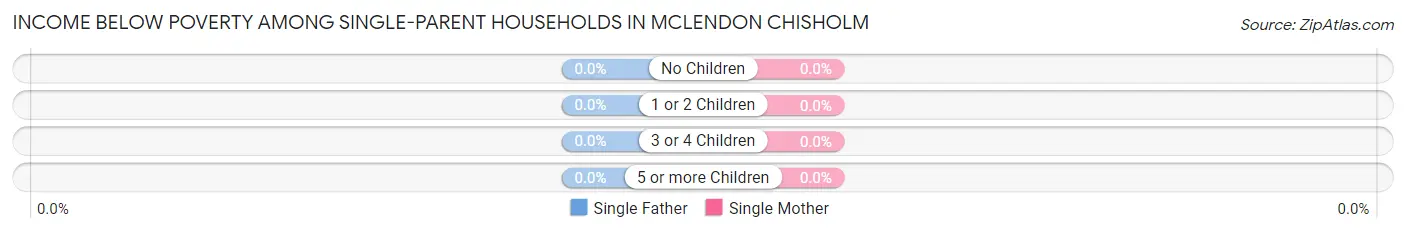
| Children | Single Father | Single Mother |
| No Children | 0 (0.0%) | 0 (0.0%) |
| 1 or 2 Children | 0 (0.0%) | 0 (0.0%) |
| 3 or 4 Children | 0 (0.0%) | 0 (0.0%) |
| 5 or more Children | 0 (0.0%) | 0 (0.0%) |
| Total | 0 (0.0%) | 0 (0.0%) |
Income Below Poverty Among Married-Couple vs Single-Parent Households in McLendon Chisholm
| Children | Married-Couple Families | Single-Parent Households |
| No Children | 0 (0.0%) | 0 (0.0%) |
| 1 or 2 Children | 0 (0.0%) | 0 (0.0%) |
| 3 or 4 Children | 0 (0.0%) | 0 (0.0%) |
| 5 or more Children | 0 (0.0%) | 0 (0.0%) |
| Total | 0 (0.0%) | 0 (0.0%) |
Race in McLendon Chisholm
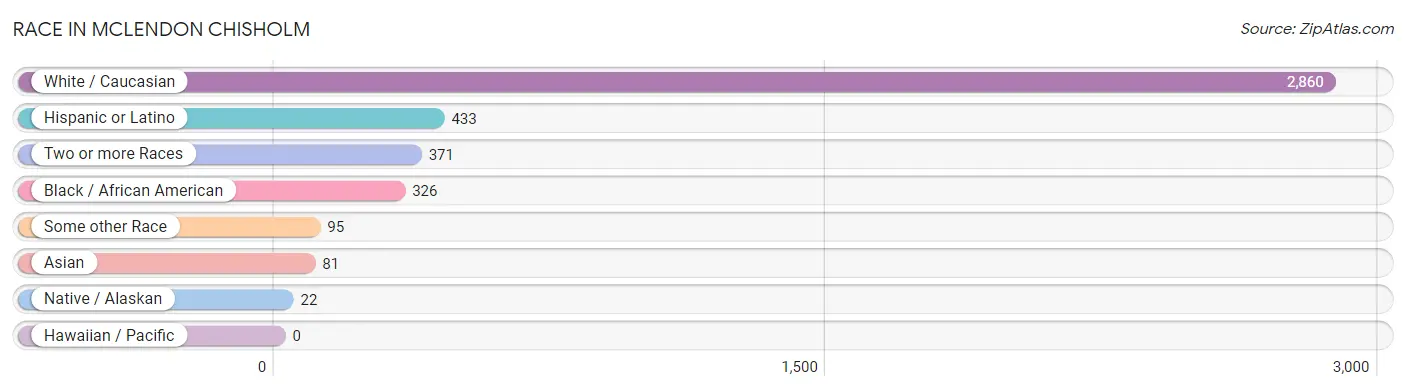
The most populous races in McLendon Chisholm are White / Caucasian (2,860 | 76.2%), Hispanic or Latino (433 | 11.5%), and Two or more Races (371 | 9.9%).
| Race | # Population | % Population |
| Asian | 81 | 2.2% |
| Black / African American | 326 | 8.7% |
| Hawaiian / Pacific | 0 | 0.0% |
| Hispanic or Latino | 433 | 11.5% |
| Native / Alaskan | 22 | 0.6% |
| White / Caucasian | 2,860 | 76.2% |
| Two or more Races | 371 | 9.9% |
| Some other Race | 95 | 2.5% |
| Total | 3,755 | 100.0% |
Ancestry in McLendon Chisholm
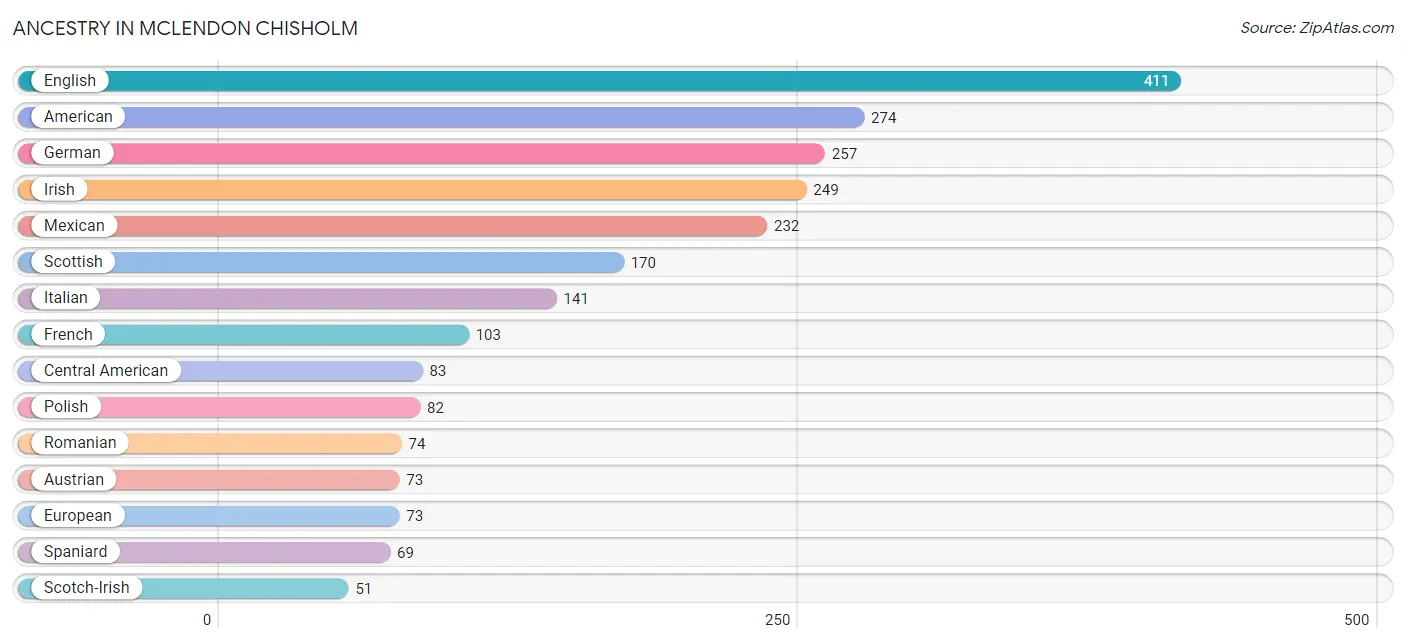
The most populous ancestries reported in McLendon Chisholm are English (411 | 11.0%), American (274 | 7.3%), German (257 | 6.8%), Irish (249 | 6.6%), and Mexican (232 | 6.2%), together accounting for 37.9% of all McLendon Chisholm residents.
| Ancestry | # Population | % Population |
| American | 274 | 7.3% |
| Apache | 6 | 0.2% |
| Arab | 25 | 0.7% |
| Austrian | 73 | 1.9% |
| British | 34 | 0.9% |
| Canadian | 6 | 0.2% |
| Central American | 83 | 2.2% |
| Cherokee | 3 | 0.1% |
| Chilean | 2 | 0.1% |
| Choctaw | 26 | 0.7% |
| Cuban | 7 | 0.2% |
| Czech | 29 | 0.8% |
| Dominican | 6 | 0.2% |
| Dutch | 12 | 0.3% |
| Eastern European | 20 | 0.5% |
| English | 411 | 11.0% |
| European | 73 | 1.9% |
| French | 103 | 2.7% |
| French Canadian | 32 | 0.9% |
| German | 257 | 6.8% |
| Guatemalan | 9 | 0.2% |
| Honduran | 43 | 1.1% |
| Indian (Asian) | 22 | 0.6% |
| Irish | 249 | 6.6% |
| Italian | 141 | 3.7% |
| Japanese | 18 | 0.5% |
| Korean | 36 | 1.0% |
| Lebanese | 6 | 0.2% |
| Lithuanian | 6 | 0.2% |
| Mexican | 232 | 6.2% |
| Native Hawaiian | 1 | 0.0% |
| Nigerian | 5 | 0.1% |
| Norwegian | 8 | 0.2% |
| Palestinian | 19 | 0.5% |
| Peruvian | 8 | 0.2% |
| Polish | 82 | 2.2% |
| Portuguese | 10 | 0.3% |
| Puerto Rican | 7 | 0.2% |
| Romanian | 74 | 2.0% |
| Salvadoran | 31 | 0.8% |
| Scandinavian | 3 | 0.1% |
| Scotch-Irish | 51 | 1.4% |
| Scottish | 170 | 4.5% |
| Slovak | 3 | 0.1% |
| South American | 10 | 0.3% |
| Spaniard | 69 | 1.8% |
| Spanish | 17 | 0.4% |
| Sri Lankan | 23 | 0.6% |
| Subsaharan African | 5 | 0.1% |
| Swedish | 8 | 0.2% |
| Ukrainian | 10 | 0.3% |
| Welsh | 11 | 0.3% | View All 52 Rows |
Immigrants in McLendon Chisholm
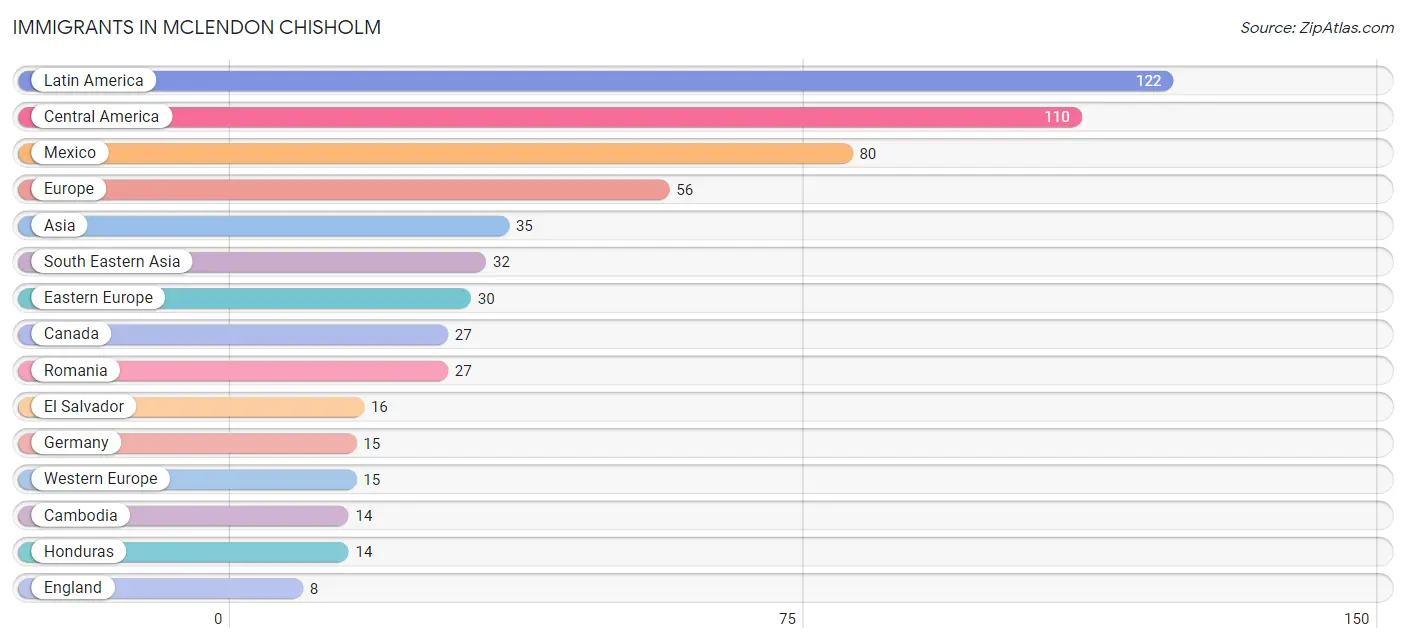
The most numerous immigrant groups reported in McLendon Chisholm came from Latin America (122 | 3.3%), Central America (110 | 2.9%), Mexico (80 | 2.1%), Europe (56 | 1.5%), and Asia (35 | 0.9%), together accounting for 10.7% of all McLendon Chisholm residents.
| Immigration Origin | # Population | % Population |
| Africa | 6 | 0.2% |
| Asia | 35 | 0.9% |
| Cambodia | 14 | 0.4% |
| Canada | 27 | 0.7% |
| Caribbean | 7 | 0.2% |
| Central America | 110 | 2.9% |
| Cuba | 7 | 0.2% |
| Eastern Africa | 6 | 0.2% |
| Eastern Europe | 30 | 0.8% |
| El Salvador | 16 | 0.4% |
| England | 8 | 0.2% |
| Europe | 56 | 1.5% |
| Germany | 15 | 0.4% |
| Honduras | 14 | 0.4% |
| Indonesia | 4 | 0.1% |
| Kenya | 6 | 0.2% |
| Laos | 3 | 0.1% |
| Latin America | 122 | 3.3% |
| Mexico | 80 | 2.1% |
| Northern Europe | 8 | 0.2% |
| Pakistan | 3 | 0.1% |
| Peru | 5 | 0.1% |
| Philippines | 7 | 0.2% |
| Portugal | 3 | 0.1% |
| Romania | 27 | 0.7% |
| South America | 5 | 0.1% |
| South Central Asia | 3 | 0.1% |
| South Eastern Asia | 32 | 0.9% |
| Southern Europe | 3 | 0.1% |
| Ukraine | 3 | 0.1% |
| Vietnam | 4 | 0.1% |
| Western Europe | 15 | 0.4% | View All 32 Rows |
Sex and Age in McLendon Chisholm
Sex and Age in McLendon Chisholm
The most populous age groups in McLendon Chisholm are 45 to 49 Years (286 | 16.2%) for men and 15 to 19 Years (270 | 13.6%) for women.
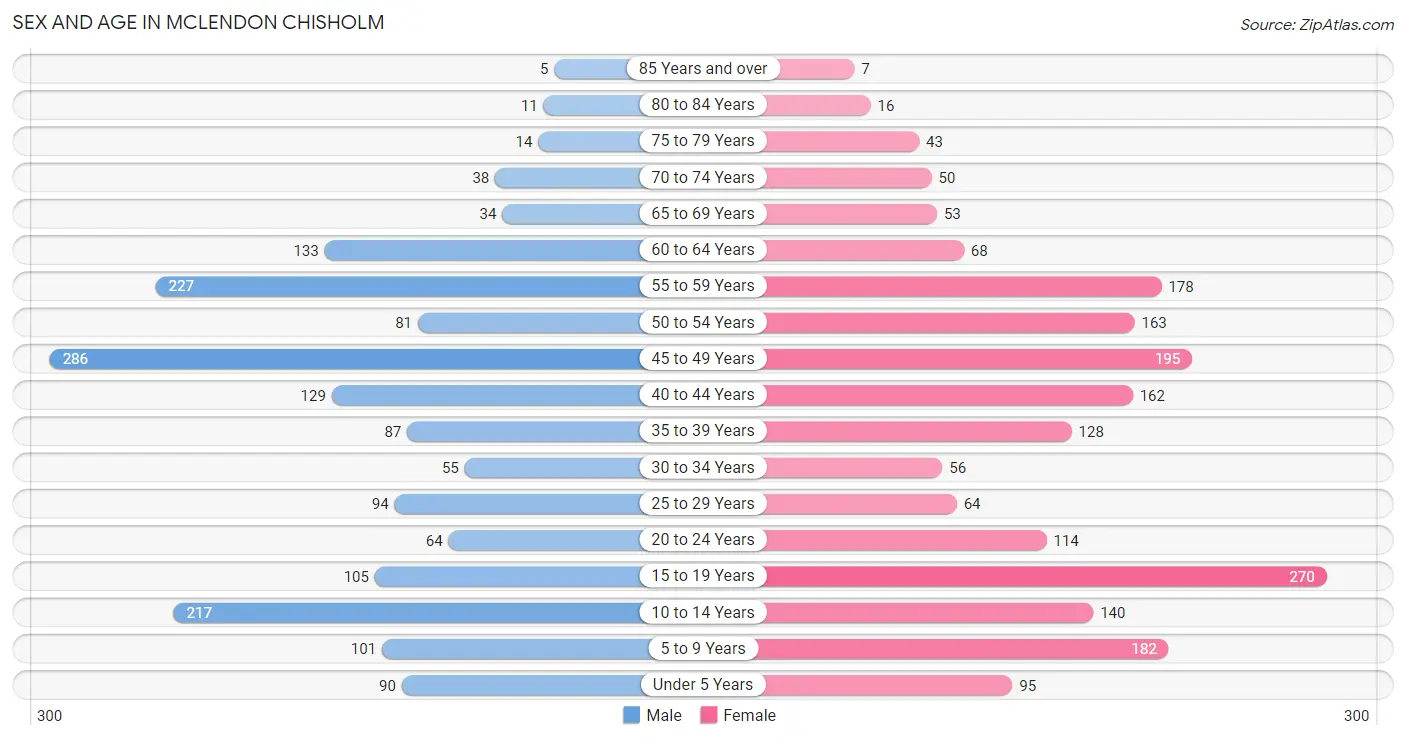
| Age Bracket | Male | Female |
| Under 5 Years | 90 (5.1%) | 95 (4.8%) |
| 5 to 9 Years | 101 (5.7%) | 182 (9.2%) |
| 10 to 14 Years | 217 (12.2%) | 140 (7.1%) |
| 15 to 19 Years | 105 (5.9%) | 270 (13.6%) |
| 20 to 24 Years | 64 (3.6%) | 114 (5.8%) |
| 25 to 29 Years | 94 (5.3%) | 64 (3.2%) |
| 30 to 34 Years | 55 (3.1%) | 56 (2.8%) |
| 35 to 39 Years | 87 (4.9%) | 128 (6.5%) |
| 40 to 44 Years | 129 (7.3%) | 162 (8.2%) |
| 45 to 49 Years | 286 (16.2%) | 195 (9.8%) |
| 50 to 54 Years | 81 (4.6%) | 163 (8.2%) |
| 55 to 59 Years | 227 (12.8%) | 178 (9.0%) |
| 60 to 64 Years | 133 (7.5%) | 68 (3.4%) |
| 65 to 69 Years | 34 (1.9%) | 53 (2.7%) |
| 70 to 74 Years | 38 (2.1%) | 50 (2.5%) |
| 75 to 79 Years | 14 (0.8%) | 43 (2.2%) |
| 80 to 84 Years | 11 (0.6%) | 16 (0.8%) |
| 85 Years and over | 5 (0.3%) | 7 (0.4%) |
| Total | 1,771 (100.0%) | 1,984 (100.0%) |
Families and Households in McLendon Chisholm
Median Family Size in McLendon Chisholm
The median family size in McLendon Chisholm is 3.54 persons per family, with married-couple families (960 | 96.3%) accounting for the largest median family size of 3.55 persons per family. On the other hand, single male/father families (3 | 0.3%) represent the smallest median family size with 3.00 persons per family.
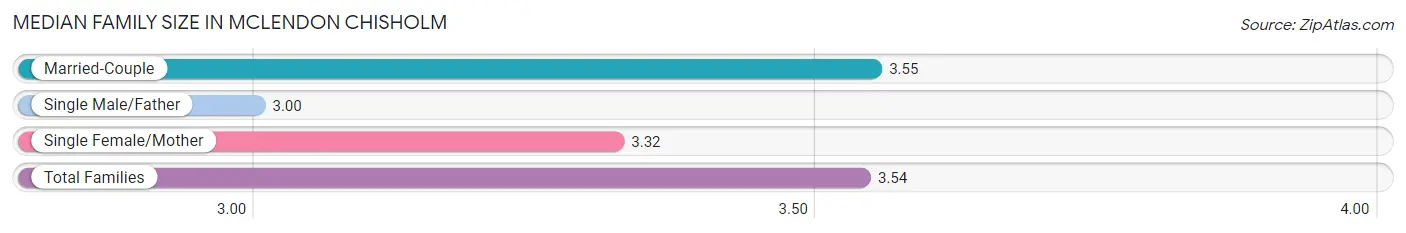
| Family Type | # Families | Family Size |
| Married-Couple | 960 (96.3%) | 3.55 |
| Single Male/Father | 3 (0.3%) | 3.00 |
| Single Female/Mother | 34 (3.4%) | 3.32 |
| Total Families | 997 (100.0%) | 3.54 |
Median Household Size in McLendon Chisholm
The median household size in McLendon Chisholm is 3.25 persons per household, with single male/father households (3 | 0.3%) accounting for the largest median household size of 4 persons per household. non-family households (158 | 13.7%) represent the smallest median household size with 1.29 persons per household.
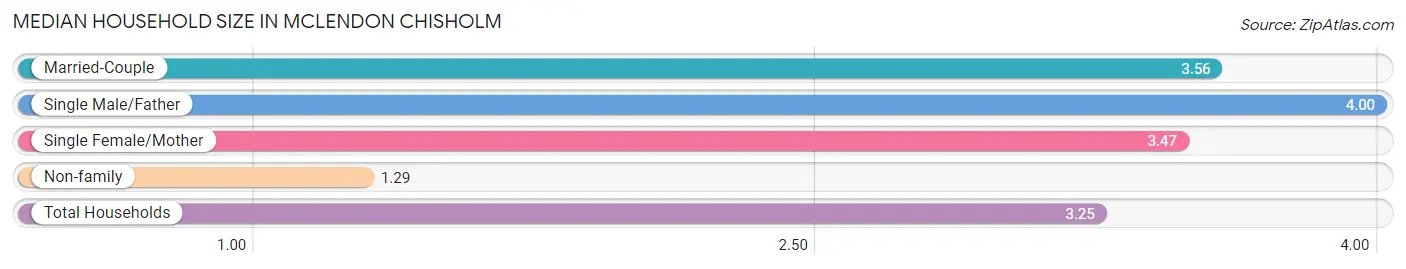
| Household Type | # Households | Household Size |
| Married-Couple | 960 (83.1%) | 3.56 |
| Single Male/Father | 3 (0.3%) | 4.00 |
| Single Female/Mother | 34 (2.9%) | 3.47 |
| Non-family | 158 (13.7%) | 1.29 |
| Total Households | 1,155 (100.0%) | 3.25 |
Household Size by Marriage Status in McLendon Chisholm
Out of a total of 1,155 households in McLendon Chisholm, 997 (86.3%) are family households, while 158 (13.7%) are nonfamily households. The most numerous type of family households are 4-person households, comprising 488, and the most common type of nonfamily households are 1-person households, comprising 113.
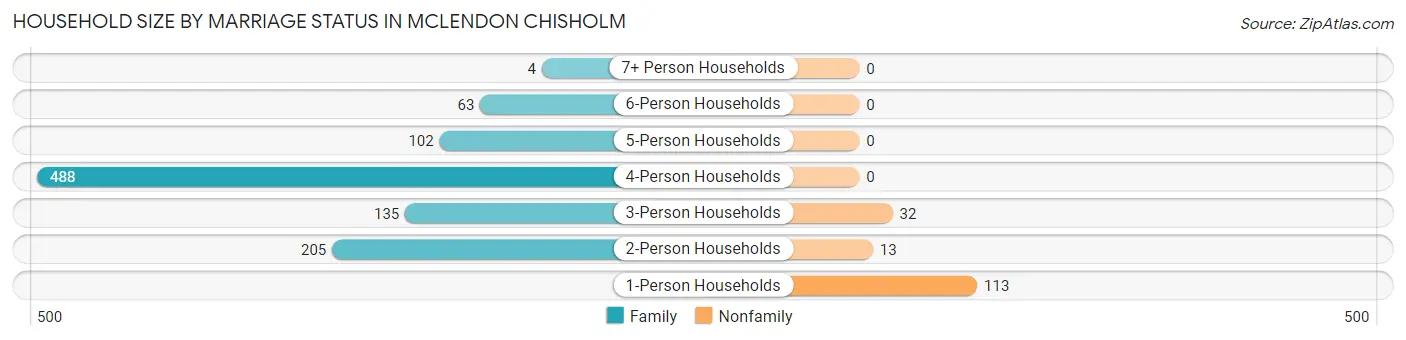
| Household Size | Family Households | Nonfamily Households |
| 1-Person Households | - | 113 (9.8%) |
| 2-Person Households | 205 (17.7%) | 13 (1.1%) |
| 3-Person Households | 135 (11.7%) | 32 (2.8%) |
| 4-Person Households | 488 (42.2%) | 0 (0.0%) |
| 5-Person Households | 102 (8.8%) | 0 (0.0%) |
| 6-Person Households | 63 (5.4%) | 0 (0.0%) |
| 7+ Person Households | 4 (0.4%) | 0 (0.0%) |
| Total | 997 (86.3%) | 158 (13.7%) |
Female Fertility in McLendon Chisholm
Fertility by Age in McLendon Chisholm
Average fertility rate in McLendon Chisholm is 28.0 births per 1,000 women. Women in the age bracket of 20 to 34 years have the highest fertility rate with 94.0 births per 1,000 women. Women in the age bracket of 20 to 34 years acount for 73.3% of all women with births.
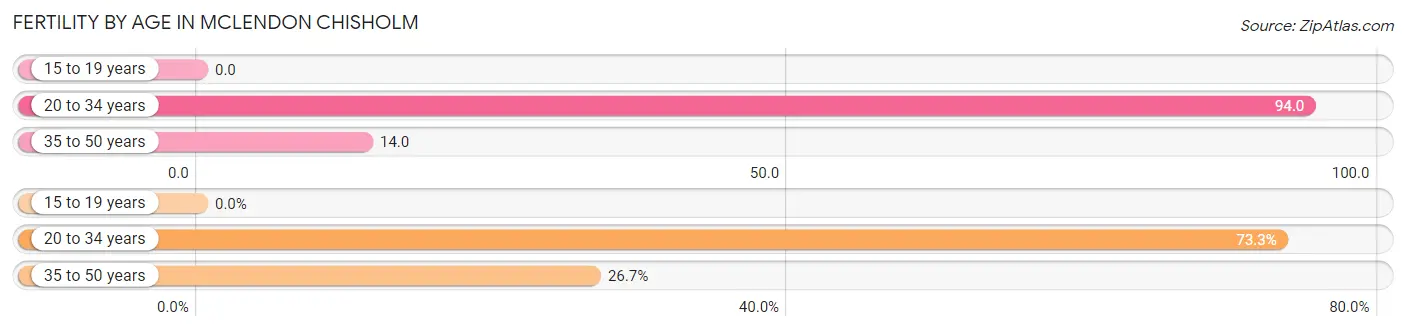
| Age Bracket | Women with Births | Births / 1,000 Women |
| 15 to 19 years | 0 (0.0%) | 0.0 |
| 20 to 34 years | 22 (73.3%) | 94.0 |
| 35 to 50 years | 8 (26.7%) | 14.0 |
| Total | 30 (100.0%) | 28.0 |
Fertility by Age by Marriage Status in McLendon Chisholm
33.3% of women with births (30) in McLendon Chisholm are married. The highest percentage of unmarried women with births falls into 20 to 34 years age bracket with 90.9% of them unmarried at the time of birth, while the lowest percentage of unmarried women with births belong to 35 to 50 years age bracket with 0.0% of them unmarried.
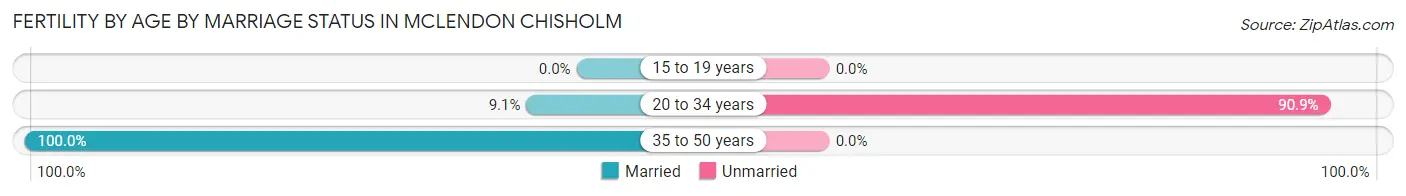
| Age Bracket | Married | Unmarried |
| 15 to 19 years | 0 (0.0%) | 0 (0.0%) |
| 20 to 34 years | 2 (9.1%) | 20 (90.9%) |
| 35 to 50 years | 8 (100.0%) | 0 (0.0%) |
| Total | 10 (33.3%) | 20 (66.7%) |
Fertility by Education in McLendon Chisholm
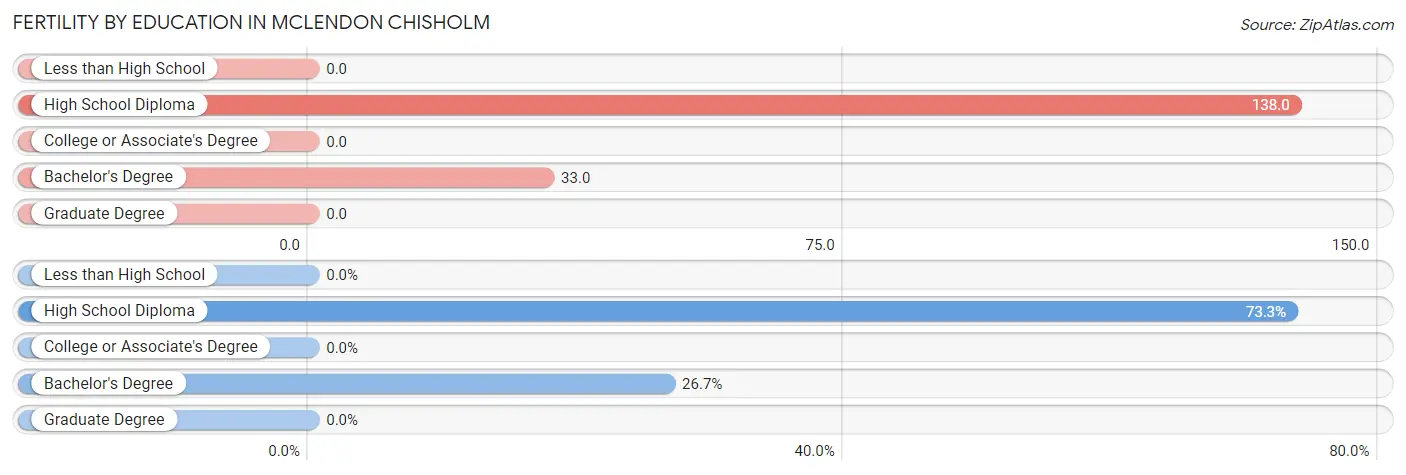
| Educational Attainment | Women with Births | Births / 1,000 Women |
| Less than High School | 0 (0.0%) | 0.0 |
| High School Diploma | 22 (73.3%) | 138.0 |
| College or Associate's Degree | 0 (0.0%) | 0.0 |
| Bachelor's Degree | 8 (26.7%) | 33.0 |
| Graduate Degree | 0 (0.0%) | 0.0 |
| Total | 30 (100.0%) | 28.0 |
Fertility by Education by Marriage Status in McLendon Chisholm
66.7% of women with births in McLendon Chisholm are unmarried. Women with the educational attainment of bachelor's degree are most likely to be married with 100.0% of them married at childbirth, while women with the educational attainment of high school diploma are least likely to be married with 90.9% of them unmarried at childbirth.
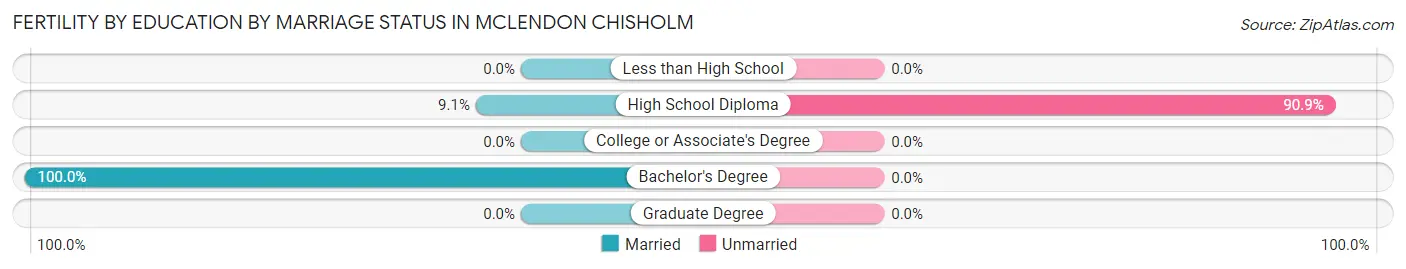
| Educational Attainment | Married | Unmarried |
| Less than High School | 0 (0.0%) | 0 (0.0%) |
| High School Diploma | 2 (9.1%) | 20 (90.9%) |
| College or Associate's Degree | 0 (0.0%) | 0 (0.0%) |
| Bachelor's Degree | 8 (100.0%) | 0 (0.0%) |
| Graduate Degree | 0 (0.0%) | 0 (0.0%) |
| Total | 10 (33.3%) | 20 (66.7%) |
Employment Characteristics in McLendon Chisholm
Employment by Class of Employer in McLendon Chisholm
Among the 1,918 employed individuals in McLendon Chisholm, private company employees (1,289 | 67.2%), self-employed (not incorporated) (170 | 8.9%), and not-for-profit organizations (156 | 8.1%) make up the most common classes of employment.
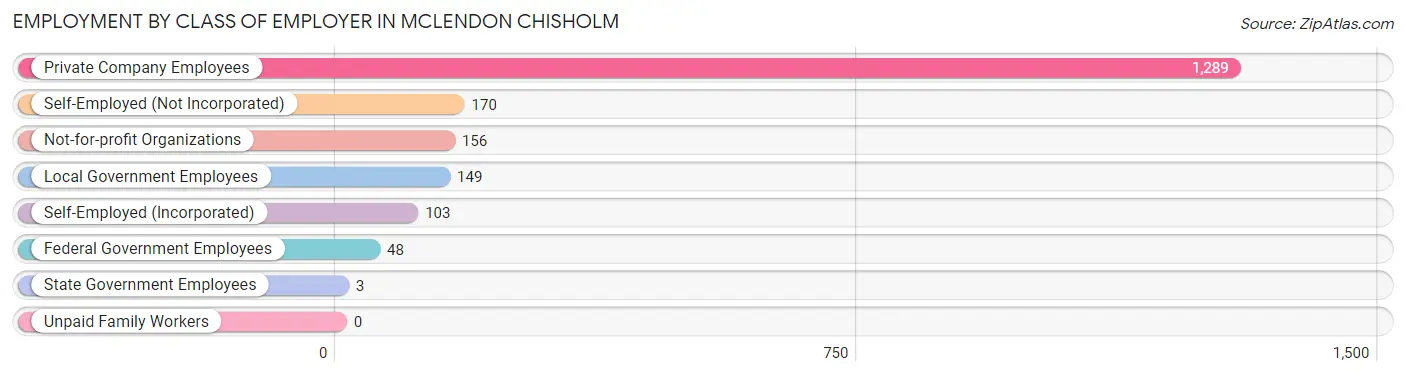
| Employer Class | # Employees | % Employees |
| Private Company Employees | 1,289 | 67.2% |
| Self-Employed (Incorporated) | 103 | 5.4% |
| Self-Employed (Not Incorporated) | 170 | 8.9% |
| Not-for-profit Organizations | 156 | 8.1% |
| Local Government Employees | 149 | 7.8% |
| State Government Employees | 3 | 0.2% |
| Federal Government Employees | 48 | 2.5% |
| Unpaid Family Workers | 0 | 0.0% |
| Total | 1,918 | 100.0% |
Employment Status by Age in McLendon Chisholm
According to the labor force statistics for McLendon Chisholm, out of the total population over 16 years of age (2,789), 70.9% or 1,977 individuals are in the labor force, with 1.9% or 38 of them unemployed. The age group with the highest labor force participation rate is 45 to 54 years, with 88.1% or 639 individuals in the labor force. Within the labor force, the 20 to 24 years age range has the highest percentage of unemployed individuals, with 15.4% or 23 of them being unemployed.
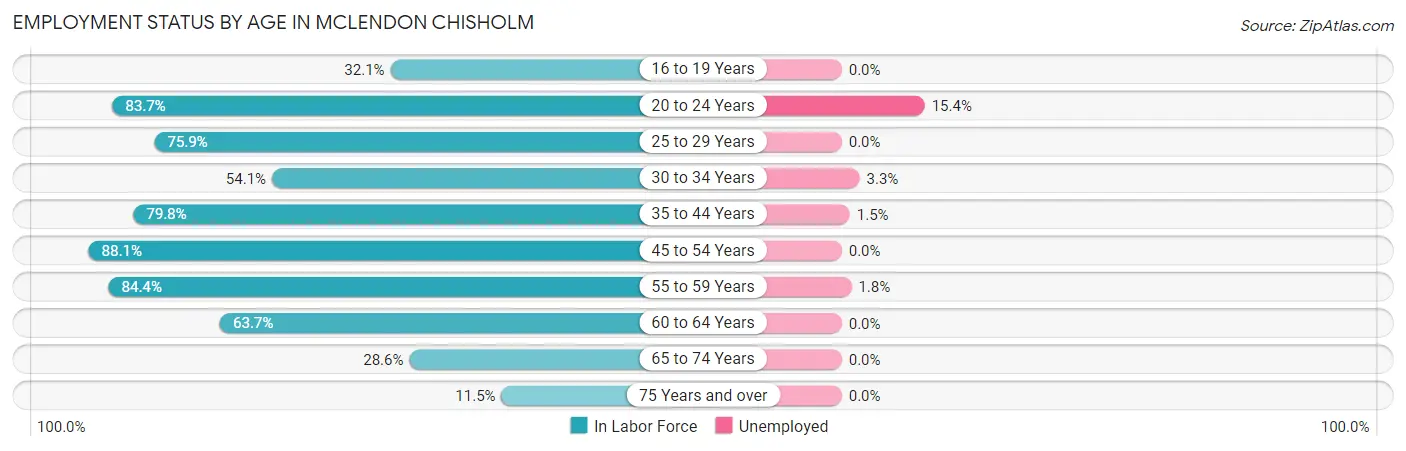
| Age Bracket | In Labor Force | Unemployed |
| 16 to 19 Years | 75 (32.1%) | 0 (0.0%) |
| 20 to 24 Years | 149 (83.7%) | 23 (15.4%) |
| 25 to 29 Years | 120 (75.9%) | 0 (0.0%) |
| 30 to 34 Years | 60 (54.1%) | 2 (3.3%) |
| 35 to 44 Years | 404 (79.8%) | 6 (1.5%) |
| 45 to 54 Years | 639 (88.1%) | 0 (0.0%) |
| 55 to 59 Years | 342 (84.4%) | 6 (1.8%) |
| 60 to 64 Years | 128 (63.7%) | 0 (0.0%) |
| 65 to 74 Years | 50 (28.6%) | 0 (0.0%) |
| 75 Years and over | 11 (11.5%) | 0 (0.0%) |
| Total | 1,977 (70.9%) | 38 (1.9%) |
Employment Status by Educational Attainment in McLendon Chisholm
According to labor force statistics for McLendon Chisholm, 80.4% of individuals (1,693) out of the total population between 25 and 64 years of age (2,106) are in the labor force, with 0.8% or 14 of them being unemployed. The group with the highest labor force participation rate are those with the educational attainment of college / associate degree, with 85.9% or 506 individuals in the labor force. Within the labor force, individuals with high school diploma education have the highest percentage of unemployment, with 5.9% or 14 of them being unemployed.
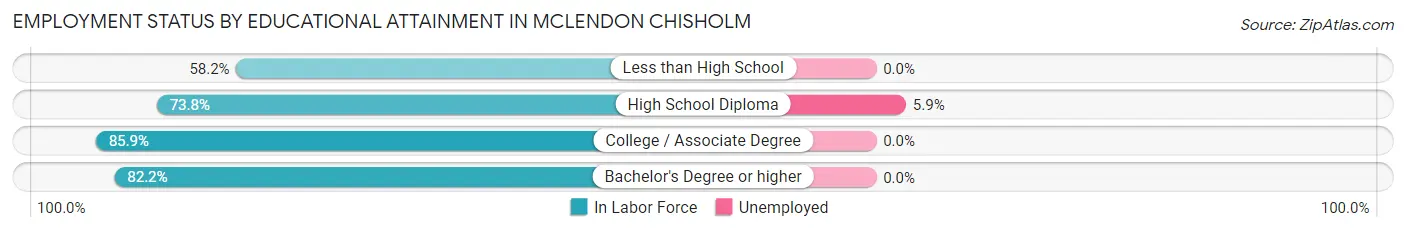
| Educational Attainment | In Labor Force | Unemployed |
| Less than High School | 78 (58.2%) | 0 (0.0%) |
| High School Diploma | 239 (73.8%) | 19 (5.9%) |
| College / Associate Degree | 506 (85.9%) | 0 (0.0%) |
| Bachelor's Degree or higher | 870 (82.2%) | 0 (0.0%) |
| Total | 1,693 (80.4%) | 17 (0.8%) |
Employment Occupations by Sex in McLendon Chisholm
Management, Business, Science and Arts Occupations
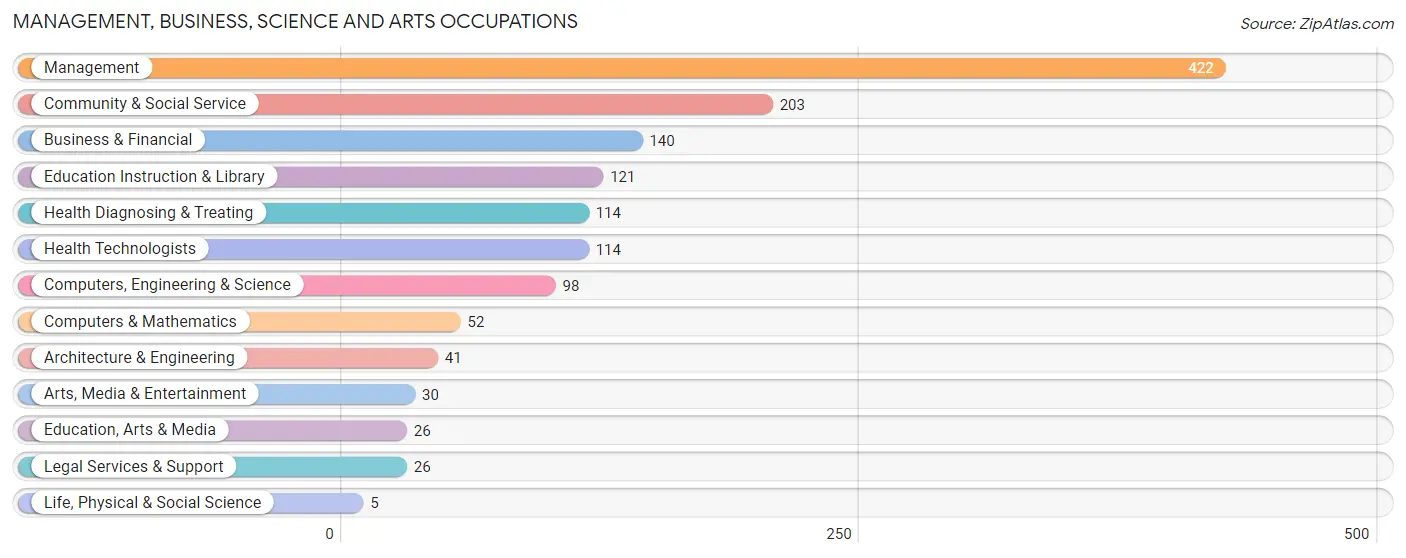
The most common Management, Business, Science and Arts occupations in McLendon Chisholm are Management (422 | 21.7%), Community & Social Service (203 | 10.5%), Business & Financial (140 | 7.2%), Education Instruction & Library (121 | 6.2%), and Health Diagnosing & Treating (114 | 5.9%).
Management, Business, Science and Arts Occupations by Sex
Within the Management, Business, Science and Arts occupations in McLendon Chisholm, the most male-oriented occupations are Architecture & Engineering (100.0%), Life, Physical & Social Science (100.0%), and Arts, Media & Entertainment (86.7%), while the most female-oriented occupations are Education Instruction & Library (81.0%), Health Diagnosing & Treating (75.4%), and Health Technologists (75.4%).
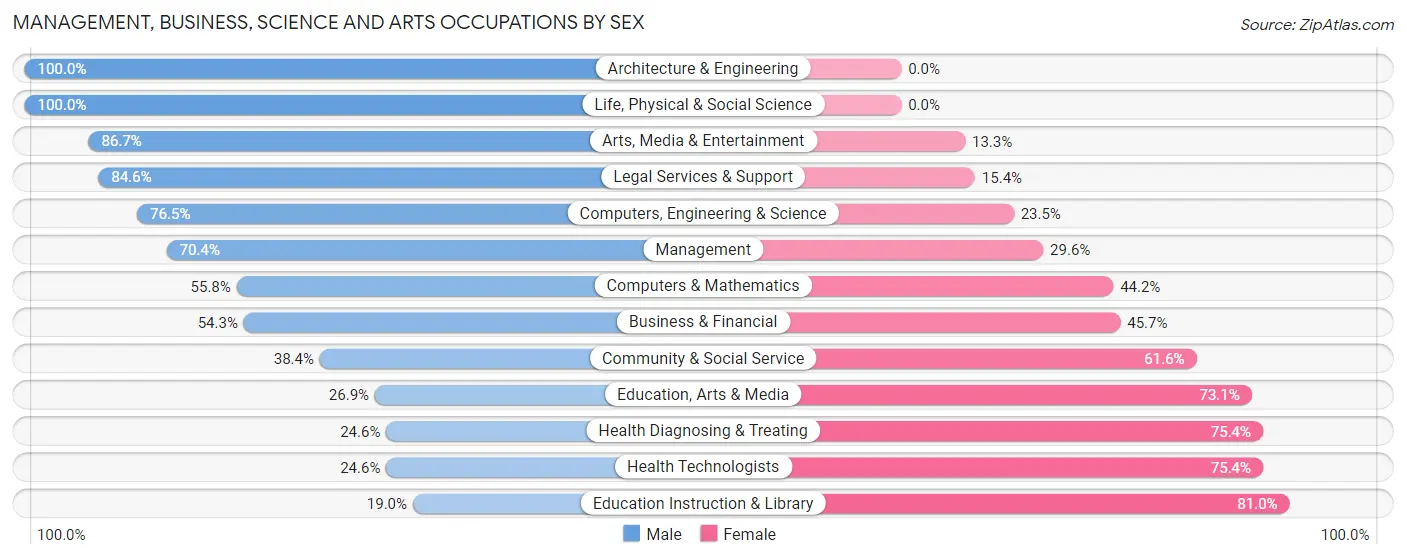
| Occupation | Male | Female |
| Management | 297 (70.4%) | 125 (29.6%) |
| Business & Financial | 76 (54.3%) | 64 (45.7%) |
| Computers, Engineering & Science | 75 (76.5%) | 23 (23.5%) |
| Computers & Mathematics | 29 (55.8%) | 23 (44.2%) |
| Architecture & Engineering | 41 (100.0%) | 0 (0.0%) |
| Life, Physical & Social Science | 5 (100.0%) | 0 (0.0%) |
| Community & Social Service | 78 (38.4%) | 125 (61.6%) |
| Education, Arts & Media | 7 (26.9%) | 19 (73.1%) |
| Legal Services & Support | 22 (84.6%) | 4 (15.4%) |
| Education Instruction & Library | 23 (19.0%) | 98 (81.0%) |
| Arts, Media & Entertainment | 26 (86.7%) | 4 (13.3%) |
| Health Diagnosing & Treating | 28 (24.6%) | 86 (75.4%) |
| Health Technologists | 28 (24.6%) | 86 (75.4%) |
| Total (Category) | 554 (56.7%) | 423 (43.3%) |
| Total (Overall) | 1,108 (57.1%) | 833 (42.9%) |
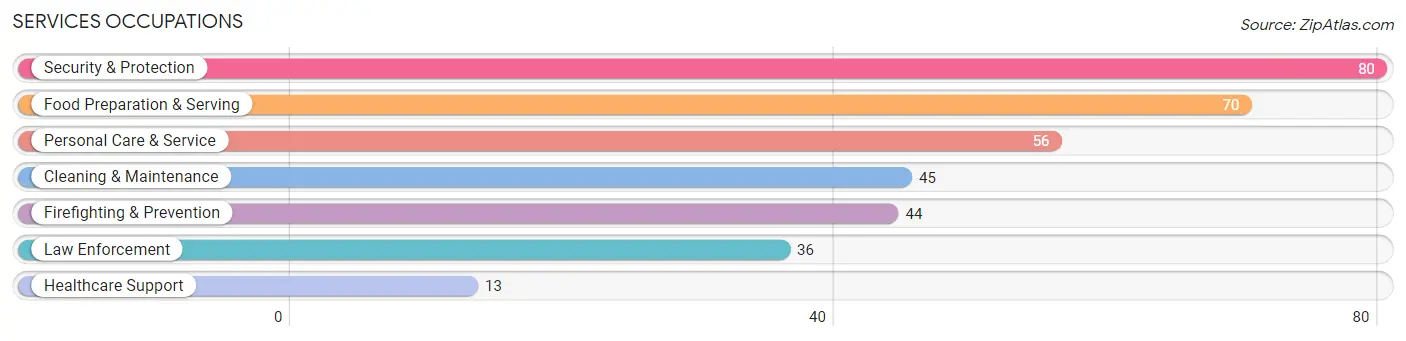
Services Occupations
The most common Services occupations in McLendon Chisholm are Security & Protection (80 | 4.1%), Food Preparation & Serving (70 | 3.6%), Personal Care & Service (56 | 2.9%), Cleaning & Maintenance (45 | 2.3%), and Firefighting & Prevention (44 | 2.3%).
Services Occupations by Sex
Within the Services occupations in McLendon Chisholm, the most male-oriented occupations are Security & Protection (100.0%), Firefighting & Prevention (100.0%), and Law Enforcement (100.0%), while the most female-oriented occupations are Healthcare Support (100.0%), Personal Care & Service (75.0%), and Food Preparation & Serving (47.1%).
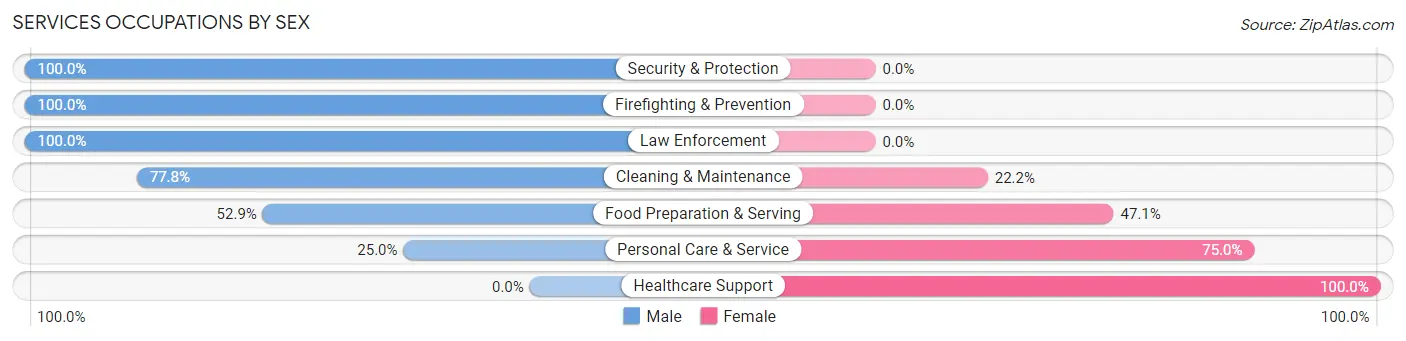
| Occupation | Male | Female |
| Healthcare Support | 0 (0.0%) | 13 (100.0%) |
| Security & Protection | 80 (100.0%) | 0 (0.0%) |
| Firefighting & Prevention | 44 (100.0%) | 0 (0.0%) |
| Law Enforcement | 36 (100.0%) | 0 (0.0%) |
| Food Preparation & Serving | 37 (52.9%) | 33 (47.1%) |
| Cleaning & Maintenance | 35 (77.8%) | 10 (22.2%) |
| Personal Care & Service | 14 (25.0%) | 42 (75.0%) |
| Total (Category) | 166 (62.9%) | 98 (37.1%) |
| Total (Overall) | 1,108 (57.1%) | 833 (42.9%) |
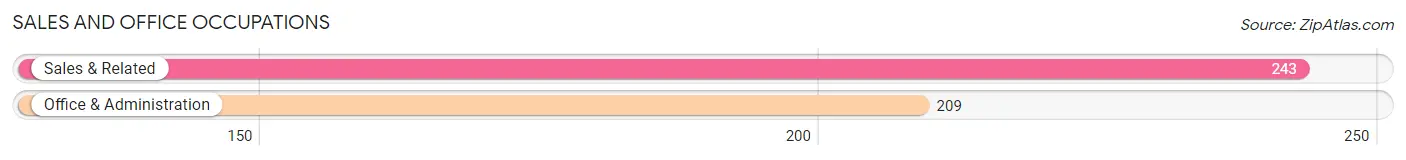
Sales and Office Occupations
The most common Sales and Office occupations in McLendon Chisholm are Sales & Related (243 | 12.5%), and Office & Administration (209 | 10.8%).
Sales and Office Occupations by Sex
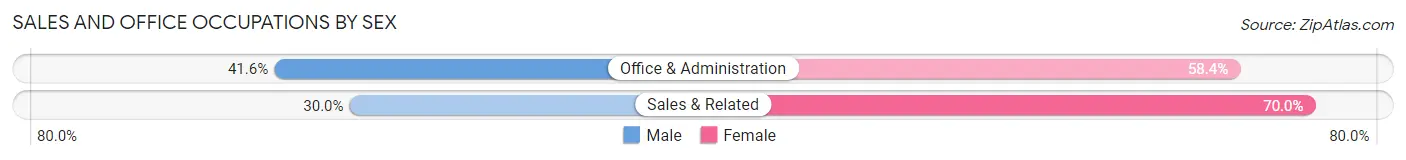
| Occupation | Male | Female |
| Sales & Related | 73 (30.0%) | 170 (70.0%) |
| Office & Administration | 87 (41.6%) | 122 (58.4%) |
| Total (Category) | 160 (35.4%) | 292 (64.6%) |
| Total (Overall) | 1,108 (57.1%) | 833 (42.9%) |
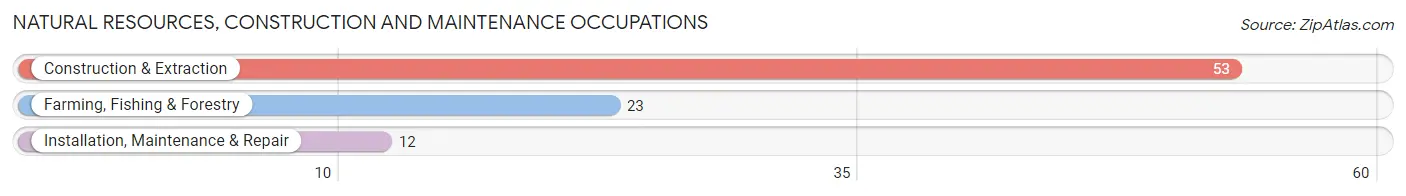
Natural Resources, Construction and Maintenance Occupations
The most common Natural Resources, Construction and Maintenance occupations in McLendon Chisholm are Construction & Extraction (53 | 2.7%), Farming, Fishing & Forestry (23 | 1.2%), and Installation, Maintenance & Repair (12 | 0.6%).
Natural Resources, Construction and Maintenance Occupations by Sex
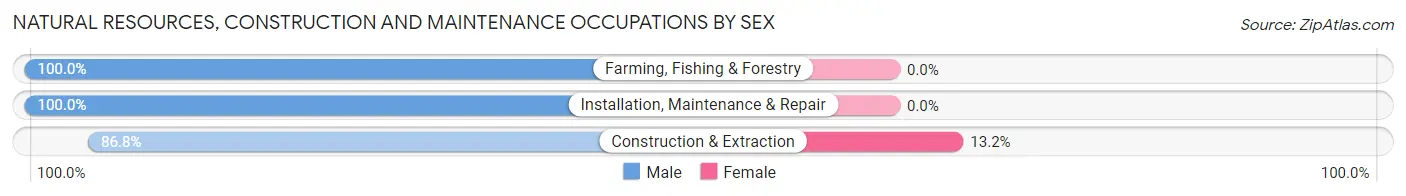
| Occupation | Male | Female |
| Farming, Fishing & Forestry | 23 (100.0%) | 0 (0.0%) |
| Construction & Extraction | 46 (86.8%) | 7 (13.2%) |
| Installation, Maintenance & Repair | 12 (100.0%) | 0 (0.0%) |
| Total (Category) | 81 (92.0%) | 7 (8.0%) |
| Total (Overall) | 1,108 (57.1%) | 833 (42.9%) |
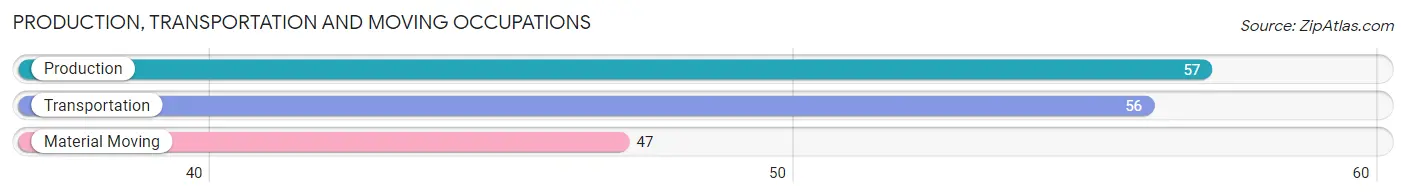
Production, Transportation and Moving Occupations
The most common Production, Transportation and Moving occupations in McLendon Chisholm are Production (57 | 2.9%), Transportation (56 | 2.9%), and Material Moving (47 | 2.4%).
Production, Transportation and Moving Occupations by Sex
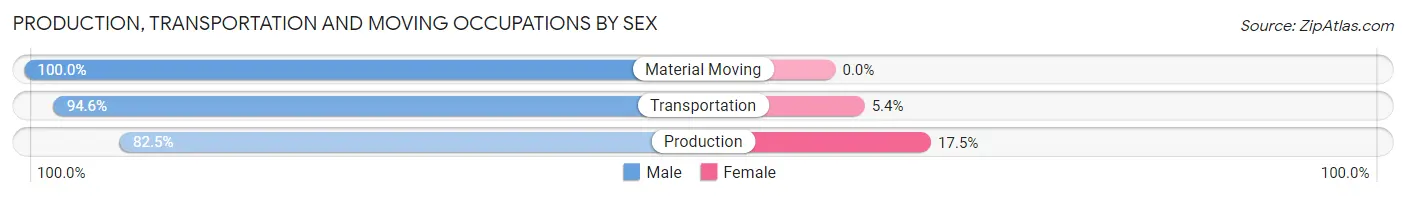
| Occupation | Male | Female |
| Production | 47 (82.5%) | 10 (17.5%) |
| Transportation | 53 (94.6%) | 3 (5.4%) |
| Material Moving | 47 (100.0%) | 0 (0.0%) |
| Total (Category) | 147 (91.9%) | 13 (8.1%) |
| Total (Overall) | 1,108 (57.1%) | 833 (42.9%) |
Employment Industries by Sex in McLendon Chisholm
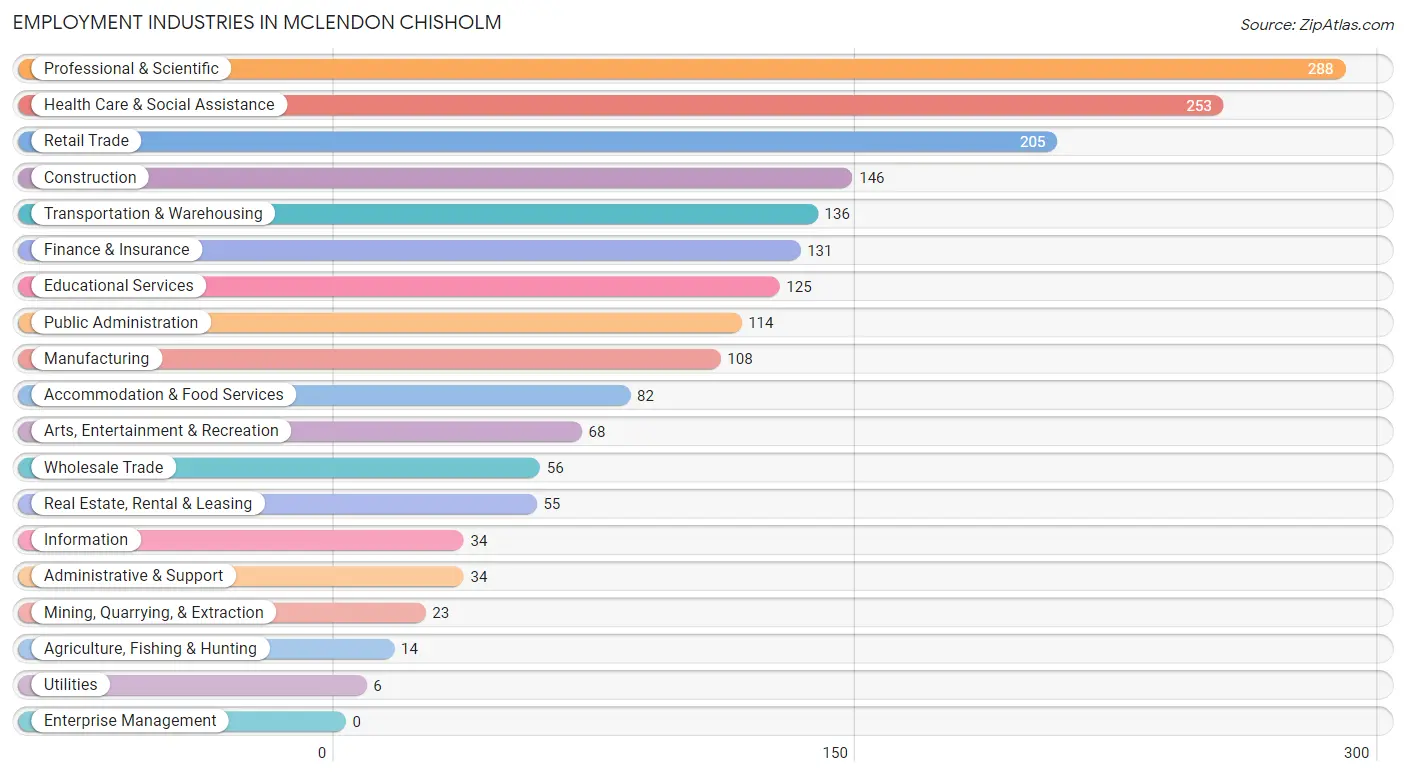
Employment Industries in McLendon Chisholm
The major employment industries in McLendon Chisholm include Professional & Scientific (288 | 14.8%), Health Care & Social Assistance (253 | 13.0%), Retail Trade (205 | 10.6%), Construction (146 | 7.5%), and Transportation & Warehousing (136 | 7.0%).
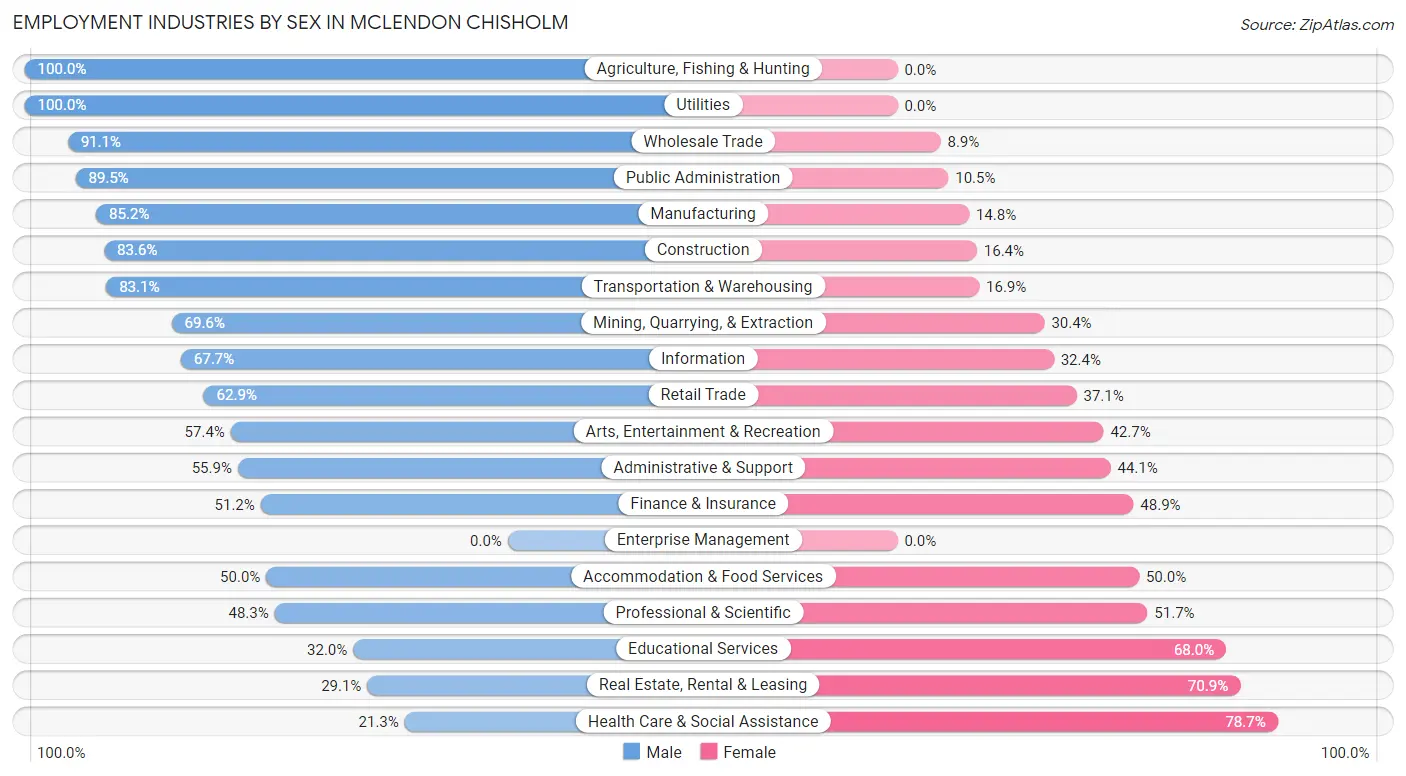
Employment Industries by Sex in McLendon Chisholm
The McLendon Chisholm industries that see more men than women are Agriculture, Fishing & Hunting (100.0%), Utilities (100.0%), and Wholesale Trade (91.1%), whereas the industries that tend to have a higher number of women are Health Care & Social Assistance (78.7%), Real Estate, Rental & Leasing (70.9%), and Educational Services (68.0%).
| Industry | Male | Female |
| Agriculture, Fishing & Hunting | 14 (100.0%) | 0 (0.0%) |
| Mining, Quarrying, & Extraction | 16 (69.6%) | 7 (30.4%) |
| Construction | 122 (83.6%) | 24 (16.4%) |
| Manufacturing | 92 (85.2%) | 16 (14.8%) |
| Wholesale Trade | 51 (91.1%) | 5 (8.9%) |
| Retail Trade | 129 (62.9%) | 76 (37.1%) |
| Transportation & Warehousing | 113 (83.1%) | 23 (16.9%) |
| Utilities | 6 (100.0%) | 0 (0.0%) |
| Information | 23 (67.6%) | 11 (32.4%) |
| Finance & Insurance | 67 (51.1%) | 64 (48.8%) |
| Real Estate, Rental & Leasing | 16 (29.1%) | 39 (70.9%) |
| Professional & Scientific | 139 (48.3%) | 149 (51.7%) |
| Enterprise Management | 0 (0.0%) | 0 (0.0%) |
| Administrative & Support | 19 (55.9%) | 15 (44.1%) |
| Educational Services | 40 (32.0%) | 85 (68.0%) |
| Health Care & Social Assistance | 54 (21.3%) | 199 (78.7%) |
| Arts, Entertainment & Recreation | 39 (57.4%) | 29 (42.6%) |
| Accommodation & Food Services | 41 (50.0%) | 41 (50.0%) |
| Public Administration | 102 (89.5%) | 12 (10.5%) |
| Total | 1,108 (57.1%) | 833 (42.9%) |
Education in McLendon Chisholm
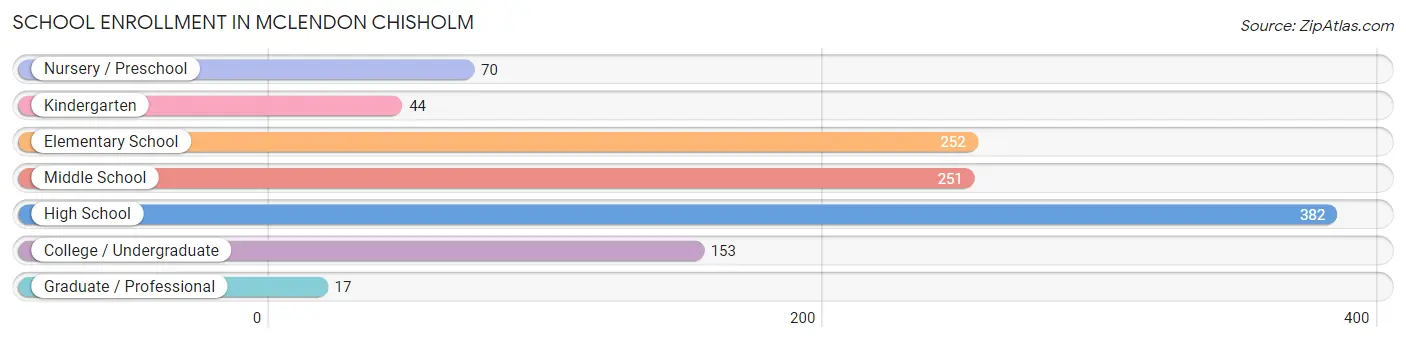
School Enrollment in McLendon Chisholm
The most common levels of schooling among the 1,169 students in McLendon Chisholm are high school (382 | 32.7%), elementary school (252 | 21.6%), and middle school (251 | 21.5%).
| School Level | # Students | % Students |
| Nursery / Preschool | 70 | 6.0% |
| Kindergarten | 44 | 3.8% |
| Elementary School | 252 | 21.6% |
| Middle School | 251 | 21.5% |
| High School | 382 | 32.7% |
| College / Undergraduate | 153 | 13.1% |
| Graduate / Professional | 17 | 1.5% |
| Total | 1,169 | 100.0% |
School Enrollment by Age by Funding Source in McLendon Chisholm
Out of a total of 1,169 students who are enrolled in schools in McLendon Chisholm, 188 (16.1%) attend a private institution, while the remaining 981 (83.9%) are enrolled in public schools. The age group of 3 to 4 year olds has the highest likelihood of being enrolled in private schools, with 41 (100.0% in the age bracket) enrolled. Conversely, the age group of 35 years and over has the lowest likelihood of being enrolled in a private school, with 45 (100.0% in the age bracket) attending a public institution.
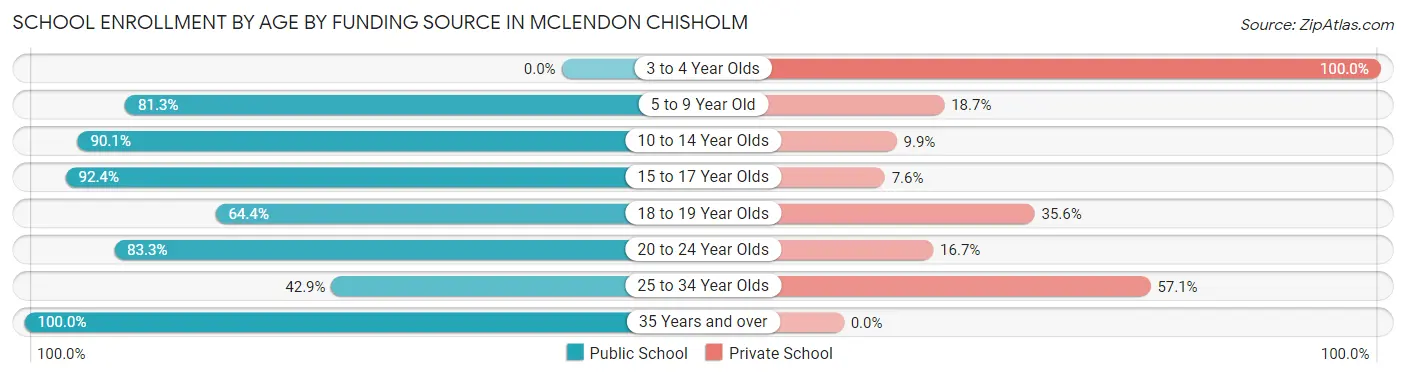
| Age Bracket | Public School | Private School |
| 3 to 4 Year Olds | 0 (0.0%) | 41 (100.0%) |
| 5 to 9 Year Old | 230 (81.3%) | 53 (18.7%) |
| 10 to 14 Year Olds | 311 (90.1%) | 34 (9.9%) |
| 15 to 17 Year Olds | 278 (92.4%) | 23 (7.6%) |
| 18 to 19 Year Olds | 29 (64.4%) | 16 (35.6%) |
| 20 to 24 Year Olds | 85 (83.3%) | 17 (16.7%) |
| 25 to 34 Year Olds | 3 (42.9%) | 4 (57.1%) |
| 35 Years and over | 45 (100.0%) | 0 (0.0%) |
| Total | 981 (83.9%) | 188 (16.1%) |
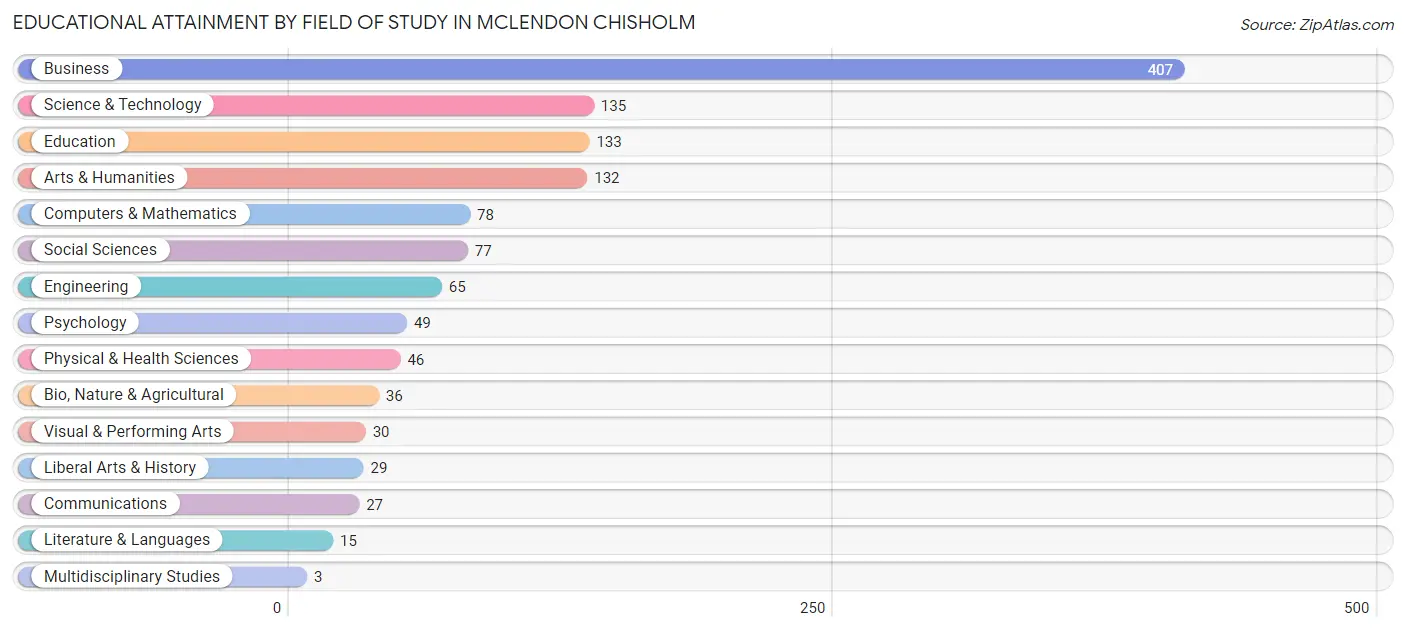
Educational Attainment by Field of Study in McLendon Chisholm
Business (407 | 32.3%), science & technology (135 | 10.7%), education (133 | 10.5%), arts & humanities (132 | 10.5%), and computers & mathematics (78 | 6.2%) are the most common fields of study among 1,262 individuals in McLendon Chisholm who have obtained a bachelor's degree or higher.
| Field of Study | # Graduates | % Graduates |
| Computers & Mathematics | 78 | 6.2% |
| Bio, Nature & Agricultural | 36 | 2.9% |
| Physical & Health Sciences | 46 | 3.6% |
| Psychology | 49 | 3.9% |
| Social Sciences | 77 | 6.1% |
| Engineering | 65 | 5.1% |
| Multidisciplinary Studies | 3 | 0.2% |
| Science & Technology | 135 | 10.7% |
| Business | 407 | 32.3% |
| Education | 133 | 10.5% |
| Literature & Languages | 15 | 1.2% |
| Liberal Arts & History | 29 | 2.3% |
| Visual & Performing Arts | 30 | 2.4% |
| Communications | 27 | 2.1% |
| Arts & Humanities | 132 | 10.5% |
| Total | 1,262 | 100.0% |
Transportation & Commute in McLendon Chisholm
Vehicle Availability by Sex in McLendon Chisholm
The most prevalent vehicle ownership categories in McLendon Chisholm are males with 3 vehicles (410, accounting for 37.3%) and females with 3 vehicles (220, making up 50.1%).
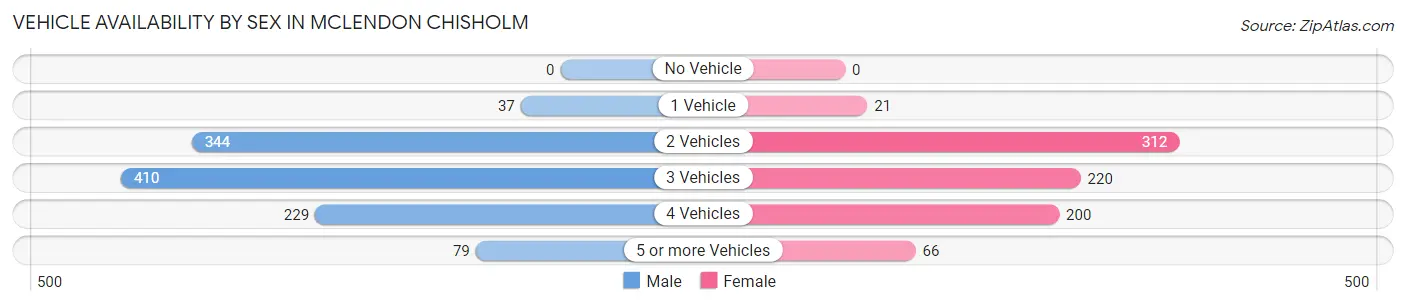
| Vehicles Available | Male | Female |
| No Vehicle | 0 (0.0%) | 0 (0.0%) |
| 1 Vehicle | 37 (3.4%) | 21 (2.6%) |
| 2 Vehicles | 344 (31.3%) | 312 (38.1%) |
| 3 Vehicles | 410 (37.3%) | 220 (26.9%) |
| 4 Vehicles | 229 (20.8%) | 200 (24.4%) |
| 5 or more Vehicles | 79 (7.2%) | 66 (8.1%) |
| Total | 1,099 (100.0%) | 819 (100.0%) |
Commute Time in McLendon Chisholm
The most frequently occuring commute durations in McLendon Chisholm are 45 to 59 minutes (347 commuters, 21.9%), 60 to 89 minutes (307 commuters, 19.3%), and 15 to 19 minutes (225 commuters, 14.2%).
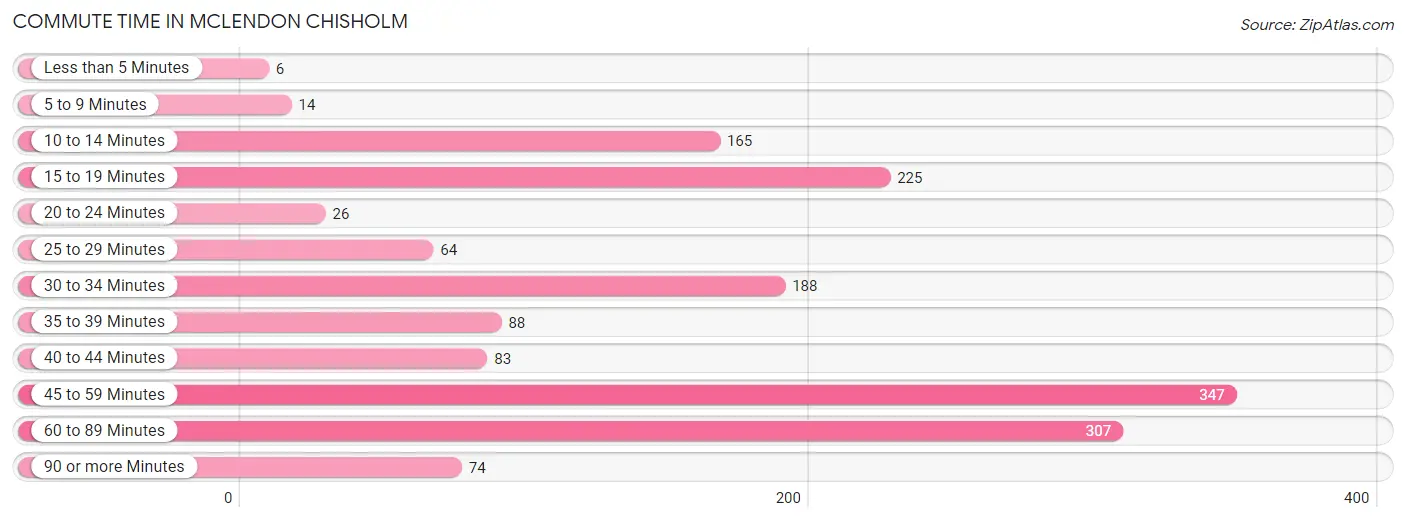
| Commute Time | # Commuters | % Commuters |
| Less than 5 Minutes | 6 | 0.4% |
| 5 to 9 Minutes | 14 | 0.9% |
| 10 to 14 Minutes | 165 | 10.4% |
| 15 to 19 Minutes | 225 | 14.2% |
| 20 to 24 Minutes | 26 | 1.6% |
| 25 to 29 Minutes | 64 | 4.0% |
| 30 to 34 Minutes | 188 | 11.8% |
| 35 to 39 Minutes | 88 | 5.6% |
| 40 to 44 Minutes | 83 | 5.2% |
| 45 to 59 Minutes | 347 | 21.9% |
| 60 to 89 Minutes | 307 | 19.3% |
| 90 or more Minutes | 74 | 4.7% |
Commute Time by Sex in McLendon Chisholm
The most common commute times in McLendon Chisholm are 60 to 89 minutes (249 commuters, 26.3%) for males and 15 to 19 minutes (148 commuters, 23.1%) for females.
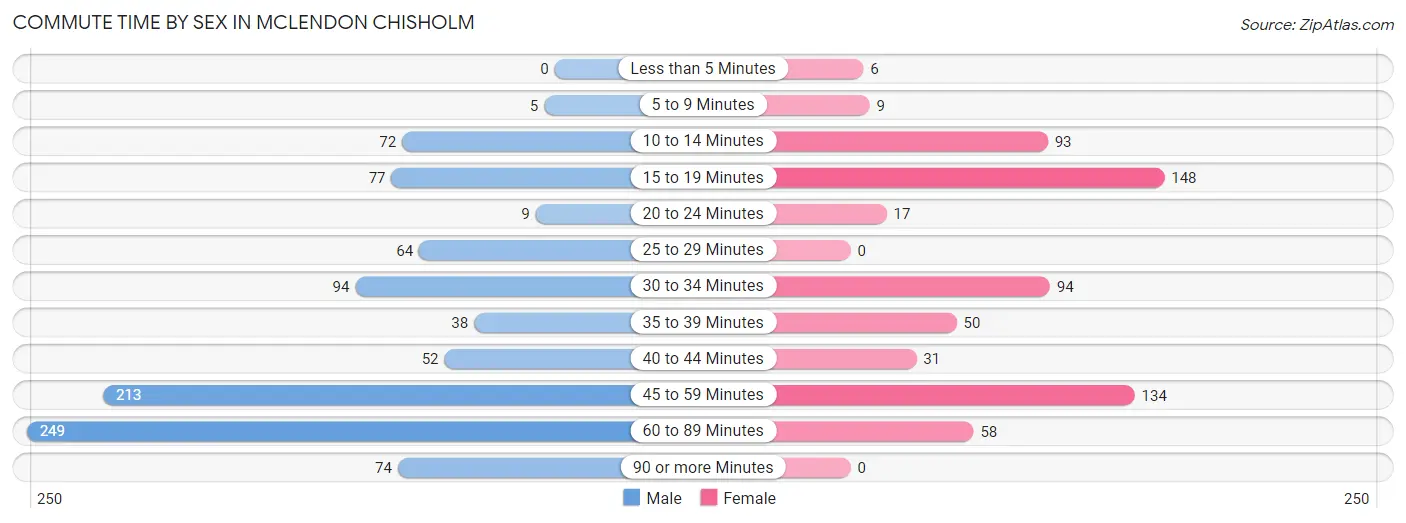
| Commute Time | Male | Female |
| Less than 5 Minutes | 0 (0.0%) | 6 (0.9%) |
| 5 to 9 Minutes | 5 (0.5%) | 9 (1.4%) |
| 10 to 14 Minutes | 72 (7.6%) | 93 (14.5%) |
| 15 to 19 Minutes | 77 (8.1%) | 148 (23.1%) |
| 20 to 24 Minutes | 9 (0.9%) | 17 (2.7%) |
| 25 to 29 Minutes | 64 (6.8%) | 0 (0.0%) |
| 30 to 34 Minutes | 94 (9.9%) | 94 (14.7%) |
| 35 to 39 Minutes | 38 (4.0%) | 50 (7.8%) |
| 40 to 44 Minutes | 52 (5.5%) | 31 (4.8%) |
| 45 to 59 Minutes | 213 (22.5%) | 134 (20.9%) |
| 60 to 89 Minutes | 249 (26.3%) | 58 (9.1%) |
| 90 or more Minutes | 74 (7.8%) | 0 (0.0%) |
Time of Departure to Work by Sex in McLendon Chisholm
The most frequent times of departure to work in McLendon Chisholm are 7:30 AM to 7:59 AM (124, 13.1%) for males and 6:00 AM to 6:29 AM (120, 18.8%) for females.
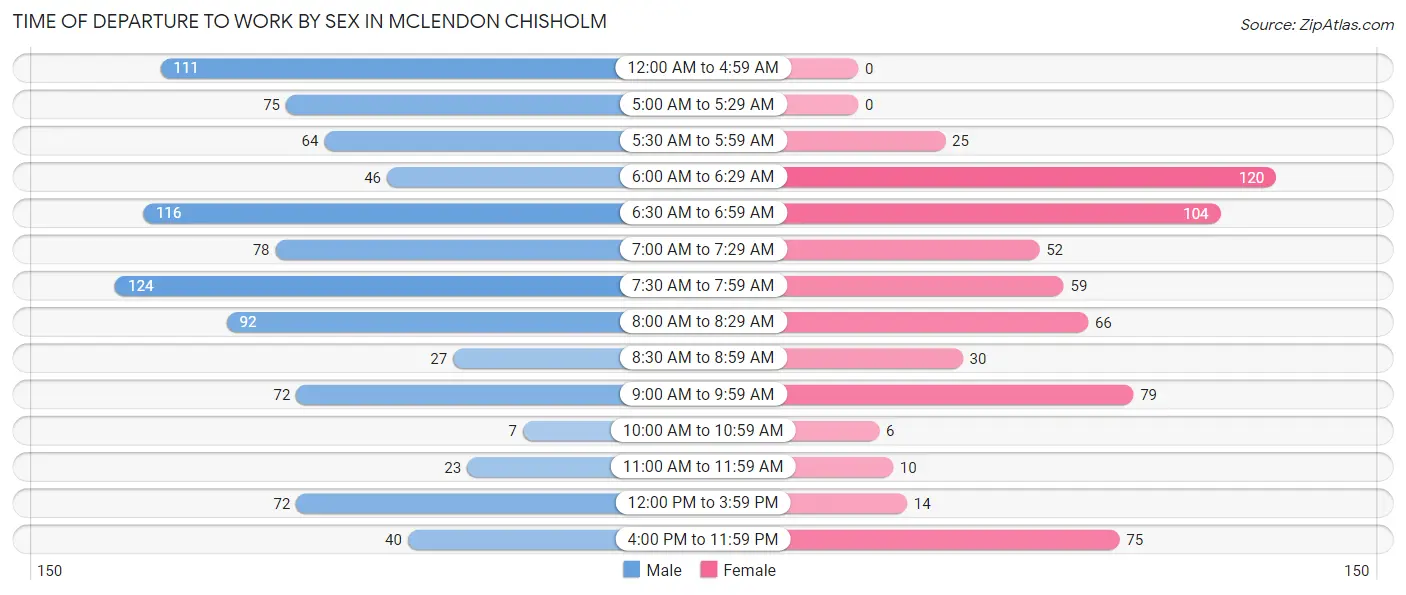
| Time of Departure | Male | Female |
| 12:00 AM to 4:59 AM | 111 (11.7%) | 0 (0.0%) |
| 5:00 AM to 5:29 AM | 75 (7.9%) | 0 (0.0%) |
| 5:30 AM to 5:59 AM | 64 (6.8%) | 25 (3.9%) |
| 6:00 AM to 6:29 AM | 46 (4.9%) | 120 (18.8%) |
| 6:30 AM to 6:59 AM | 116 (12.2%) | 104 (16.3%) |
| 7:00 AM to 7:29 AM | 78 (8.2%) | 52 (8.1%) |
| 7:30 AM to 7:59 AM | 124 (13.1%) | 59 (9.2%) |
| 8:00 AM to 8:29 AM | 92 (9.7%) | 66 (10.3%) |
| 8:30 AM to 8:59 AM | 27 (2.9%) | 30 (4.7%) |
| 9:00 AM to 9:59 AM | 72 (7.6%) | 79 (12.3%) |
| 10:00 AM to 10:59 AM | 7 (0.7%) | 6 (0.9%) |
| 11:00 AM to 11:59 AM | 23 (2.4%) | 10 (1.6%) |
| 12:00 PM to 3:59 PM | 72 (7.6%) | 14 (2.2%) |
| 4:00 PM to 11:59 PM | 40 (4.2%) | 75 (11.7%) |
| Total | 947 (100.0%) | 640 (100.0%) |
Housing Occupancy in McLendon Chisholm
Occupancy by Ownership in McLendon Chisholm
Of the total 1,155 dwellings in McLendon Chisholm, owner-occupied units account for 1,146 (99.2%), while renter-occupied units make up 9 (0.8%).
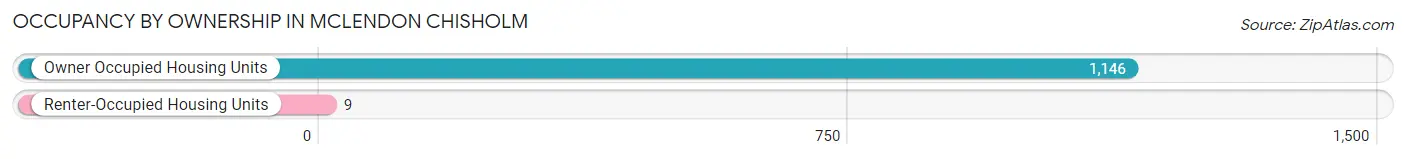
| Occupancy | # Housing Units | % Housing Units |
| Owner Occupied Housing Units | 1,146 | 99.2% |
| Renter-Occupied Housing Units | 9 | 0.8% |
| Total Occupied Housing Units | 1,155 | 100.0% |
Occupancy by Household Size in McLendon Chisholm
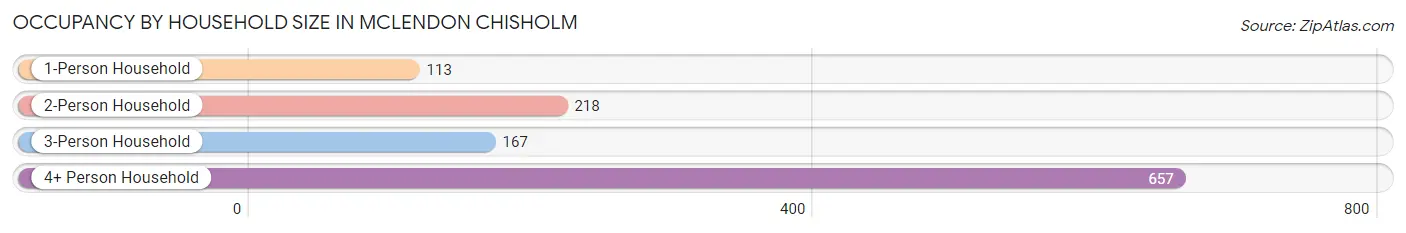
| Household Size | # Housing Units | % Housing Units |
| 1-Person Household | 113 | 9.8% |
| 2-Person Household | 218 | 18.9% |
| 3-Person Household | 167 | 14.5% |
| 4+ Person Household | 657 | 56.9% |
| Total Housing Units | 1,155 | 100.0% |
Occupancy by Ownership by Household Size in McLendon Chisholm
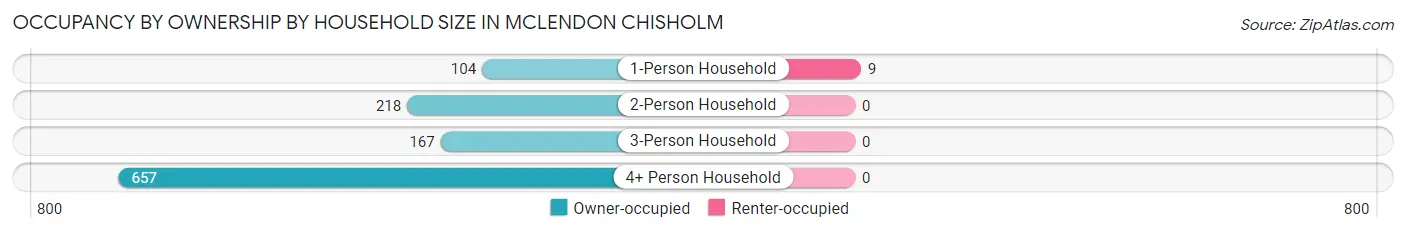
| Household Size | Owner-occupied | Renter-occupied |
| 1-Person Household | 104 (92.0%) | 9 (8.0%) |
| 2-Person Household | 218 (100.0%) | 0 (0.0%) |
| 3-Person Household | 167 (100.0%) | 0 (0.0%) |
| 4+ Person Household | 657 (100.0%) | 0 (0.0%) |
| Total Housing Units | 1,146 (99.2%) | 9 (0.8%) |
Occupancy by Educational Attainment in McLendon Chisholm
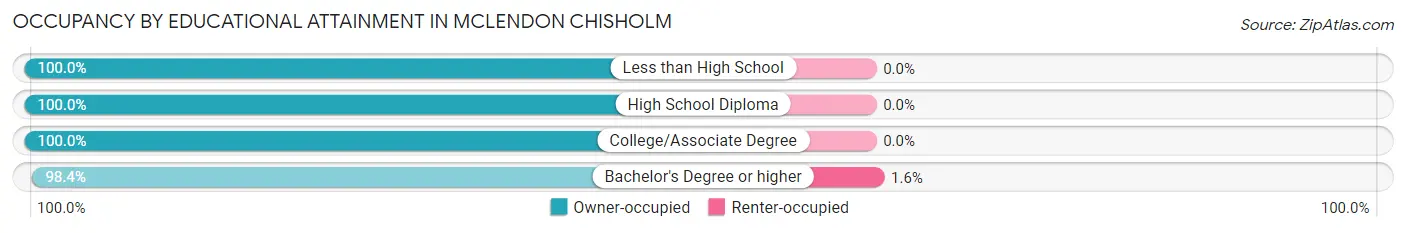
| Household Size | Owner-occupied | Renter-occupied |
| Less than High School | 84 (100.0%) | 0 (0.0%) |
| High School Diploma | 134 (100.0%) | 0 (0.0%) |
| College/Associate Degree | 365 (100.0%) | 0 (0.0%) |
| Bachelor's Degree or higher | 563 (98.4%) | 9 (1.6%) |
Occupancy by Age of Householder in McLendon Chisholm
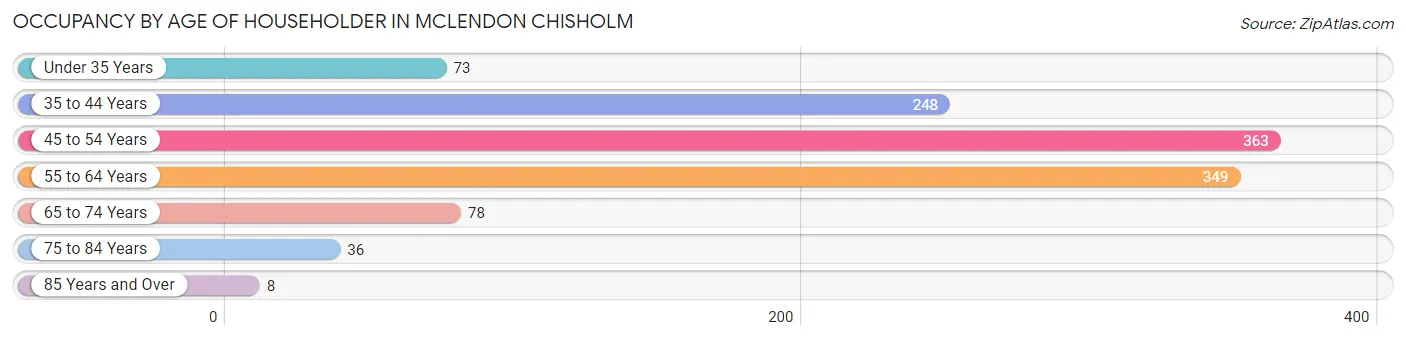
| Age Bracket | # Households | % Households |
| Under 35 Years | 73 | 6.3% |
| 35 to 44 Years | 248 | 21.5% |
| 45 to 54 Years | 363 | 31.4% |
| 55 to 64 Years | 349 | 30.2% |
| 65 to 74 Years | 78 | 6.8% |
| 75 to 84 Years | 36 | 3.1% |
| 85 Years and Over | 8 | 0.7% |
| Total | 1,155 | 100.0% |
Housing Finances in McLendon Chisholm
Median Income by Occupancy in McLendon Chisholm
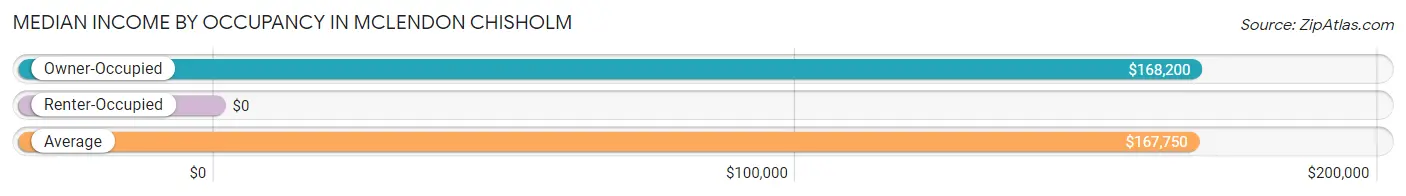
| Occupancy Type | # Households | Median Income |
| Owner-Occupied | 1,146 (99.2%) | $168,200 |
| Renter-Occupied | 9 (0.8%) | $0 |
| Average | 1,155 (100.0%) | $167,750 |
Occupancy by Householder Income Bracket in McLendon Chisholm
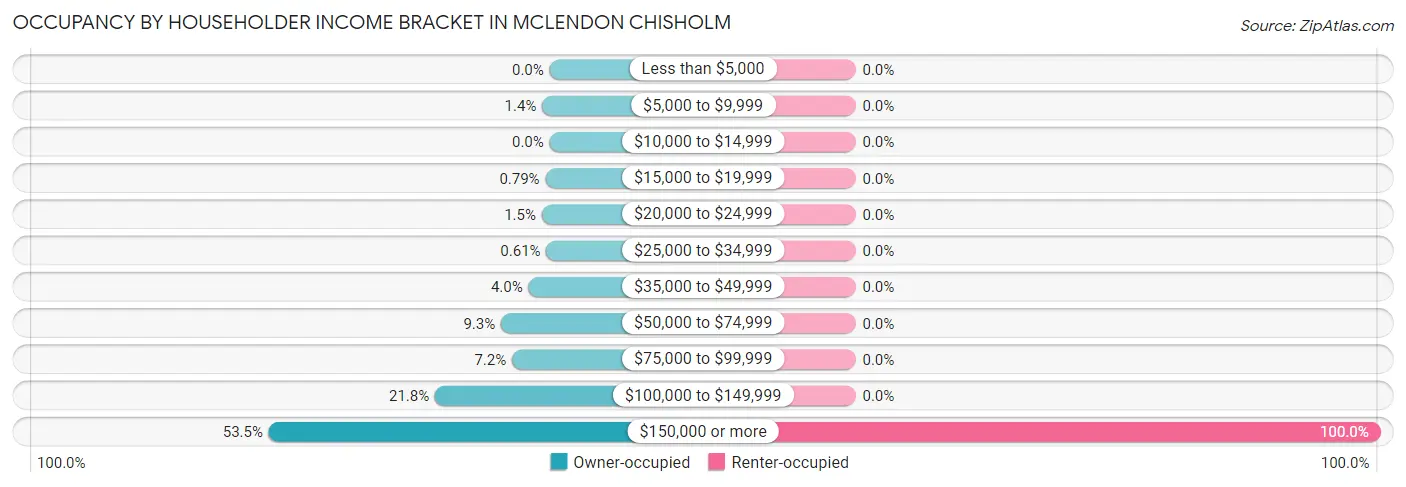
| Income Bracket | Owner-occupied | Renter-occupied |
| Less than $5,000 | 0 (0.0%) | 0 (0.0%) |
| $5,000 to $9,999 | 16 (1.4%) | 0 (0.0%) |
| $10,000 to $14,999 | 0 (0.0%) | 0 (0.0%) |
| $15,000 to $19,999 | 9 (0.8%) | 0 (0.0%) |
| $20,000 to $24,999 | 17 (1.5%) | 0 (0.0%) |
| $25,000 to $34,999 | 7 (0.6%) | 0 (0.0%) |
| $35,000 to $49,999 | 46 (4.0%) | 0 (0.0%) |
| $50,000 to $74,999 | 106 (9.2%) | 0 (0.0%) |
| $75,000 to $99,999 | 82 (7.2%) | 0 (0.0%) |
| $100,000 to $149,999 | 250 (21.8%) | 0 (0.0%) |
| $150,000 or more | 613 (53.5%) | 9 (100.0%) |
| Total | 1,146 (100.0%) | 9 (100.0%) |
Monthly Housing Cost Tiers in McLendon Chisholm
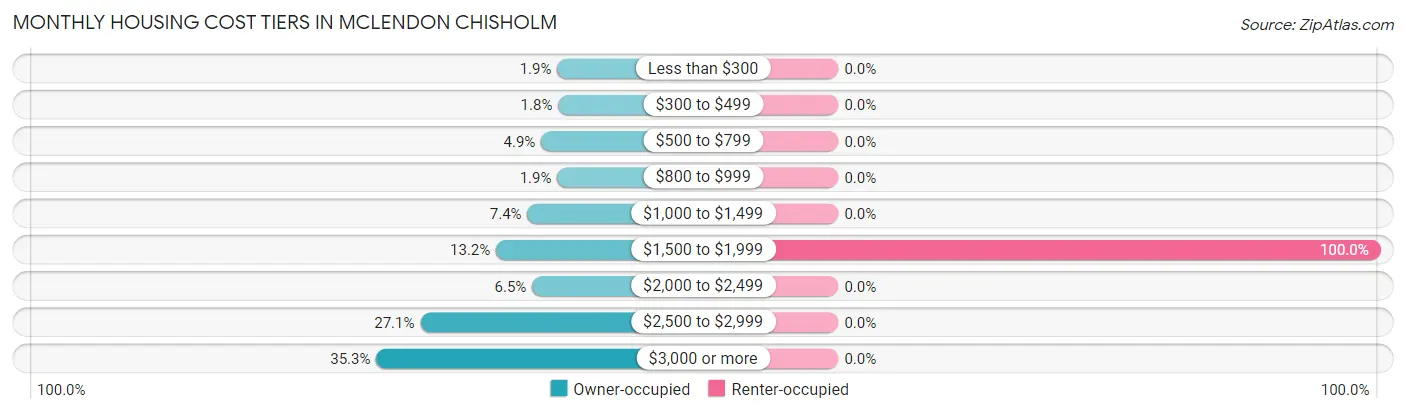
| Monthly Cost | Owner-occupied | Renter-occupied |
| Less than $300 | 22 (1.9%) | 0 (0.0%) |
| $300 to $499 | 20 (1.8%) | 0 (0.0%) |
| $500 to $799 | 56 (4.9%) | 0 (0.0%) |
| $800 to $999 | 22 (1.9%) | 0 (0.0%) |
| $1,000 to $1,499 | 85 (7.4%) | 0 (0.0%) |
| $1,500 to $1,999 | 151 (13.2%) | 9 (100.0%) |
| $2,000 to $2,499 | 75 (6.5%) | 0 (0.0%) |
| $2,500 to $2,999 | 311 (27.1%) | 0 (0.0%) |
| $3,000 or more | 404 (35.2%) | 0 (0.0%) |
| Total | 1,146 (100.0%) | 9 (100.0%) |
Physical Housing Characteristics in McLendon Chisholm
Housing Structures in McLendon Chisholm
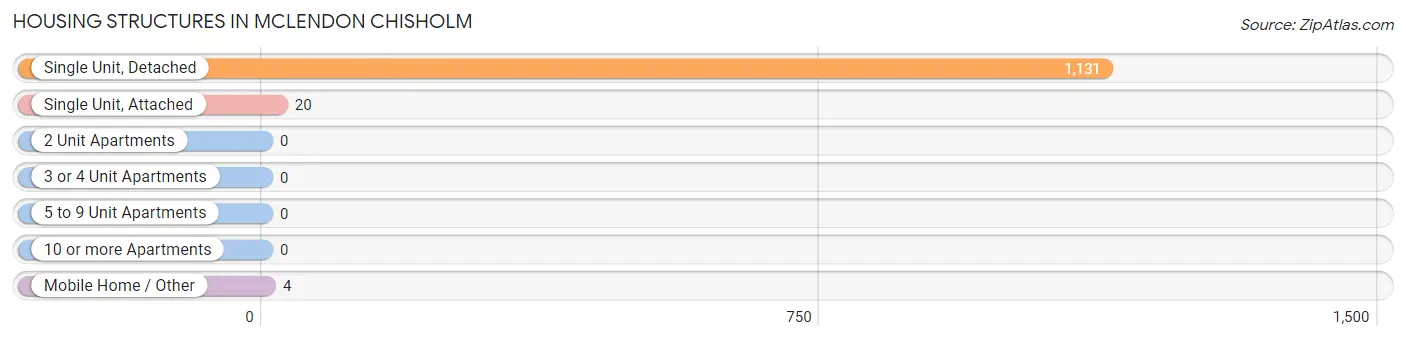
| Structure Type | # Housing Units | % Housing Units |
| Single Unit, Detached | 1,131 | 97.9% |
| Single Unit, Attached | 20 | 1.7% |
| 2 Unit Apartments | 0 | 0.0% |
| 3 or 4 Unit Apartments | 0 | 0.0% |
| 5 to 9 Unit Apartments | 0 | 0.0% |
| 10 or more Apartments | 0 | 0.0% |
| Mobile Home / Other | 4 | 0.4% |
| Total | 1,155 | 100.0% |
Housing Structures by Occupancy in McLendon Chisholm
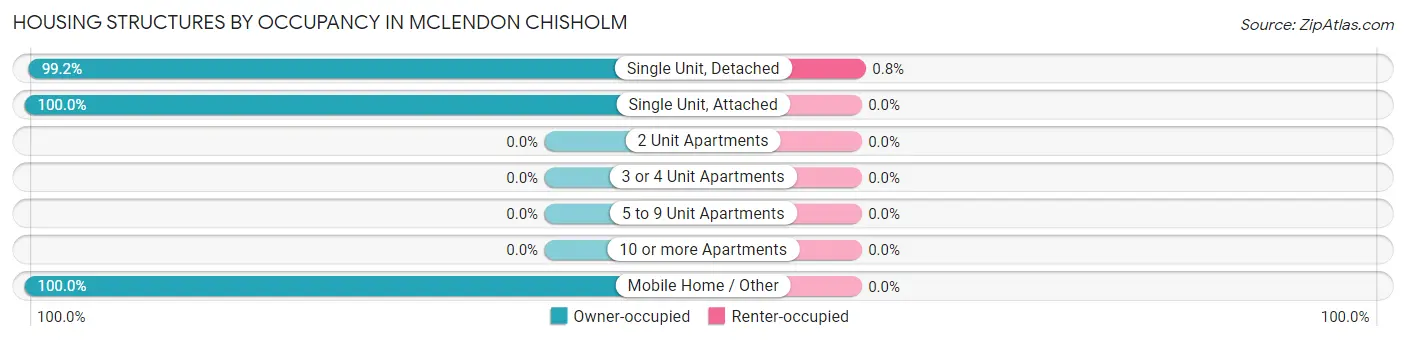
| Structure Type | Owner-occupied | Renter-occupied |
| Single Unit, Detached | 1,122 (99.2%) | 9 (0.8%) |
| Single Unit, Attached | 20 (100.0%) | 0 (0.0%) |
| 2 Unit Apartments | 0 (0.0%) | 0 (0.0%) |
| 3 or 4 Unit Apartments | 0 (0.0%) | 0 (0.0%) |
| 5 to 9 Unit Apartments | 0 (0.0%) | 0 (0.0%) |
| 10 or more Apartments | 0 (0.0%) | 0 (0.0%) |
| Mobile Home / Other | 4 (100.0%) | 0 (0.0%) |
| Total | 1,146 (99.2%) | 9 (0.8%) |
Housing Structures by Number of Rooms in McLendon Chisholm
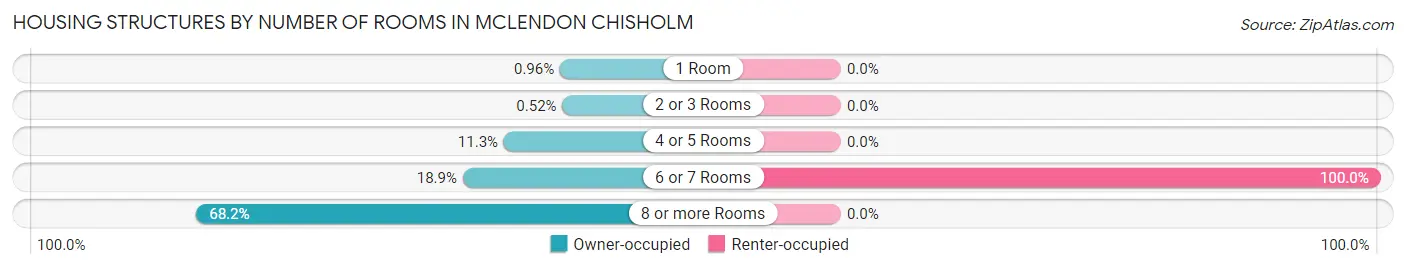
| Number of Rooms | Owner-occupied | Renter-occupied |
| 1 Room | 11 (1.0%) | 0 (0.0%) |
| 2 or 3 Rooms | 6 (0.5%) | 0 (0.0%) |
| 4 or 5 Rooms | 130 (11.3%) | 0 (0.0%) |
| 6 or 7 Rooms | 217 (18.9%) | 9 (100.0%) |
| 8 or more Rooms | 782 (68.2%) | 0 (0.0%) |
| Total | 1,146 (100.0%) | 9 (100.0%) |
Housing Structure by Heating Type in McLendon Chisholm
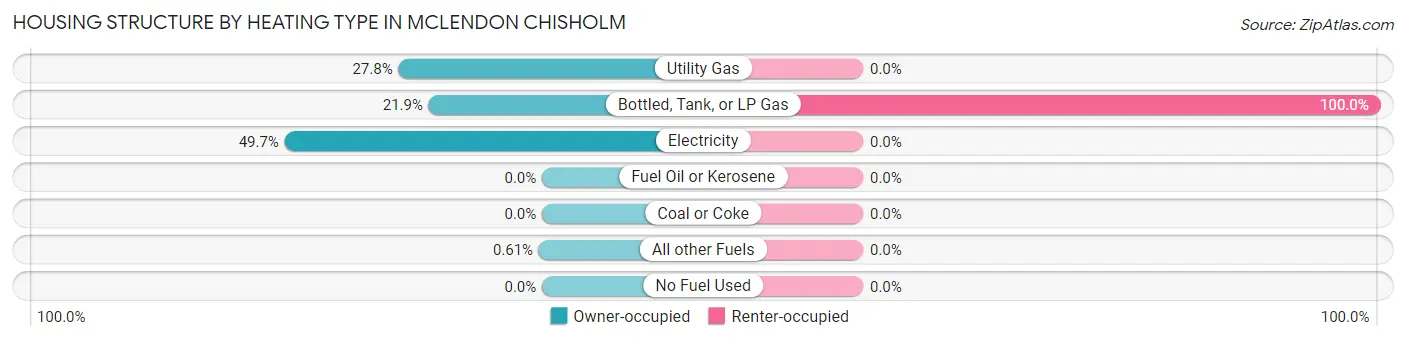
| Heating Type | Owner-occupied | Renter-occupied |
| Utility Gas | 318 (27.8%) | 0 (0.0%) |
| Bottled, Tank, or LP Gas | 251 (21.9%) | 9 (100.0%) |
| Electricity | 570 (49.7%) | 0 (0.0%) |
| Fuel Oil or Kerosene | 0 (0.0%) | 0 (0.0%) |
| Coal or Coke | 0 (0.0%) | 0 (0.0%) |
| All other Fuels | 7 (0.6%) | 0 (0.0%) |
| No Fuel Used | 0 (0.0%) | 0 (0.0%) |
| Total | 1,146 (100.0%) | 9 (100.0%) |
Household Vehicle Usage in McLendon Chisholm
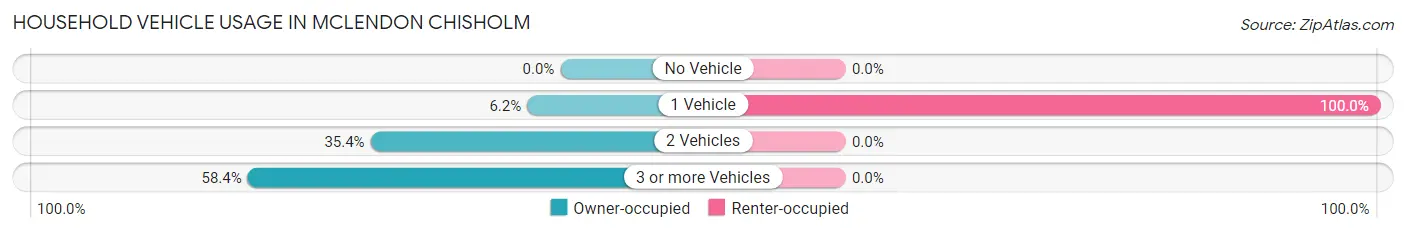
| Vehicles per Household | Owner-occupied | Renter-occupied |
| No Vehicle | 0 (0.0%) | 0 (0.0%) |
| 1 Vehicle | 71 (6.2%) | 9 (100.0%) |
| 2 Vehicles | 406 (35.4%) | 0 (0.0%) |
| 3 or more Vehicles | 669 (58.4%) | 0 (0.0%) |
| Total | 1,146 (100.0%) | 9 (100.0%) |
Real Estate & Mortgages in McLendon Chisholm
Real Estate and Mortgage Overview in McLendon Chisholm
| Characteristic | Without Mortgage | With Mortgage |
| Housing Units | 281 | 865 |
| Median Property Value | $579,500 | $567,300 |
| Median Household Income | $131,838 | $484 |
| Monthly Housing Costs | $1,202 | $399 |
| Real Estate Taxes | $8,449 | $47 |
Property Value by Mortgage Status in McLendon Chisholm
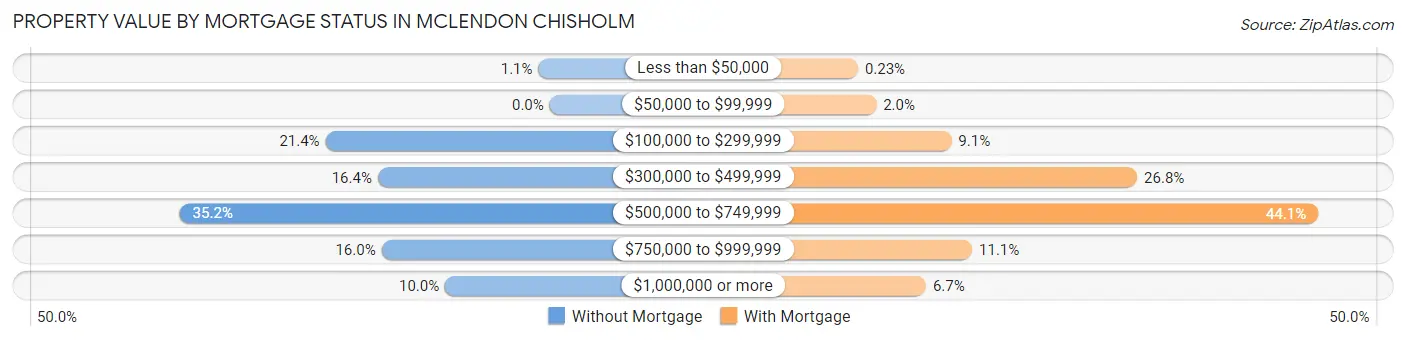
| Property Value | Without Mortgage | With Mortgage |
| Less than $50,000 | 3 (1.1%) | 2 (0.2%) |
| $50,000 to $99,999 | 0 (0.0%) | 17 (2.0%) |
| $100,000 to $299,999 | 60 (21.3%) | 79 (9.1%) |
| $300,000 to $499,999 | 46 (16.4%) | 232 (26.8%) |
| $500,000 to $749,999 | 99 (35.2%) | 381 (44.1%) |
| $750,000 to $999,999 | 45 (16.0%) | 96 (11.1%) |
| $1,000,000 or more | 28 (10.0%) | 58 (6.7%) |
| Total | 281 (100.0%) | 865 (100.0%) |
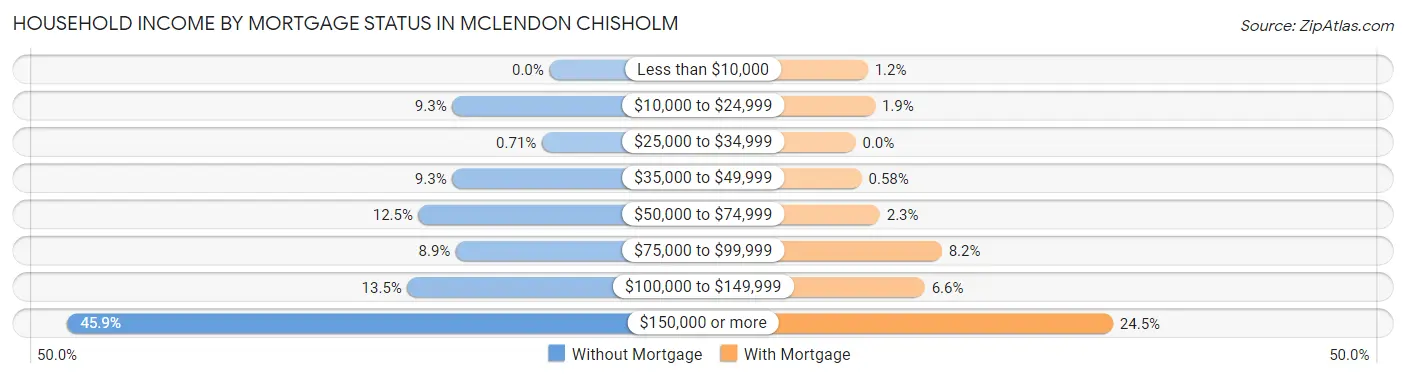
Household Income by Mortgage Status in McLendon Chisholm
| Household Income | Without Mortgage | With Mortgage |
| Less than $10,000 | 0 (0.0%) | 10 (1.2%) |
| $10,000 to $24,999 | 26 (9.2%) | 16 (1.8%) |
| $25,000 to $34,999 | 2 (0.7%) | 0 (0.0%) |
| $35,000 to $49,999 | 26 (9.2%) | 5 (0.6%) |
| $50,000 to $74,999 | 35 (12.5%) | 20 (2.3%) |
| $75,000 to $99,999 | 25 (8.9%) | 71 (8.2%) |
| $100,000 to $149,999 | 38 (13.5%) | 57 (6.6%) |
| $150,000 or more | 129 (45.9%) | 212 (24.5%) |
| Total | 281 (100.0%) | 865 (100.0%) |
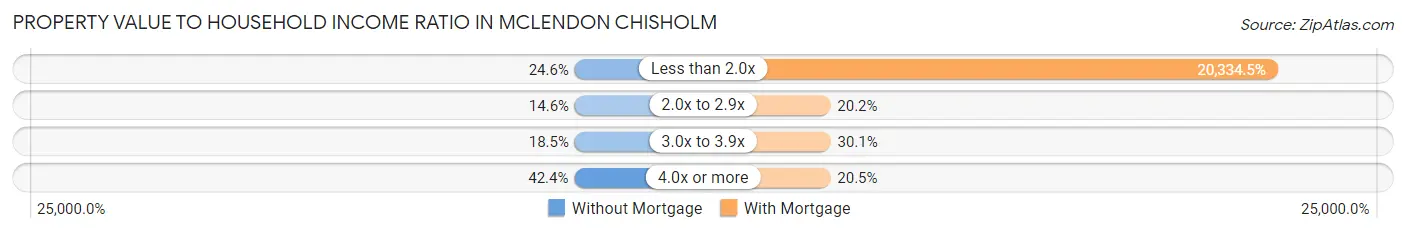
Property Value to Household Income Ratio in McLendon Chisholm
| Value-to-Income Ratio | Without Mortgage | With Mortgage |
| Less than 2.0x | 69 (24.6%) | 175,893 (20,334.5%) |
| 2.0x to 2.9x | 41 (14.6%) | 175 (20.2%) |
| 3.0x to 3.9x | 52 (18.5%) | 260 (30.1%) |
| 4.0x or more | 119 (42.3%) | 177 (20.5%) |
| Total | 281 (100.0%) | 865 (100.0%) |
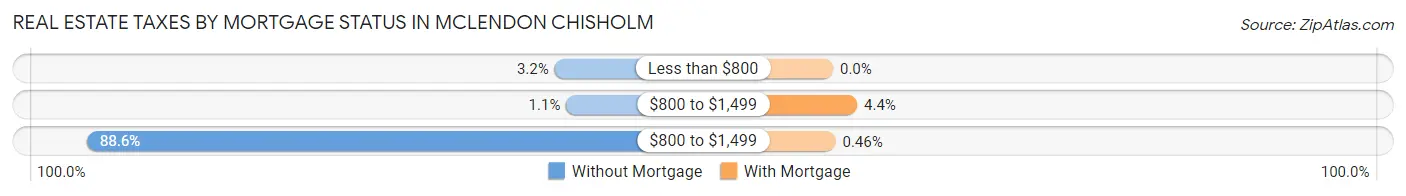
Real Estate Taxes by Mortgage Status in McLendon Chisholm
| Property Taxes | Without Mortgage | With Mortgage |
| Less than $800 | 9 (3.2%) | 0 (0.0%) |
| $800 to $1,499 | 3 (1.1%) | 38 (4.4%) |
| $800 to $1,499 | 249 (88.6%) | 4 (0.5%) |
| Total | 281 (100.0%) | 865 (100.0%) |
Health & Disability in McLendon Chisholm
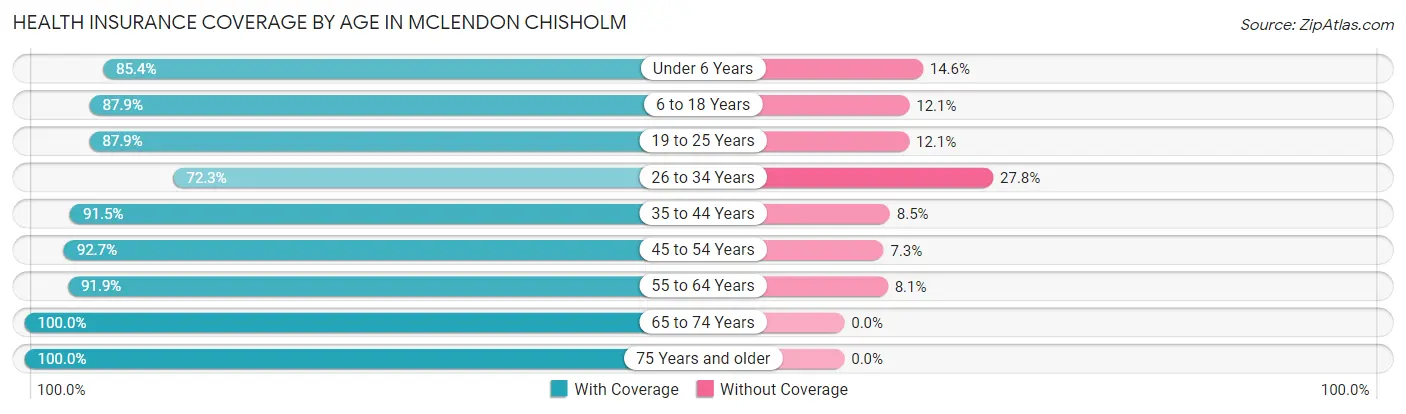
Health Insurance Coverage by Age in McLendon Chisholm
| Age Bracket | With Coverage | Without Coverage |
| Under 6 Years | 204 (85.4%) | 35 (14.6%) |
| 6 to 18 Years | 805 (87.9%) | 111 (12.1%) |
| 19 to 25 Years | 233 (87.9%) | 32 (12.1%) |
| 26 to 34 Years | 164 (72.3%) | 63 (27.8%) |
| 35 to 44 Years | 463 (91.5%) | 43 (8.5%) |
| 45 to 54 Years | 672 (92.7%) | 53 (7.3%) |
| 55 to 64 Years | 557 (91.9%) | 49 (8.1%) |
| 65 to 74 Years | 175 (100.0%) | 0 (0.0%) |
| 75 Years and older | 96 (100.0%) | 0 (0.0%) |
| Total | 3,369 (89.7%) | 386 (10.3%) |
Health Insurance Coverage by Citizenship Status in McLendon Chisholm
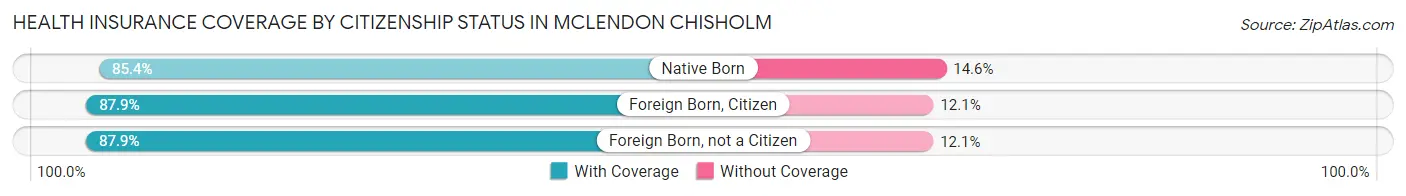
| Citizenship Status | With Coverage | Without Coverage |
| Native Born | 204 (85.4%) | 35 (14.6%) |
| Foreign Born, Citizen | 805 (87.9%) | 111 (12.1%) |
| Foreign Born, not a Citizen | 233 (87.9%) | 32 (12.1%) |
Health Insurance Coverage by Household Income in McLendon Chisholm
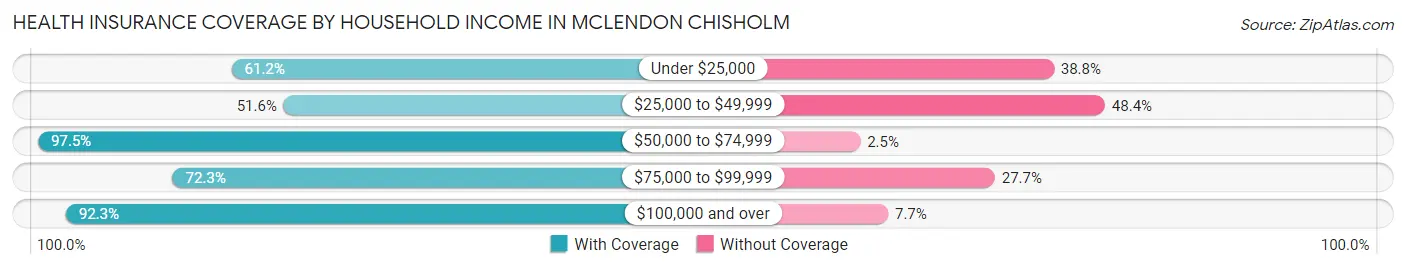
| Household Income | With Coverage | Without Coverage |
| Under $25,000 | 30 (61.2%) | 19 (38.8%) |
| $25,000 to $49,999 | 63 (51.6%) | 59 (48.4%) |
| $50,000 to $74,999 | 311 (97.5%) | 8 (2.5%) |
| $75,000 to $99,999 | 172 (72.3%) | 66 (27.7%) |
| $100,000 and over | 2,793 (92.3%) | 234 (7.7%) |
Public vs Private Health Insurance Coverage by Age in McLendon Chisholm
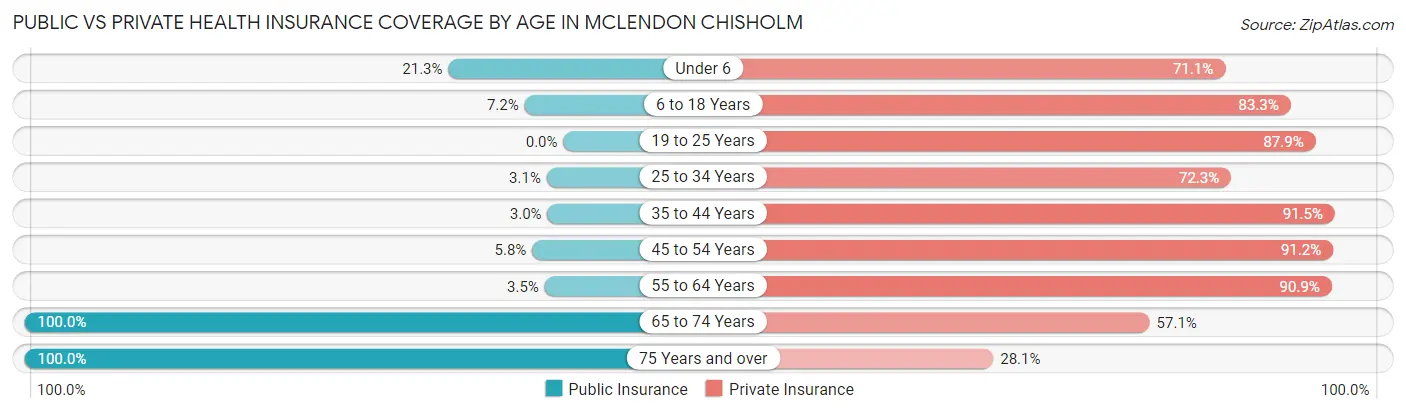
| Age Bracket | Public Insurance | Private Insurance |
| Under 6 | 51 (21.3%) | 170 (71.1%) |
| 6 to 18 Years | 66 (7.2%) | 763 (83.3%) |
| 19 to 25 Years | 0 (0.0%) | 233 (87.9%) |
| 25 to 34 Years | 7 (3.1%) | 164 (72.3%) |
| 35 to 44 Years | 15 (3.0%) | 463 (91.5%) |
| 45 to 54 Years | 42 (5.8%) | 661 (91.2%) |
| 55 to 64 Years | 21 (3.5%) | 551 (90.9%) |
| 65 to 74 Years | 175 (100.0%) | 100 (57.1%) |
| 75 Years and over | 96 (100.0%) | 27 (28.1%) |
| Total | 473 (12.6%) | 3,132 (83.4%) |
Disability Status by Sex by Age in McLendon Chisholm
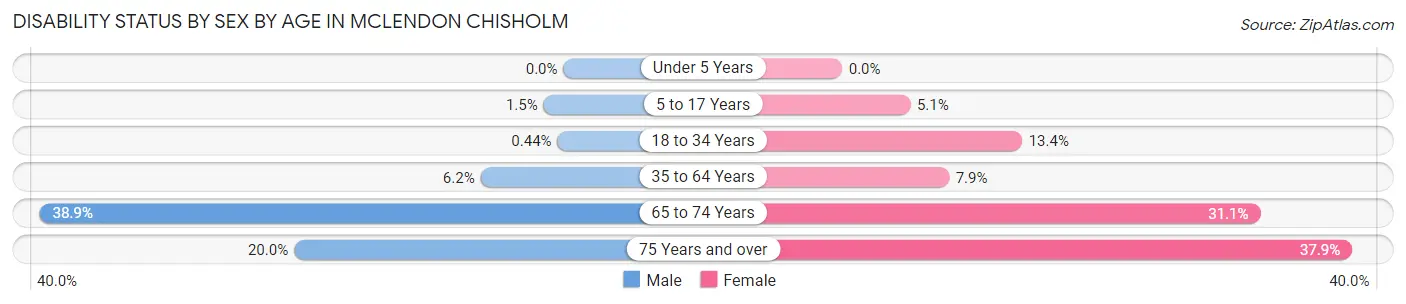
| Age Bracket | Male | Female |
| Under 5 Years | 0 (0.0%) | 0 (0.0%) |
| 5 to 17 Years | 6 (1.5%) | 27 (5.1%) |
| 18 to 34 Years | 1 (0.4%) | 39 (13.4%) |
| 35 to 64 Years | 58 (6.1%) | 71 (7.9%) |
| 65 to 74 Years | 28 (38.9%) | 32 (31.1%) |
| 75 Years and over | 6 (20.0%) | 25 (37.9%) |
Disability Class by Sex by Age in McLendon Chisholm
Disability Class: Hearing Difficulty
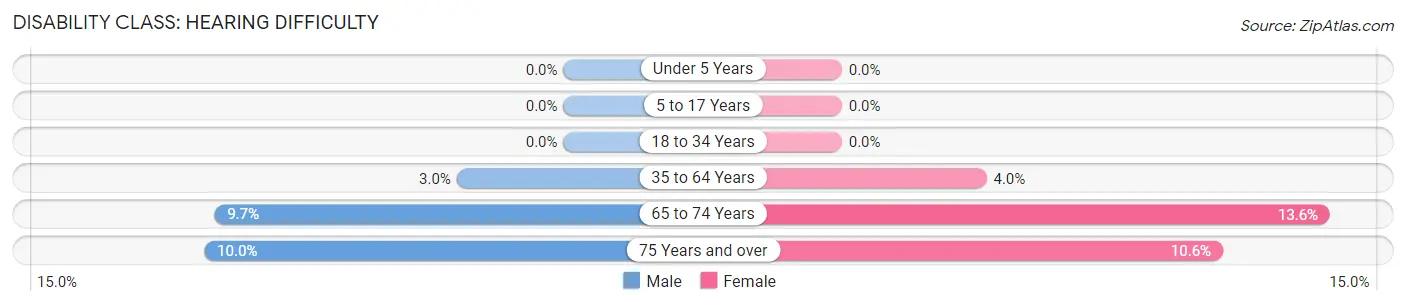
| Age Bracket | Male | Female |
| Under 5 Years | 0 (0.0%) | 0 (0.0%) |
| 5 to 17 Years | 0 (0.0%) | 0 (0.0%) |
| 18 to 34 Years | 0 (0.0%) | 0 (0.0%) |
| 35 to 64 Years | 28 (3.0%) | 36 (4.0%) |
| 65 to 74 Years | 7 (9.7%) | 14 (13.6%) |
| 75 Years and over | 3 (10.0%) | 7 (10.6%) |
Disability Class: Vision Difficulty
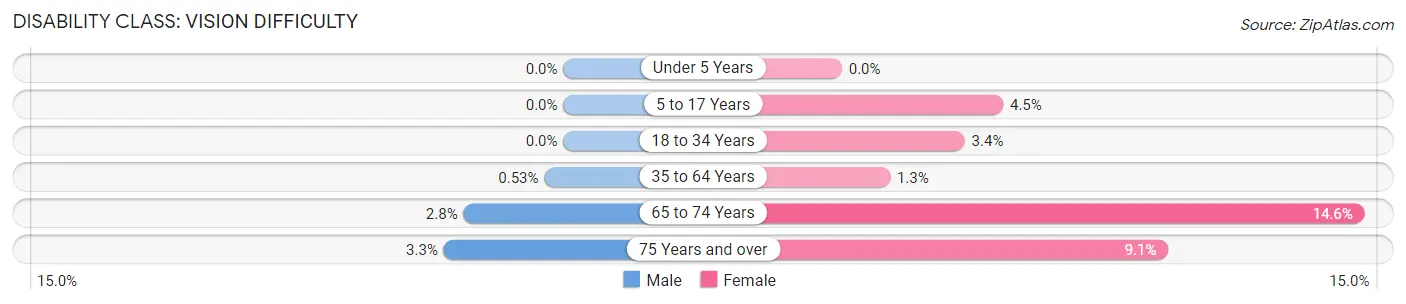
| Age Bracket | Male | Female |
| Under 5 Years | 0 (0.0%) | 0 (0.0%) |
| 5 to 17 Years | 0 (0.0%) | 24 (4.5%) |
| 18 to 34 Years | 0 (0.0%) | 10 (3.4%) |
| 35 to 64 Years | 5 (0.5%) | 12 (1.3%) |
| 65 to 74 Years | 2 (2.8%) | 15 (14.6%) |
| 75 Years and over | 1 (3.3%) | 6 (9.1%) |
Disability Class: Cognitive Difficulty
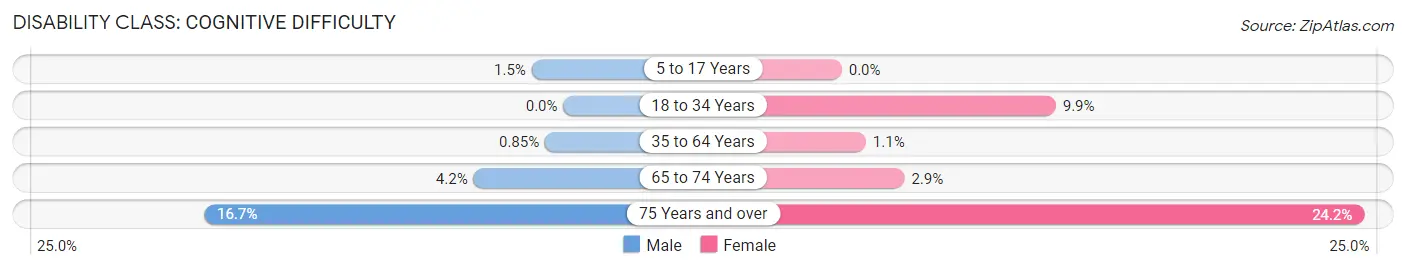
| Age Bracket | Male | Female |
| 5 to 17 Years | 6 (1.5%) | 0 (0.0%) |
| 18 to 34 Years | 0 (0.0%) | 29 (9.9%) |
| 35 to 64 Years | 8 (0.9%) | 10 (1.1%) |
| 65 to 74 Years | 3 (4.2%) | 3 (2.9%) |
| 75 Years and over | 5 (16.7%) | 16 (24.2%) |
Disability Class: Ambulatory Difficulty
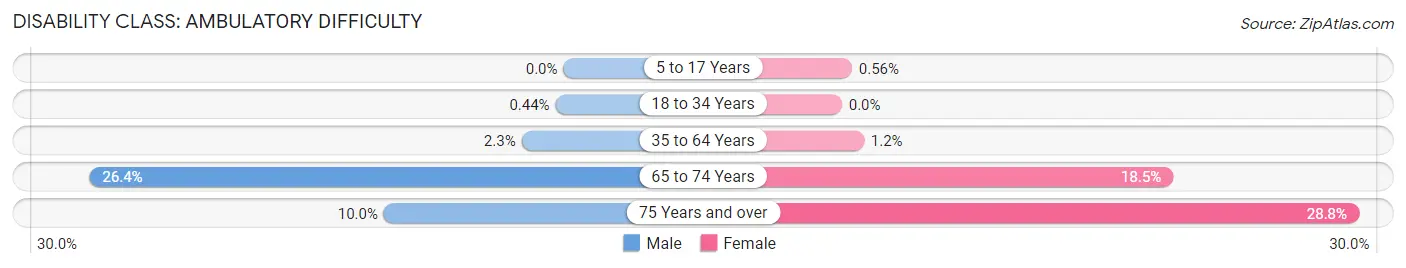
| Age Bracket | Male | Female |
| 5 to 17 Years | 0 (0.0%) | 3 (0.6%) |
| 18 to 34 Years | 1 (0.4%) | 0 (0.0%) |
| 35 to 64 Years | 22 (2.3%) | 11 (1.2%) |
| 65 to 74 Years | 19 (26.4%) | 19 (18.4%) |
| 75 Years and over | 3 (10.0%) | 19 (28.8%) |
Disability Class: Self-Care Difficulty
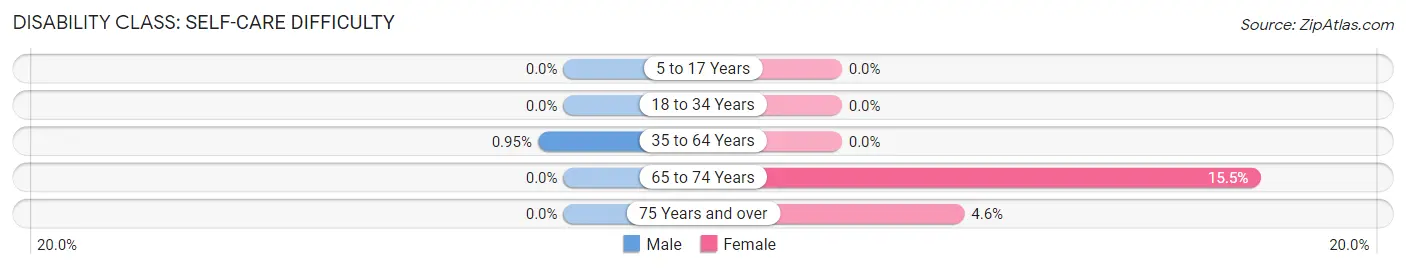
| Age Bracket | Male | Female |
| 5 to 17 Years | 0 (0.0%) | 0 (0.0%) |
| 18 to 34 Years | 0 (0.0%) | 0 (0.0%) |
| 35 to 64 Years | 9 (0.9%) | 0 (0.0%) |
| 65 to 74 Years | 0 (0.0%) | 16 (15.5%) |
| 75 Years and over | 0 (0.0%) | 3 (4.5%) |
Technology Access in McLendon Chisholm
Computing Device Access in McLendon Chisholm
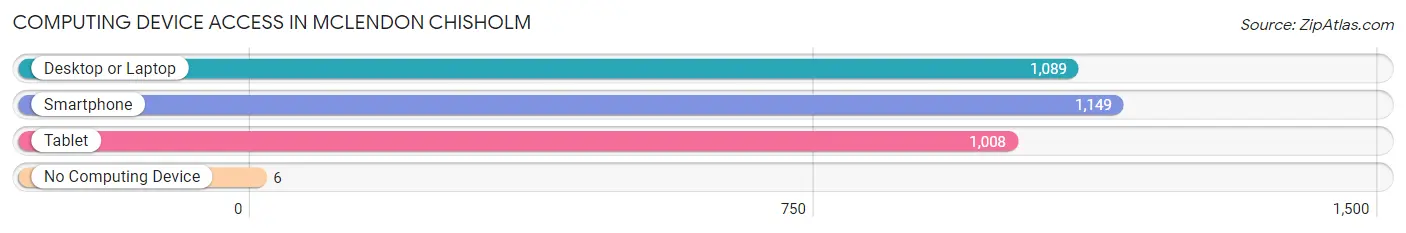
| Device Type | # Households | % Households |
| Desktop or Laptop | 1,089 | 94.3% |
| Smartphone | 1,149 | 99.5% |
| Tablet | 1,008 | 87.3% |
| No Computing Device | 6 | 0.5% |
| Total | 1,155 | 100.0% |
Internet Access in McLendon Chisholm
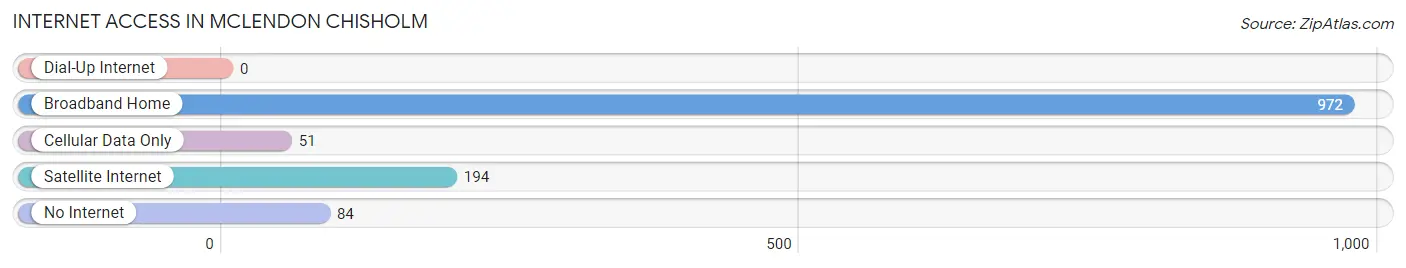
| Internet Type | # Households | % Households |
| Dial-Up Internet | 0 | 0.0% |
| Broadband Home | 972 | 84.2% |
| Cellular Data Only | 51 | 4.4% |
| Satellite Internet | 194 | 16.8% |
| No Internet | 84 | 7.3% |
| Total | 1,155 | 100.0% |
McLendon Chisholm Summary
Mclendon Chisholm is a small town located in Rockwall County, Texas. It is situated about 30 miles east of Dallas and is part of the Dallas-Fort Worth-Arlington metropolitan area. The town was named after a local rancher, William Mclendon Chisholm, who owned a large ranch in the area. The population of Mclendon Chisholm was 1,717 as of the 2010 census.
Geography
Mclendon Chisholm is located at 32°54'25"N 96°25'45"W (32.9069, -96.4292). The town is situated on the western edge of Rockwall County, near the border with Kaufman County. The town is located on the eastern edge of the Blackland Prairie, a region of Texas known for its rich soil and agricultural production. The town is situated on rolling hills and is surrounded by farmland and ranches. The town is located about 30 miles east of Dallas and is part of the Dallas-Fort Worth-Arlington metropolitan area.
Climate
Mclendon Chisholm has a humid subtropical climate, with hot summers and mild winters. The average annual temperature is 68°F (20°C). The average annual precipitation is 37.5 inches (95 cm).
Demographics
As of the 2010 census, the population of Mclendon Chisholm was 1,717. The racial makeup of the town was 94.3% White, 0.7% African American, 0.3% Native American, 0.3% Asian, 0.1% Pacific Islander, 2.7% from other races, and 1.6% from two or more races. Hispanic or Latino of any race were 5.2% of the population.
Economy
Mclendon Chisholm is a small, rural town with a primarily agricultural economy. The town is home to several farms and ranches, as well as a few small businesses. The town is also home to a few oil and gas wells, which provide additional economic activity.
Education
Mclendon Chisholm is served by the Rockwall Independent School District. The town is home to Mclendon Chisholm Elementary School, which serves students in grades K-5. The town is also home to Rockwall High School, which serves students in grades 9-12.
Transportation
Mclendon Chisholm is served by State Highway 205, which runs through the town. The town is also served by several local roads, including FM 548 and FM 740. The nearest airport is Dallas/Fort Worth International Airport, located about 30 miles away.
Conclusion
Mclendon Chisholm is a small town located in Rockwall County, Texas. It is situated about 30 miles east of Dallas and is part of the Dallas-Fort Worth-Arlington metropolitan area. The town was named after a local rancher, William Mclendon Chisholm, who owned a large ranch in the area. The population of Mclendon Chisholm was 1,717 as of the 2010 census. The town has a humid subtropical climate, with hot summers and mild winters. The town has a primarily agricultural economy, with several farms and ranches, as well as a few small businesses and oil and gas wells. The town is served by the Rockwall Independent School District and is accessible via State Highway 205 and several local roads.
Common Questions
What is Per Capita Income in McLendon Chisholm?
Per Capita income in McLendon Chisholm is $74,822.
What is the Median Family Income in McLendon Chisholm?
Median Family Income in McLendon Chisholm is $192,566.
What is the Median Household income in McLendon Chisholm?
Median Household Income in McLendon Chisholm is $167,750.
What is Income or Wage Gap in McLendon Chisholm?
Income or Wage Gap in McLendon Chisholm is 61.8%.
Women in McLendon Chisholm earn 38.2 cents for every dollar earned by a man.
What is Inequality or Gini Index in McLendon Chisholm?
Inequality or Gini Index in McLendon Chisholm is 0.49.
What is the Total Population of McLendon Chisholm?
Total Population of McLendon Chisholm is 3,755.
What is the Total Male Population of McLendon Chisholm?
Total Male Population of McLendon Chisholm is 1,771.
What is the Total Female Population of McLendon Chisholm?
Total Female Population of McLendon Chisholm is 1,984.
What is the Ratio of Males per 100 Females in McLendon Chisholm?
There are 89.26 Males per 100 Females in McLendon Chisholm.
What is the Ratio of Females per 100 Males in McLendon Chisholm?
There are 112.03 Females per 100 Males in McLendon Chisholm.
What is the Median Population Age in McLendon Chisholm?
Median Population Age in McLendon Chisholm is 40.3 Years.
What is the Average Family Size in McLendon Chisholm
Average Family Size in McLendon Chisholm is 3.5 People.
What is the Average Household Size in McLendon Chisholm
Average Household Size in McLendon Chisholm is 3.2 People.
How Large is the Labor Force in McLendon Chisholm?
There are 1,977 People in the Labor Forcein in McLendon Chisholm.
What is the Percentage of People in the Labor Force in McLendon Chisholm?
70.9% of People are in the Labor Force in McLendon Chisholm.
What is the Unemployment Rate in McLendon Chisholm?
Unemployment Rate in McLendon Chisholm is 1.9%.