Zip Codes with the Highest Percentage of Households with Income Above $200,000 in Houston, TX
RELATED REPORTS & OPTIONS
Household Income | $200k+
Houston
Compare Zip Codes
Map of Zip Codes with the Highest Percentage of Households with Income Above $200,000 in Houston
0.30%
55.2%
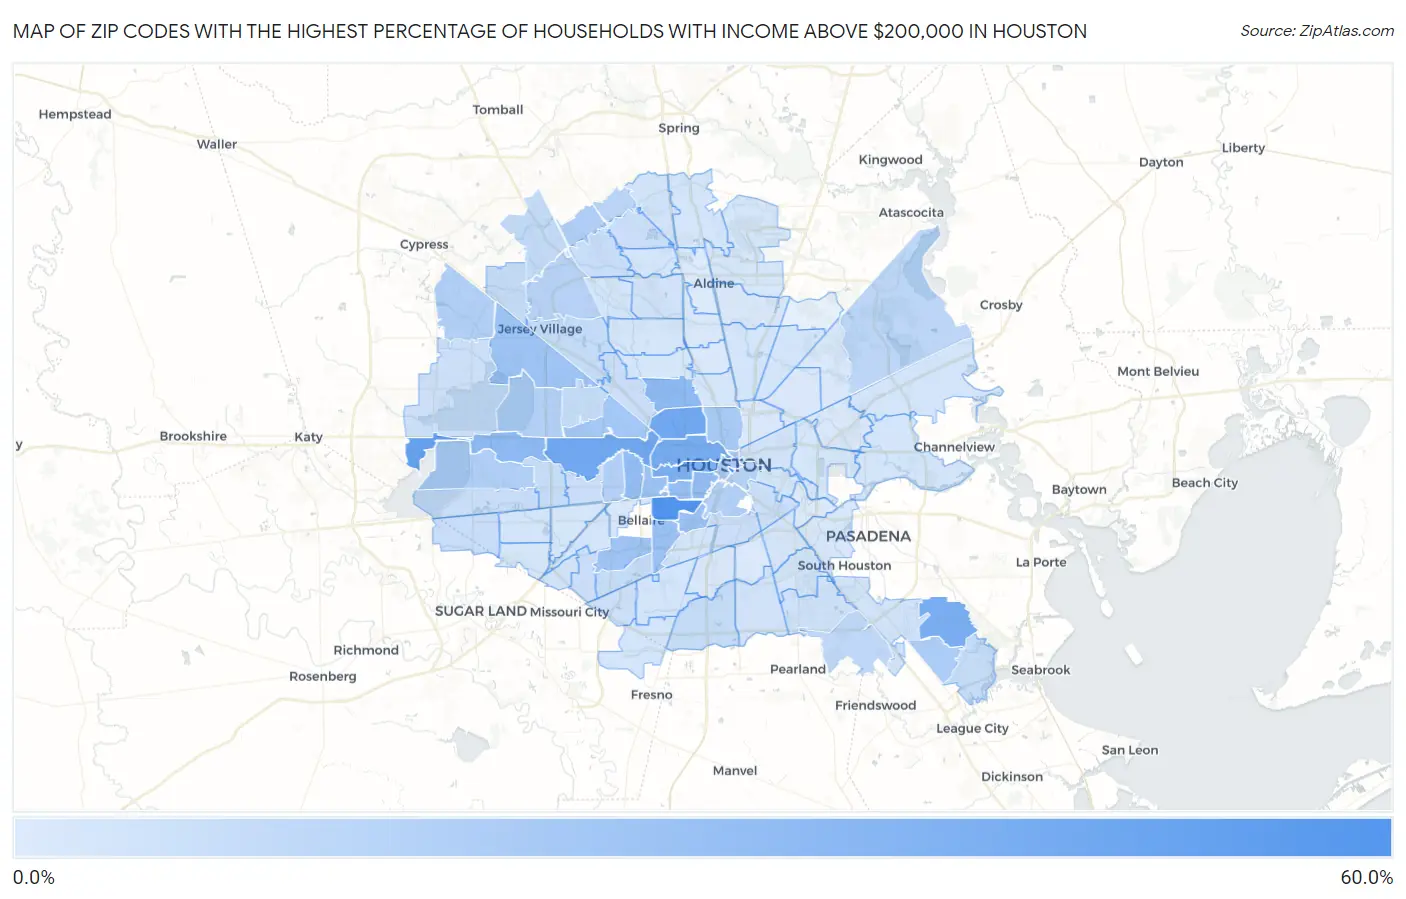
Zip Codes with the Highest Percentage of Households with Income Above $200,000 in Houston, TX
| Zip Code | Households with Income > $200k | vs State | vs National | |
| 1. | 77010 | 55.2% | 10.6% (+44.6)#7 | 11.4% (+43.8)#174 |
| 2. | 77005 | 52.1% | 10.6% (+41.5)#10 | 11.4% (+40.7)#230 |
| 3. | 77094 | 40.9% | 10.6% (+30.3)#23 | 11.4% (+29.5)#604 |
| 4. | 77024 | 37.7% | 10.6% (+27.1)#31 | 11.4% (+26.3)#787 |
| 5. | 77008 | 37.4% | 10.6% (+26.8)#33 | 11.4% (+26.0)#809 |
| 6. | 77007 | 34.8% | 10.6% (+24.2)#40 | 11.4% (+23.4)#995 |
| 7. | 77059 | 33.6% | 10.6% (+23.0)#49 | 11.4% (+22.2)#1,104 |
| 8. | 77019 | 31.7% | 10.6% (+21.1)#57 | 11.4% (+20.3)#1,272 |
| 9. | 77079 | 26.1% | 10.6% (+15.5)#89 | 11.4% (+14.7)#2,013 |
| 10. | 77018 | 26.0% | 10.6% (+15.4)#91 | 11.4% (+14.6)#2,026 |
| 11. | 77006 | 24.5% | 10.6% (+13.9)#100 | 11.4% (+13.1)#2,278 |
| 12. | 77056 | 24.4% | 10.6% (+13.8)#101 | 11.4% (+13.0)#2,293 |
| 13. | 77098 | 22.6% | 10.6% (+12.0)#121 | 11.4% (+11.2)#2,654 |
| 14. | 77030 | 22.2% | 10.6% (+11.6)#129 | 11.4% (+10.8)#2,735 |
| 15. | 77025 | 21.3% | 10.6% (+10.7)#146 | 11.4% (+9.90)#2,931 |
| 16. | 77027 | 20.1% | 10.6% (+9.50)#164 | 11.4% (+8.70)#3,257 |
| 17. | 77041 | 20.0% | 10.6% (+9.40)#166 | 11.4% (+8.60)#3,275 |
| 18. | 77096 | 19.7% | 10.6% (+9.10)#174 | 11.4% (+8.30)#3,365 |
| 19. | 77055 | 19.0% | 10.6% (+8.40)#184 | 11.4% (+7.60)#3,561 |
| 20. | 77046 | 18.3% | 10.6% (+7.70)#190 | 11.4% (+6.90)#3,761 |
| 21. | 77009 | 16.8% | 10.6% (+6.20)#215 | 11.4% (+5.40)#4,249 |
| 22. | 77002 | 16.3% | 10.6% (+5.70)#224 | 11.4% (+4.90)#4,453 |
| 23. | 77062 | 15.5% | 10.6% (+4.90)#238 | 11.4% (+4.10)#4,759 |
| 24. | 77077 | 14.2% | 10.6% (+3.60)#276 | 11.4% (+2.80)#5,342 |
| 25. | 77069 | 13.7% | 10.6% (+3.10)#287 | 11.4% (+2.30)#5,624 |
| 26. | 77095 | 13.4% | 10.6% (+2.80)#302 | 11.4% (+2.00)#5,776 |
| 27. | 77004 | 13.2% | 10.6% (+2.60)#310 | 11.4% (+1.80)#5,899 |
| 28. | 77057 | 13.1% | 10.6% (+2.50)#316 | 11.4% (+1.70)#5,946 |
| 29. | 77043 | 13.0% | 10.6% (+2.40)#318 | 11.4% (+1.60)#6,008 |
| 30. | 77003 | 12.5% | 10.6% (+1.90)#345 | 11.4% (+1.10)#6,351 |
| 31. | 77064 | 12.0% | 10.6% (+1.40)#357 | 11.4% (+0.600)#6,659 |
| 32. | 77068 | 10.7% | 10.6% (+0.100)#433 | 11.4% (-0.700)#7,643 |
| 33. | 77044 | 10.2% | 10.6% (-0.400)#458 | 11.4% (-1.20)#8,039 |
| 34. | 77089 | 9.5% | 10.6% (-1.10)#494 | 11.4% (-1.90)#8,709 |
| 35. | 77070 | 8.2% | 10.6% (-2.40)#591 | 11.4% (-3.20)#10,100 |
| 36. | 77080 | 7.6% | 10.6% (-3.00)#649 | 11.4% (-3.80)#10,896 |
| 37. | 77047 | 7.6% | 10.6% (-3.00)#650 | 11.4% (-3.80)#10,907 |
| 38. | 77058 | 7.6% | 10.6% (-3.00)#651 | 11.4% (-3.80)#10,923 |
| 39. | 77040 | 7.5% | 10.6% (-3.10)#655 | 11.4% (-3.90)#11,028 |
| 40. | 77035 | 7.5% | 10.6% (-3.10)#656 | 11.4% (-3.90)#11,039 |
| 41. | 77065 | 7.3% | 10.6% (-3.30)#671 | 11.4% (-4.10)#11,329 |
| 42. | 77042 | 7.0% | 10.6% (-3.60)#704 | 11.4% (-4.40)#11,747 |
| 43. | 77082 | 6.7% | 10.6% (-3.90)#732 | 11.4% (-4.70)#12,211 |
| 44. | 77083 | 6.5% | 10.6% (-4.10)#756 | 11.4% (-4.90)#12,550 |
| 45. | 77066 | 6.4% | 10.6% (-4.20)#768 | 11.4% (-5.00)#12,717 |
| 46. | 77092 | 6.0% | 10.6% (-4.60)#814 | 11.4% (-5.40)#13,437 |
| 47. | 77063 | 5.9% | 10.6% (-4.70)#832 | 11.4% (-5.50)#13,627 |
| 48. | 77014 | 5.8% | 10.6% (-4.80)#849 | 11.4% (-5.60)#13,835 |
| 49. | 77071 | 5.8% | 10.6% (-4.80)#852 | 11.4% (-5.60)#13,848 |
| 50. | 77021 | 5.6% | 10.6% (-5.00)#878 | 11.4% (-5.80)#14,282 |
| 51. | 77084 | 5.4% | 10.6% (-5.20)#908 | 11.4% (-6.00)#14,648 |
| 52. | 77085 | 5.4% | 10.6% (-5.20)#912 | 11.4% (-6.00)#14,694 |
| 53. | 77023 | 5.1% | 10.6% (-5.50)#948 | 11.4% (-6.30)#15,330 |
| 54. | 77075 | 4.1% | 10.6% (-6.50)#1,085 | 11.4% (-7.30)#17,807 |
| 55. | 77038 | 4.0% | 10.6% (-6.60)#1,101 | 11.4% (-7.40)#18,090 |
| 56. | 77034 | 3.7% | 10.6% (-6.90)#1,151 | 11.4% (-7.70)#18,875 |
| 57. | 77020 | 3.6% | 10.6% (-7.00)#1,163 | 11.4% (-7.80)#19,163 |
| 58. | 77090 | 3.5% | 10.6% (-7.10)#1,176 | 11.4% (-7.90)#19,425 |
| 59. | 77048 | 3.5% | 10.6% (-7.10)#1,180 | 11.4% (-7.90)#19,465 |
| 60. | 77031 | 3.5% | 10.6% (-7.10)#1,181 | 11.4% (-7.90)#19,476 |
| 61. | 77067 | 3.3% | 10.6% (-7.30)#1,209 | 11.4% (-8.10)#20,010 |
| 62. | 77072 | 3.2% | 10.6% (-7.40)#1,220 | 11.4% (-8.20)#20,267 |
| 63. | 77061 | 3.2% | 10.6% (-7.40)#1,221 | 11.4% (-8.20)#20,299 |
| 64. | 77015 | 3.1% | 10.6% (-7.50)#1,235 | 11.4% (-8.30)#20,560 |
| 65. | 77049 | 3.1% | 10.6% (-7.50)#1,236 | 11.4% (-8.30)#20,565 |
| 66. | 77045 | 3.0% | 10.6% (-7.60)#1,246 | 11.4% (-8.40)#20,882 |
| 67. | 77053 | 3.0% | 10.6% (-7.60)#1,247 | 11.4% (-8.40)#20,886 |
| 68. | 77016 | 3.0% | 10.6% (-7.60)#1,248 | 11.4% (-8.40)#20,889 |
| 69. | 77054 | 2.8% | 10.6% (-7.80)#1,286 | 11.4% (-8.60)#21,438 |
| 70. | 77011 | 2.8% | 10.6% (-7.80)#1,289 | 11.4% (-8.60)#21,462 |
| 71. | 77093 | 2.7% | 10.6% (-7.90)#1,301 | 11.4% (-8.70)#21,715 |
| 72. | 77073 | 2.7% | 10.6% (-7.90)#1,303 | 11.4% (-8.70)#21,719 |
| 73. | 77074 | 2.7% | 10.6% (-7.90)#1,304 | 11.4% (-8.70)#21,721 |
| 74. | 77086 | 2.7% | 10.6% (-7.90)#1,305 | 11.4% (-8.70)#21,728 |
| 75. | 77087 | 2.6% | 10.6% (-8.00)#1,319 | 11.4% (-8.80)#22,006 |
| 76. | 77029 | 2.6% | 10.6% (-8.00)#1,322 | 11.4% (-8.80)#22,048 |
| 77. | 77022 | 2.5% | 10.6% (-8.10)#1,338 | 11.4% (-8.90)#22,335 |
| 78. | 77088 | 2.3% | 10.6% (-8.30)#1,371 | 11.4% (-9.10)#22,885 |
| 79. | 77036 | 2.2% | 10.6% (-8.40)#1,384 | 11.4% (-9.20)#23,156 |
| 80. | 77099 | 2.2% | 10.6% (-8.40)#1,387 | 11.4% (-9.20)#23,162 |
| 81. | 77032 | 2.2% | 10.6% (-8.40)#1,390 | 11.4% (-9.20)#23,212 |
| 82. | 77091 | 2.1% | 10.6% (-8.50)#1,406 | 11.4% (-9.30)#23,459 |
| 83. | 77081 | 1.9% | 10.6% (-8.70)#1,436 | 11.4% (-9.50)#24,031 |
| 84. | 77017 | 1.8% | 10.6% (-8.80)#1,453 | 11.4% (-9.60)#24,294 |
| 85. | 77037 | 1.8% | 10.6% (-8.80)#1,456 | 11.4% (-9.60)#24,316 |
| 86. | 77039 | 1.7% | 10.6% (-8.90)#1,472 | 11.4% (-9.70)#24,550 |
| 87. | 77051 | 1.4% | 10.6% (-9.20)#1,509 | 11.4% (-10.00)#25,312 |
| 88. | 77078 | 1.3% | 10.6% (-9.30)#1,520 | 11.4% (-10.1)#25,544 |
| 89. | 77028 | 1.2% | 10.6% (-9.40)#1,537 | 11.4% (-10.2)#25,758 |
| 90. | 77033 | 1.1% | 10.6% (-9.50)#1,546 | 11.4% (-10.3)#25,955 |
| 91. | 77013 | 1.1% | 10.6% (-9.50)#1,548 | 11.4% (-10.3)#25,964 |
| 92. | 77076 | 0.90% | 10.6% (-9.70)#1,568 | 11.4% (-10.5)#26,365 |
| 93. | 77026 | 0.80% | 10.6% (-9.80)#1,577 | 11.4% (-10.6)#26,544 |
| 94. | 77060 | 0.40% | 10.6% (-10.2)#1,617 | 11.4% (-11.0)#27,229 |
| 95. | 77012 | 0.30% | 10.6% (-10.3)#1,623 | 11.4% (-11.1)#27,364 |
1
Common Questions
What are the Top 10 Zip Codes with the Highest Percentage of Households with Income Above $200,000 in Houston, TX?
Top 10 Zip Codes with the Highest Percentage of Households with Income Above $200,000 in Houston, TX are:
What zip code has the Highest Percentage of Households with Income Above $200,000 in Houston, TX?
77010 has the Highest Percentage of Households with Income Above $200,000 in Houston, TX with 55.2%.
What is the Percentage of Households with Income Above $200,000 in Houston, TX?
Percentage of Households with Income Above $200,000 in Houston is 10.4%.
What is the Percentage of Households with Income Above $200,000 in Texas?
Percentage of Households with Income Above $200,000 in Texas is 10.6%.
What is the Percentage of Households with Income Above $200,000 in the United States?
Percentage of Households with Income Above $200,000 in the United States is 11.4%.