Hickory Creek, TX Map & Demographics
Hickory Creek Map
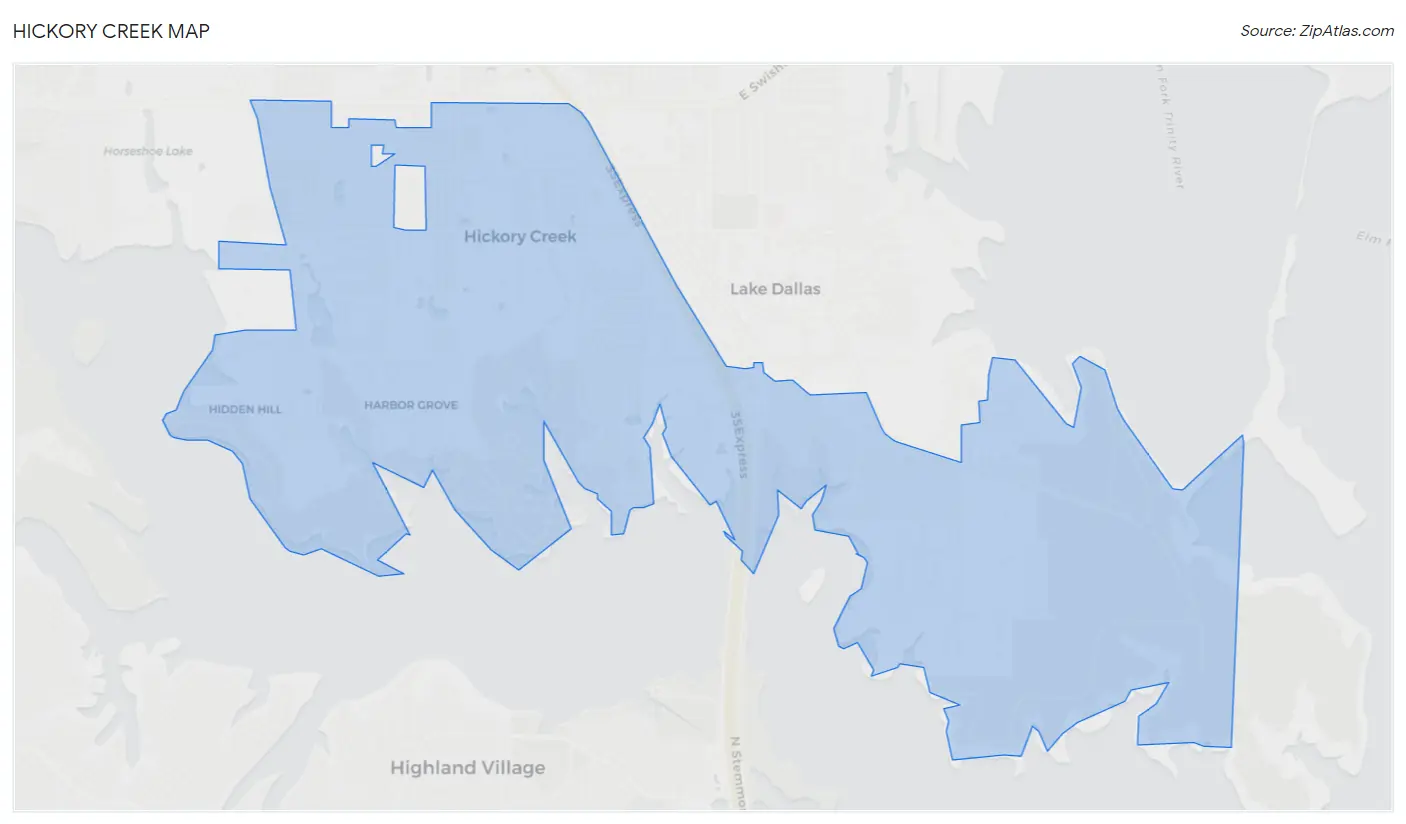
Hickory Creek Overview
$51,739
PER CAPITA INCOME
$139,451
AVG FAMILY INCOME
$138,584
AVG HOUSEHOLD INCOME
44.3%
WAGE / INCOME GAP [ % ]
55.7¢/ $1
WAGE / INCOME GAP [ $ ]
0.32
INEQUALITY / GINI INDEX
4,906
TOTAL POPULATION
2,602
MALE POPULATION
2,304
FEMALE POPULATION
112.93
MALES / 100 FEMALES
88.55
FEMALES / 100 MALES
37.6
MEDIAN AGE
3.2
AVG FAMILY SIZE
3.0
AVG HOUSEHOLD SIZE
3,592
LABOR FORCE [ PEOPLE ]
85.6%
PERCENT IN LABOR FORCE
2.6%
UNEMPLOYMENT RATE
Income in Hickory Creek
Income Overview in Hickory Creek
Per Capita Income in Hickory Creek is $51,739, while median incomes of families and households are $139,451 and $138,584 respectively.
| Characteristic | Number | Measure |
| Per Capita Income | 4,906 | $51,739 |
| Median Family Income | 1,420 | $139,451 |
| Mean Family Income | 1,420 | $163,326 |
| Median Household Income | 1,656 | $138,584 |
| Mean Household Income | 1,656 | $154,840 |
| Income Deficit | 1,420 | $0 |
| Wage / Income Gap (%) | 4,906 | 44.28% |
| Wage / Income Gap ($) | 4,906 | 55.72¢ per $1 |
| Gini / Inequality Index | 4,906 | 0.32 |
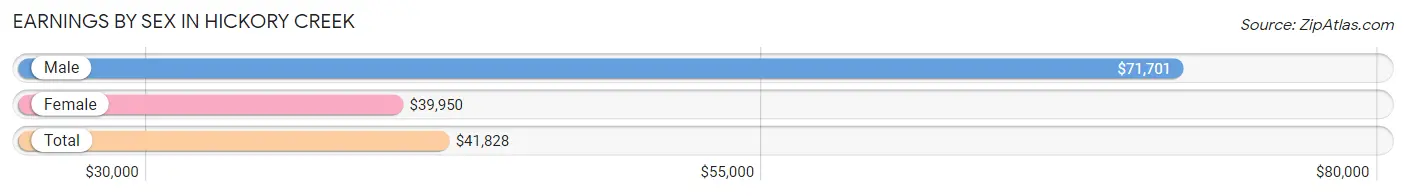
Earnings by Sex in Hickory Creek
Average Earnings in Hickory Creek are $41,828, $71,701 for men and $39,950 for women, a difference of 44.3%.
| Sex | Number | Average Earnings |
| Male | 1,891 (53.3%) | $71,701 |
| Female | 1,655 (46.7%) | $39,950 |
| Total | 3,546 (100.0%) | $41,828 |
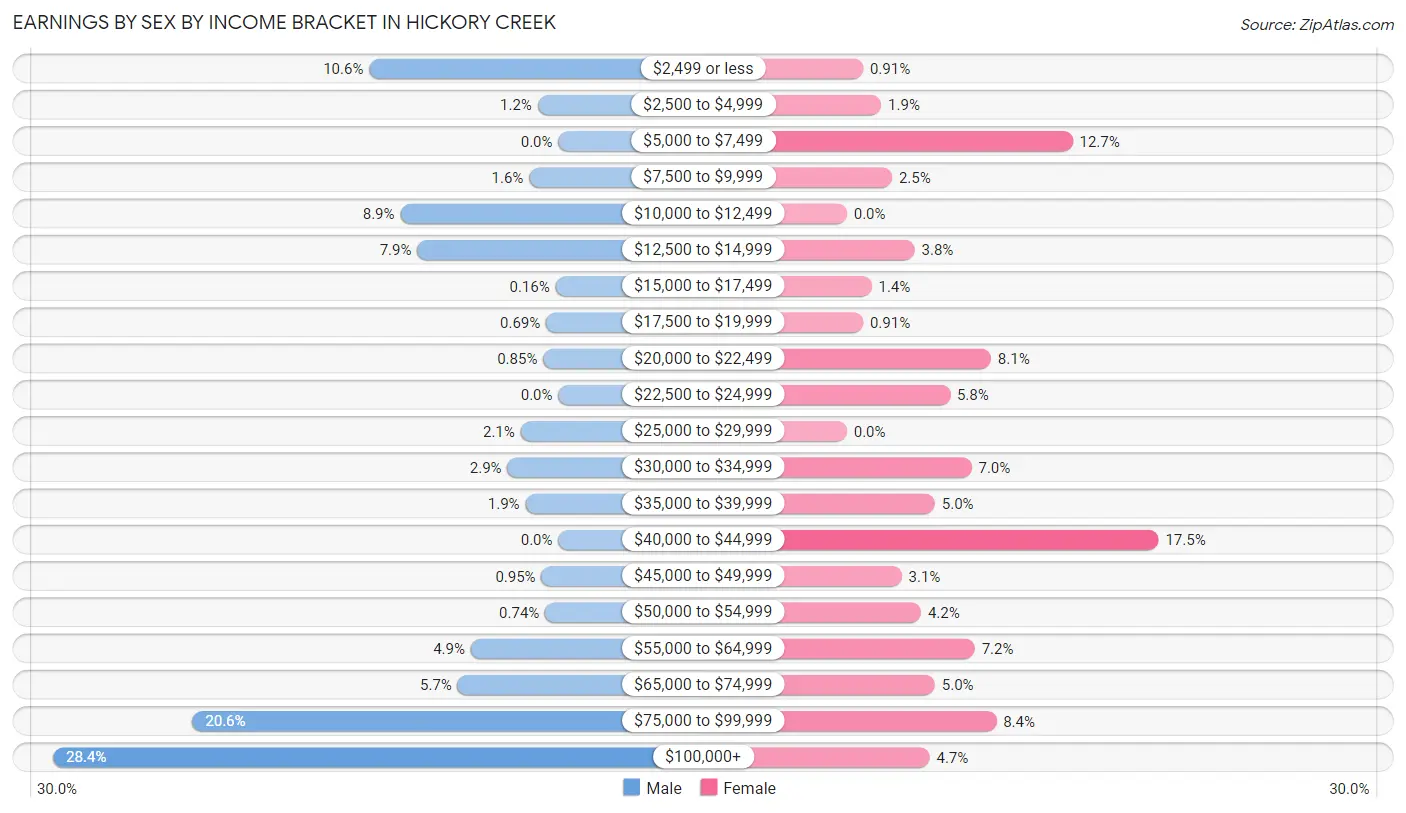
Earnings by Sex by Income Bracket in Hickory Creek
The most common earnings brackets in Hickory Creek are $100,000+ for men (537 | 28.4%) and $40,000 to $44,999 for women (290 | 17.5%).
| Income | Male | Female |
| $2,499 or less | 201 (10.6%) | 15 (0.9%) |
| $2,500 to $4,999 | 22 (1.2%) | 32 (1.9%) |
| $5,000 to $7,499 | 0 (0.0%) | 210 (12.7%) |
| $7,500 to $9,999 | 31 (1.6%) | 42 (2.5%) |
| $10,000 to $12,499 | 168 (8.9%) | 0 (0.0%) |
| $12,500 to $14,999 | 150 (7.9%) | 63 (3.8%) |
| $15,000 to $17,499 | 3 (0.2%) | 23 (1.4%) |
| $17,500 to $19,999 | 13 (0.7%) | 15 (0.9%) |
| $20,000 to $22,499 | 16 (0.9%) | 134 (8.1%) |
| $22,500 to $24,999 | 0 (0.0%) | 96 (5.8%) |
| $25,000 to $29,999 | 40 (2.1%) | 0 (0.0%) |
| $30,000 to $34,999 | 54 (2.9%) | 116 (7.0%) |
| $35,000 to $39,999 | 35 (1.8%) | 82 (5.0%) |
| $40,000 to $44,999 | 0 (0.0%) | 290 (17.5%) |
| $45,000 to $49,999 | 18 (0.9%) | 51 (3.1%) |
| $50,000 to $54,999 | 14 (0.7%) | 69 (4.2%) |
| $55,000 to $64,999 | 93 (4.9%) | 119 (7.2%) |
| $65,000 to $74,999 | 107 (5.7%) | 82 (5.0%) |
| $75,000 to $99,999 | 389 (20.6%) | 139 (8.4%) |
| $100,000+ | 537 (28.4%) | 77 (4.6%) |
| Total | 1,891 (100.0%) | 1,655 (100.0%) |
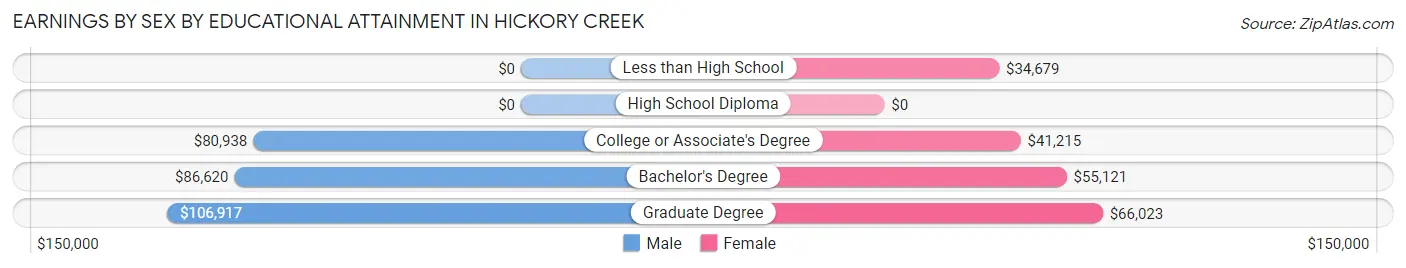
Earnings by Sex by Educational Attainment in Hickory Creek
Average earnings in Hickory Creek are $85,528 for men and $41,418 for women, a difference of 51.6%. Men with an educational attainment of graduate degree enjoy the highest average annual earnings of $106,917, while those with college or associate's degree education earn the least with $80,938. Women with an educational attainment of graduate degree earn the most with the average annual earnings of $66,023, while those with less than high school education have the smallest earnings of $34,679.
| Educational Attainment | Male Income | Female Income |
| Less than High School | - | - |
| High School Diploma | - | - |
| College or Associate's Degree | $80,938 | $41,215 |
| Bachelor's Degree | $86,620 | $55,121 |
| Graduate Degree | $106,917 | $66,023 |
| Total | $85,528 | $41,418 |
Family Income in Hickory Creek
Family Income Brackets in Hickory Creek
According to the Hickory Creek family income data, there are 498 families falling into the $200,000+ income range, which is the most common income bracket and makes up 35.1% of all families.
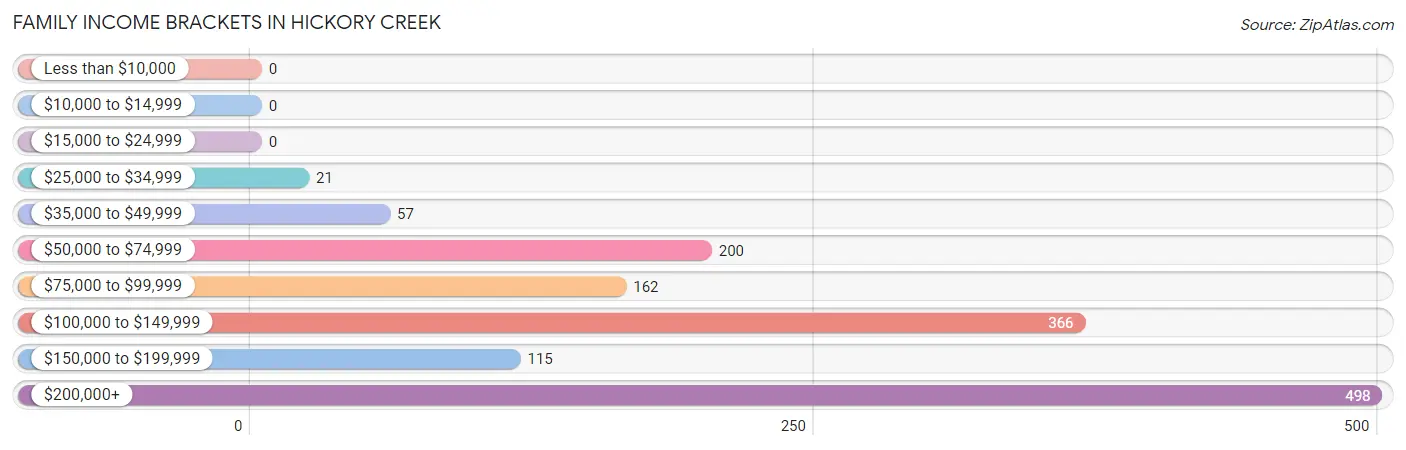
| Income Bracket | # Families | % Families |
| Less than $10,000 | 0 | 0.0% |
| $10,000 to $14,999 | 0 | 0.0% |
| $15,000 to $24,999 | 0 | 0.0% |
| $25,000 to $34,999 | 21 | 1.5% |
| $35,000 to $49,999 | 57 | 4.0% |
| $50,000 to $74,999 | 200 | 14.1% |
| $75,000 to $99,999 | 162 | 11.4% |
| $100,000 to $149,999 | 366 | 25.8% |
| $150,000 to $199,999 | 115 | 8.1% |
| $200,000+ | 498 | 35.1% |
Family Income by Famaliy Size in Hickory Creek
5-person families (317 | 22.3%) account for the highest median family income in Hickory Creek with $230,489 per family, while 2-person families (637 | 44.9%) have the highest median income of $68,862 per family member.
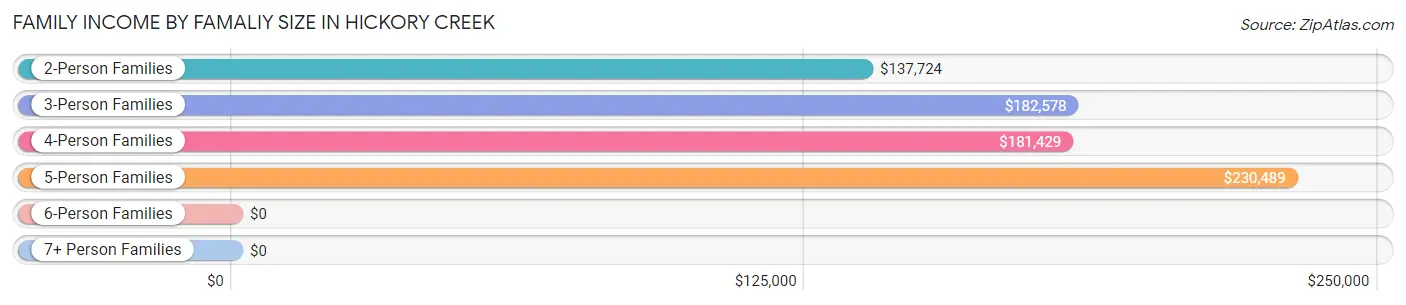
| Income Bracket | # Families | Median Income |
| 2-Person Families | 637 (44.9%) | $137,724 |
| 3-Person Families | 276 (19.4%) | $182,578 |
| 4-Person Families | 148 (10.4%) | $181,429 |
| 5-Person Families | 317 (22.3%) | $230,489 |
| 6-Person Families | 42 (3.0%) | $0 |
| 7+ Person Families | 0 (0.0%) | $0 |
| Total | 1,420 (100.0%) | $139,451 |
Family Income by Number of Earners in Hickory Creek
The median family income in Hickory Creek is $139,451, with families comprising 3+ earners (326) having the highest median family income of $230,799, while families with 1 earner (285) have the lowest median family income of $58,229, accounting for 23.0% and 20.1% of families, respectively.
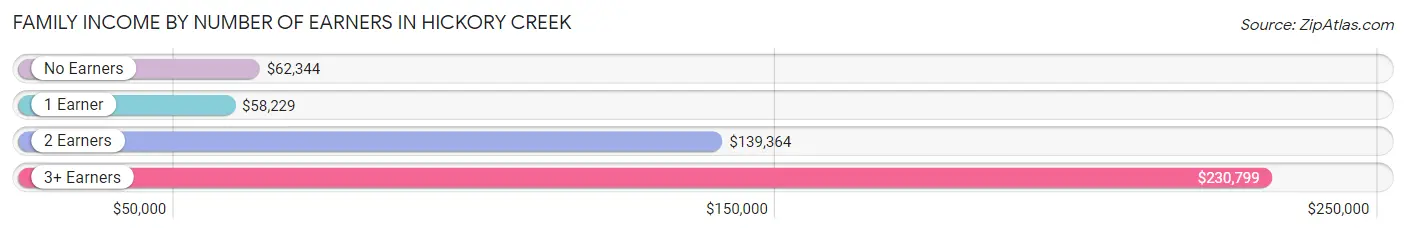
| Number of Earners | # Families | Median Income |
| No Earners | 55 (3.9%) | $62,344 |
| 1 Earner | 285 (20.1%) | $58,229 |
| 2 Earners | 754 (53.1%) | $139,364 |
| 3+ Earners | 326 (23.0%) | $230,799 |
| Total | 1,420 (100.0%) | $139,451 |
Household Income in Hickory Creek
Household Income Brackets in Hickory Creek
With 522 households falling in the category, the $200,000+ income range is the most frequent in Hickory Creek, accounting for 31.5% of all households.
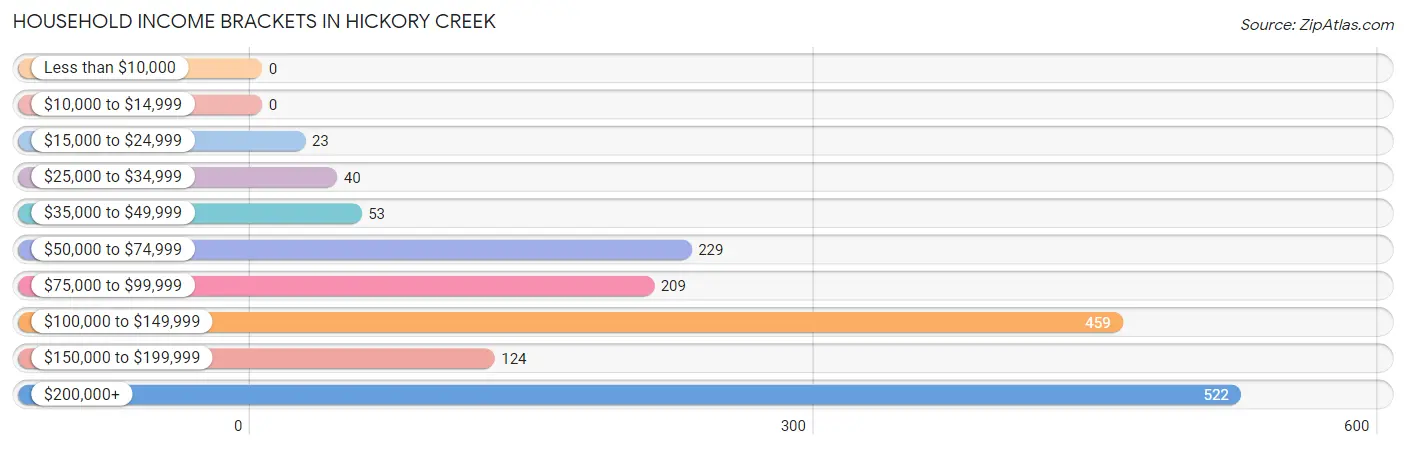
| Income Bracket | # Households | % Households |
| Less than $10,000 | 0 | 0.0% |
| $10,000 to $14,999 | 0 | 0.0% |
| $15,000 to $24,999 | 23 | 1.4% |
| $25,000 to $34,999 | 40 | 2.4% |
| $35,000 to $49,999 | 53 | 3.2% |
| $50,000 to $74,999 | 229 | 13.8% |
| $75,000 to $99,999 | 209 | 12.6% |
| $100,000 to $149,999 | 459 | 27.7% |
| $150,000 to $199,999 | 124 | 7.5% |
| $200,000+ | 522 | 31.5% |
Household Income by Householder Age in Hickory Creek
The median household income in Hickory Creek is $138,584, with the highest median household income of $175,000 found in the 45 to 64 years age bracket for the primary householder. A total of 760 households (45.9%) fall into this category.
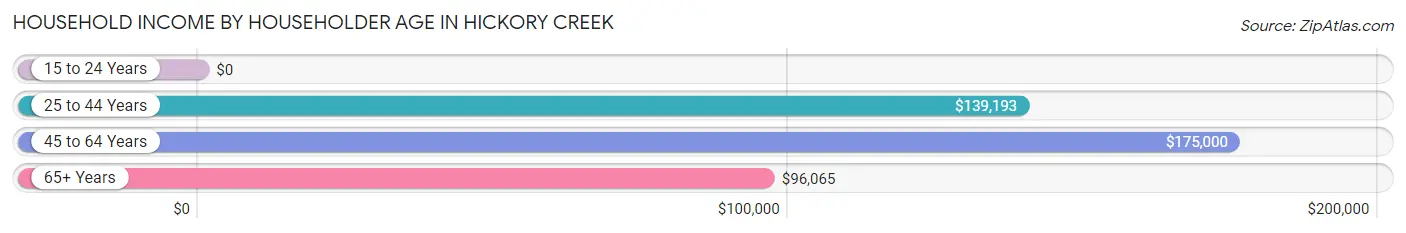
| Income Bracket | # Households | Median Income |
| 15 to 24 Years | 0 (0.0%) | $0 |
| 25 to 44 Years | 570 (34.4%) | $139,193 |
| 45 to 64 Years | 760 (45.9%) | $175,000 |
| 65+ Years | 326 (19.7%) | $96,065 |
| Total | 1,656 (100.0%) | $138,584 |
Poverty in Hickory Creek
Income Below Poverty by Sex and Age in Hickory Creek
With 1.2% poverty level for males and 0.3% for females among the residents of Hickory Creek, 18 to 24 year old males and 55 to 64 year old females are the most vulnerable to poverty, with 31 males (6.4%) and 7 females (2.9%) in their respective age groups living below the poverty level.
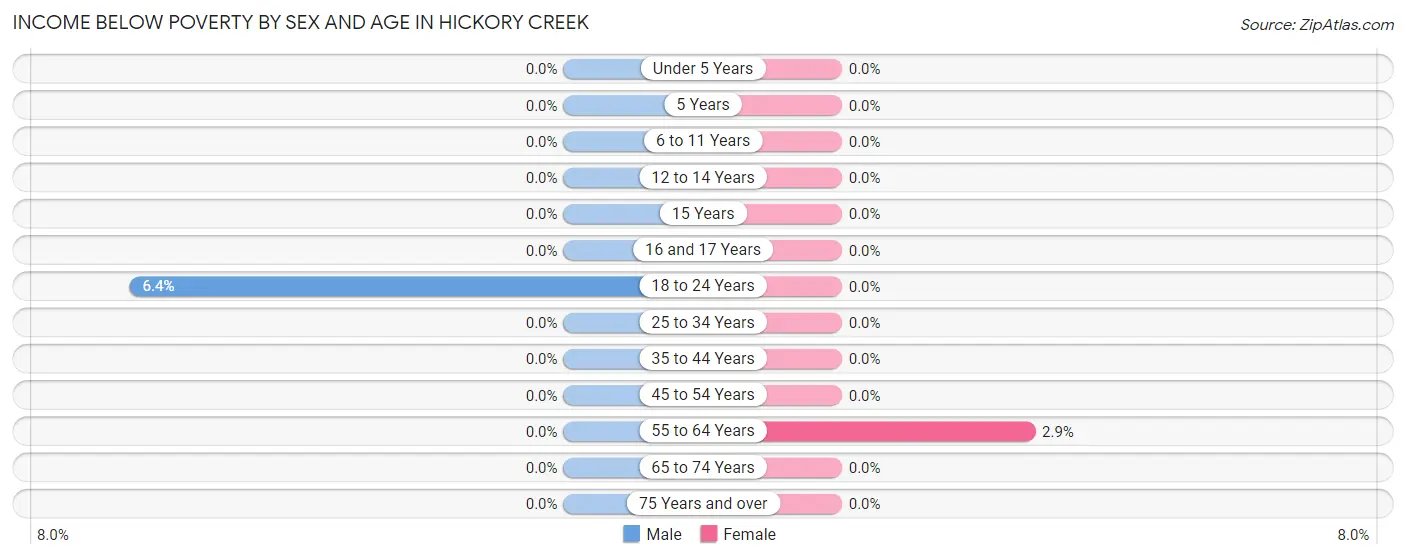
| Age Bracket | Male | Female |
| Under 5 Years | 0 (0.0%) | 0 (0.0%) |
| 5 Years | 0 (0.0%) | 0 (0.0%) |
| 6 to 11 Years | 0 (0.0%) | 0 (0.0%) |
| 12 to 14 Years | 0 (0.0%) | 0 (0.0%) |
| 15 Years | 0 (0.0%) | 0 (0.0%) |
| 16 and 17 Years | 0 (0.0%) | 0 (0.0%) |
| 18 to 24 Years | 31 (6.4%) | 0 (0.0%) |
| 25 to 34 Years | 0 (0.0%) | 0 (0.0%) |
| 35 to 44 Years | 0 (0.0%) | 0 (0.0%) |
| 45 to 54 Years | 0 (0.0%) | 0 (0.0%) |
| 55 to 64 Years | 0 (0.0%) | 7 (2.9%) |
| 65 to 74 Years | 0 (0.0%) | 0 (0.0%) |
| 75 Years and over | 0 (0.0%) | 0 (0.0%) |
| Total | 31 (1.2%) | 7 (0.3%) |
Income Above Poverty by Sex and Age in Hickory Creek
According to the poverty statistics in Hickory Creek, males aged under 5 years and females aged under 5 years are the age groups that are most secure financially, with 100.0% of males and 100.0% of females in these age groups living above the poverty line.
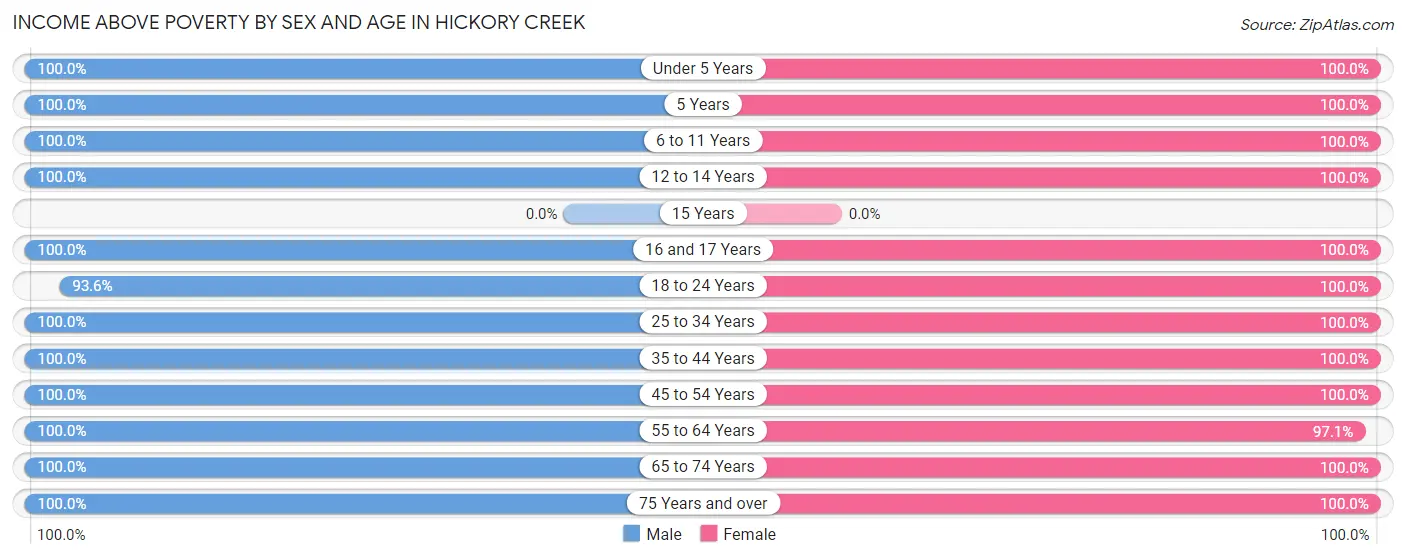
| Age Bracket | Male | Female |
| Under 5 Years | 177 (100.0%) | 95 (100.0%) |
| 5 Years | 32 (100.0%) | 50 (100.0%) |
| 6 to 11 Years | 60 (100.0%) | 161 (100.0%) |
| 12 to 14 Years | 79 (100.0%) | 56 (100.0%) |
| 15 Years | 0 (0.0%) | 0 (0.0%) |
| 16 and 17 Years | 19 (100.0%) | 45 (100.0%) |
| 18 to 24 Years | 450 (93.6%) | 293 (100.0%) |
| 25 to 34 Years | 376 (100.0%) | 324 (100.0%) |
| 35 to 44 Years | 242 (100.0%) | 218 (100.0%) |
| 45 to 54 Years | 589 (100.0%) | 602 (100.0%) |
| 55 to 64 Years | 290 (100.0%) | 237 (97.1%) |
| 65 to 74 Years | 218 (100.0%) | 79 (100.0%) |
| 75 Years and over | 39 (100.0%) | 137 (100.0%) |
| Total | 2,571 (98.8%) | 2,297 (99.7%) |
Income Below Poverty Among Married-Couple Families in Hickory Creek
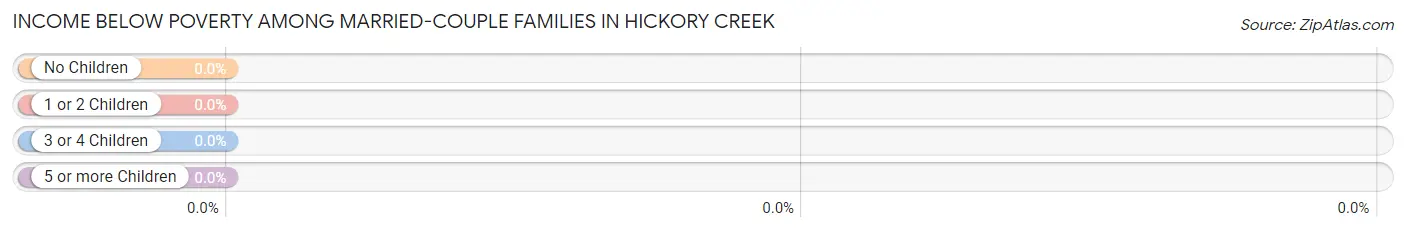
| Children | Above Poverty | Below Poverty |
| No Children | 669 (100.0%) | 0 (0.0%) |
| 1 or 2 Children | 305 (100.0%) | 0 (0.0%) |
| 3 or 4 Children | 73 (100.0%) | 0 (0.0%) |
| 5 or more Children | 0 (0.0%) | 0 (0.0%) |
| Total | 1,047 (100.0%) | 0 (0.0%) |
Income Below Poverty Among Single-Parent Households in Hickory Creek
| Children | Single Father | Single Mother |
| No Children | 0 (0.0%) | 0 (0.0%) |
| 1 or 2 Children | 0 (0.0%) | 0 (0.0%) |
| 3 or 4 Children | 0 (0.0%) | 0 (0.0%) |
| 5 or more Children | 0 (0.0%) | 0 (0.0%) |
| Total | 0 (0.0%) | 0 (0.0%) |
Income Below Poverty Among Married-Couple vs Single-Parent Households in Hickory Creek
| Children | Married-Couple Families | Single-Parent Households |
| No Children | 0 (0.0%) | 0 (0.0%) |
| 1 or 2 Children | 0 (0.0%) | 0 (0.0%) |
| 3 or 4 Children | 0 (0.0%) | 0 (0.0%) |
| 5 or more Children | 0 (0.0%) | 0 (0.0%) |
| Total | 0 (0.0%) | 0 (0.0%) |
Race in Hickory Creek
The most populous races in Hickory Creek are White / Caucasian (3,745 | 76.3%), Hispanic or Latino (731 | 14.9%), and Two or more Races (564 | 11.5%).
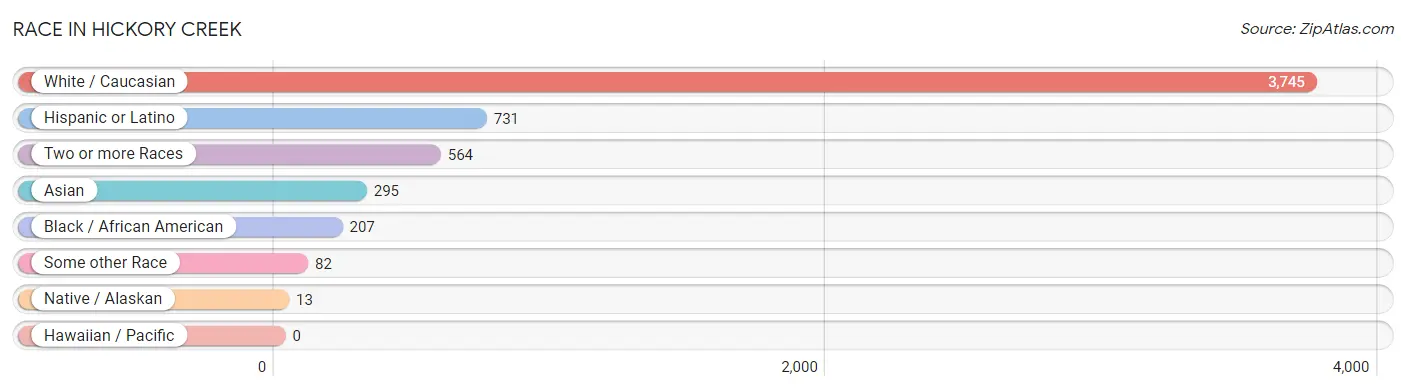
| Race | # Population | % Population |
| Asian | 295 | 6.0% |
| Black / African American | 207 | 4.2% |
| Hawaiian / Pacific | 0 | 0.0% |
| Hispanic or Latino | 731 | 14.9% |
| Native / Alaskan | 13 | 0.3% |
| White / Caucasian | 3,745 | 76.3% |
| Two or more Races | 564 | 11.5% |
| Some other Race | 82 | 1.7% |
| Total | 4,906 | 100.0% |
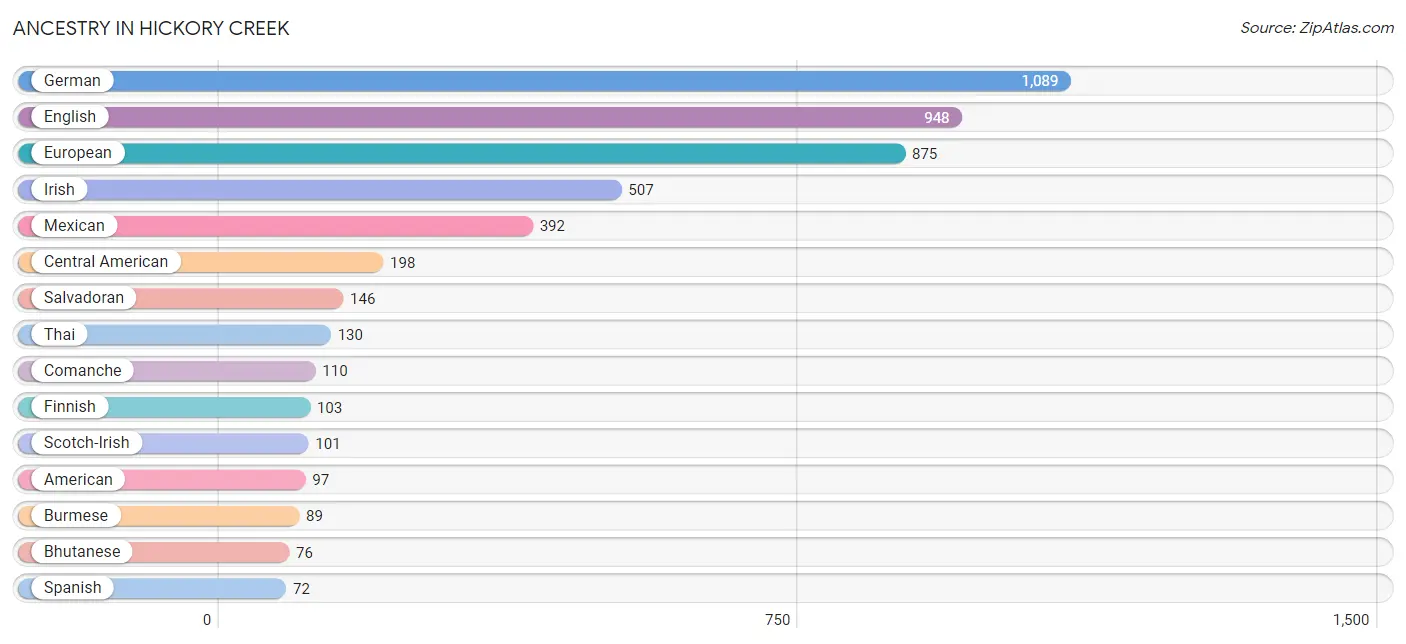
Ancestry in Hickory Creek
The most populous ancestries reported in Hickory Creek are German (1,089 | 22.2%), English (948 | 19.3%), European (875 | 17.8%), Irish (507 | 10.3%), and Mexican (392 | 8.0%), together accounting for 77.7% of all Hickory Creek residents.
| Ancestry | # Population | % Population |
| American | 97 | 2.0% |
| Arab | 18 | 0.4% |
| Argentinean | 20 | 0.4% |
| Austrian | 10 | 0.2% |
| Belgian | 9 | 0.2% |
| Bhutanese | 76 | 1.5% |
| British | 22 | 0.4% |
| Burmese | 89 | 1.8% |
| Central American | 198 | 4.0% |
| Central American Indian | 20 | 0.4% |
| Choctaw | 18 | 0.4% |
| Comanche | 110 | 2.2% |
| Creek | 52 | 1.1% |
| Czech | 22 | 0.4% |
| Czechoslovakian | 17 | 0.4% |
| Dutch | 27 | 0.5% |
| Eastern European | 27 | 0.5% |
| English | 948 | 19.3% |
| European | 875 | 17.8% |
| Finnish | 103 | 2.1% |
| French | 21 | 0.4% |
| French Canadian | 13 | 0.3% |
| German | 1,089 | 22.2% |
| Greek | 34 | 0.7% |
| Haitian | 19 | 0.4% |
| Indian (Asian) | 52 | 1.1% |
| Iranian | 58 | 1.2% |
| Irish | 507 | 10.3% |
| Italian | 16 | 0.3% |
| Lebanese | 18 | 0.4% |
| Lithuanian | 11 | 0.2% |
| Maltese | 18 | 0.4% |
| Mexican | 392 | 8.0% |
| Norwegian | 35 | 0.7% |
| Panamanian | 52 | 1.1% |
| Polish | 20 | 0.4% |
| Portuguese | 5 | 0.1% |
| Puerto Rican | 20 | 0.4% |
| Salvadoran | 146 | 3.0% |
| Scotch-Irish | 101 | 2.1% |
| Scottish | 71 | 1.5% |
| Slovak | 31 | 0.6% |
| South American | 20 | 0.4% |
| Spaniard | 21 | 0.4% |
| Spanish | 72 | 1.5% |
| Swedish | 11 | 0.2% |
| Thai | 130 | 2.6% |
| Ukrainian | 8 | 0.2% |
| Yugoslavian | 20 | 0.4% | View All 49 Rows |
Immigrants in Hickory Creek
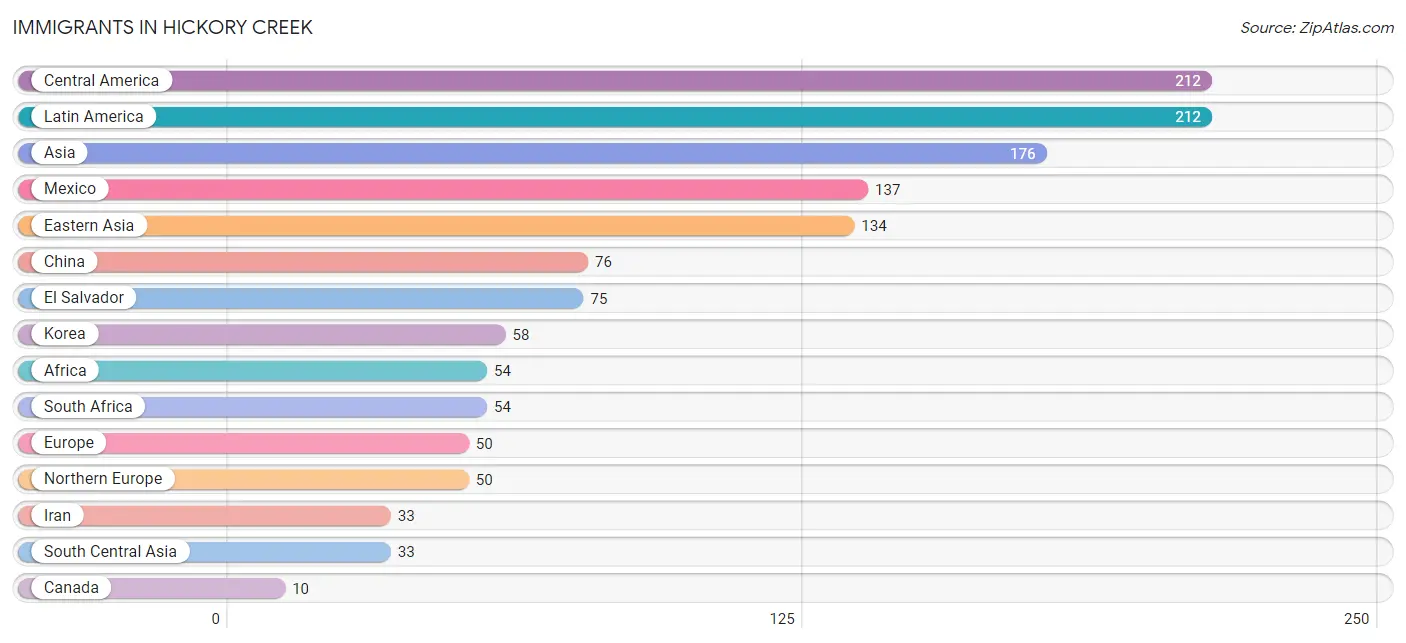
The most numerous immigrant groups reported in Hickory Creek came from Central America (212 | 4.3%), Latin America (212 | 4.3%), Asia (176 | 3.6%), Mexico (137 | 2.8%), and Eastern Asia (134 | 2.7%), together accounting for 17.7% of all Hickory Creek residents.
| Immigration Origin | # Population | % Population |
| Africa | 54 | 1.1% |
| Asia | 176 | 3.6% |
| Canada | 10 | 0.2% |
| Central America | 212 | 4.3% |
| China | 76 | 1.5% |
| Eastern Asia | 134 | 2.7% |
| El Salvador | 75 | 1.5% |
| Europe | 50 | 1.0% |
| Iran | 33 | 0.7% |
| Korea | 58 | 1.2% |
| Latin America | 212 | 4.3% |
| Lebanon | 9 | 0.2% |
| Mexico | 137 | 2.8% |
| Northern Europe | 50 | 1.0% |
| South Africa | 54 | 1.1% |
| South Central Asia | 33 | 0.7% |
| Western Asia | 9 | 0.2% | View All 17 Rows |
Sex and Age in Hickory Creek
Sex and Age in Hickory Creek
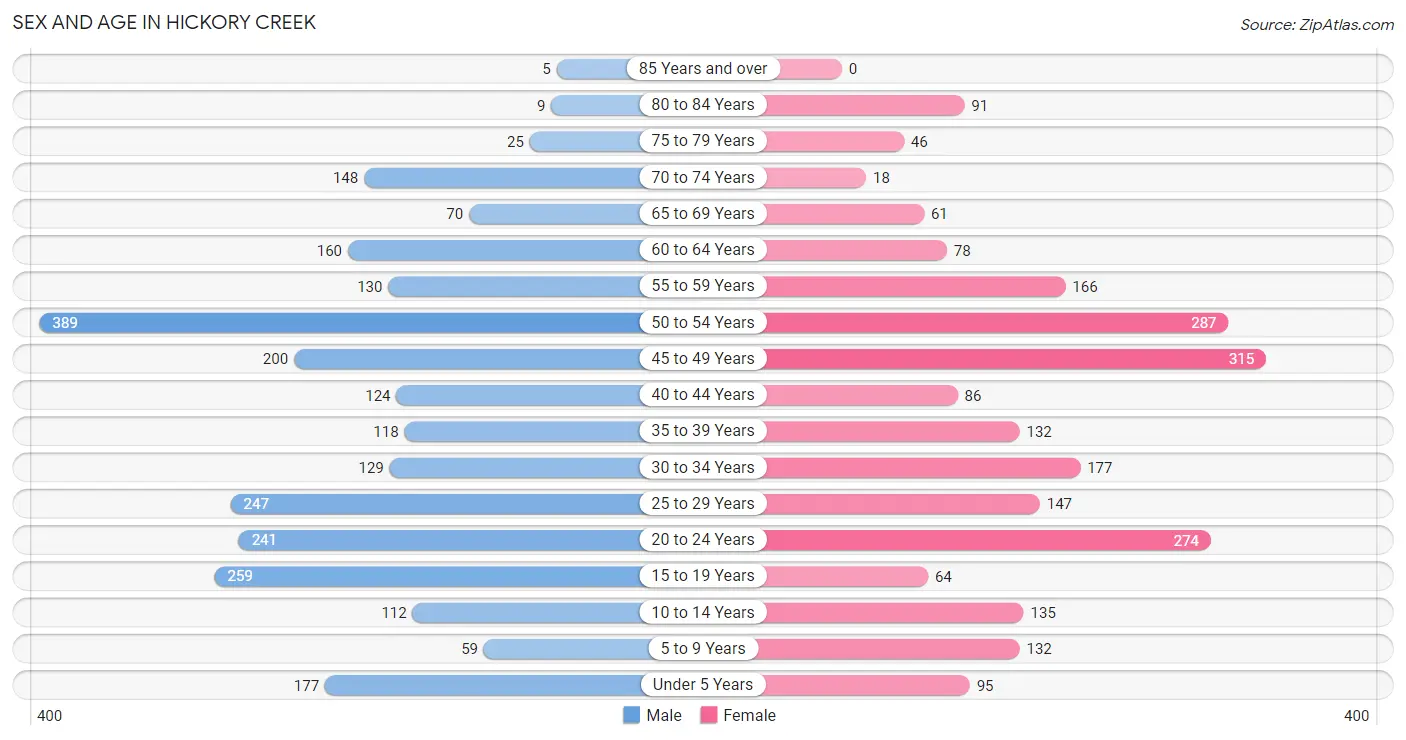
The most populous age groups in Hickory Creek are 50 to 54 Years (389 | 14.9%) for men and 45 to 49 Years (315 | 13.7%) for women.
| Age Bracket | Male | Female |
| Under 5 Years | 177 (6.8%) | 95 (4.1%) |
| 5 to 9 Years | 59 (2.3%) | 132 (5.7%) |
| 10 to 14 Years | 112 (4.3%) | 135 (5.9%) |
| 15 to 19 Years | 259 (10.0%) | 64 (2.8%) |
| 20 to 24 Years | 241 (9.3%) | 274 (11.9%) |
| 25 to 29 Years | 247 (9.5%) | 147 (6.4%) |
| 30 to 34 Years | 129 (5.0%) | 177 (7.7%) |
| 35 to 39 Years | 118 (4.5%) | 132 (5.7%) |
| 40 to 44 Years | 124 (4.8%) | 86 (3.7%) |
| 45 to 49 Years | 200 (7.7%) | 315 (13.7%) |
| 50 to 54 Years | 389 (14.9%) | 287 (12.5%) |
| 55 to 59 Years | 130 (5.0%) | 166 (7.2%) |
| 60 to 64 Years | 160 (6.1%) | 78 (3.4%) |
| 65 to 69 Years | 70 (2.7%) | 61 (2.6%) |
| 70 to 74 Years | 148 (5.7%) | 18 (0.8%) |
| 75 to 79 Years | 25 (1.0%) | 46 (2.0%) |
| 80 to 84 Years | 9 (0.4%) | 91 (4.0%) |
| 85 Years and over | 5 (0.2%) | 0 (0.0%) |
| Total | 2,602 (100.0%) | 2,304 (100.0%) |
Families and Households in Hickory Creek
Median Family Size in Hickory Creek
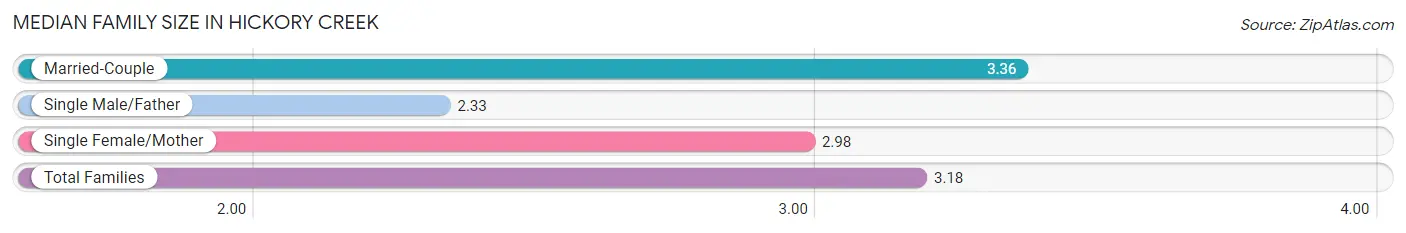
The median family size in Hickory Creek is 3.18 persons per family, with married-couple families (1,047 | 73.7%) accounting for the largest median family size of 3.36 persons per family. On the other hand, single male/father families (171 | 12.0%) represent the smallest median family size with 2.33 persons per family.
| Family Type | # Families | Family Size |
| Married-Couple | 1,047 (73.7%) | 3.36 |
| Single Male/Father | 171 (12.0%) | 2.33 |
| Single Female/Mother | 202 (14.2%) | 2.98 |
| Total Families | 1,420 (100.0%) | 3.18 |
Median Household Size in Hickory Creek
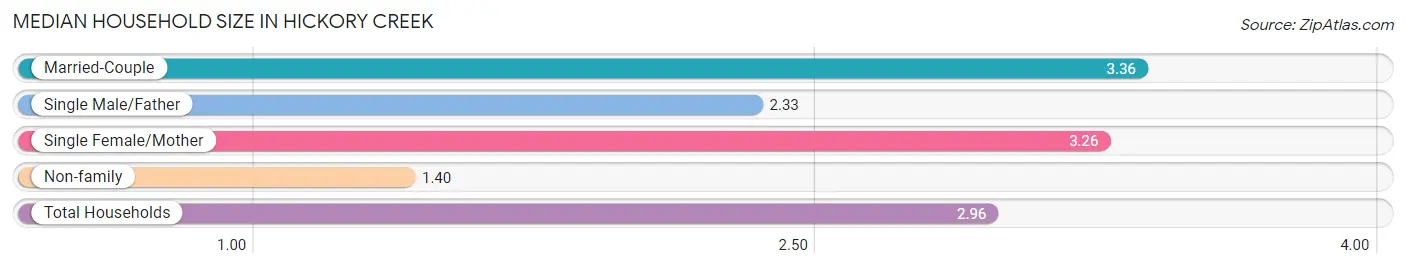
The median household size in Hickory Creek is 2.96 persons per household, with married-couple households (1,047 | 63.2%) accounting for the largest median household size of 3.36 persons per household. non-family households (236 | 14.2%) represent the smallest median household size with 1.40 persons per household.
| Household Type | # Households | Household Size |
| Married-Couple | 1,047 (63.2%) | 3.36 |
| Single Male/Father | 171 (10.3%) | 2.33 |
| Single Female/Mother | 202 (12.2%) | 3.26 |
| Non-family | 236 (14.2%) | 1.40 |
| Total Households | 1,656 (100.0%) | 2.96 |
Household Size by Marriage Status in Hickory Creek
Out of a total of 1,656 households in Hickory Creek, 1,420 (85.8%) are family households, while 236 (14.2%) are nonfamily households. The most numerous type of family households are 2-person households, comprising 637, and the most common type of nonfamily households are 1-person households, comprising 160.
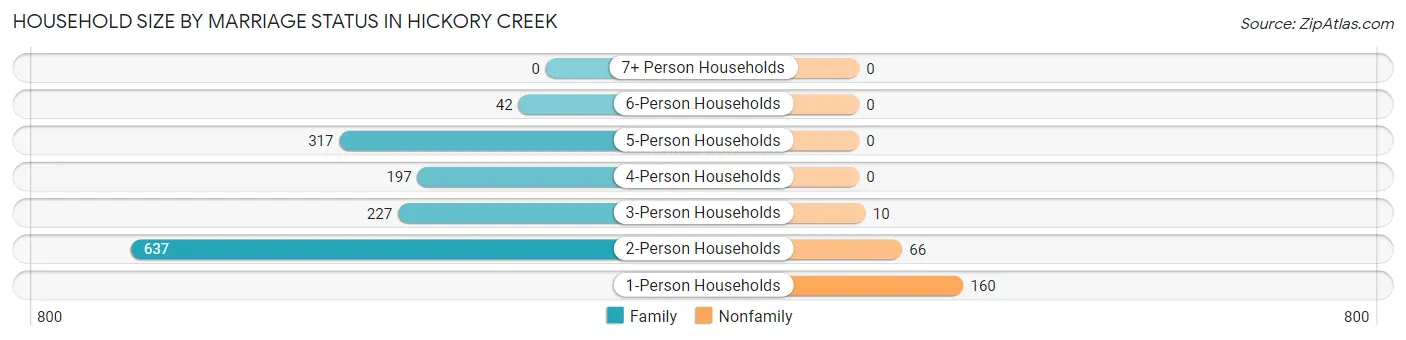
| Household Size | Family Households | Nonfamily Households |
| 1-Person Households | - | 160 (9.7%) |
| 2-Person Households | 637 (38.5%) | 66 (4.0%) |
| 3-Person Households | 227 (13.7%) | 10 (0.6%) |
| 4-Person Households | 197 (11.9%) | 0 (0.0%) |
| 5-Person Households | 317 (19.1%) | 0 (0.0%) |
| 6-Person Households | 42 (2.5%) | 0 (0.0%) |
| 7+ Person Households | 0 (0.0%) | 0 (0.0%) |
| Total | 1,420 (85.8%) | 236 (14.2%) |
Female Fertility in Hickory Creek
Fertility by Age in Hickory Creek
Average fertility rate in Hickory Creek is 86.0 births per 1,000 women. Women in the age bracket of 35 to 50 years have the highest fertility rate with 91.0 births per 1,000 women. Women in the age bracket of 20 to 34 years acount for 51.4% of all women with births.
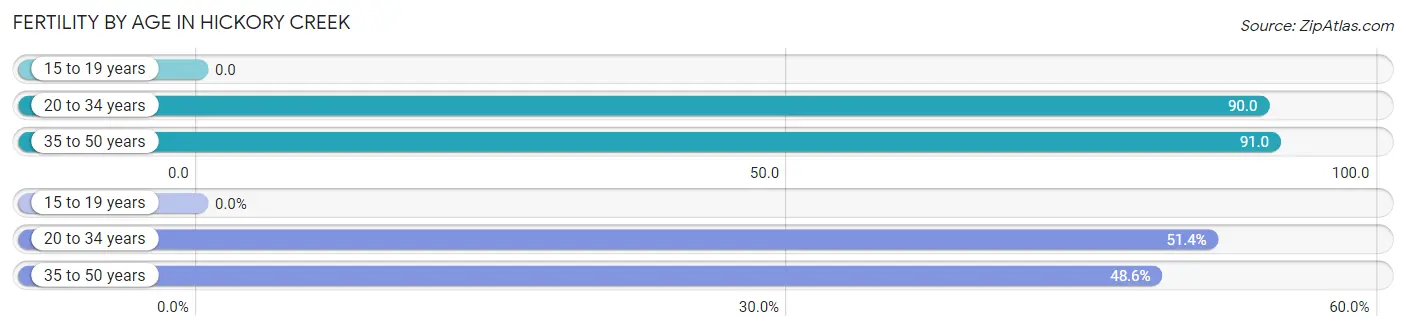
| Age Bracket | Women with Births | Births / 1,000 Women |
| 15 to 19 years | 0 (0.0%) | 0.0 |
| 20 to 34 years | 54 (51.4%) | 90.0 |
| 35 to 50 years | 51 (48.6%) | 91.0 |
| Total | 105 (100.0%) | 86.0 |
Fertility by Age by Marriage Status in Hickory Creek
75.2% of women with births (105) in Hickory Creek are married. The highest percentage of unmarried women with births falls into 20 to 34 years age bracket with 48.1% of them unmarried at the time of birth, while the lowest percentage of unmarried women with births belong to 35 to 50 years age bracket with 0.0% of them unmarried.
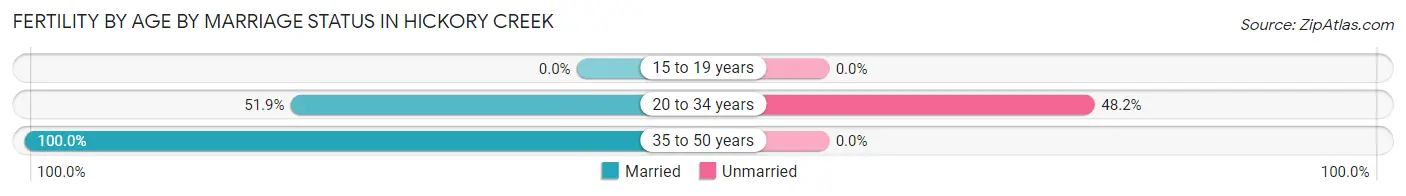
| Age Bracket | Married | Unmarried |
| 15 to 19 years | 0 (0.0%) | 0 (0.0%) |
| 20 to 34 years | 28 (51.8%) | 26 (48.1%) |
| 35 to 50 years | 51 (100.0%) | 0 (0.0%) |
| Total | 79 (75.2%) | 26 (24.8%) |
Fertility by Education in Hickory Creek
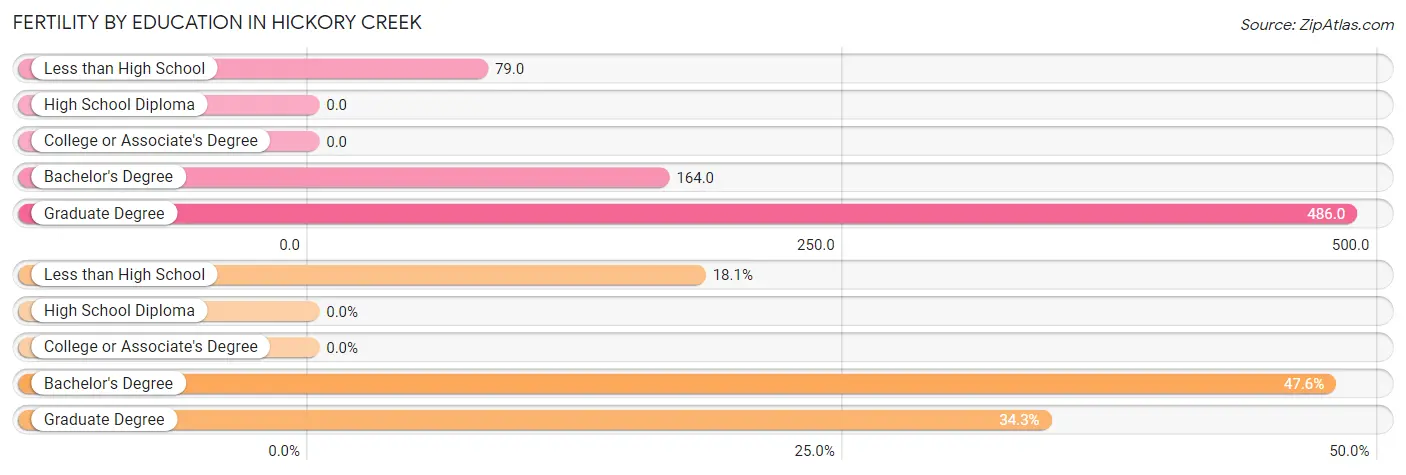
| Educational Attainment | Women with Births | Births / 1,000 Women |
| Less than High School | 19 (18.1%) | 79.0 |
| High School Diploma | 0 (0.0%) | 0.0 |
| College or Associate's Degree | 0 (0.0%) | 0.0 |
| Bachelor's Degree | 50 (47.6%) | 164.0 |
| Graduate Degree | 36 (34.3%) | 486.0 |
| Total | 105 (100.0%) | 86.0 |
Fertility by Education by Marriage Status in Hickory Creek
24.8% of women with births in Hickory Creek are unmarried. Women with the educational attainment of less than high school are most likely to be married with 100.0% of them married at childbirth, while women with the educational attainment of bachelor's degree are least likely to be married with 52.0% of them unmarried at childbirth.
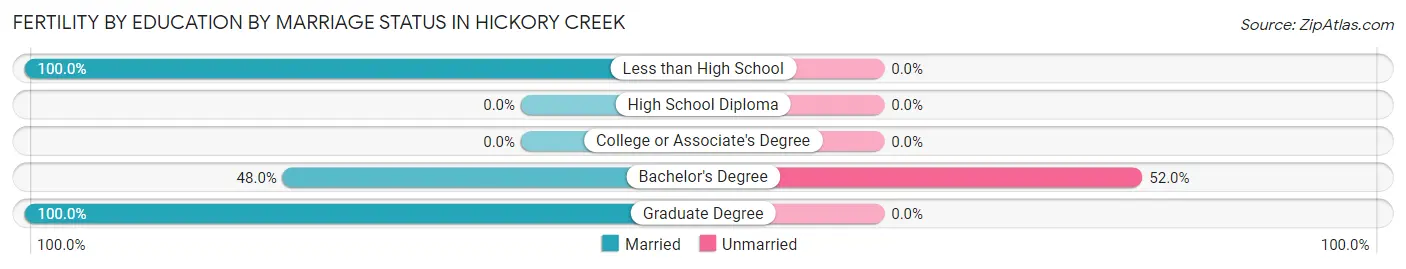
| Educational Attainment | Married | Unmarried |
| Less than High School | 19 (100.0%) | 0 (0.0%) |
| High School Diploma | 0 (0.0%) | 0 (0.0%) |
| College or Associate's Degree | 0 (0.0%) | 0 (0.0%) |
| Bachelor's Degree | 24 (48.0%) | 26 (52.0%) |
| Graduate Degree | 36 (100.0%) | 0 (0.0%) |
| Total | 79 (75.2%) | 26 (24.8%) |
Employment Characteristics in Hickory Creek
Employment by Class of Employer in Hickory Creek
Among the 3,195 employed individuals in Hickory Creek, private company employees (2,622 | 82.1%), self-employed (not incorporated) (195 | 6.1%), and not-for-profit organizations (126 | 3.9%) make up the most common classes of employment.
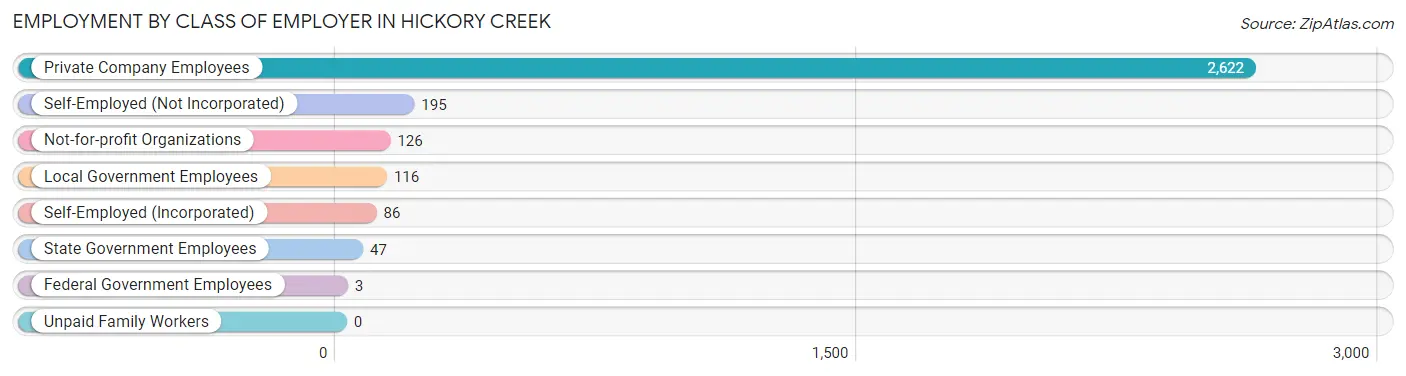
| Employer Class | # Employees | % Employees |
| Private Company Employees | 2,622 | 82.1% |
| Self-Employed (Incorporated) | 86 | 2.7% |
| Self-Employed (Not Incorporated) | 195 | 6.1% |
| Not-for-profit Organizations | 126 | 3.9% |
| Local Government Employees | 116 | 3.6% |
| State Government Employees | 47 | 1.5% |
| Federal Government Employees | 3 | 0.1% |
| Unpaid Family Workers | 0 | 0.0% |
| Total | 3,195 | 100.0% |
Employment Status by Age in Hickory Creek
According to the labor force statistics for Hickory Creek, out of the total population over 16 years of age (4,196), 85.6% or 3,592 individuals are in the labor force, with 2.6% or 93 of them unemployed. The age group with the highest labor force participation rate is 25 to 29 years, with 100.0% or 394 individuals in the labor force. Within the labor force, the 55 to 59 years age range has the highest percentage of unemployed individuals, with 22.3% or 66 of them being unemployed.
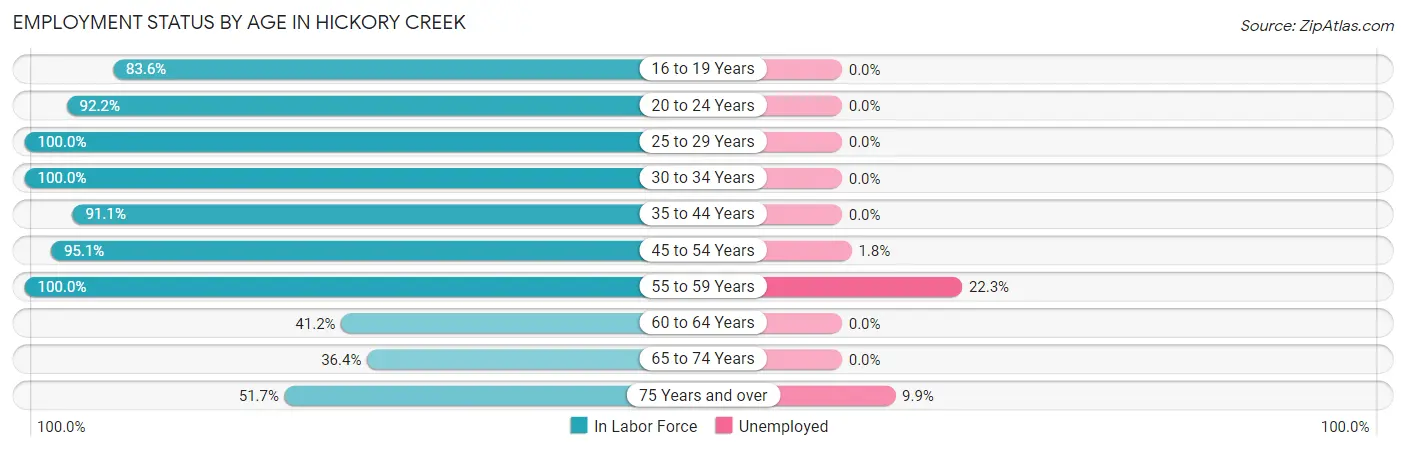
| Age Bracket | In Labor Force | Unemployed |
| 16 to 19 Years | 270 (83.6%) | 0 (0.0%) |
| 20 to 24 Years | 475 (92.2%) | 0 (0.0%) |
| 25 to 29 Years | 394 (100.0%) | 0 (0.0%) |
| 30 to 34 Years | 306 (100.0%) | 0 (0.0%) |
| 35 to 44 Years | 419 (91.1%) | 0 (0.0%) |
| 45 to 54 Years | 1,133 (95.1%) | 20 (1.8%) |
| 55 to 59 Years | 296 (100.0%) | 66 (22.3%) |
| 60 to 64 Years | 98 (41.2%) | 0 (0.0%) |
| 65 to 74 Years | 108 (36.4%) | 0 (0.0%) |
| 75 Years and over | 91 (51.7%) | 9 (9.9%) |
| Total | 3,592 (85.6%) | 93 (2.6%) |
Employment Status by Educational Attainment in Hickory Creek
According to labor force statistics for Hickory Creek, 91.7% of individuals (2,646) out of the total population between 25 and 64 years of age (2,885) are in the labor force, with 3.3% or 87 of them being unemployed. The group with the highest labor force participation rate are those with the educational attainment of bachelor's degree or higher, with 96.7% or 1,275 individuals in the labor force. Within the labor force, individuals with less than high school education have the highest percentage of unemployment, with 22.8% or 66 of them being unemployed.
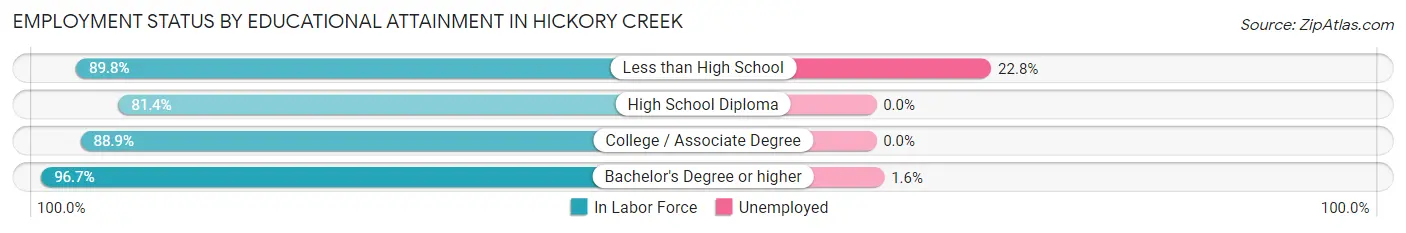
| Educational Attainment | In Labor Force | Unemployed |
| Less than High School | 289 (89.8%) | 73 (22.8%) |
| High School Diploma | 271 (81.4%) | 0 (0.0%) |
| College / Associate Degree | 810 (88.9%) | 0 (0.0%) |
| Bachelor's Degree or higher | 1,275 (96.7%) | 21 (1.6%) |
| Total | 2,646 (91.7%) | 95 (3.3%) |
Employment Occupations by Sex in Hickory Creek
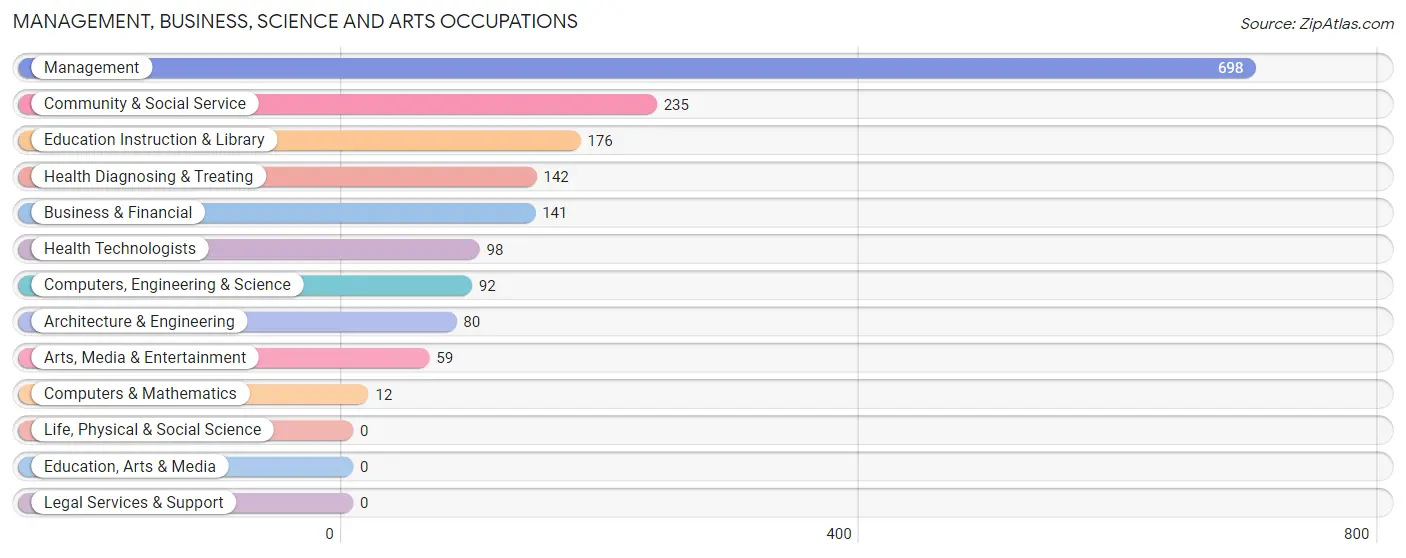
Management, Business, Science and Arts Occupations
The most common Management, Business, Science and Arts occupations in Hickory Creek are Management (698 | 20.0%), Community & Social Service (235 | 6.7%), Education Instruction & Library (176 | 5.0%), Health Diagnosing & Treating (142 | 4.1%), and Business & Financial (141 | 4.0%).
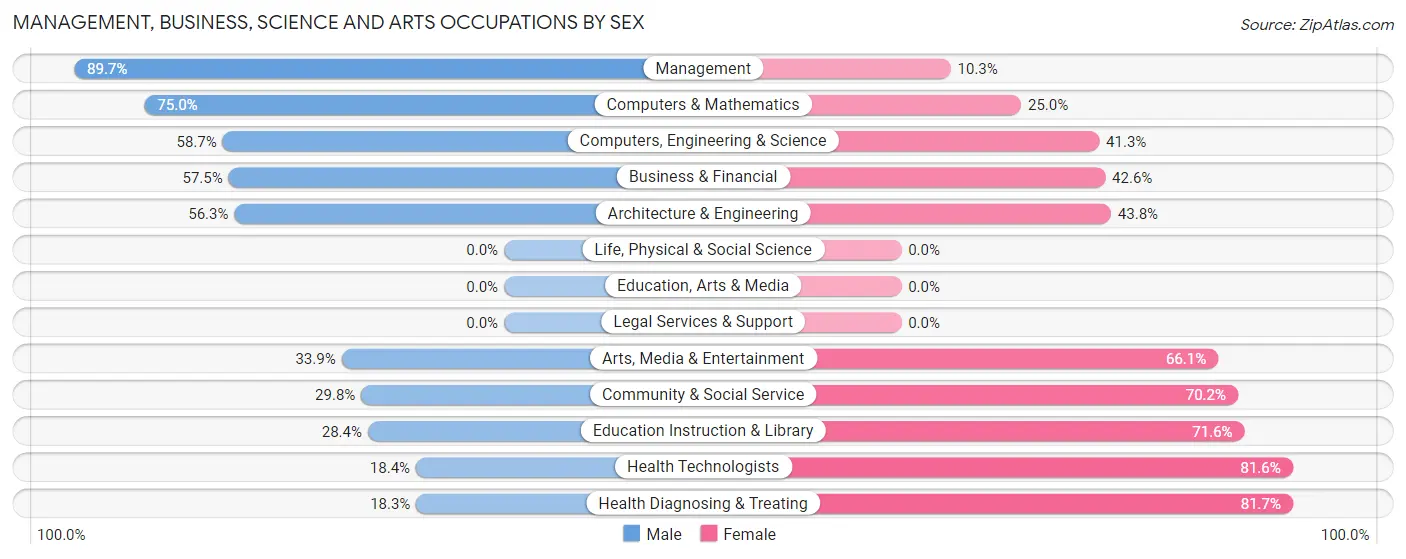
Management, Business, Science and Arts Occupations by Sex
Within the Management, Business, Science and Arts occupations in Hickory Creek, the most male-oriented occupations are Management (89.7%), Computers & Mathematics (75.0%), and Computers, Engineering & Science (58.7%), while the most female-oriented occupations are Health Diagnosing & Treating (81.7%), Health Technologists (81.6%), and Education Instruction & Library (71.6%).
| Occupation | Male | Female |
| Management | 626 (89.7%) | 72 (10.3%) |
| Business & Financial | 81 (57.5%) | 60 (42.5%) |
| Computers, Engineering & Science | 54 (58.7%) | 38 (41.3%) |
| Computers & Mathematics | 9 (75.0%) | 3 (25.0%) |
| Architecture & Engineering | 45 (56.2%) | 35 (43.8%) |
| Life, Physical & Social Science | 0 (0.0%) | 0 (0.0%) |
| Community & Social Service | 70 (29.8%) | 165 (70.2%) |
| Education, Arts & Media | 0 (0.0%) | 0 (0.0%) |
| Legal Services & Support | 0 (0.0%) | 0 (0.0%) |
| Education Instruction & Library | 50 (28.4%) | 126 (71.6%) |
| Arts, Media & Entertainment | 20 (33.9%) | 39 (66.1%) |
| Health Diagnosing & Treating | 26 (18.3%) | 116 (81.7%) |
| Health Technologists | 18 (18.4%) | 80 (81.6%) |
| Total (Category) | 857 (65.5%) | 451 (34.5%) |
| Total (Overall) | 1,860 (53.2%) | 1,635 (46.8%) |
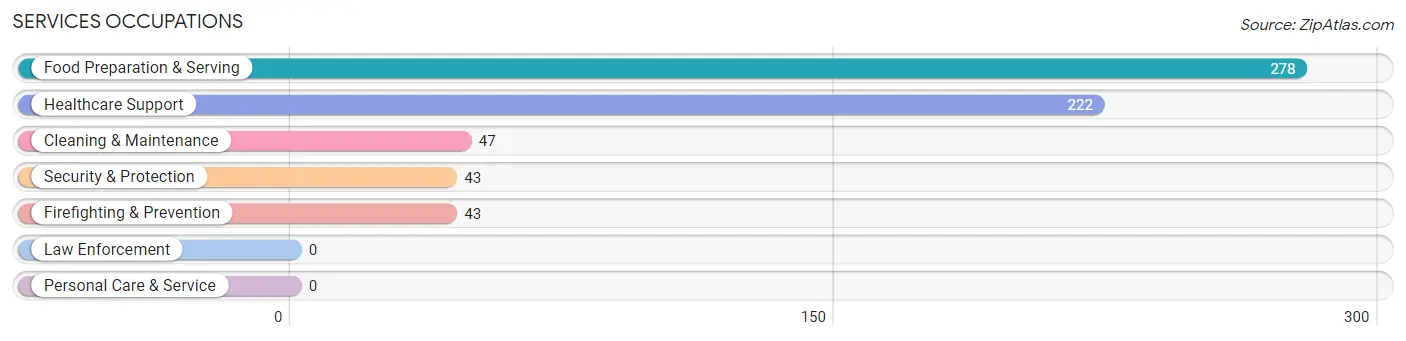
Services Occupations
The most common Services occupations in Hickory Creek are Food Preparation & Serving (278 | 8.0%), Healthcare Support (222 | 6.4%), Cleaning & Maintenance (47 | 1.3%), Security & Protection (43 | 1.2%), and Firefighting & Prevention (43 | 1.2%).
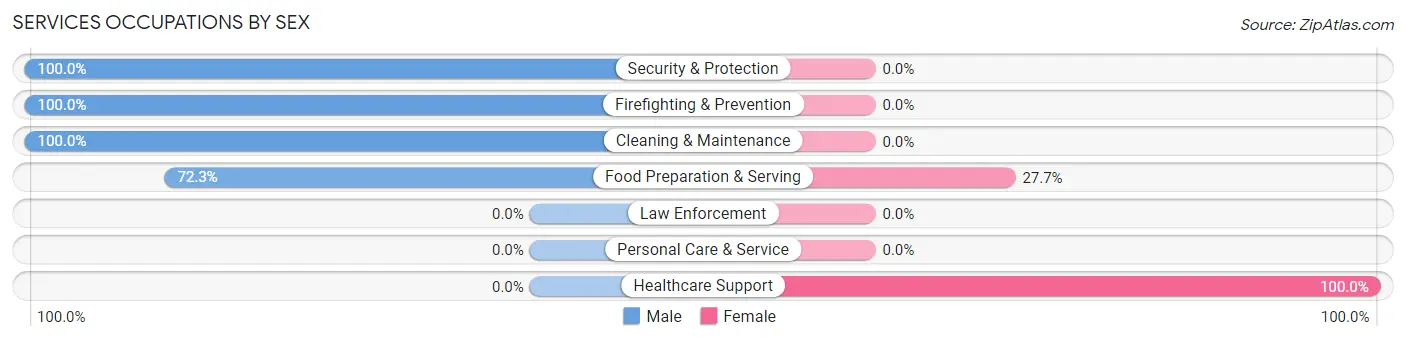
Services Occupations by Sex
Within the Services occupations in Hickory Creek, the most male-oriented occupations are Security & Protection (100.0%), Firefighting & Prevention (100.0%), and Cleaning & Maintenance (100.0%), while the most female-oriented occupations are Healthcare Support (100.0%), and Food Preparation & Serving (27.7%).
| Occupation | Male | Female |
| Healthcare Support | 0 (0.0%) | 222 (100.0%) |
| Security & Protection | 43 (100.0%) | 0 (0.0%) |
| Firefighting & Prevention | 43 (100.0%) | 0 (0.0%) |
| Law Enforcement | 0 (0.0%) | 0 (0.0%) |
| Food Preparation & Serving | 201 (72.3%) | 77 (27.7%) |
| Cleaning & Maintenance | 47 (100.0%) | 0 (0.0%) |
| Personal Care & Service | 0 (0.0%) | 0 (0.0%) |
| Total (Category) | 291 (49.3%) | 299 (50.7%) |
| Total (Overall) | 1,860 (53.2%) | 1,635 (46.8%) |
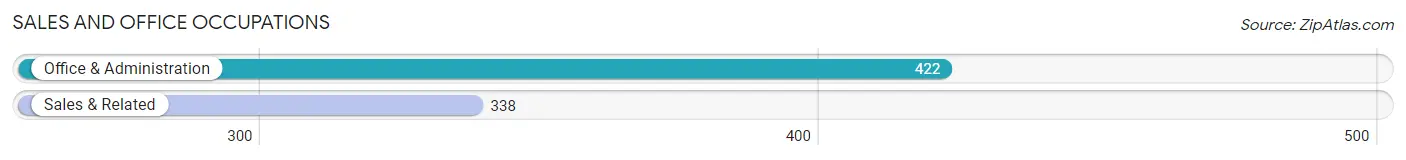
Sales and Office Occupations
The most common Sales and Office occupations in Hickory Creek are Office & Administration (422 | 12.1%), and Sales & Related (338 | 9.7%).
Sales and Office Occupations by Sex
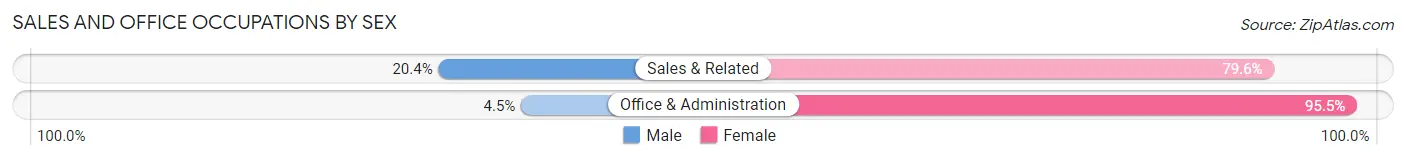
| Occupation | Male | Female |
| Sales & Related | 69 (20.4%) | 269 (79.6%) |
| Office & Administration | 19 (4.5%) | 403 (95.5%) |
| Total (Category) | 88 (11.6%) | 672 (88.4%) |
| Total (Overall) | 1,860 (53.2%) | 1,635 (46.8%) |
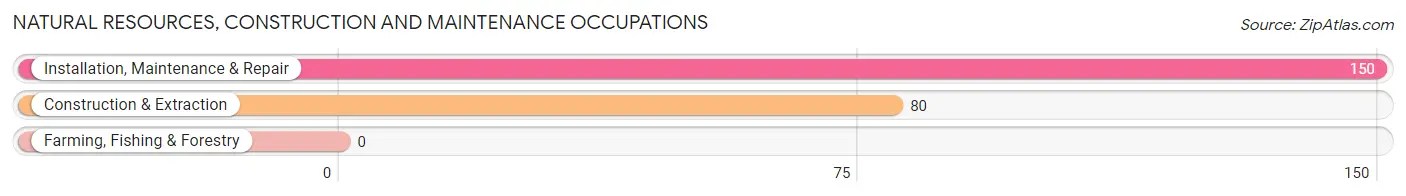
Natural Resources, Construction and Maintenance Occupations
The most common Natural Resources, Construction and Maintenance occupations in Hickory Creek are Installation, Maintenance & Repair (150 | 4.3%), and Construction & Extraction (80 | 2.3%).
Natural Resources, Construction and Maintenance Occupations by Sex
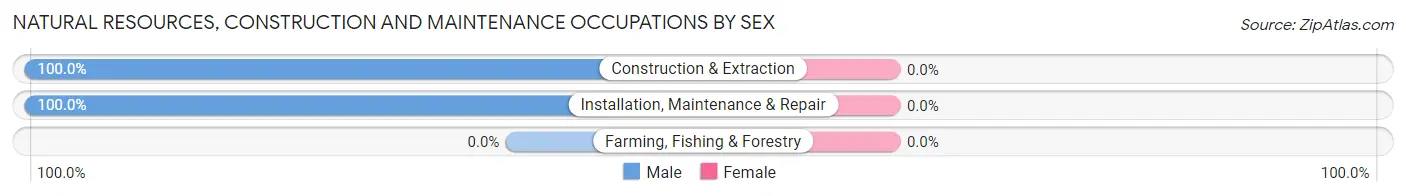
| Occupation | Male | Female |
| Farming, Fishing & Forestry | 0 (0.0%) | 0 (0.0%) |
| Construction & Extraction | 80 (100.0%) | 0 (0.0%) |
| Installation, Maintenance & Repair | 150 (100.0%) | 0 (0.0%) |
| Total (Category) | 230 (100.0%) | 0 (0.0%) |
| Total (Overall) | 1,860 (53.2%) | 1,635 (46.8%) |
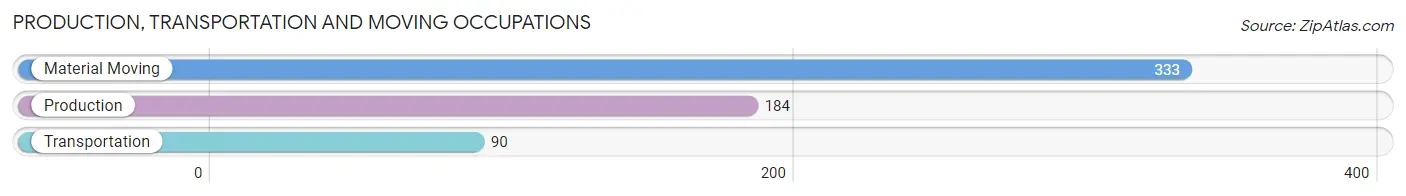
Production, Transportation and Moving Occupations
The most common Production, Transportation and Moving occupations in Hickory Creek are Material Moving (333 | 9.5%), Production (184 | 5.3%), and Transportation (90 | 2.6%).
Production, Transportation and Moving Occupations by Sex
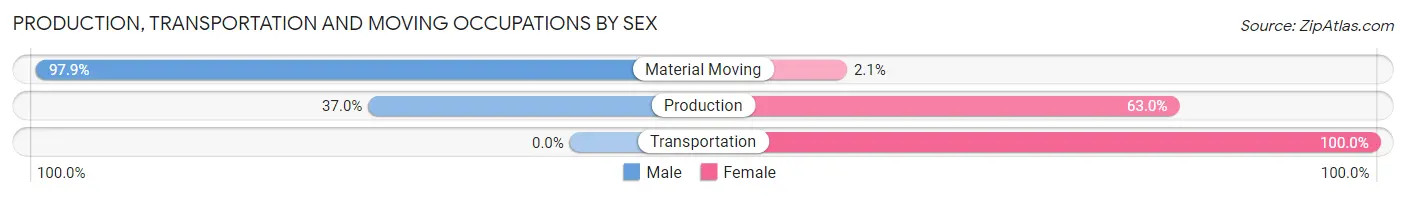
| Occupation | Male | Female |
| Production | 68 (37.0%) | 116 (63.0%) |
| Transportation | 0 (0.0%) | 90 (100.0%) |
| Material Moving | 326 (97.9%) | 7 (2.1%) |
| Total (Category) | 394 (64.9%) | 213 (35.1%) |
| Total (Overall) | 1,860 (53.2%) | 1,635 (46.8%) |
Employment Industries by Sex in Hickory Creek
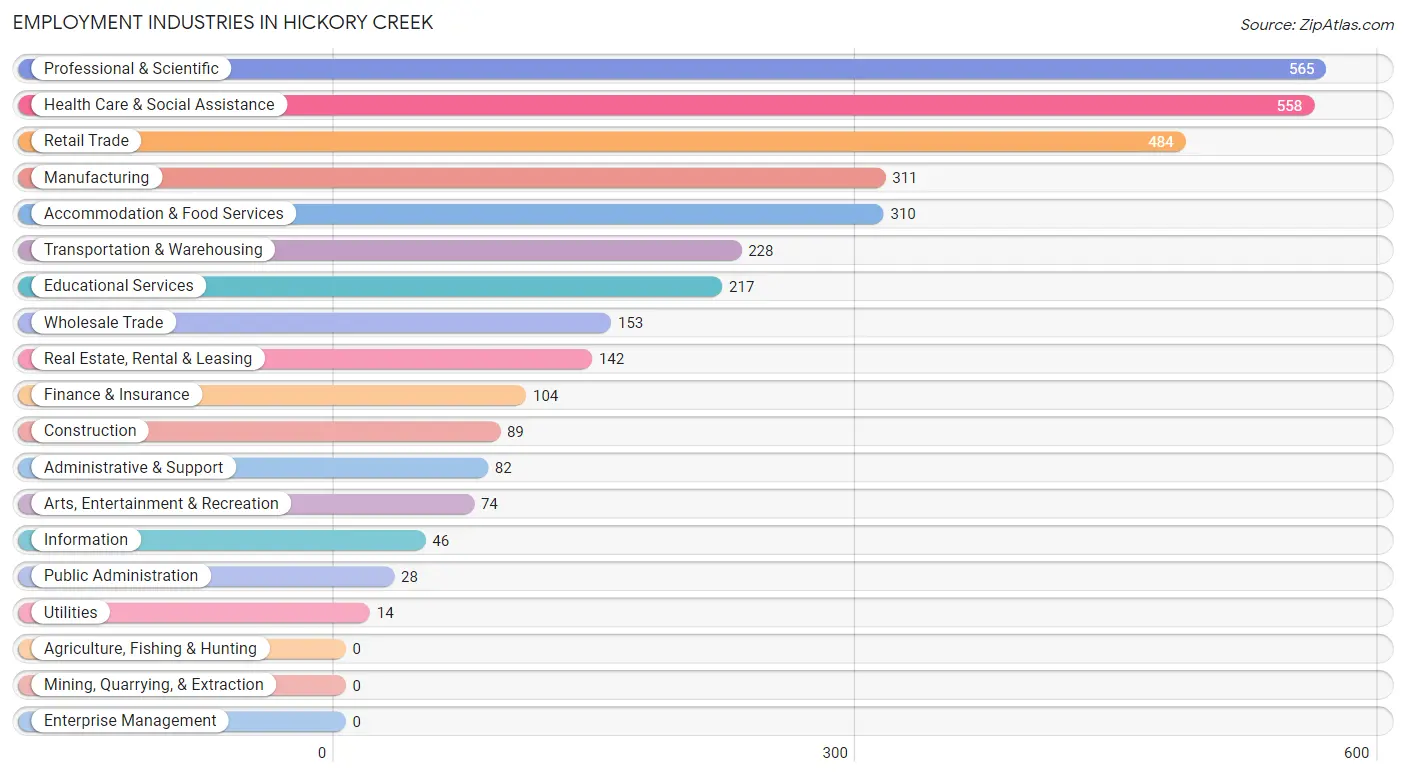
Employment Industries in Hickory Creek
The major employment industries in Hickory Creek include Professional & Scientific (565 | 16.2%), Health Care & Social Assistance (558 | 16.0%), Retail Trade (484 | 13.9%), Manufacturing (311 | 8.9%), and Accommodation & Food Services (310 | 8.9%).
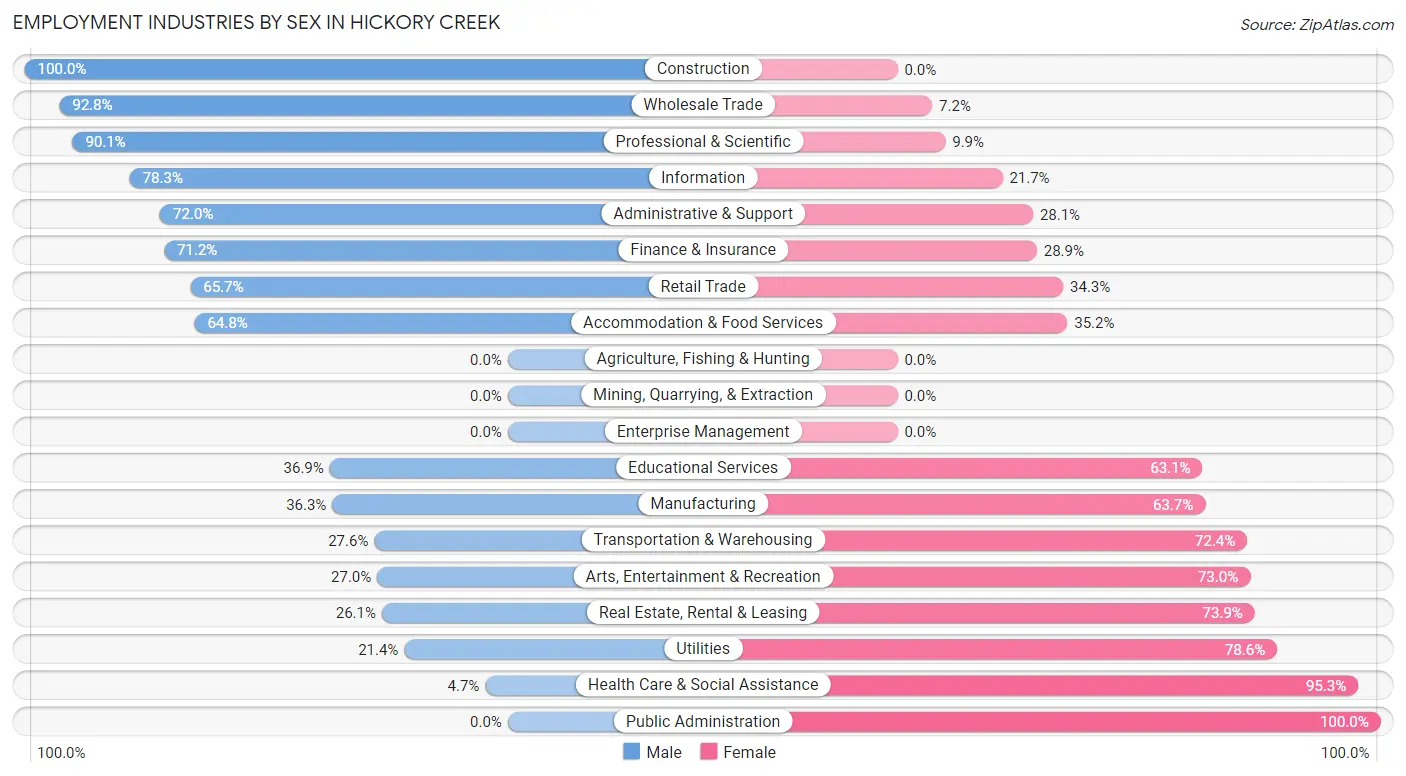
Employment Industries by Sex in Hickory Creek
The Hickory Creek industries that see more men than women are Construction (100.0%), Wholesale Trade (92.8%), and Professional & Scientific (90.1%), whereas the industries that tend to have a higher number of women are Public Administration (100.0%), Health Care & Social Assistance (95.3%), and Utilities (78.6%).
| Industry | Male | Female |
| Agriculture, Fishing & Hunting | 0 (0.0%) | 0 (0.0%) |
| Mining, Quarrying, & Extraction | 0 (0.0%) | 0 (0.0%) |
| Construction | 89 (100.0%) | 0 (0.0%) |
| Manufacturing | 113 (36.3%) | 198 (63.7%) |
| Wholesale Trade | 142 (92.8%) | 11 (7.2%) |
| Retail Trade | 318 (65.7%) | 166 (34.3%) |
| Transportation & Warehousing | 63 (27.6%) | 165 (72.4%) |
| Utilities | 3 (21.4%) | 11 (78.6%) |
| Information | 36 (78.3%) | 10 (21.7%) |
| Finance & Insurance | 74 (71.2%) | 30 (28.8%) |
| Real Estate, Rental & Leasing | 37 (26.1%) | 105 (73.9%) |
| Professional & Scientific | 509 (90.1%) | 56 (9.9%) |
| Enterprise Management | 0 (0.0%) | 0 (0.0%) |
| Administrative & Support | 59 (72.0%) | 23 (28.1%) |
| Educational Services | 80 (36.9%) | 137 (63.1%) |
| Health Care & Social Assistance | 26 (4.7%) | 532 (95.3%) |
| Arts, Entertainment & Recreation | 20 (27.0%) | 54 (73.0%) |
| Accommodation & Food Services | 201 (64.8%) | 109 (35.2%) |
| Public Administration | 0 (0.0%) | 28 (100.0%) |
| Total | 1,860 (53.2%) | 1,635 (46.8%) |
Education in Hickory Creek
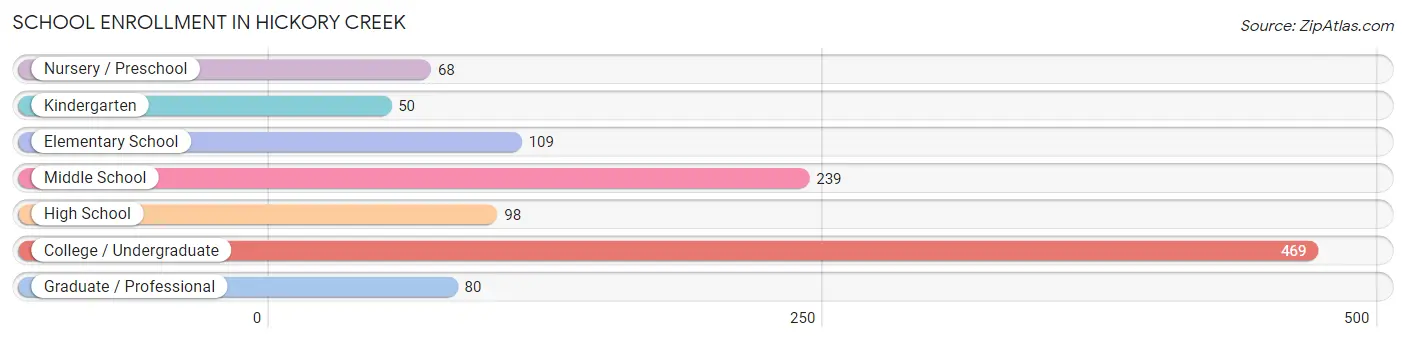
School Enrollment in Hickory Creek
The most common levels of schooling among the 1,113 students in Hickory Creek are college / undergraduate (469 | 42.1%), middle school (239 | 21.5%), and elementary school (109 | 9.8%).
| School Level | # Students | % Students |
| Nursery / Preschool | 68 | 6.1% |
| Kindergarten | 50 | 4.5% |
| Elementary School | 109 | 9.8% |
| Middle School | 239 | 21.5% |
| High School | 98 | 8.8% |
| College / Undergraduate | 469 | 42.1% |
| Graduate / Professional | 80 | 7.2% |
| Total | 1,113 | 100.0% |
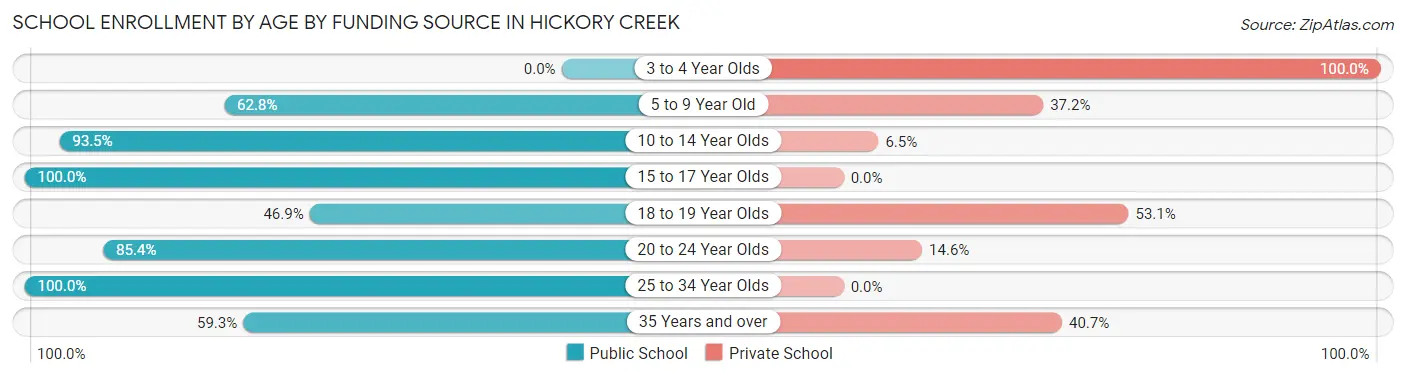
School Enrollment by Age by Funding Source in Hickory Creek
Out of a total of 1,113 students who are enrolled in schools in Hickory Creek, 236 (21.2%) attend a private institution, while the remaining 877 (78.8%) are enrolled in public schools. The age group of 3 to 4 year olds has the highest likelihood of being enrolled in private schools, with 36 (100.0% in the age bracket) enrolled. Conversely, the age group of 15 to 17 year olds has the lowest likelihood of being enrolled in a private school, with 64 (100.0% in the age bracket) attending a public institution.
| Age Bracket | Public School | Private School |
| 3 to 4 Year Olds | 0 (0.0%) | 36 (100.0%) |
| 5 to 9 Year Old | 120 (62.8%) | 71 (37.2%) |
| 10 to 14 Year Olds | 231 (93.5%) | 16 (6.5%) |
| 15 to 17 Year Olds | 64 (100.0%) | 0 (0.0%) |
| 18 to 19 Year Olds | 23 (46.9%) | 26 (53.1%) |
| 20 to 24 Year Olds | 368 (85.4%) | 63 (14.6%) |
| 25 to 34 Year Olds | 36 (100.0%) | 0 (0.0%) |
| 35 Years and over | 35 (59.3%) | 24 (40.7%) |
| Total | 877 (78.8%) | 236 (21.2%) |
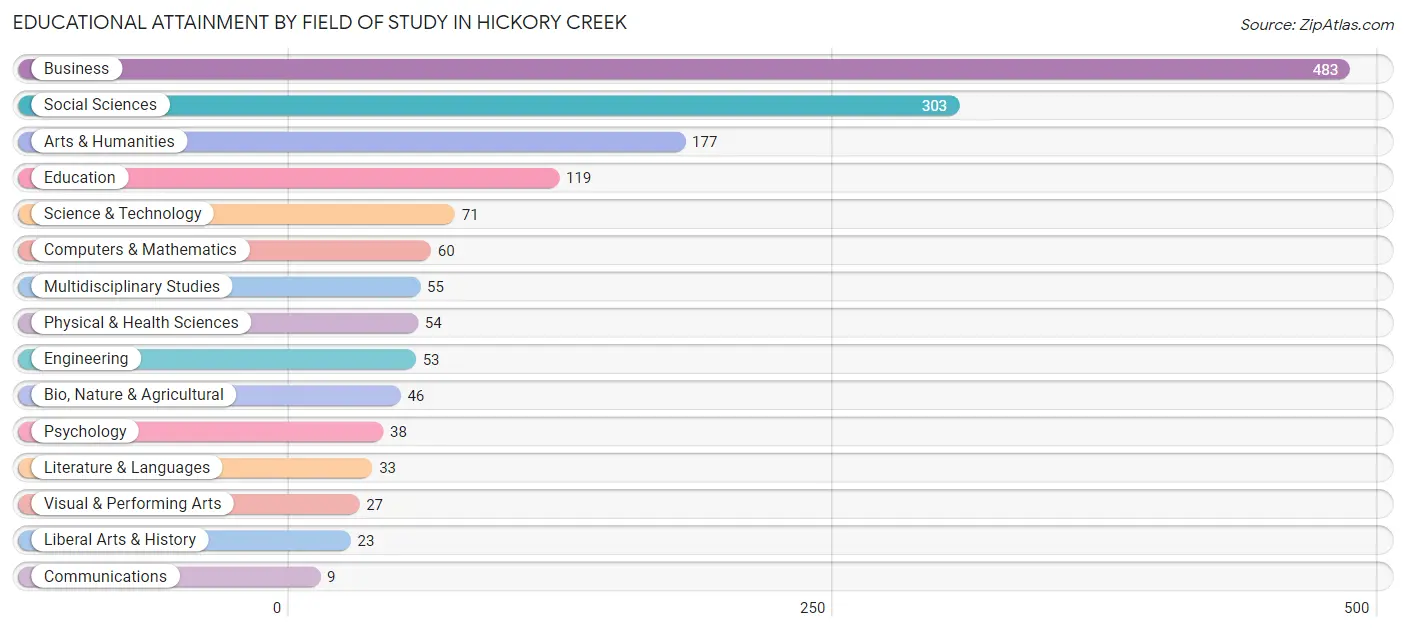
Educational Attainment by Field of Study in Hickory Creek
Business (483 | 31.1%), social sciences (303 | 19.5%), arts & humanities (177 | 11.4%), education (119 | 7.7%), and science & technology (71 | 4.6%) are the most common fields of study among 1,551 individuals in Hickory Creek who have obtained a bachelor's degree or higher.
| Field of Study | # Graduates | % Graduates |
| Computers & Mathematics | 60 | 3.9% |
| Bio, Nature & Agricultural | 46 | 3.0% |
| Physical & Health Sciences | 54 | 3.5% |
| Psychology | 38 | 2.5% |
| Social Sciences | 303 | 19.5% |
| Engineering | 53 | 3.4% |
| Multidisciplinary Studies | 55 | 3.5% |
| Science & Technology | 71 | 4.6% |
| Business | 483 | 31.1% |
| Education | 119 | 7.7% |
| Literature & Languages | 33 | 2.1% |
| Liberal Arts & History | 23 | 1.5% |
| Visual & Performing Arts | 27 | 1.7% |
| Communications | 9 | 0.6% |
| Arts & Humanities | 177 | 11.4% |
| Total | 1,551 | 100.0% |
Transportation & Commute in Hickory Creek
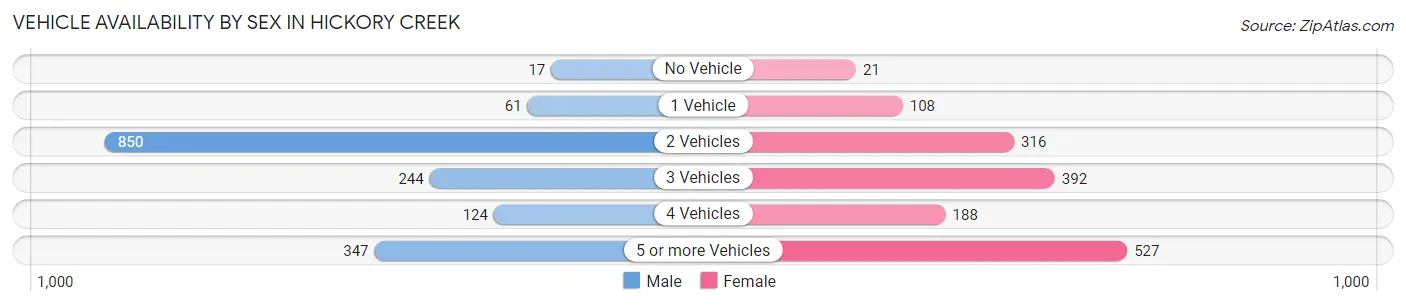
Vehicle Availability by Sex in Hickory Creek
The most prevalent vehicle ownership categories in Hickory Creek are males with 2 vehicles (850, accounting for 51.7%) and females with 2 vehicles (316, making up 54.8%).
| Vehicles Available | Male | Female |
| No Vehicle | 17 (1.0%) | 21 (1.3%) |
| 1 Vehicle | 61 (3.7%) | 108 (7.0%) |
| 2 Vehicles | 850 (51.7%) | 316 (20.4%) |
| 3 Vehicles | 244 (14.8%) | 392 (25.3%) |
| 4 Vehicles | 124 (7.5%) | 188 (12.1%) |
| 5 or more Vehicles | 347 (21.1%) | 527 (34.0%) |
| Total | 1,643 (100.0%) | 1,552 (100.0%) |
Commute Time in Hickory Creek
The most frequently occuring commute durations in Hickory Creek are 20 to 24 minutes (483 commuters, 17.2%), 45 to 59 minutes (430 commuters, 15.3%), and 30 to 34 minutes (417 commuters, 14.9%).
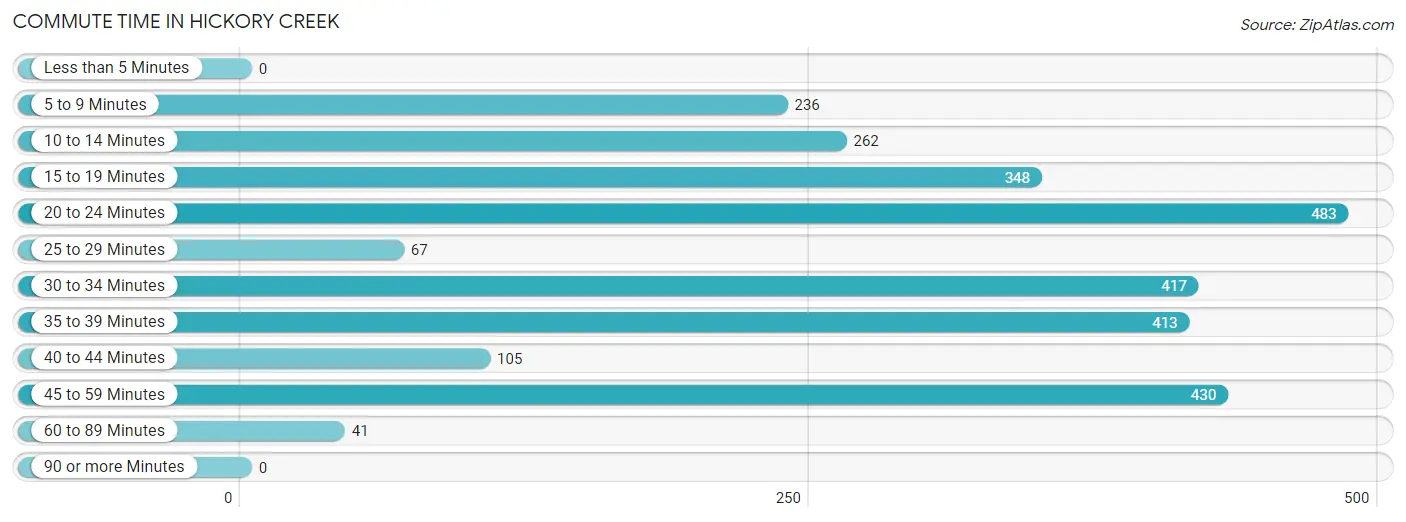
| Commute Time | # Commuters | % Commuters |
| Less than 5 Minutes | 0 | 0.0% |
| 5 to 9 Minutes | 236 | 8.4% |
| 10 to 14 Minutes | 262 | 9.3% |
| 15 to 19 Minutes | 348 | 12.4% |
| 20 to 24 Minutes | 483 | 17.2% |
| 25 to 29 Minutes | 67 | 2.4% |
| 30 to 34 Minutes | 417 | 14.9% |
| 35 to 39 Minutes | 413 | 14.7% |
| 40 to 44 Minutes | 105 | 3.7% |
| 45 to 59 Minutes | 430 | 15.3% |
| 60 to 89 Minutes | 41 | 1.5% |
| 90 or more Minutes | 0 | 0.0% |
Commute Time by Sex in Hickory Creek
The most common commute times in Hickory Creek are 45 to 59 minutes (345 commuters, 22.7%) for males and 35 to 39 minutes (324 commuters, 25.3%) for females.
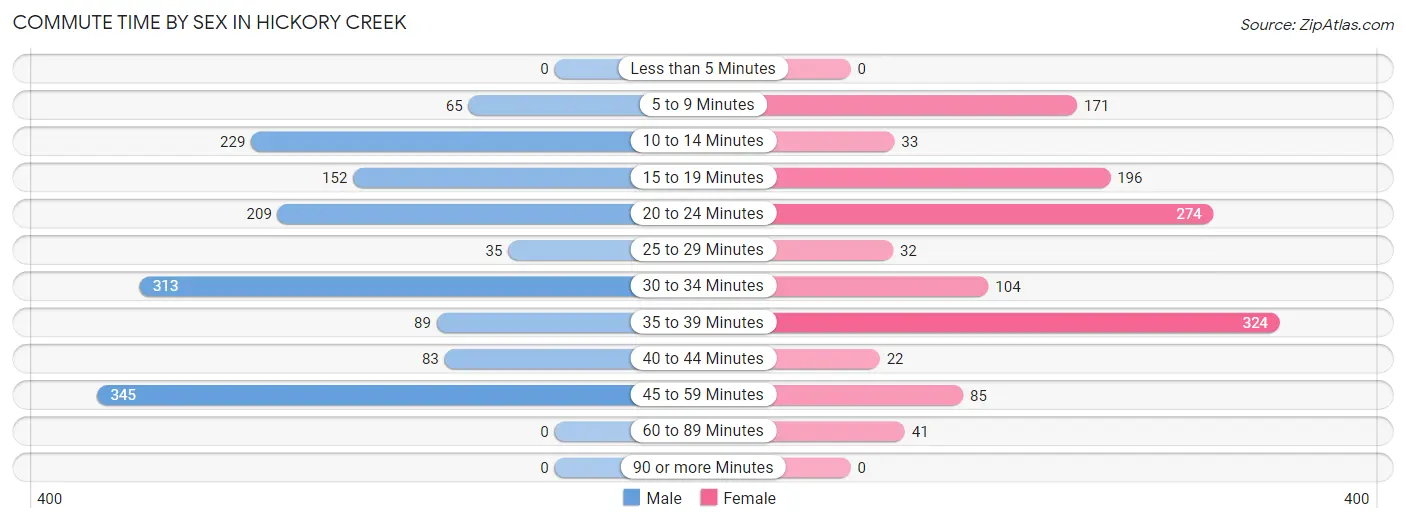
| Commute Time | Male | Female |
| Less than 5 Minutes | 0 (0.0%) | 0 (0.0%) |
| 5 to 9 Minutes | 65 (4.3%) | 171 (13.3%) |
| 10 to 14 Minutes | 229 (15.1%) | 33 (2.6%) |
| 15 to 19 Minutes | 152 (10.0%) | 196 (15.3%) |
| 20 to 24 Minutes | 209 (13.8%) | 274 (21.4%) |
| 25 to 29 Minutes | 35 (2.3%) | 32 (2.5%) |
| 30 to 34 Minutes | 313 (20.6%) | 104 (8.1%) |
| 35 to 39 Minutes | 89 (5.9%) | 324 (25.3%) |
| 40 to 44 Minutes | 83 (5.5%) | 22 (1.7%) |
| 45 to 59 Minutes | 345 (22.7%) | 85 (6.6%) |
| 60 to 89 Minutes | 0 (0.0%) | 41 (3.2%) |
| 90 or more Minutes | 0 (0.0%) | 0 (0.0%) |
Time of Departure to Work by Sex in Hickory Creek
The most frequent times of departure to work in Hickory Creek are 8:00 AM to 8:29 AM (370, 24.3%) for males and 7:00 AM to 7:29 AM (387, 30.2%) for females.
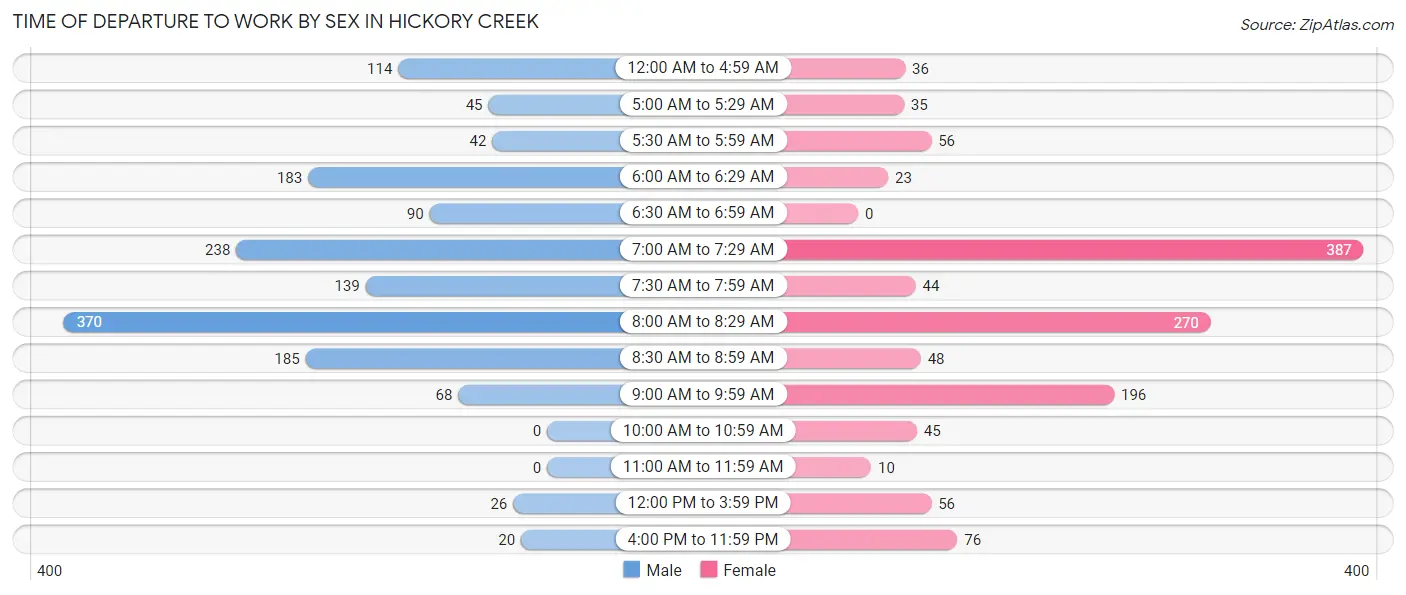
| Time of Departure | Male | Female |
| 12:00 AM to 4:59 AM | 114 (7.5%) | 36 (2.8%) |
| 5:00 AM to 5:29 AM | 45 (3.0%) | 35 (2.7%) |
| 5:30 AM to 5:59 AM | 42 (2.8%) | 56 (4.4%) |
| 6:00 AM to 6:29 AM | 183 (12.0%) | 23 (1.8%) |
| 6:30 AM to 6:59 AM | 90 (5.9%) | 0 (0.0%) |
| 7:00 AM to 7:29 AM | 238 (15.7%) | 387 (30.2%) |
| 7:30 AM to 7:59 AM | 139 (9.1%) | 44 (3.4%) |
| 8:00 AM to 8:29 AM | 370 (24.3%) | 270 (21.1%) |
| 8:30 AM to 8:59 AM | 185 (12.2%) | 48 (3.7%) |
| 9:00 AM to 9:59 AM | 68 (4.5%) | 196 (15.3%) |
| 10:00 AM to 10:59 AM | 0 (0.0%) | 45 (3.5%) |
| 11:00 AM to 11:59 AM | 0 (0.0%) | 10 (0.8%) |
| 12:00 PM to 3:59 PM | 26 (1.7%) | 56 (4.4%) |
| 4:00 PM to 11:59 PM | 20 (1.3%) | 76 (5.9%) |
| Total | 1,520 (100.0%) | 1,282 (100.0%) |
Housing Occupancy in Hickory Creek
Occupancy by Ownership in Hickory Creek
Of the total 1,656 dwellings in Hickory Creek, owner-occupied units account for 1,250 (75.5%), while renter-occupied units make up 406 (24.5%).
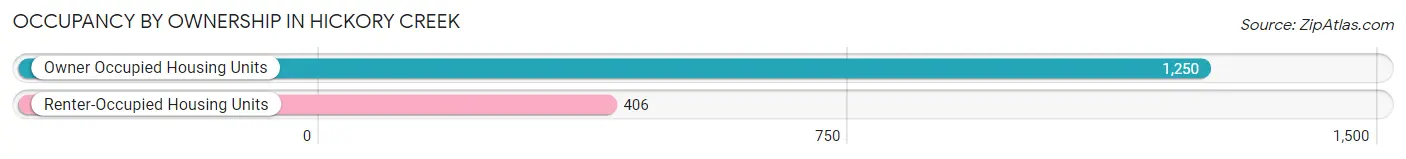
| Occupancy | # Housing Units | % Housing Units |
| Owner Occupied Housing Units | 1,250 | 75.5% |
| Renter-Occupied Housing Units | 406 | 24.5% |
| Total Occupied Housing Units | 1,656 | 100.0% |
Occupancy by Household Size in Hickory Creek
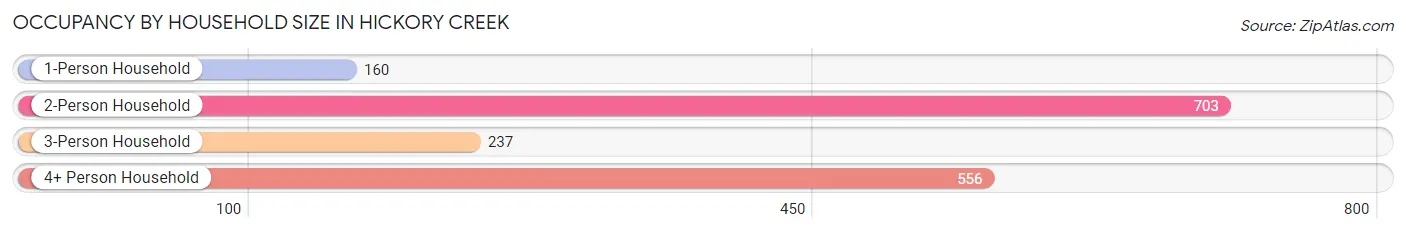
| Household Size | # Housing Units | % Housing Units |
| 1-Person Household | 160 | 9.7% |
| 2-Person Household | 703 | 42.4% |
| 3-Person Household | 237 | 14.3% |
| 4+ Person Household | 556 | 33.6% |
| Total Housing Units | 1,656 | 100.0% |
Occupancy by Ownership by Household Size in Hickory Creek
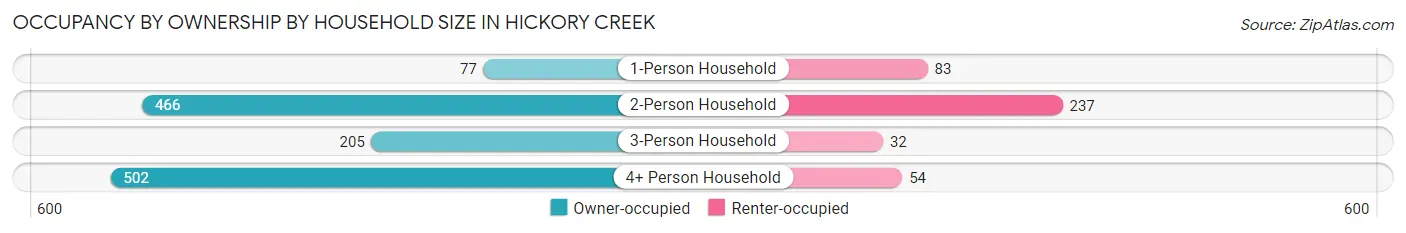
| Household Size | Owner-occupied | Renter-occupied |
| 1-Person Household | 77 (48.1%) | 83 (51.9%) |
| 2-Person Household | 466 (66.3%) | 237 (33.7%) |
| 3-Person Household | 205 (86.5%) | 32 (13.5%) |
| 4+ Person Household | 502 (90.3%) | 54 (9.7%) |
| Total Housing Units | 1,250 (75.5%) | 406 (24.5%) |
Occupancy by Educational Attainment in Hickory Creek
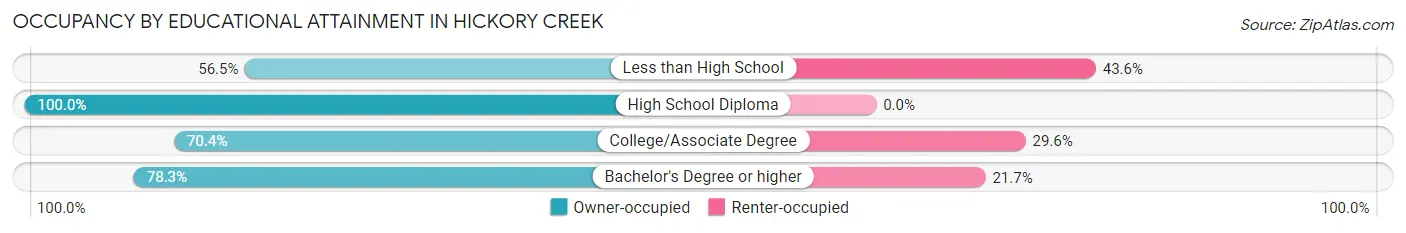
| Household Size | Owner-occupied | Renter-occupied |
| Less than High School | 35 (56.5%) | 27 (43.5%) |
| High School Diploma | 89 (100.0%) | 0 (0.0%) |
| College/Associate Degree | 468 (70.4%) | 197 (29.6%) |
| Bachelor's Degree or higher | 658 (78.3%) | 182 (21.7%) |
Occupancy by Age of Householder in Hickory Creek
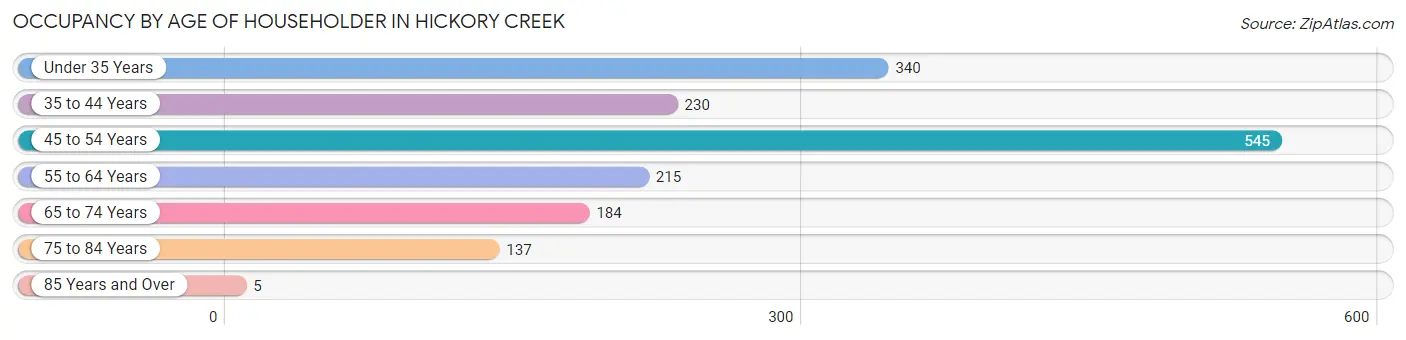
| Age Bracket | # Households | % Households |
| Under 35 Years | 340 | 20.5% |
| 35 to 44 Years | 230 | 13.9% |
| 45 to 54 Years | 545 | 32.9% |
| 55 to 64 Years | 215 | 13.0% |
| 65 to 74 Years | 184 | 11.1% |
| 75 to 84 Years | 137 | 8.3% |
| 85 Years and Over | 5 | 0.3% |
| Total | 1,656 | 100.0% |
Housing Finances in Hickory Creek
Median Income by Occupancy in Hickory Creek
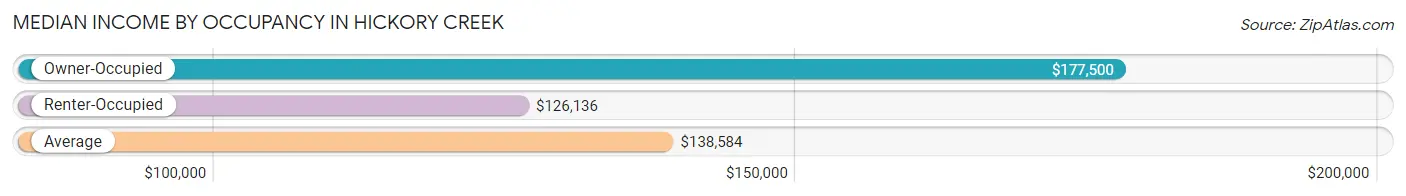
| Occupancy Type | # Households | Median Income |
| Owner-Occupied | 1,250 (75.5%) | $177,500 |
| Renter-Occupied | 406 (24.5%) | $126,136 |
| Average | 1,656 (100.0%) | $138,584 |
Occupancy by Householder Income Bracket in Hickory Creek
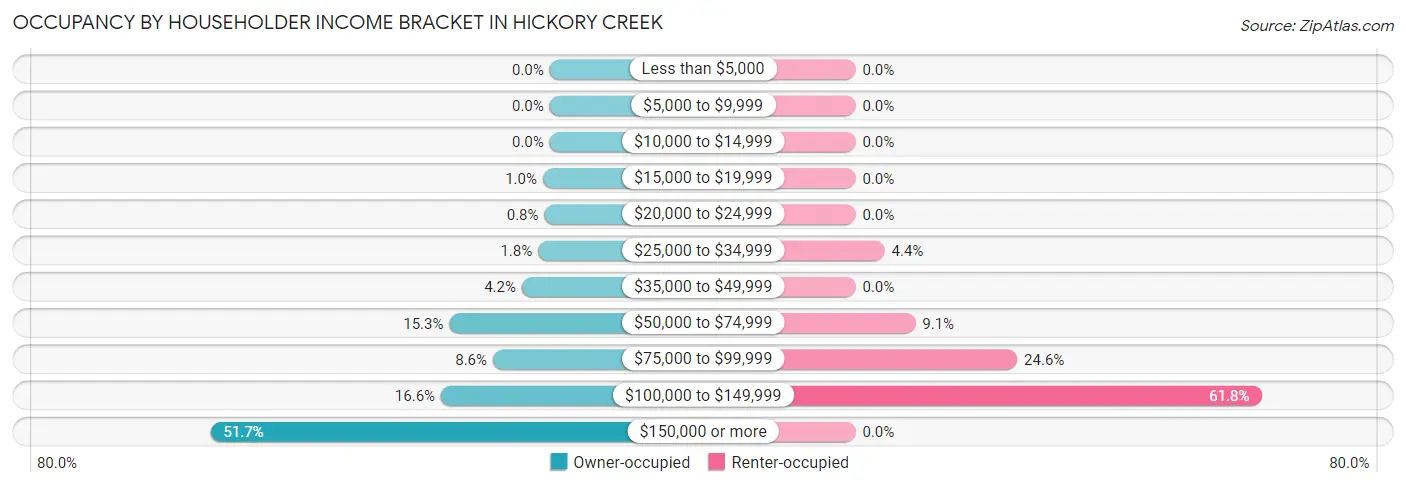
| Income Bracket | Owner-occupied | Renter-occupied |
| Less than $5,000 | 0 (0.0%) | 0 (0.0%) |
| $5,000 to $9,999 | 0 (0.0%) | 0 (0.0%) |
| $10,000 to $14,999 | 0 (0.0%) | 0 (0.0%) |
| $15,000 to $19,999 | 13 (1.0%) | 0 (0.0%) |
| $20,000 to $24,999 | 10 (0.8%) | 0 (0.0%) |
| $25,000 to $34,999 | 22 (1.8%) | 18 (4.4%) |
| $35,000 to $49,999 | 53 (4.2%) | 0 (0.0%) |
| $50,000 to $74,999 | 191 (15.3%) | 37 (9.1%) |
| $75,000 to $99,999 | 108 (8.6%) | 100 (24.6%) |
| $100,000 to $149,999 | 207 (16.6%) | 251 (61.8%) |
| $150,000 or more | 646 (51.7%) | 0 (0.0%) |
| Total | 1,250 (100.0%) | 406 (100.0%) |
Monthly Housing Cost Tiers in Hickory Creek
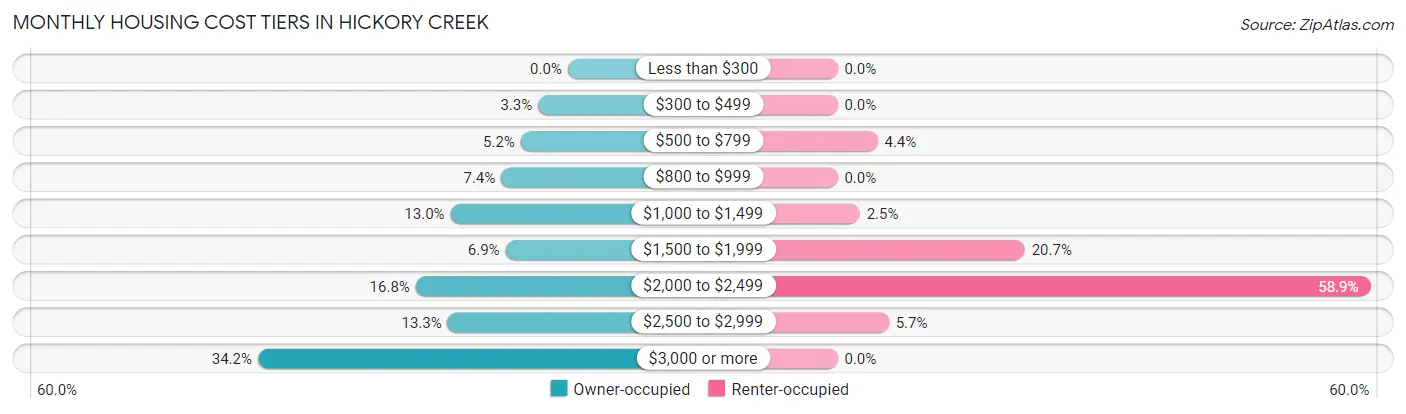
| Monthly Cost | Owner-occupied | Renter-occupied |
| Less than $300 | 0 (0.0%) | 0 (0.0%) |
| $300 to $499 | 41 (3.3%) | 0 (0.0%) |
| $500 to $799 | 65 (5.2%) | 18 (4.4%) |
| $800 to $999 | 92 (7.4%) | 0 (0.0%) |
| $1,000 to $1,499 | 162 (13.0%) | 10 (2.5%) |
| $1,500 to $1,999 | 86 (6.9%) | 84 (20.7%) |
| $2,000 to $2,499 | 210 (16.8%) | 239 (58.9%) |
| $2,500 to $2,999 | 166 (13.3%) | 23 (5.7%) |
| $3,000 or more | 428 (34.2%) | 0 (0.0%) |
| Total | 1,250 (100.0%) | 406 (100.0%) |
Physical Housing Characteristics in Hickory Creek
Housing Structures in Hickory Creek
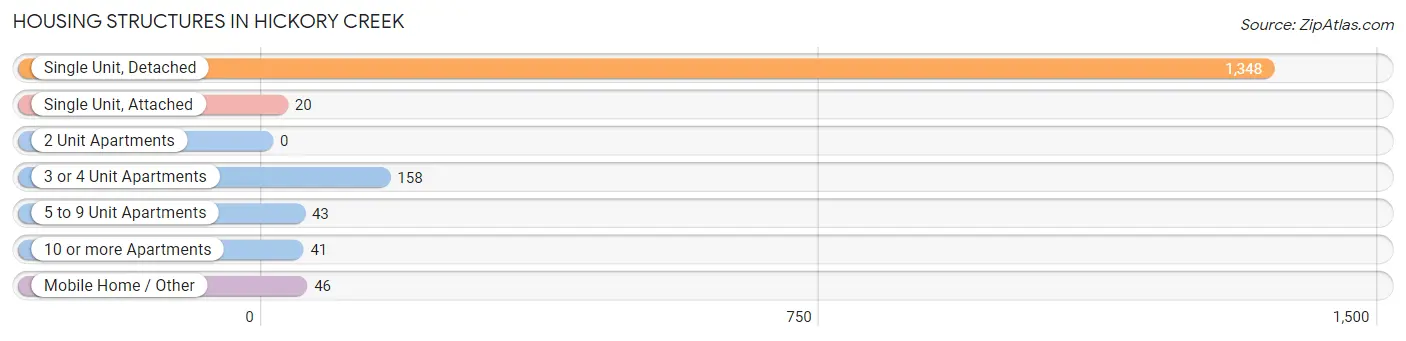
| Structure Type | # Housing Units | % Housing Units |
| Single Unit, Detached | 1,348 | 81.4% |
| Single Unit, Attached | 20 | 1.2% |
| 2 Unit Apartments | 0 | 0.0% |
| 3 or 4 Unit Apartments | 158 | 9.5% |
| 5 to 9 Unit Apartments | 43 | 2.6% |
| 10 or more Apartments | 41 | 2.5% |
| Mobile Home / Other | 46 | 2.8% |
| Total | 1,656 | 100.0% |
Housing Structures by Occupancy in Hickory Creek
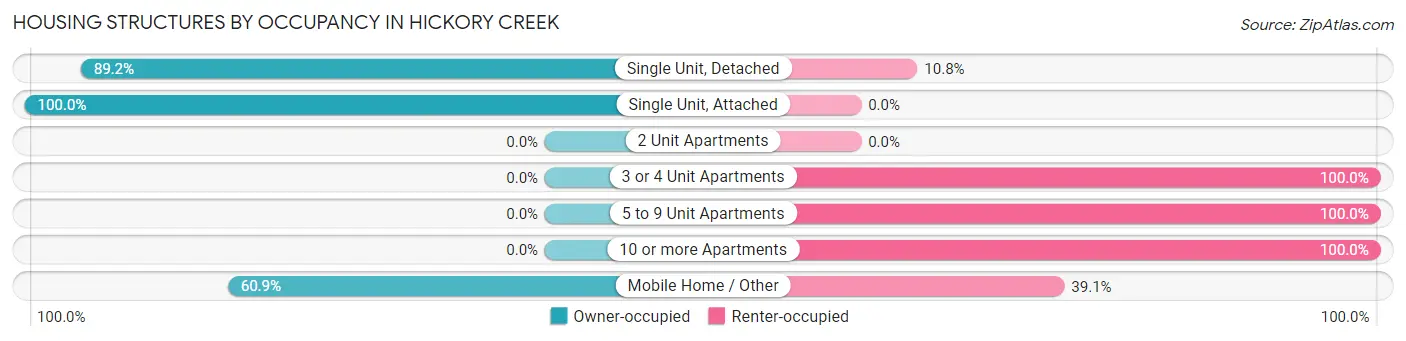
| Structure Type | Owner-occupied | Renter-occupied |
| Single Unit, Detached | 1,202 (89.2%) | 146 (10.8%) |
| Single Unit, Attached | 20 (100.0%) | 0 (0.0%) |
| 2 Unit Apartments | 0 (0.0%) | 0 (0.0%) |
| 3 or 4 Unit Apartments | 0 (0.0%) | 158 (100.0%) |
| 5 to 9 Unit Apartments | 0 (0.0%) | 43 (100.0%) |
| 10 or more Apartments | 0 (0.0%) | 41 (100.0%) |
| Mobile Home / Other | 28 (60.9%) | 18 (39.1%) |
| Total | 1,250 (75.5%) | 406 (24.5%) |
Housing Structures by Number of Rooms in Hickory Creek
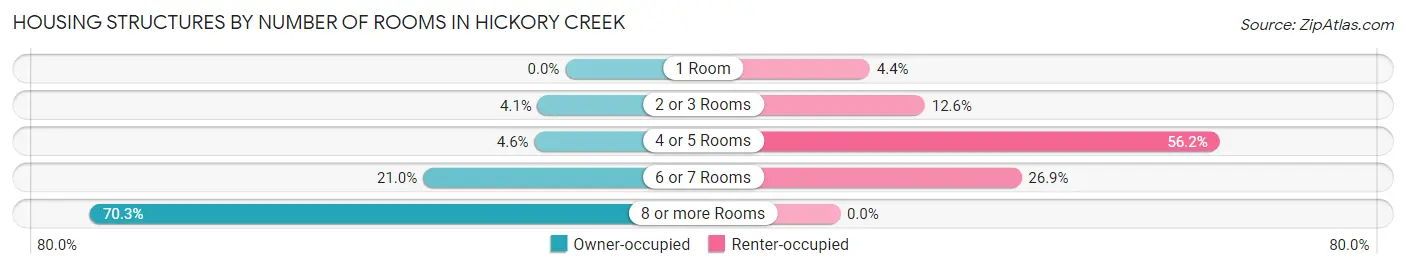
| Number of Rooms | Owner-occupied | Renter-occupied |
| 1 Room | 0 (0.0%) | 18 (4.4%) |
| 2 or 3 Rooms | 51 (4.1%) | 51 (12.6%) |
| 4 or 5 Rooms | 57 (4.6%) | 228 (56.2%) |
| 6 or 7 Rooms | 263 (21.0%) | 109 (26.9%) |
| 8 or more Rooms | 879 (70.3%) | 0 (0.0%) |
| Total | 1,250 (100.0%) | 406 (100.0%) |
Housing Structure by Heating Type in Hickory Creek
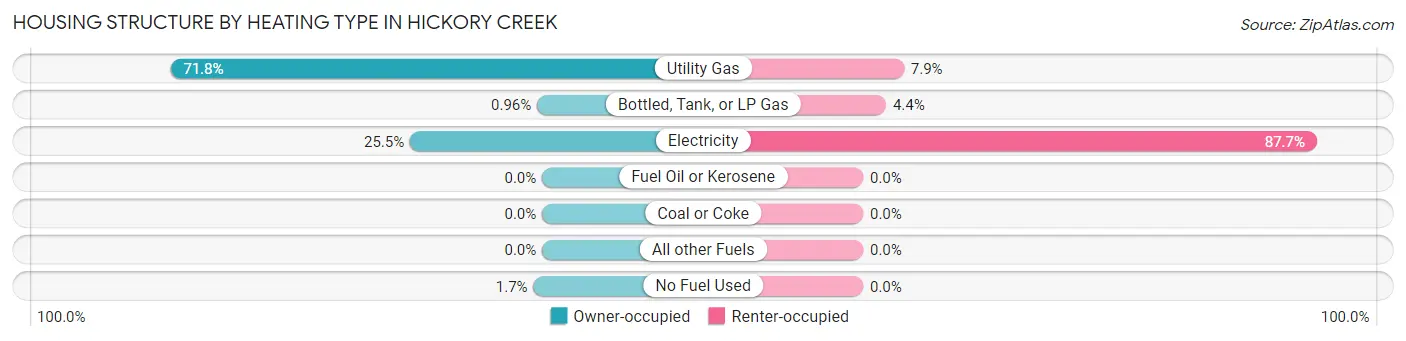
| Heating Type | Owner-occupied | Renter-occupied |
| Utility Gas | 898 (71.8%) | 32 (7.9%) |
| Bottled, Tank, or LP Gas | 12 (1.0%) | 18 (4.4%) |
| Electricity | 319 (25.5%) | 356 (87.7%) |
| Fuel Oil or Kerosene | 0 (0.0%) | 0 (0.0%) |
| Coal or Coke | 0 (0.0%) | 0 (0.0%) |
| All other Fuels | 0 (0.0%) | 0 (0.0%) |
| No Fuel Used | 21 (1.7%) | 0 (0.0%) |
| Total | 1,250 (100.0%) | 406 (100.0%) |
Household Vehicle Usage in Hickory Creek
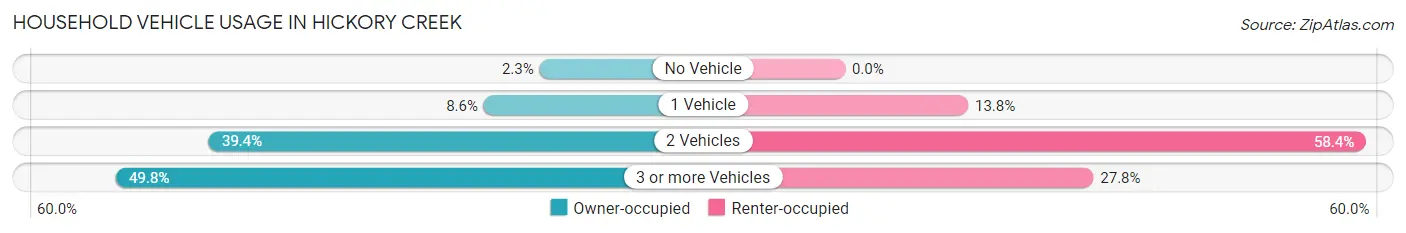
| Vehicles per Household | Owner-occupied | Renter-occupied |
| No Vehicle | 29 (2.3%) | 0 (0.0%) |
| 1 Vehicle | 107 (8.6%) | 56 (13.8%) |
| 2 Vehicles | 492 (39.4%) | 237 (58.4%) |
| 3 or more Vehicles | 622 (49.8%) | 113 (27.8%) |
| Total | 1,250 (100.0%) | 406 (100.0%) |
Real Estate & Mortgages in Hickory Creek
Real Estate and Mortgage Overview in Hickory Creek
| Characteristic | Without Mortgage | With Mortgage |
| Housing Units | 302 | 948 |
| Median Property Value | $337,500 | $472,900 |
| Median Household Income | $105,500 | $532 |
| Monthly Housing Costs | $979 | $428 |
| Real Estate Taxes | $5,820 | $91 |
Property Value by Mortgage Status in Hickory Creek
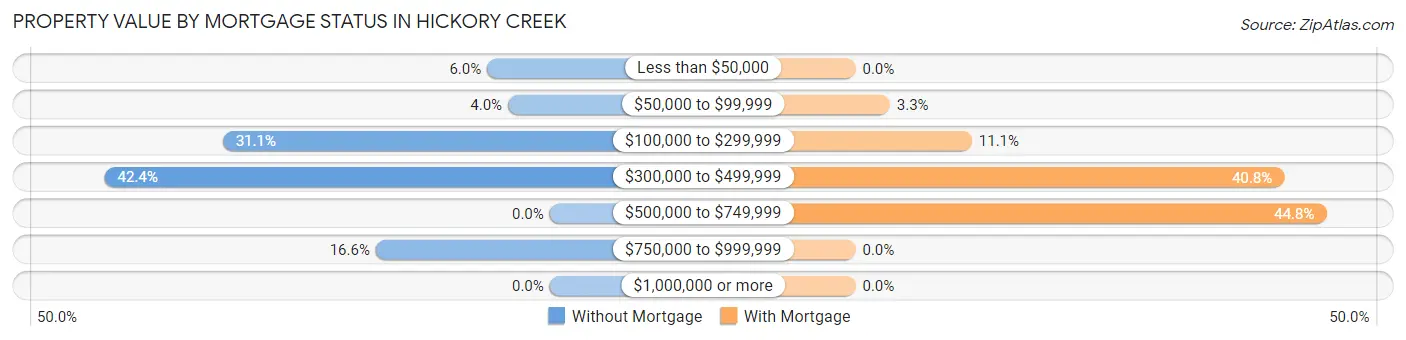
| Property Value | Without Mortgage | With Mortgage |
| Less than $50,000 | 18 (6.0%) | 0 (0.0%) |
| $50,000 to $99,999 | 12 (4.0%) | 31 (3.3%) |
| $100,000 to $299,999 | 94 (31.1%) | 105 (11.1%) |
| $300,000 to $499,999 | 128 (42.4%) | 387 (40.8%) |
| $500,000 to $749,999 | 0 (0.0%) | 425 (44.8%) |
| $750,000 to $999,999 | 50 (16.6%) | 0 (0.0%) |
| $1,000,000 or more | 0 (0.0%) | 0 (0.0%) |
| Total | 302 (100.0%) | 948 (100.0%) |
Household Income by Mortgage Status in Hickory Creek
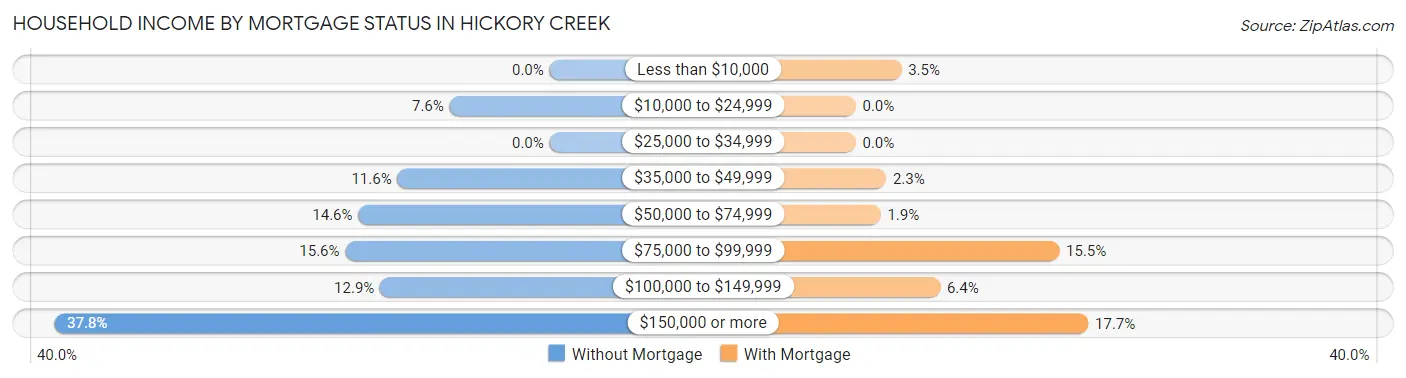
| Household Income | Without Mortgage | With Mortgage |
| Less than $10,000 | 0 (0.0%) | 33 (3.5%) |
| $10,000 to $24,999 | 23 (7.6%) | 0 (0.0%) |
| $25,000 to $34,999 | 0 (0.0%) | 0 (0.0%) |
| $35,000 to $49,999 | 35 (11.6%) | 22 (2.3%) |
| $50,000 to $74,999 | 44 (14.6%) | 18 (1.9%) |
| $75,000 to $99,999 | 47 (15.6%) | 147 (15.5%) |
| $100,000 to $149,999 | 39 (12.9%) | 61 (6.4%) |
| $150,000 or more | 114 (37.8%) | 168 (17.7%) |
| Total | 302 (100.0%) | 948 (100.0%) |
Property Value to Household Income Ratio in Hickory Creek
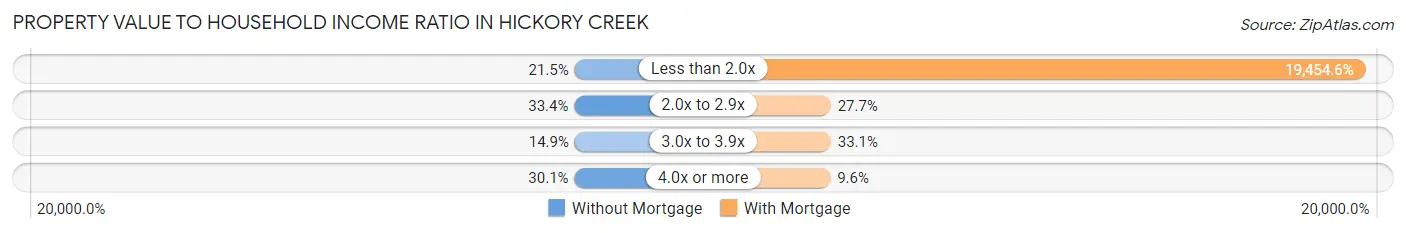
| Value-to-Income Ratio | Without Mortgage | With Mortgage |
| Less than 2.0x | 65 (21.5%) | 184,430 (19,454.6%) |
| 2.0x to 2.9x | 101 (33.4%) | 263 (27.7%) |
| 3.0x to 3.9x | 45 (14.9%) | 314 (33.1%) |
| 4.0x or more | 91 (30.1%) | 91 (9.6%) |
| Total | 302 (100.0%) | 948 (100.0%) |
Real Estate Taxes by Mortgage Status in Hickory Creek
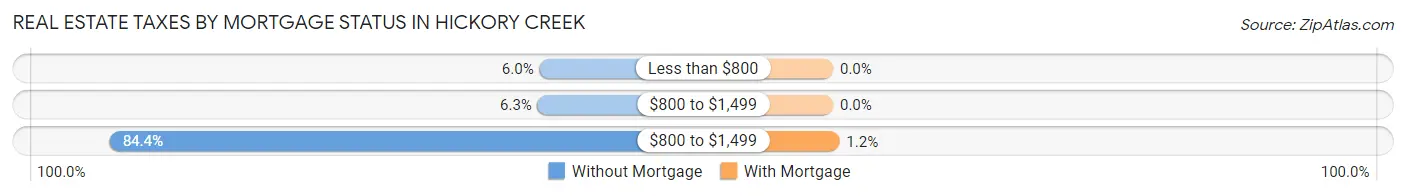
| Property Taxes | Without Mortgage | With Mortgage |
| Less than $800 | 18 (6.0%) | 0 (0.0%) |
| $800 to $1,499 | 19 (6.3%) | 0 (0.0%) |
| $800 to $1,499 | 255 (84.4%) | 11 (1.2%) |
| Total | 302 (100.0%) | 948 (100.0%) |
Health & Disability in Hickory Creek
Health Insurance Coverage by Age in Hickory Creek
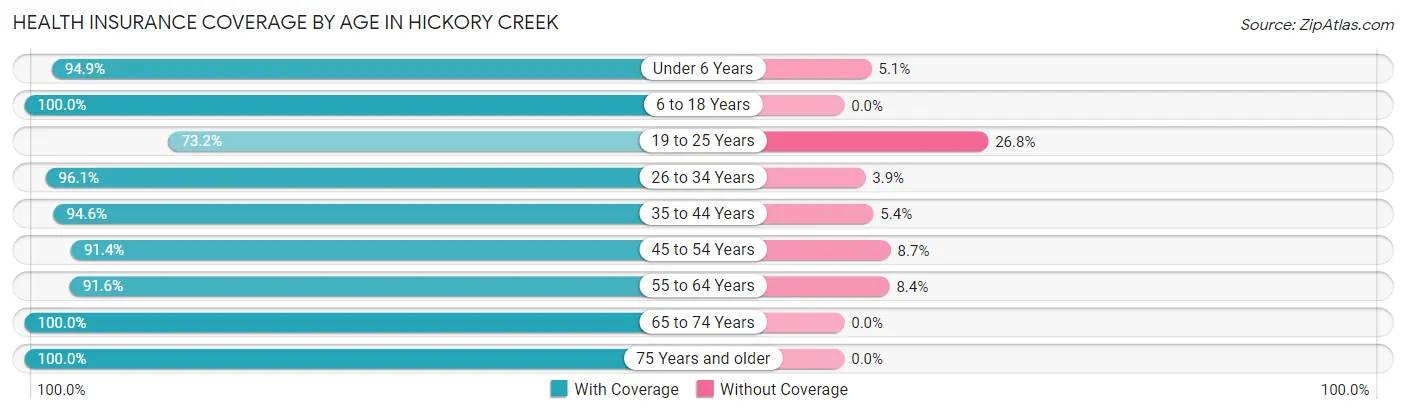
| Age Bracket | With Coverage | Without Coverage |
| Under 6 Years | 336 (94.9%) | 18 (5.1%) |
| 6 to 18 Years | 420 (100.0%) | 0 (0.0%) |
| 19 to 25 Years | 725 (73.2%) | 266 (26.8%) |
| 26 to 34 Years | 464 (96.1%) | 19 (3.9%) |
| 35 to 44 Years | 435 (94.6%) | 25 (5.4%) |
| 45 to 54 Years | 1,088 (91.3%) | 103 (8.6%) |
| 55 to 64 Years | 489 (91.6%) | 45 (8.4%) |
| 65 to 74 Years | 297 (100.0%) | 0 (0.0%) |
| 75 Years and older | 176 (100.0%) | 0 (0.0%) |
| Total | 4,430 (90.3%) | 476 (9.7%) |
Health Insurance Coverage by Citizenship Status in Hickory Creek
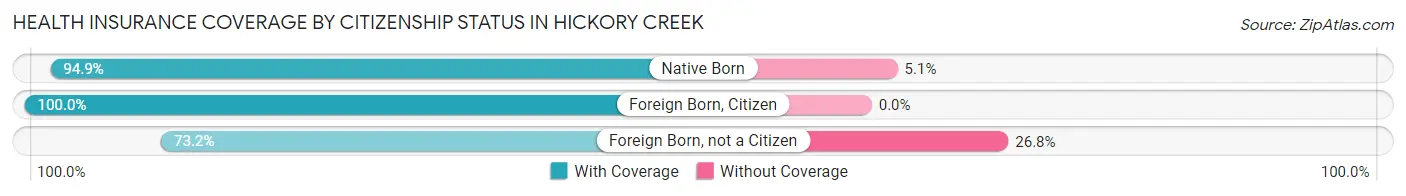
| Citizenship Status | With Coverage | Without Coverage |
| Native Born | 336 (94.9%) | 18 (5.1%) |
| Foreign Born, Citizen | 420 (100.0%) | 0 (0.0%) |
| Foreign Born, not a Citizen | 725 (73.2%) | 266 (26.8%) |
Health Insurance Coverage by Household Income in Hickory Creek
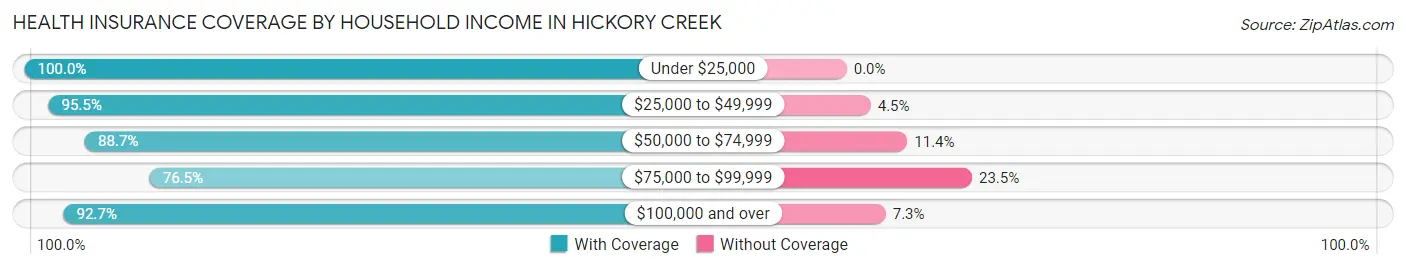
| Household Income | With Coverage | Without Coverage |
| Under $25,000 | 23 (100.0%) | 0 (0.0%) |
| $25,000 to $49,999 | 149 (95.5%) | 7 (4.5%) |
| $50,000 to $74,999 | 445 (88.6%) | 57 (11.4%) |
| $75,000 to $99,999 | 489 (76.5%) | 150 (23.5%) |
| $100,000 and over | 3,324 (92.7%) | 262 (7.3%) |
Public vs Private Health Insurance Coverage by Age in Hickory Creek
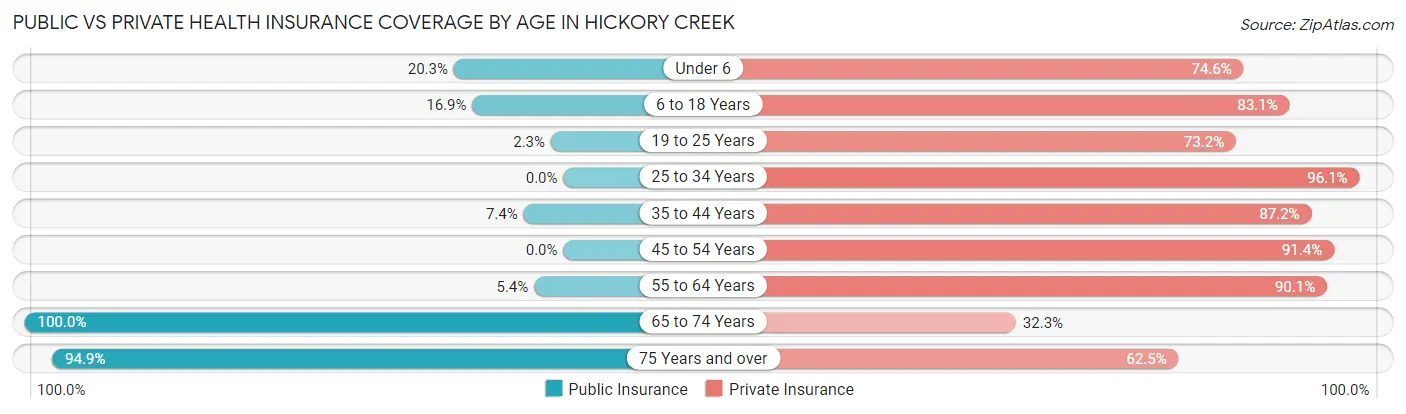
| Age Bracket | Public Insurance | Private Insurance |
| Under 6 | 72 (20.3%) | 264 (74.6%) |
| 6 to 18 Years | 71 (16.9%) | 349 (83.1%) |
| 19 to 25 Years | 23 (2.3%) | 725 (73.2%) |
| 25 to 34 Years | 0 (0.0%) | 464 (96.1%) |
| 35 to 44 Years | 34 (7.4%) | 401 (87.2%) |
| 45 to 54 Years | 0 (0.0%) | 1,088 (91.3%) |
| 55 to 64 Years | 29 (5.4%) | 481 (90.1%) |
| 65 to 74 Years | 297 (100.0%) | 96 (32.3%) |
| 75 Years and over | 167 (94.9%) | 110 (62.5%) |
| Total | 693 (14.1%) | 3,978 (81.1%) |
Disability Status by Sex by Age in Hickory Creek
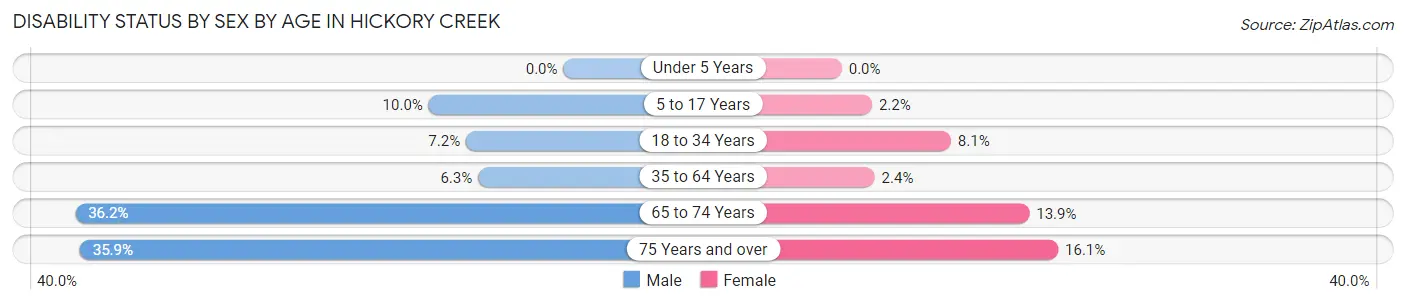
| Age Bracket | Male | Female |
| Under 5 Years | 0 (0.0%) | 0 (0.0%) |
| 5 to 17 Years | 19 (10.0%) | 7 (2.2%) |
| 18 to 34 Years | 62 (7.2%) | 50 (8.1%) |
| 35 to 64 Years | 71 (6.3%) | 26 (2.4%) |
| 65 to 74 Years | 79 (36.2%) | 11 (13.9%) |
| 75 Years and over | 14 (35.9%) | 22 (16.1%) |
Disability Class by Sex by Age in Hickory Creek
Disability Class: Hearing Difficulty
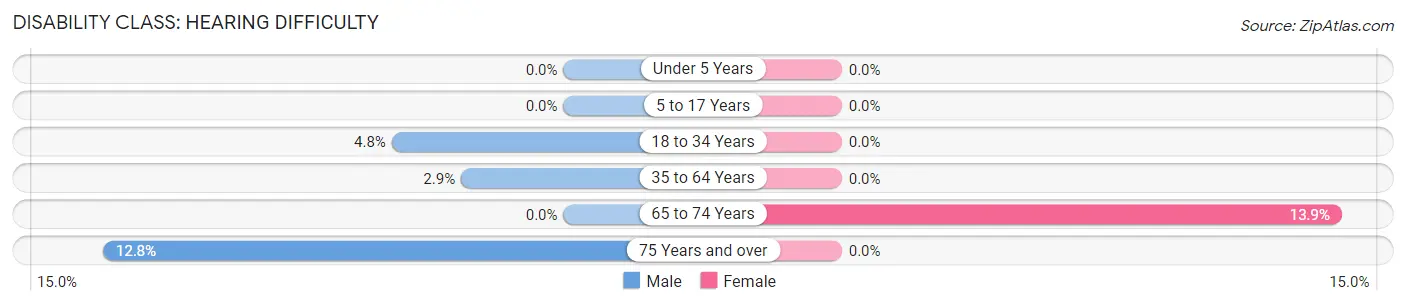
| Age Bracket | Male | Female |
| Under 5 Years | 0 (0.0%) | 0 (0.0%) |
| 5 to 17 Years | 0 (0.0%) | 0 (0.0%) |
| 18 to 34 Years | 41 (4.8%) | 0 (0.0%) |
| 35 to 64 Years | 32 (2.9%) | 0 (0.0%) |
| 65 to 74 Years | 0 (0.0%) | 11 (13.9%) |
| 75 Years and over | 5 (12.8%) | 0 (0.0%) |
Disability Class: Vision Difficulty
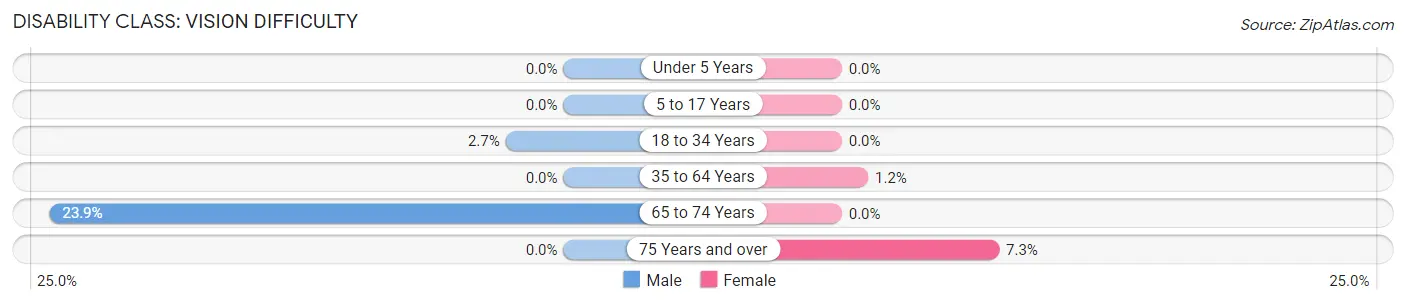
| Age Bracket | Male | Female |
| Under 5 Years | 0 (0.0%) | 0 (0.0%) |
| 5 to 17 Years | 0 (0.0%) | 0 (0.0%) |
| 18 to 34 Years | 23 (2.7%) | 0 (0.0%) |
| 35 to 64 Years | 0 (0.0%) | 13 (1.2%) |
| 65 to 74 Years | 52 (23.8%) | 0 (0.0%) |
| 75 Years and over | 0 (0.0%) | 10 (7.3%) |
Disability Class: Cognitive Difficulty
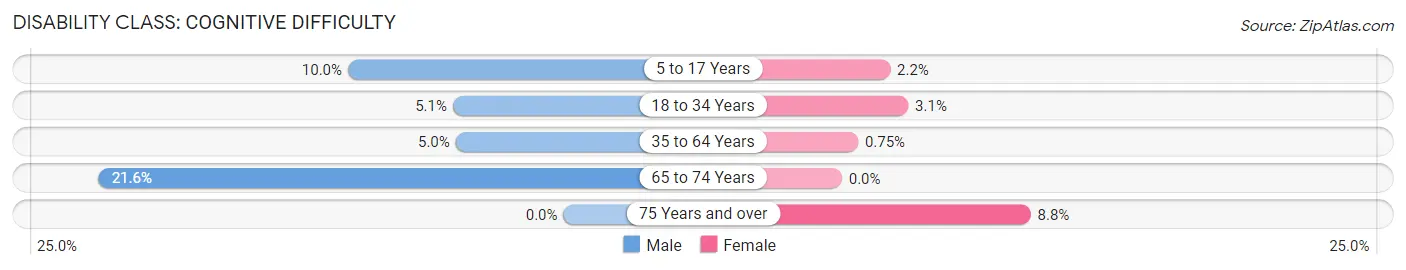
| Age Bracket | Male | Female |
| 5 to 17 Years | 19 (10.0%) | 7 (2.2%) |
| 18 to 34 Years | 44 (5.1%) | 19 (3.1%) |
| 35 to 64 Years | 56 (5.0%) | 8 (0.7%) |
| 65 to 74 Years | 47 (21.6%) | 0 (0.0%) |
| 75 Years and over | 0 (0.0%) | 12 (8.8%) |
Disability Class: Ambulatory Difficulty
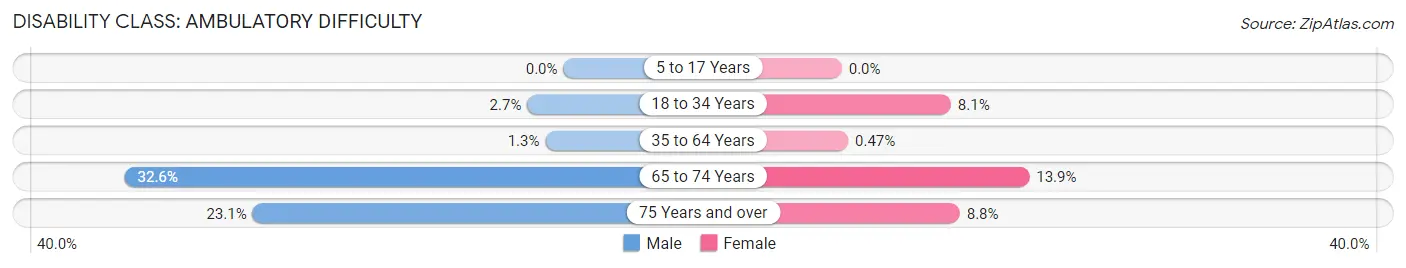
| Age Bracket | Male | Female |
| 5 to 17 Years | 0 (0.0%) | 0 (0.0%) |
| 18 to 34 Years | 23 (2.7%) | 50 (8.1%) |
| 35 to 64 Years | 15 (1.3%) | 5 (0.5%) |
| 65 to 74 Years | 71 (32.6%) | 11 (13.9%) |
| 75 Years and over | 9 (23.1%) | 12 (8.8%) |
Disability Class: Self-Care Difficulty
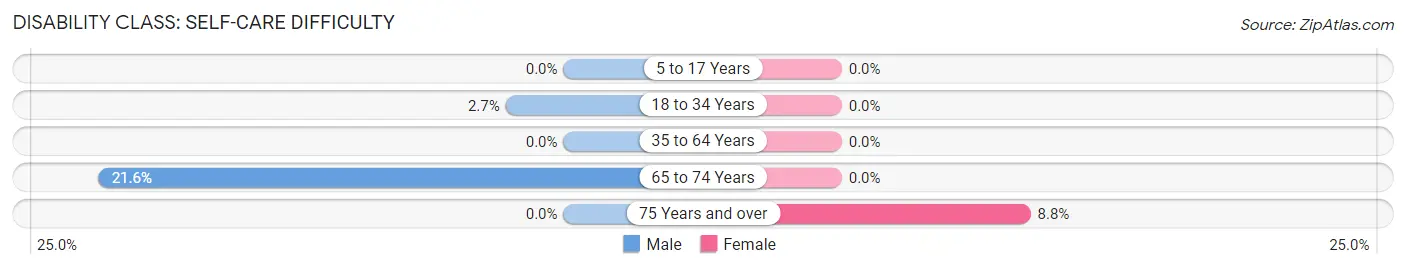
| Age Bracket | Male | Female |
| 5 to 17 Years | 0 (0.0%) | 0 (0.0%) |
| 18 to 34 Years | 23 (2.7%) | 0 (0.0%) |
| 35 to 64 Years | 0 (0.0%) | 0 (0.0%) |
| 65 to 74 Years | 47 (21.6%) | 0 (0.0%) |
| 75 Years and over | 0 (0.0%) | 12 (8.8%) |
Technology Access in Hickory Creek
Computing Device Access in Hickory Creek
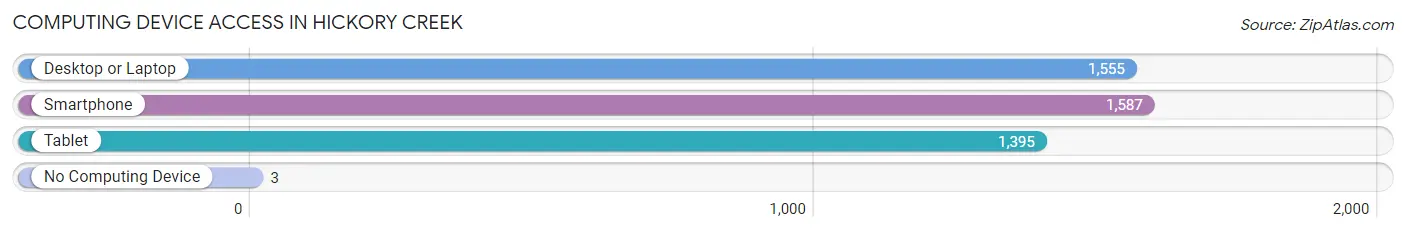
| Device Type | # Households | % Households |
| Desktop or Laptop | 1,555 | 93.9% |
| Smartphone | 1,587 | 95.8% |
| Tablet | 1,395 | 84.2% |
| No Computing Device | 3 | 0.2% |
| Total | 1,656 | 100.0% |
Internet Access in Hickory Creek
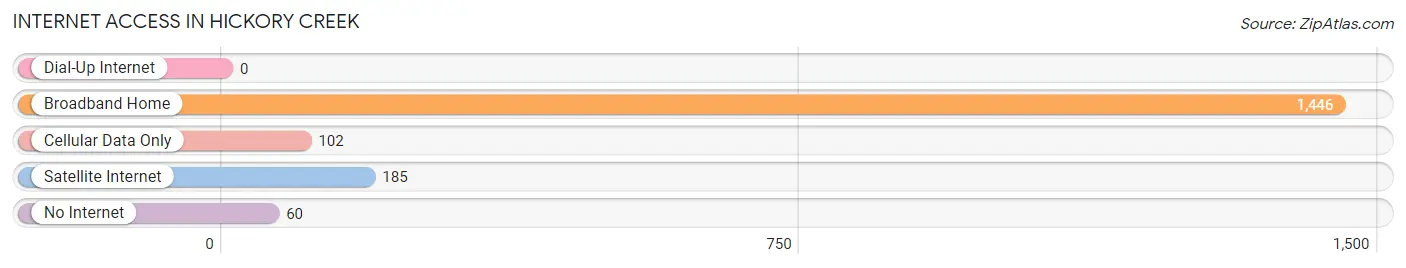
| Internet Type | # Households | % Households |
| Dial-Up Internet | 0 | 0.0% |
| Broadband Home | 1,446 | 87.3% |
| Cellular Data Only | 102 | 6.2% |
| Satellite Internet | 185 | 11.2% |
| No Internet | 60 | 3.6% |
| Total | 1,656 | 100.0% |
Hickory Creek Summary
Hickory Creek is a small town located in Denton County, Texas. It is situated on the eastern shore of Lake Lewisville, about 25 miles north of Dallas. The town was founded in 1848 and has a population of approximately 4,000 people.
History
Hickory Creek was founded in 1848 by a group of settlers from Tennessee. The town was named after the nearby creek, which was named for the abundance of hickory trees in the area. The settlers built a log cabin and a small store, and the town quickly grew. By the late 1800s, Hickory Creek had become a thriving community with a post office, a school, a church, and several businesses.
In the early 1900s, the town began to experience a period of growth and prosperity. The population increased, and new businesses opened. The town also became a popular destination for tourists, who came to enjoy the lake and the surrounding countryside.
In the 1950s, the town began to experience a decline in population and businesses. The town was bypassed by the new interstate highway system, and many of the businesses closed. However, in the late 1980s, the town began to experience a resurgence. New businesses opened, and the population began to increase.
Geography
Hickory Creek is located in Denton County, Texas. It is situated on the eastern shore of Lake Lewisville, about 25 miles north of Dallas. The town is surrounded by rolling hills and wooded areas, and is home to several parks and recreational areas. The town is also home to several lakes, including Lake Lewisville, Lake Ray Roberts, and Lake Grapevine.
Economy
Hickory Creek’s economy is largely based on tourism and retail. The town is home to several restaurants, shops, and other businesses. The town is also home to several manufacturing companies, including a plastics factory and a furniture factory.
Demographics
As of the 2010 census, the population of Hickory Creek was 4,092. The racial makeup of the town was 87.3% White, 5.2% African American, 0.7% Native American, 0.7% Asian, and 4.9% from other races. The median household income was $50,945, and the median family income was $60,945.
Conclusion
Hickory Creek is a small town located in Denton County, Texas. It was founded in 1848 and has a population of approximately 4,000 people. The town is situated on the eastern shore of Lake Lewisville, about 25 miles north of Dallas. The town’s economy is largely based on tourism and retail, and it is home to several manufacturing companies. The population of Hickory Creek is largely White, with a small percentage of African American, Native American, and Asian residents.
Common Questions
What is Per Capita Income in Hickory Creek?
Per Capita income in Hickory Creek is $51,739.
What is the Median Family Income in Hickory Creek?
Median Family Income in Hickory Creek is $139,451.
What is the Median Household income in Hickory Creek?
Median Household Income in Hickory Creek is $138,584.
What is Income or Wage Gap in Hickory Creek?
Income or Wage Gap in Hickory Creek is 44.3%.
Women in Hickory Creek earn 55.7 cents for every dollar earned by a man.
What is Inequality or Gini Index in Hickory Creek?
Inequality or Gini Index in Hickory Creek is 0.32.
What is the Total Population of Hickory Creek?
Total Population of Hickory Creek is 4,906.
What is the Total Male Population of Hickory Creek?
Total Male Population of Hickory Creek is 2,602.
What is the Total Female Population of Hickory Creek?
Total Female Population of Hickory Creek is 2,304.
What is the Ratio of Males per 100 Females in Hickory Creek?
There are 112.93 Males per 100 Females in Hickory Creek.
What is the Ratio of Females per 100 Males in Hickory Creek?
There are 88.55 Females per 100 Males in Hickory Creek.
What is the Median Population Age in Hickory Creek?
Median Population Age in Hickory Creek is 37.6 Years.
What is the Average Family Size in Hickory Creek
Average Family Size in Hickory Creek is 3.2 People.
What is the Average Household Size in Hickory Creek
Average Household Size in Hickory Creek is 3.0 People.
How Large is the Labor Force in Hickory Creek?
There are 3,592 People in the Labor Forcein in Hickory Creek.
What is the Percentage of People in the Labor Force in Hickory Creek?
85.6% of People are in the Labor Force in Hickory Creek.
What is the Unemployment Rate in Hickory Creek?
Unemployment Rate in Hickory Creek is 2.6%.