Zip Codes with the Highest Percentage of Population Employed in Computer & Mathematics in Mcallen, TX
RELATED REPORTS & OPTIONS
Computer & Mathematics
Mcallen
Compare Zip Codes
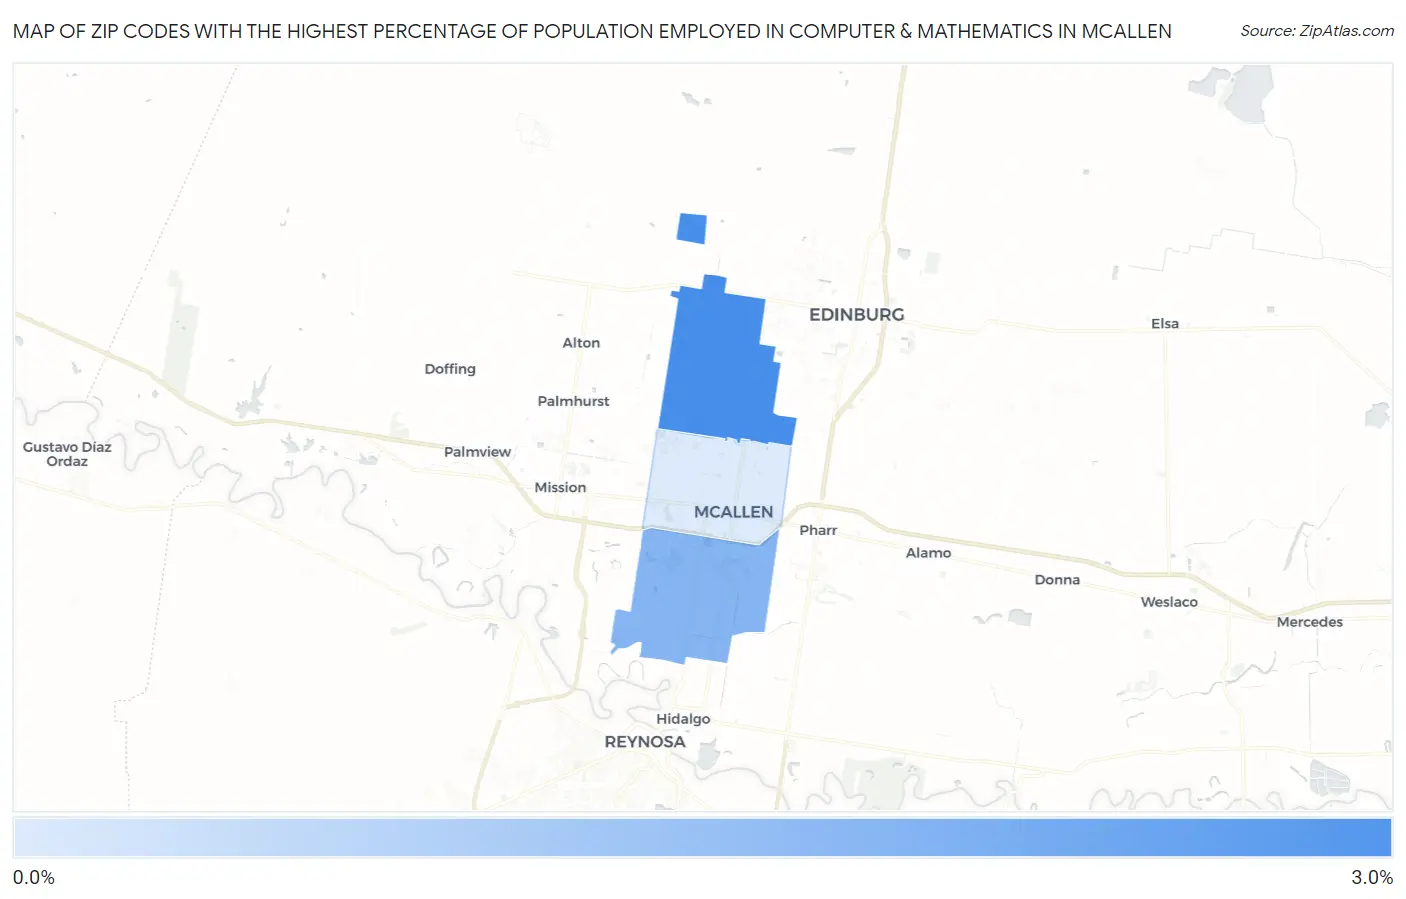
Map of Zip Codes with the Highest Percentage of Population Employed in Computer & Mathematics in Mcallen
0.35%
2.6%
Zip Codes with the Highest Percentage of Population Employed in Computer & Mathematics in Mcallen, TX
| Zip Code | % Employed | vs State | vs National | |
| 1. | 78504 | 2.6% | 3.4%(-0.787)#482 | 3.5%(-0.876)#9,031 |
| 2. | 78503 | 1.7% | 3.4%(-1.76)#721 | 3.5%(-1.85)#13,370 |
| 3. | 78501 | 0.35% | 3.4%(-3.09)#1,243 | 3.5%(-3.18)#21,357 |
1
Common Questions
What are the Top Zip Codes with the Highest Percentage of Population Employed in Computer & Mathematics in Mcallen, TX?
Top Zip Codes with the Highest Percentage of Population Employed in Computer & Mathematics in Mcallen, TX are:
What zip code has the Highest Percentage of Population Employed in Computer & Mathematics in Mcallen, TX?
78504 has the Highest Percentage of Population Employed in Computer & Mathematics in Mcallen, TX with 2.6%.
What is the Percentage of Population Employed in Computer & Mathematics in Mcallen, TX?
Percentage of Population Employed in Computer & Mathematics in Mcallen is 1.3%.
What is the Percentage of Population Employed in Computer & Mathematics in Texas?
Percentage of Population Employed in Computer & Mathematics in Texas is 3.4%.
What is the Percentage of Population Employed in Computer & Mathematics in the United States?
Percentage of Population Employed in Computer & Mathematics in the United States is 3.5%.