Zip Codes with the Highest Percentage of Population Employed in Computer & Mathematics in Lubbock, TX

RELATED REPORTS & OPTIONS

Computer & Mathematics
Population
Families and Households
Female Fertility
Female Fertility (Unmarried)
Race (Community Size)
Race (Percentage)
Ancestry (Community Size)
AfricanAmericanApacheArabArgentineanArmenianAustrianBelgianBhutaneseBlackfeetBolivianBrazilianBritishBurmeseCajunCanadianCelticCentral AmericanCentral American IndianCherokeeCheyenneChickasawChileanChippewaChoctawColombianComancheCreekCubanCzechCzechoslovakianDanishDutchDutch West IndianEastern EuropeanEcuadorianEgyptianEnglishEthiopianEuropeanFijianFilipinoFinnishFrenchFrench CanadianGermanGhanaianGreekGuamanian / ChamorroGuatemalanHaitianHonduranHungarianIndian (Asian)IranianIrishIsraeliItalianJamaicanJapaneseJordanianKenyanKoreanLaotianLebaneseLithuanianMenomineeMexicanMexican American IndianNative HawaiianNavajoNicaraguanNigerianNorthern EuropeanNorwegianPakistaniPanamanianPennsylvania GermanPeruvianPolishPortuguesePotawatomiPuerto RicanRussianSalvadoranSamoanScandinavianScotch-IrishScottishSeminoleSierra LeoneanSlovakSloveneSomaliSouth AmericanSpaniardSpanishSpanish AmericanSri LankanSubsaharan AfricanSwedishSwissThaiTrinidadian and TobagonianTurkishUkrainianVenezuelanVietnameseWelshYaqui
Ancestry (Percentage)
AfricanAmericanApacheArabArgentineanArmenianAustrianBelgianBhutaneseBlackfeetBolivianBrazilianBritishBurmeseCajunCanadianCelticCentral AmericanCentral American IndianCherokeeCheyenneChickasawChileanChippewaChoctawColombianComancheCreekCubanCzechCzechoslovakianDanishDutchDutch West IndianEastern EuropeanEcuadorianEgyptianEnglishEthiopianEuropeanFijianFilipinoFinnishFrenchFrench CanadianGermanGhanaianGreekGuamanian / ChamorroGuatemalanHaitianHonduranHungarianIndian (Asian)IranianIrishIsraeliItalianJamaicanJapaneseJordanianKenyanKoreanLaotianLebaneseLithuanianMenomineeMexicanMexican American IndianNative HawaiianNavajoNicaraguanNigerianNorthern EuropeanNorwegianPakistaniPanamanianPennsylvania GermanPeruvianPolishPortuguesePotawatomiPuerto RicanRussianSalvadoranSamoanScandinavianScotch-IrishScottishSeminoleSierra LeoneanSlovakSloveneSomaliSouth AmericanSpaniardSpanishSpanish AmericanSri LankanSubsaharan AfricanSwedishSwissThaiTrinidadian and TobagonianTurkishUkrainianVenezuelanVietnameseWelshYaqui
Immigrant Origin (Total)
Immigrant Origin (Percentage)
Income
Income (Families)
Income (Households)
Poverty
Poverty (Families)
Unemployment
Employment Occupations
Employment Industries
Employer Class
Commute Time
Commute Means
School Enrollment
Education by Degree Field
Occupancy
Finances
Physical Characteristics
Lubbock
Compare Zip Codes
Comparison Subject

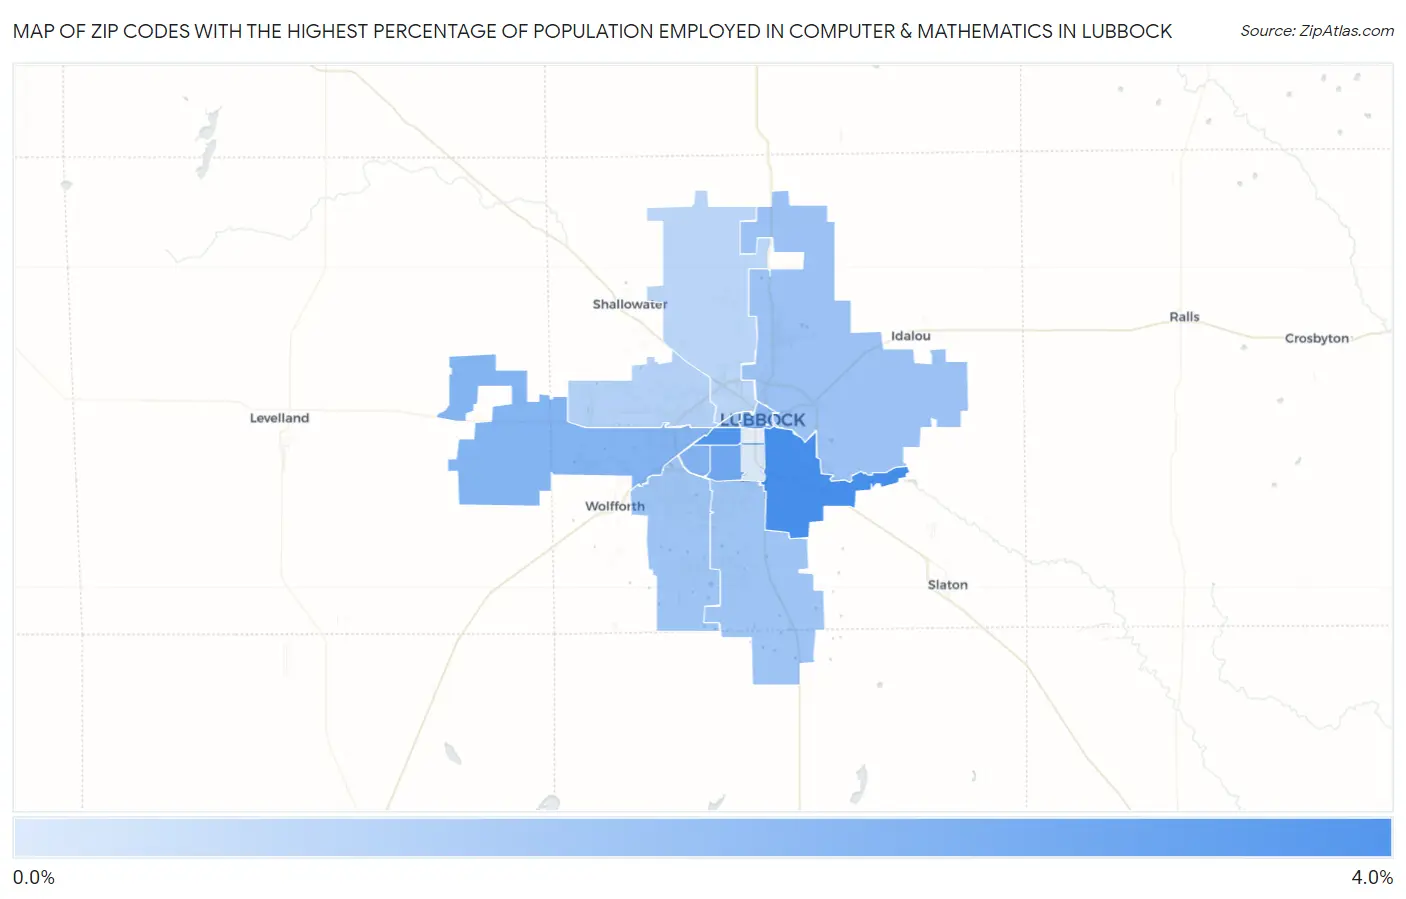
Map of Zip Codes with the Highest Percentage of Population Employed in Computer & Mathematics in Lubbock

0.0%
4.0%
Zip Codes with the Highest Percentage of Population Employed in Computer & Mathematics in Lubbock Map

Zip Codes with the Highest Percentage of Population Employed in Computer & Mathematics in Lubbock, TX

Zip Code % Employed vs State vs National
1.794043.8%3.4%(+0.386)#3033.5%(+0.297)#5,422
2.794103.6%3.4%(+0.120)#3313.5%(+0.031)#6,057
3.794132.9%3.4%(-0.529)#4393.5%(-0.618)#8,078
4.794142.5%3.4%(-0.926)#5103.5%(-1.02)#9,607
5.794072.5%3.4%(-0.930)#5113.5%(-1.02)#9,615
6.794012.3%3.4%(-1.16)#5753.5%(-1.25)#10,579
7.794062.1%3.4%(-1.38)#6173.5%(-1.47)#11,538
8.794032.0%3.4%(-1.43)#6293.5%(-1.52)#11,780
9.794241.9%3.4%(-1.50)#6473.5%(-1.59)#12,135
10.794231.9%3.4%(-1.54)#6563.5%(-1.63)#12,319
11.794161.5%3.4%(-1.95)#7783.5%(-2.04)#14,465
12.794151.3%3.4%(-2.12)#8383.5%(-2.20)#15,418
13.794120.59%3.4%(-2.85)#1,1403.5%(-2.94)#19,949

Common Questions

What are the Top 10 Zip Codes with the Highest Percentage of Population Employed in Computer & Mathematics in Lubbock, TX?
Top 10 Zip Codes with the Highest Percentage of Population Employed in Computer & Mathematics in Lubbock, TX are:
#1
3.8%
#2
3.6%
#3
2.9%
#4
2.5%
#5
2.5%
#6
2.3%
#7
2.1%
#8
2.0%
#9
1.9%
#10
1.9%
What zip code has the Highest Percentage of Population Employed in Computer & Mathematics in Lubbock, TX?
79404 has the Highest Percentage of Population Employed in Computer & Mathematics in Lubbock, TX with 3.8%.
What is the Percentage of Population Employed in Computer & Mathematics in Lubbock, TX?
Percentage of Population Employed in Computer & Mathematics in Lubbock is 2.1%.
What is the Percentage of Population Employed in Computer & Mathematics in Texas?
Percentage of Population Employed in Computer & Mathematics in Texas is 3.4%.
What is the Percentage of Population Employed in Computer & Mathematics in the United States?
Percentage of Population Employed in Computer & Mathematics in the United States is 3.5%.