Marfa, TX Map & Demographics
Marfa Map
Marfa Overview
$36,682
PER CAPITA INCOME
$86,250
AVG FAMILY INCOME
$30,669
AVG HOUSEHOLD INCOME
20.0%
WAGE / INCOME GAP [ % ]
80.0¢/ $1
WAGE / INCOME GAP [ $ ]
0.60
INEQUALITY / GINI INDEX
2,141
TOTAL POPULATION
1,072
MALE POPULATION
1,069
FEMALE POPULATION
100.28
MALES / 100 FEMALES
99.72
FEMALES / 100 MALES
55.3
MEDIAN AGE
3.6
AVG FAMILY SIZE
1.9
AVG HOUSEHOLD SIZE
1,300
LABOR FORCE [ PEOPLE ]
71.1%
PERCENT IN LABOR FORCE
Marfa Zip Codes
Marfa Area Codes
Income in Marfa
Income Overview in Marfa
Per Capita Income in Marfa is $36,682, while median incomes of families and households are $86,250 and $30,669 respectively.
| Characteristic | Number | Measure |
| Per Capita Income | 2,141 | $36,682 |
| Median Family Income | 358 | $86,250 |
| Mean Family Income | 358 | $171,153 |
| Median Household Income | 1,139 | $30,669 |
| Mean Household Income | 1,139 | $74,615 |
| Income Deficit | 358 | $0 |
| Wage / Income Gap (%) | 2,141 | 19.97% |
| Wage / Income Gap ($) | 2,141 | 80.03¢ per $1 |
| Gini / Inequality Index | 2,141 | 0.60 |
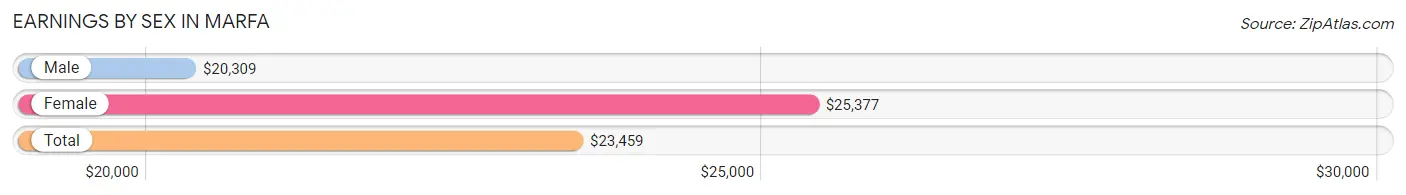
Earnings by Sex in Marfa
Average Earnings in Marfa are $23,459, $20,309 for men and $25,377 for women, a difference of 20.0%.
| Sex | Number | Average Earnings |
| Male | 772 (58.5%) | $20,309 |
| Female | 548 (41.5%) | $25,377 |
| Total | 1,320 (100.0%) | $23,459 |
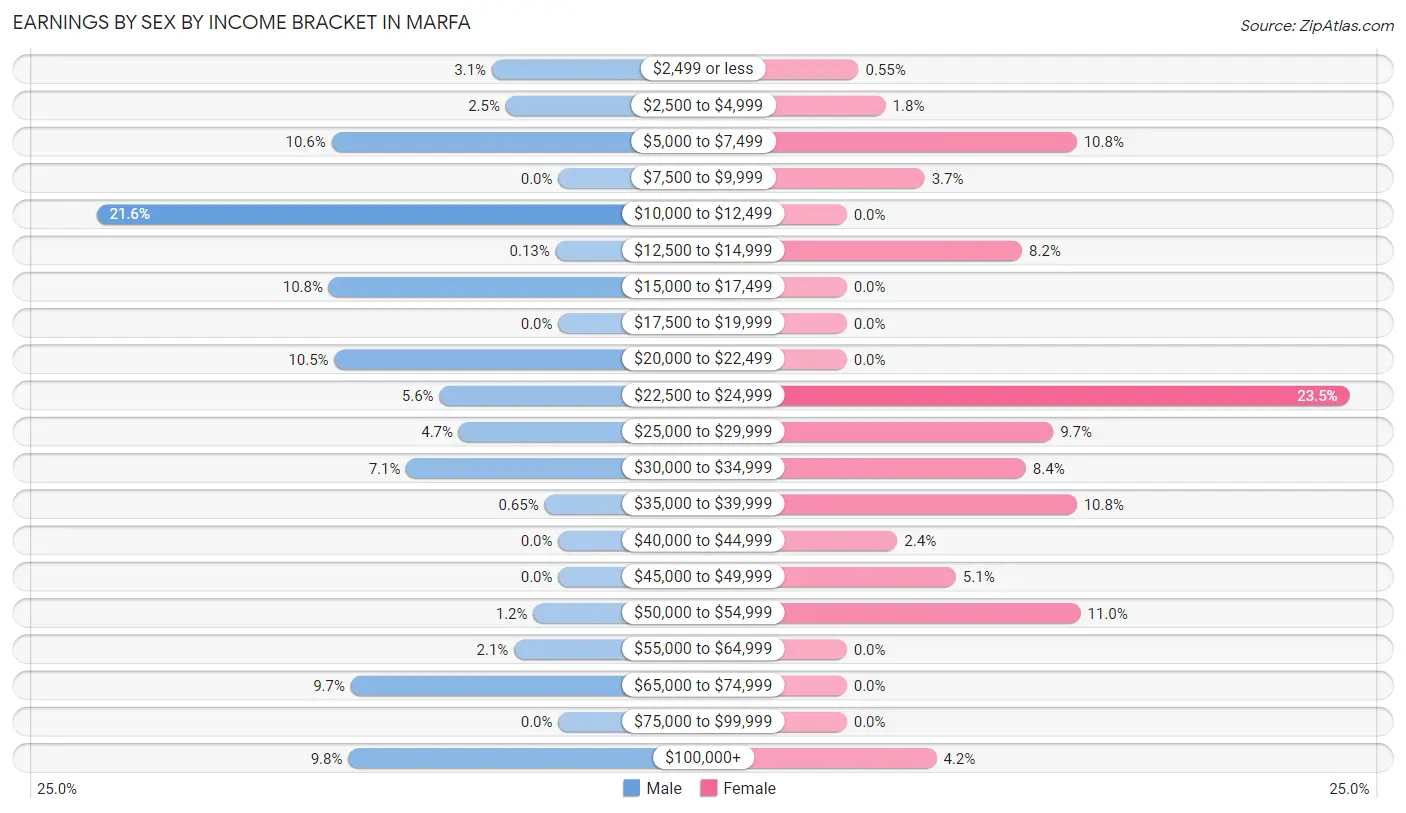
Earnings by Sex by Income Bracket in Marfa
The most common earnings brackets in Marfa are $10,000 to $12,499 for men (167 | 21.6%) and $22,500 to $24,999 for women (129 | 23.5%).
| Income | Male | Female |
| $2,499 or less | 24 (3.1%) | 3 (0.5%) |
| $2,500 to $4,999 | 19 (2.5%) | 10 (1.8%) |
| $5,000 to $7,499 | 82 (10.6%) | 59 (10.8%) |
| $7,500 to $9,999 | 0 (0.0%) | 20 (3.6%) |
| $10,000 to $12,499 | 167 (21.6%) | 0 (0.0%) |
| $12,500 to $14,999 | 1 (0.1%) | 45 (8.2%) |
| $15,000 to $17,499 | 83 (10.7%) | 0 (0.0%) |
| $17,500 to $19,999 | 0 (0.0%) | 0 (0.0%) |
| $20,000 to $22,499 | 81 (10.5%) | 0 (0.0%) |
| $22,500 to $24,999 | 43 (5.6%) | 129 (23.5%) |
| $25,000 to $29,999 | 36 (4.7%) | 53 (9.7%) |
| $30,000 to $34,999 | 55 (7.1%) | 46 (8.4%) |
| $35,000 to $39,999 | 5 (0.6%) | 59 (10.8%) |
| $40,000 to $44,999 | 0 (0.0%) | 13 (2.4%) |
| $45,000 to $49,999 | 0 (0.0%) | 28 (5.1%) |
| $50,000 to $54,999 | 9 (1.2%) | 60 (11.0%) |
| $55,000 to $64,999 | 16 (2.1%) | 0 (0.0%) |
| $65,000 to $74,999 | 75 (9.7%) | 0 (0.0%) |
| $75,000 to $99,999 | 0 (0.0%) | 0 (0.0%) |
| $100,000+ | 76 (9.8%) | 23 (4.2%) |
| Total | 772 (100.0%) | 548 (100.0%) |
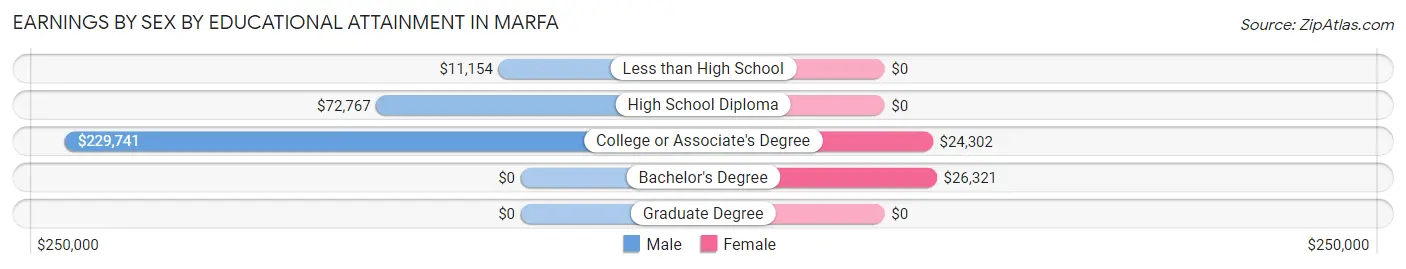
Earnings by Sex by Educational Attainment in Marfa
Average earnings in Marfa are $20,910 for men and $25,377 for women, a difference of 17.6%. Men with an educational attainment of college or associate's degree enjoy the highest average annual earnings of $229,741, while those with less than high school education earn the least with $11,154. Women with an educational attainment of bachelor's degree earn the most with the average annual earnings of $26,321, while those with college or associate's degree education have the smallest earnings of $24,302.
| Educational Attainment | Male Income | Female Income |
| Less than High School | $11,154 | $0 |
| High School Diploma | $72,767 | $0 |
| College or Associate's Degree | $229,741 | $24,302 |
| Bachelor's Degree | - | - |
| Graduate Degree | - | - |
| Total | $20,910 | $25,377 |
Family Income in Marfa
Family Income Brackets in Marfa
According to the Marfa family income data, there are 139 families falling into the $75,000 to $99,999 income range, which is the most common income bracket and makes up 38.8% of all families.
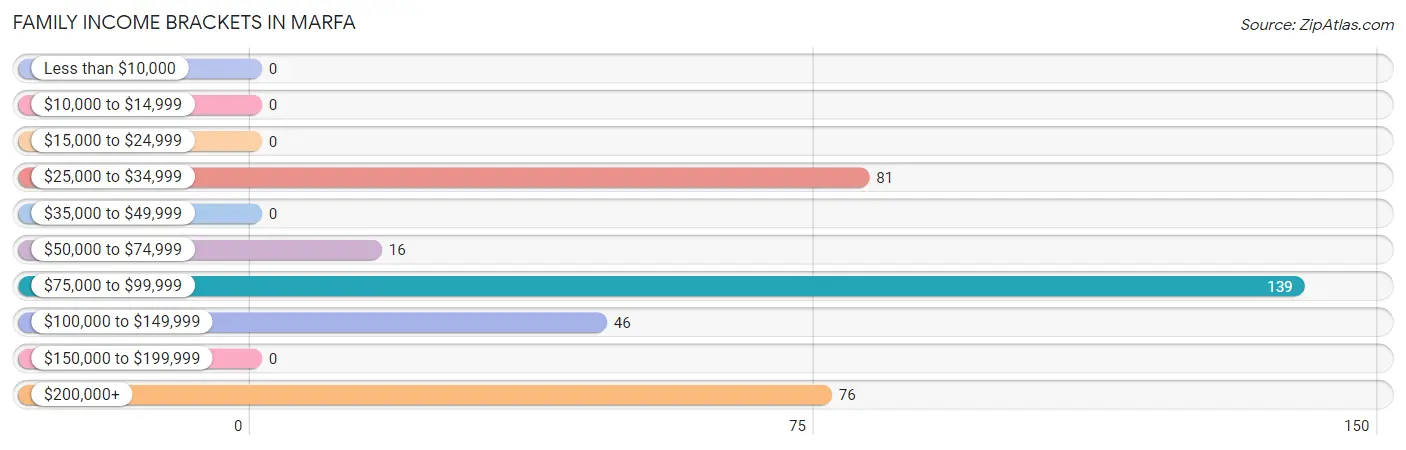
| Income Bracket | # Families | % Families |
| Less than $10,000 | 0 | 0.0% |
| $10,000 to $14,999 | 0 | 0.0% |
| $15,000 to $24,999 | 0 | 0.0% |
| $25,000 to $34,999 | 81 | 22.6% |
| $35,000 to $49,999 | 0 | 0.0% |
| $50,000 to $74,999 | 16 | 4.5% |
| $75,000 to $99,999 | 139 | 38.8% |
| $100,000 to $149,999 | 46 | 12.8% |
| $150,000 to $199,999 | 0 | 0.0% |
| $200,000+ | 76 | 21.2% |
Family Income by Famaliy Size in Marfa
2-person families (163 | 45.5%) account for the highest median family income in Marfa with $107,669 per family, while 2-person families (163 | 45.5%) have the highest median income of $53,834 per family member.
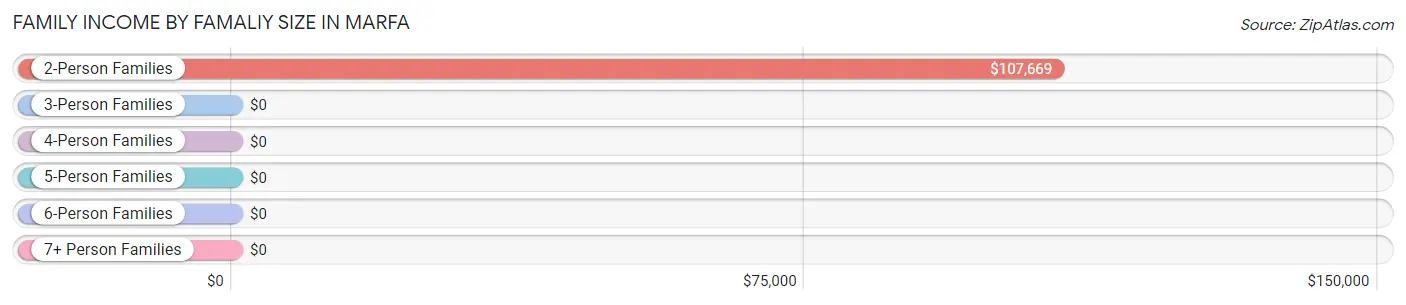
| Income Bracket | # Families | Median Income |
| 2-Person Families | 163 (45.5%) | $107,669 |
| 3-Person Families | 82 (22.9%) | $0 |
| 4-Person Families | 0 (0.0%) | $0 |
| 5-Person Families | 110 (30.7%) | $0 |
| 6-Person Families | 0 (0.0%) | $0 |
| 7+ Person Families | 3 (0.8%) | $0 |
| Total | 358 (100.0%) | $86,250 |
Family Income by Number of Earners in Marfa
| Number of Earners | # Families | Median Income |
| No Earners | 57 (15.9%) | $0 |
| 1 Earner | 13 (3.6%) | $0 |
| 2 Earners | 177 (49.4%) | $0 |
| 3+ Earners | 111 (31.0%) | $0 |
| Total | 358 (100.0%) | $86,250 |
Household Income in Marfa
Household Income Brackets in Marfa
With 298 households falling in the category, the $25,000 to $34,999 income range is the most frequent in Marfa, accounting for 26.2% of all households.
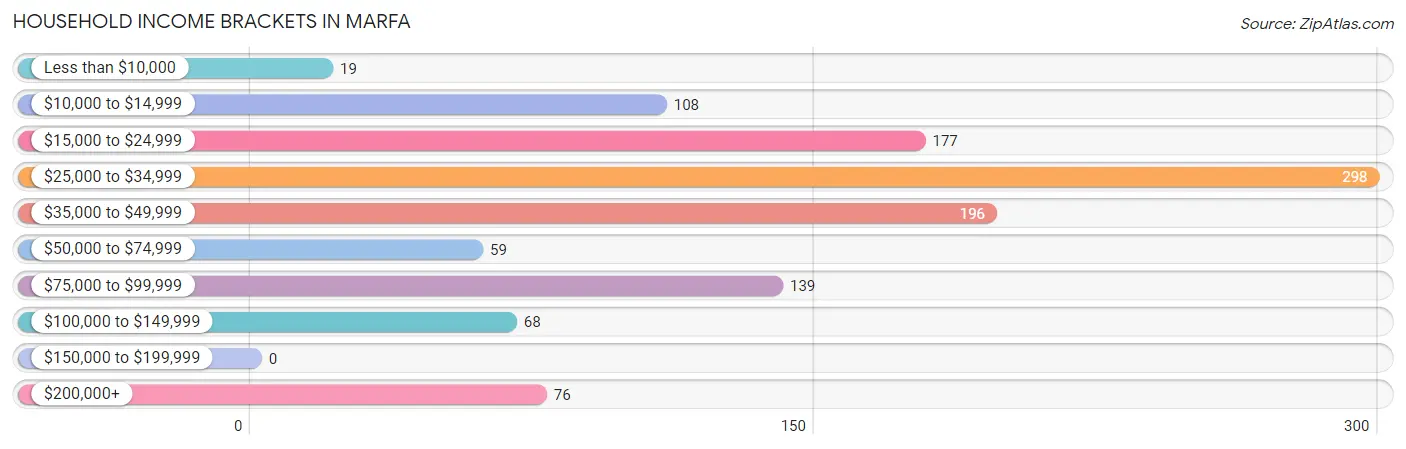
| Income Bracket | # Households | % Households |
| Less than $10,000 | 19 | 1.7% |
| $10,000 to $14,999 | 108 | 9.5% |
| $15,000 to $24,999 | 177 | 15.5% |
| $25,000 to $34,999 | 298 | 26.2% |
| $35,000 to $49,999 | 196 | 17.2% |
| $50,000 to $74,999 | 59 | 5.2% |
| $75,000 to $99,999 | 139 | 12.2% |
| $100,000 to $149,999 | 68 | 6.0% |
| $150,000 to $199,999 | 0 | 0.0% |
| $200,000+ | 76 | 6.7% |
Household Income by Householder Age in Marfa
The median household income in Marfa is $30,669, with the highest median household income of $102,102 found in the 45 to 64 years age bracket for the primary householder. A total of 251 households (22.0%) fall into this category. Meanwhile, the 15 to 24 years age bracket for the primary householder has the lowest median household income of $0, with 5 households (0.4%) in this group.
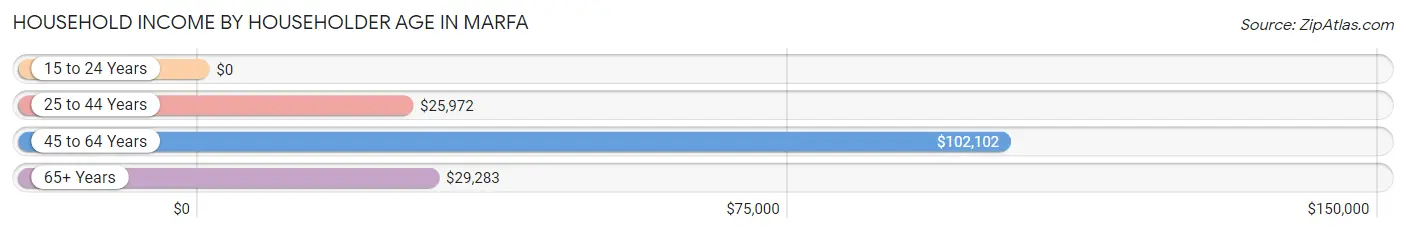
| Income Bracket | # Households | Median Income |
| 15 to 24 Years | 5 (0.4%) | $0 |
| 25 to 44 Years | 203 (17.8%) | $25,972 |
| 45 to 64 Years | 251 (22.0%) | $102,102 |
| 65+ Years | 680 (59.7%) | $29,283 |
| Total | 1,139 (100.0%) | $30,669 |
Poverty in Marfa
Income Below Poverty by Sex and Age in Marfa
With 23.2% poverty level for males and 26.6% for females among the residents of Marfa, 6 to 11 year old males and under 5 year old females are the most vulnerable to poverty, with 78 males (100.0%) and 78 females (100.0%) in their respective age groups living below the poverty level.
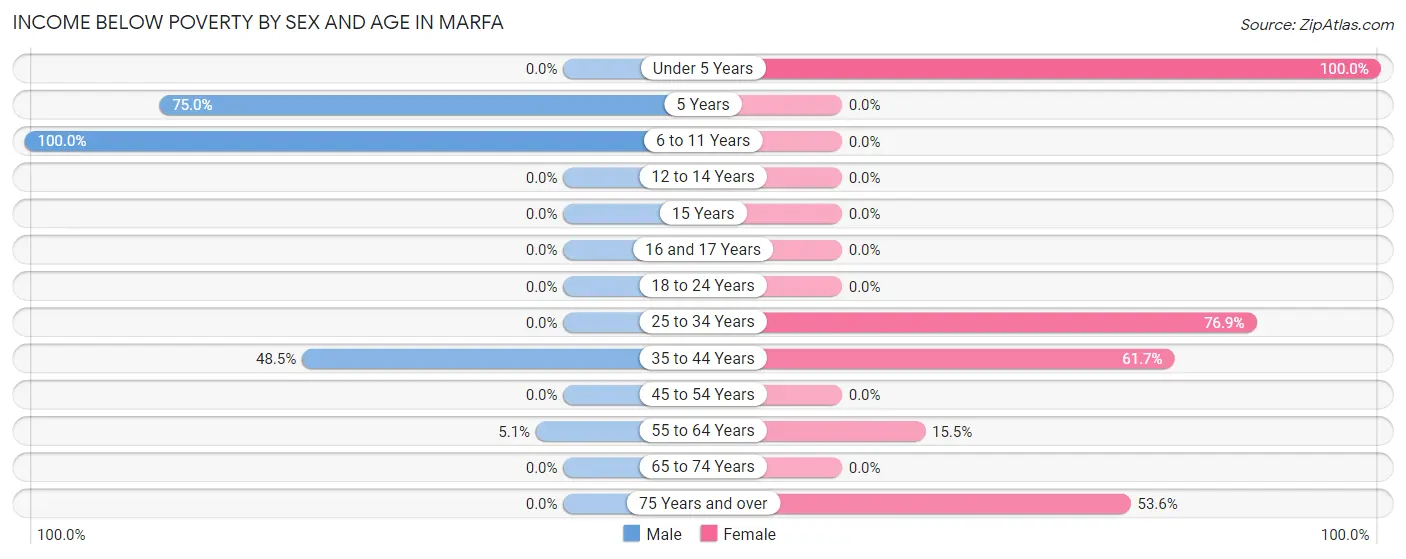
| Age Bracket | Male | Female |
| Under 5 Years | 0 (0.0%) | 78 (100.0%) |
| 5 Years | 78 (75.0%) | 0 (0.0%) |
| 6 to 11 Years | 78 (100.0%) | 0 (0.0%) |
| 12 to 14 Years | 0 (0.0%) | 0 (0.0%) |
| 15 Years | 0 (0.0%) | 0 (0.0%) |
| 16 and 17 Years | 0 (0.0%) | 0 (0.0%) |
| 18 to 24 Years | 0 (0.0%) | 0 (0.0%) |
| 25 to 34 Years | 0 (0.0%) | 10 (76.9%) |
| 35 to 44 Years | 81 (48.5%) | 79 (61.7%) |
| 45 to 54 Years | 0 (0.0%) | 0 (0.0%) |
| 55 to 64 Years | 11 (5.1%) | 19 (15.4%) |
| 65 to 74 Years | 0 (0.0%) | 0 (0.0%) |
| 75 Years and over | 0 (0.0%) | 97 (53.6%) |
| Total | 248 (23.2%) | 283 (26.6%) |
Income Above Poverty by Sex and Age in Marfa
According to the poverty statistics in Marfa, males aged under 5 years and females aged 6 to 11 years are the age groups that are most secure financially, with 100.0% of males and 100.0% of females in these age groups living above the poverty line.
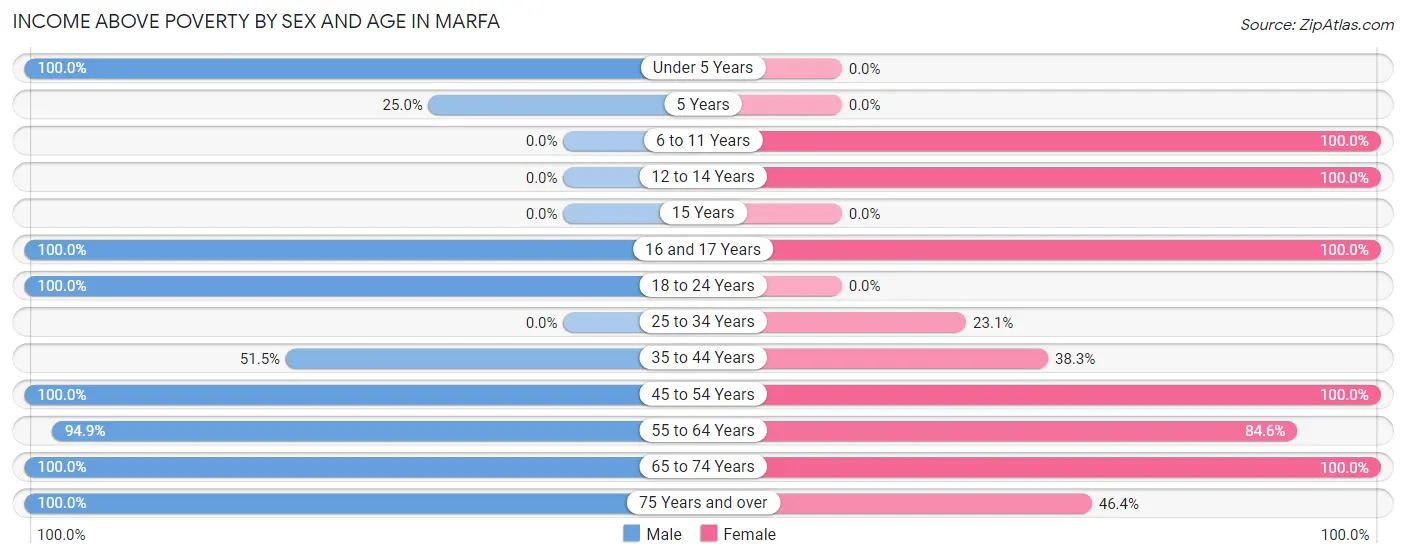
| Age Bracket | Male | Female |
| Under 5 Years | 27 (100.0%) | 0 (0.0%) |
| 5 Years | 26 (25.0%) | 0 (0.0%) |
| 6 to 11 Years | 0 (0.0%) | 12 (100.0%) |
| 12 to 14 Years | 0 (0.0%) | 13 (100.0%) |
| 15 Years | 0 (0.0%) | 0 (0.0%) |
| 16 and 17 Years | 65 (100.0%) | 16 (100.0%) |
| 18 to 24 Years | 5 (100.0%) | 0 (0.0%) |
| 25 to 34 Years | 0 (0.0%) | 3 (23.1%) |
| 35 to 44 Years | 86 (51.5%) | 49 (38.3%) |
| 45 to 54 Years | 213 (100.0%) | 98 (100.0%) |
| 55 to 64 Years | 205 (94.9%) | 104 (84.6%) |
| 65 to 74 Years | 95 (100.0%) | 404 (100.0%) |
| 75 Years and over | 100 (100.0%) | 84 (46.4%) |
| Total | 822 (76.8%) | 783 (73.5%) |
Income Below Poverty Among Married-Couple Families in Marfa
The poverty statistics for married-couple families in Marfa show that 22.6% or 81 of the total 358 families live below the poverty line. Families with 3 or 4 children have the highest poverty rate of 73.6%, comprising of 81 families. On the other hand, families with no children have the lowest poverty rate of 0.0%, which includes 0 families.
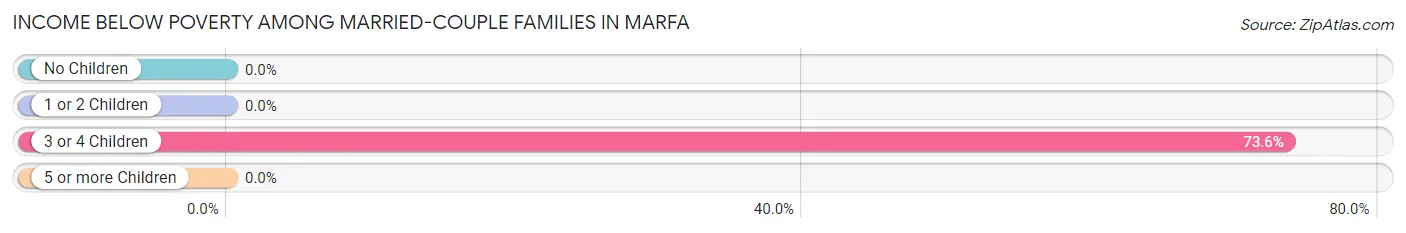
| Children | Above Poverty | Below Poverty |
| No Children | 245 (100.0%) | 0 (0.0%) |
| 1 or 2 Children | 0 (0.0%) | 0 (0.0%) |
| 3 or 4 Children | 29 (26.4%) | 81 (73.6%) |
| 5 or more Children | 3 (100.0%) | 0 (0.0%) |
| Total | 277 (77.4%) | 81 (22.6%) |
Income Below Poverty Among Single-Parent Households in Marfa
| Children | Single Father | Single Mother |
| No Children | 0 (0.0%) | 0 (0.0%) |
| 1 or 2 Children | 0 (0.0%) | 0 (0.0%) |
| 3 or 4 Children | 0 (0.0%) | 0 (0.0%) |
| 5 or more Children | 0 (0.0%) | 0 (0.0%) |
| Total | 0 (0.0%) | 0 (0.0%) |
Income Below Poverty Among Married-Couple vs Single-Parent Households in Marfa
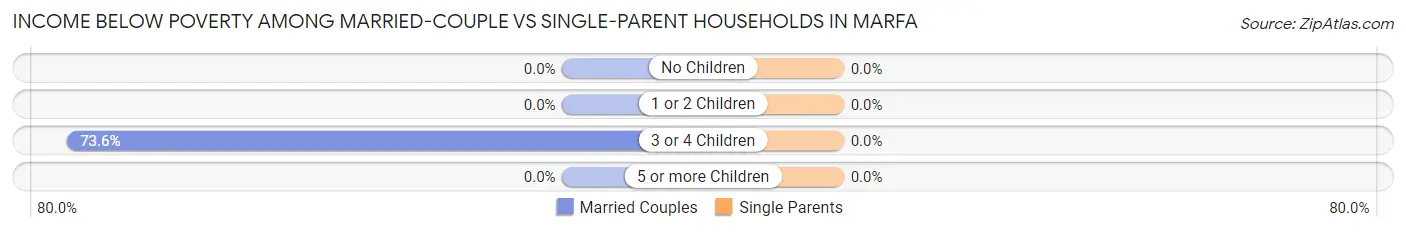
| Children | Married-Couple Families | Single-Parent Households |
| No Children | 0 (0.0%) | 0 (0.0%) |
| 1 or 2 Children | 0 (0.0%) | 0 (0.0%) |
| 3 or 4 Children | 81 (73.6%) | 0 (0.0%) |
| 5 or more Children | 0 (0.0%) | 0 (0.0%) |
| Total | 81 (22.6%) | 0 (0.0%) |
Race in Marfa
The most populous races in Marfa are White / Caucasian (1,544 | 72.1%), Hispanic or Latino (1,110 | 51.8%), and Two or more Races (584 | 27.3%).
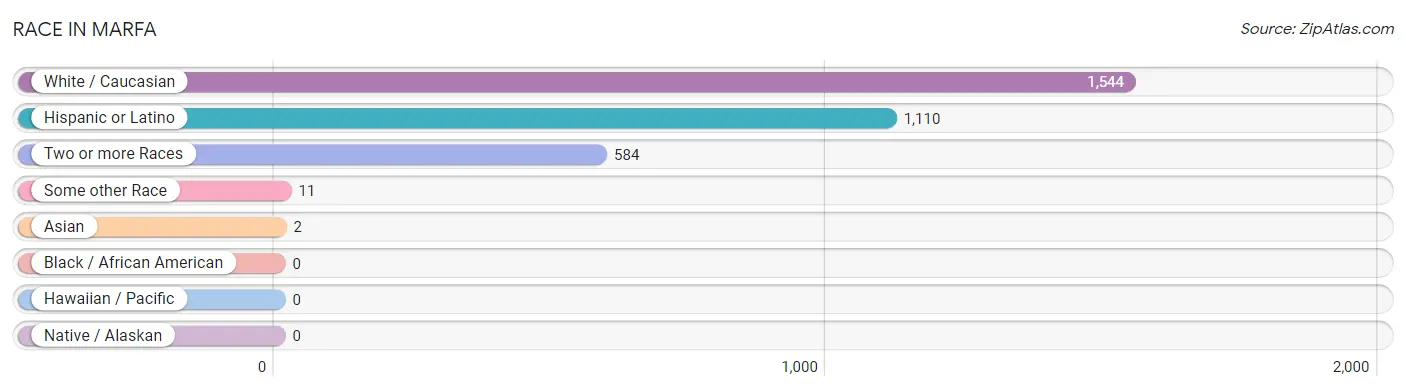
| Race | # Population | % Population |
| Asian | 2 | 0.1% |
| Black / African American | 0 | 0.0% |
| Hawaiian / Pacific | 0 | 0.0% |
| Hispanic or Latino | 1,110 | 51.8% |
| Native / Alaskan | 0 | 0.0% |
| White / Caucasian | 1,544 | 72.1% |
| Two or more Races | 584 | 27.3% |
| Some other Race | 11 | 0.5% |
| Total | 2,141 | 100.0% |
Ancestry in Marfa
The most populous ancestries reported in Marfa are Mexican (1,049 | 49.0%), Italian (358 | 16.7%), English (319 | 14.9%), Polish (315 | 14.7%), and German (148 | 6.9%), together accounting for 102.2% of all Marfa residents.
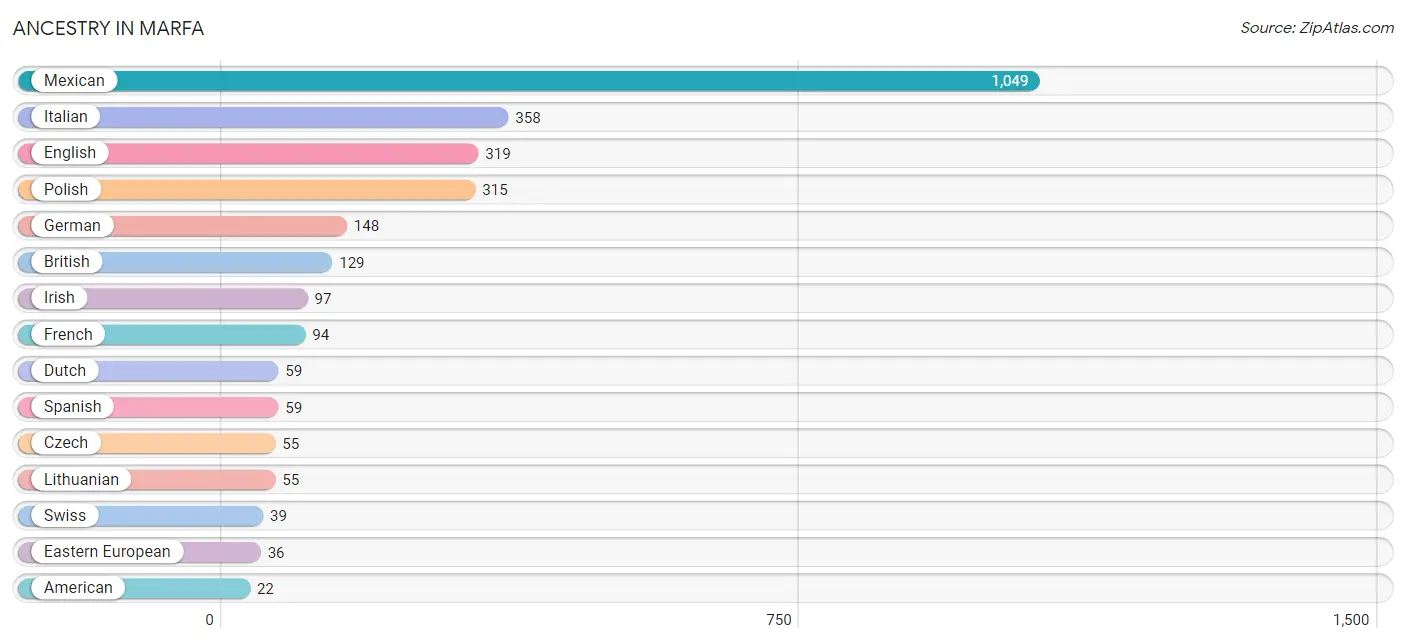
| Ancestry | # Population | % Population |
| African | 1 | 0.1% |
| American | 22 | 1.0% |
| British | 129 | 6.0% |
| Central American | 1 | 0.1% |
| Colombian | 1 | 0.1% |
| Czech | 55 | 2.6% |
| Czechoslovakian | 9 | 0.4% |
| Dutch | 59 | 2.8% |
| Eastern European | 36 | 1.7% |
| English | 319 | 14.9% |
| French | 94 | 4.4% |
| French Canadian | 21 | 1.0% |
| German | 148 | 6.9% |
| Guatemalan | 1 | 0.1% |
| Indian (Asian) | 1 | 0.1% |
| Irish | 97 | 4.5% |
| Italian | 358 | 16.7% |
| Lithuanian | 55 | 2.6% |
| Mexican | 1,049 | 49.0% |
| Polish | 315 | 14.7% |
| Slovene | 13 | 0.6% |
| South American | 1 | 0.1% |
| Spanish | 59 | 2.8% |
| Sri Lankan | 1 | 0.1% |
| Subsaharan African | 1 | 0.1% |
| Swiss | 39 | 1.8% |
| Thai | 21 | 1.0% | View All 27 Rows |
Immigrants in Marfa
The most numerous immigrant groups reported in Marfa came from Latin America (401 | 18.7%), Central America (400 | 18.7%), Mexico (400 | 18.7%), Asia (2 | 0.1%), and China (1 | 0.1%), together accounting for 56.2% of all Marfa residents.
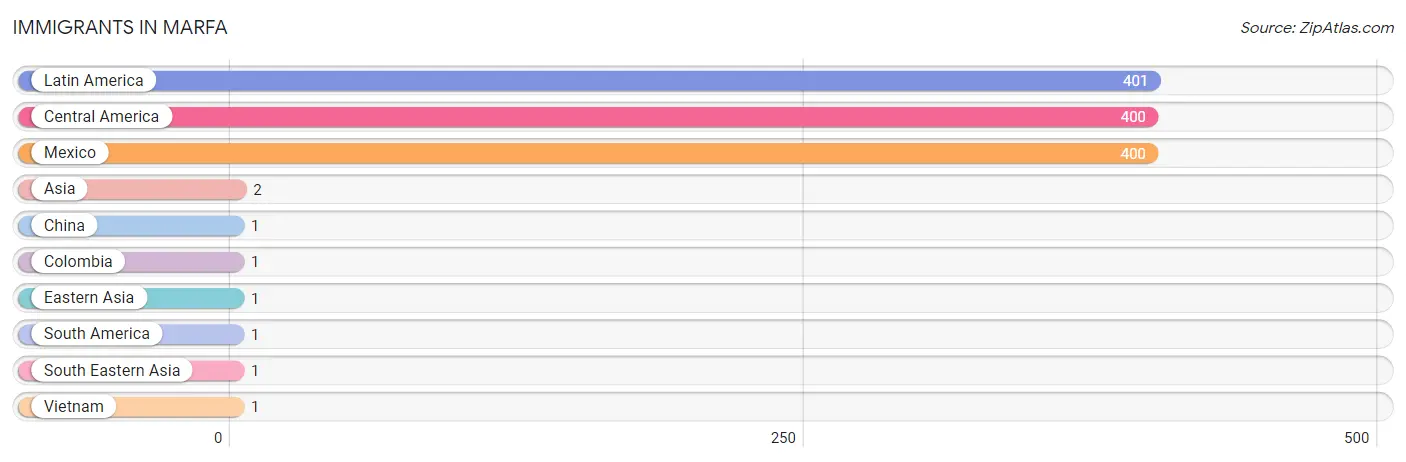
| Immigration Origin | # Population | % Population |
| Asia | 2 | 0.1% |
| Central America | 400 | 18.7% |
| China | 1 | 0.1% |
| Colombia | 1 | 0.1% |
| Eastern Asia | 1 | 0.1% |
| Latin America | 401 | 18.7% |
| Mexico | 400 | 18.7% |
| South America | 1 | 0.1% |
| South Eastern Asia | 1 | 0.1% |
| Vietnam | 1 | 0.1% | View All 10 Rows |
Sex and Age in Marfa
Sex and Age in Marfa
The most populous age groups in Marfa are 5 to 9 Years (182 | 17.0%) for men and 65 to 69 Years (279 | 26.1%) for women.
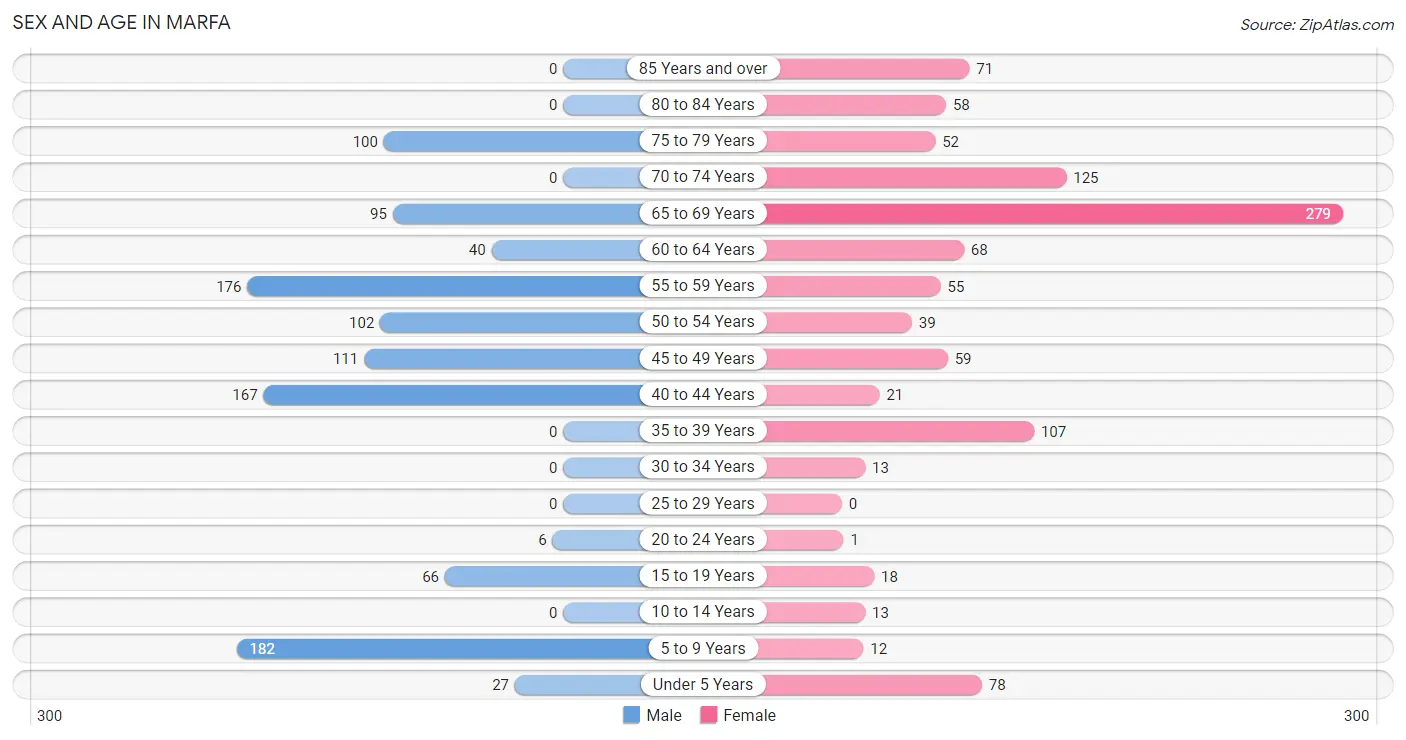
| Age Bracket | Male | Female |
| Under 5 Years | 27 (2.5%) | 78 (7.3%) |
| 5 to 9 Years | 182 (17.0%) | 12 (1.1%) |
| 10 to 14 Years | 0 (0.0%) | 13 (1.2%) |
| 15 to 19 Years | 66 (6.2%) | 18 (1.7%) |
| 20 to 24 Years | 6 (0.6%) | 1 (0.1%) |
| 25 to 29 Years | 0 (0.0%) | 0 (0.0%) |
| 30 to 34 Years | 0 (0.0%) | 13 (1.2%) |
| 35 to 39 Years | 0 (0.0%) | 107 (10.0%) |
| 40 to 44 Years | 167 (15.6%) | 21 (2.0%) |
| 45 to 49 Years | 111 (10.3%) | 59 (5.5%) |
| 50 to 54 Years | 102 (9.5%) | 39 (3.6%) |
| 55 to 59 Years | 176 (16.4%) | 55 (5.1%) |
| 60 to 64 Years | 40 (3.7%) | 68 (6.4%) |
| 65 to 69 Years | 95 (8.9%) | 279 (26.1%) |
| 70 to 74 Years | 0 (0.0%) | 125 (11.7%) |
| 75 to 79 Years | 100 (9.3%) | 52 (4.9%) |
| 80 to 84 Years | 0 (0.0%) | 58 (5.4%) |
| 85 Years and over | 0 (0.0%) | 71 (6.6%) |
| Total | 1,072 (100.0%) | 1,069 (100.0%) |
Families and Households in Marfa
Median Family Size in Marfa
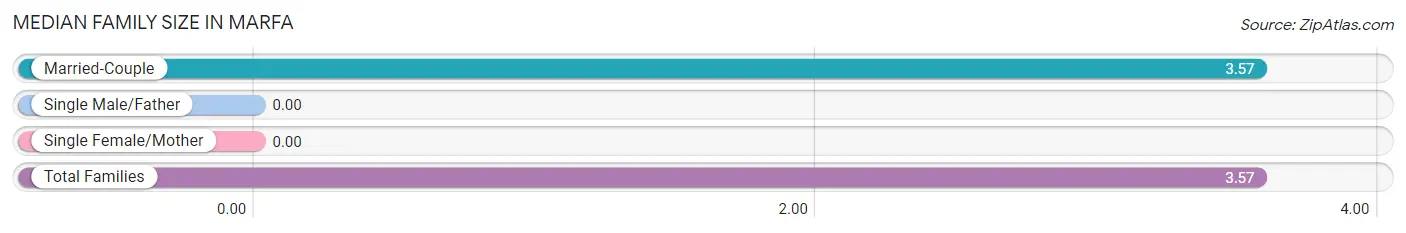
| Family Type | # Families | Family Size |
| Married-Couple | 358 (100.0%) | 3.57 |
| Single Male/Father | 0 (0.0%) | - |
| Single Female/Mother | 0 (0.0%) | - |
| Total Families | 358 (100.0%) | 3.57 |
Median Household Size in Marfa
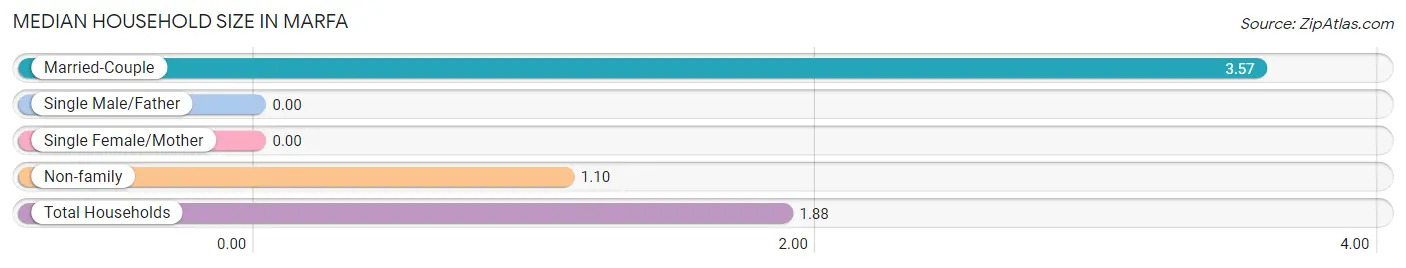
| Household Type | # Households | Household Size |
| Married-Couple | 358 (31.4%) | 3.57 |
| Single Male/Father | 0 (0.0%) | - |
| Single Female/Mother | 0 (0.0%) | - |
| Non-family | 781 (68.6%) | 1.10 |
| Total Households | 1,139 (100.0%) | 1.88 |
Household Size by Marriage Status in Marfa
Out of a total of 1,139 households in Marfa, 358 (31.4%) are family households, while 781 (68.6%) are nonfamily households. The most numerous type of family households are 2-person households, comprising 163, and the most common type of nonfamily households are 1-person households, comprising 677.
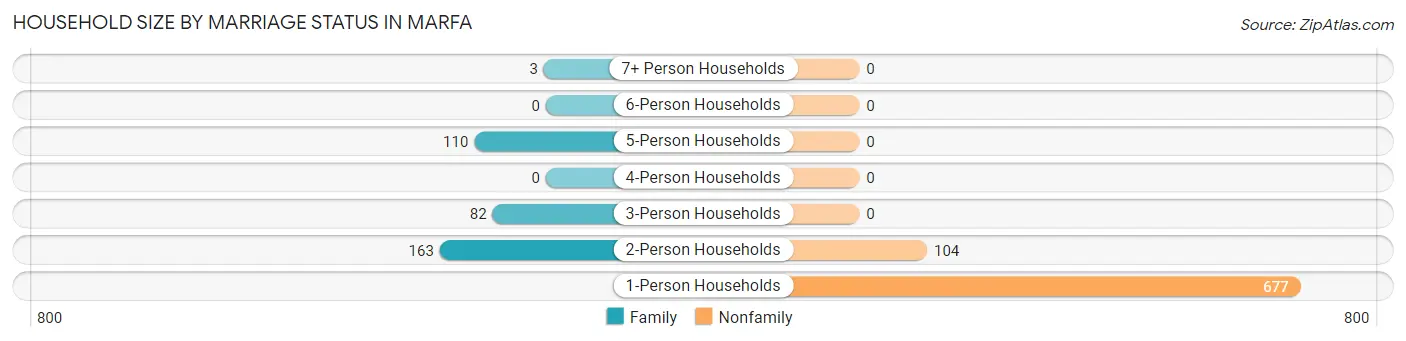
| Household Size | Family Households | Nonfamily Households |
| 1-Person Households | - | 677 (59.4%) |
| 2-Person Households | 163 (14.3%) | 104 (9.1%) |
| 3-Person Households | 82 (7.2%) | 0 (0.0%) |
| 4-Person Households | 0 (0.0%) | 0 (0.0%) |
| 5-Person Households | 110 (9.7%) | 0 (0.0%) |
| 6-Person Households | 0 (0.0%) | 0 (0.0%) |
| 7+ Person Households | 3 (0.3%) | 0 (0.0%) |
| Total | 358 (31.4%) | 781 (68.6%) |
Female Fertility in Marfa
Fertility by Age in Marfa
Average fertility rate in Marfa is 269.0 births per 1,000 women. Women in the age bracket of 35 to 50 years have the highest fertility rate with 316.0 births per 1,000 women. Women in the age bracket of 35 to 50 years acount for 100.0% of all women with births.
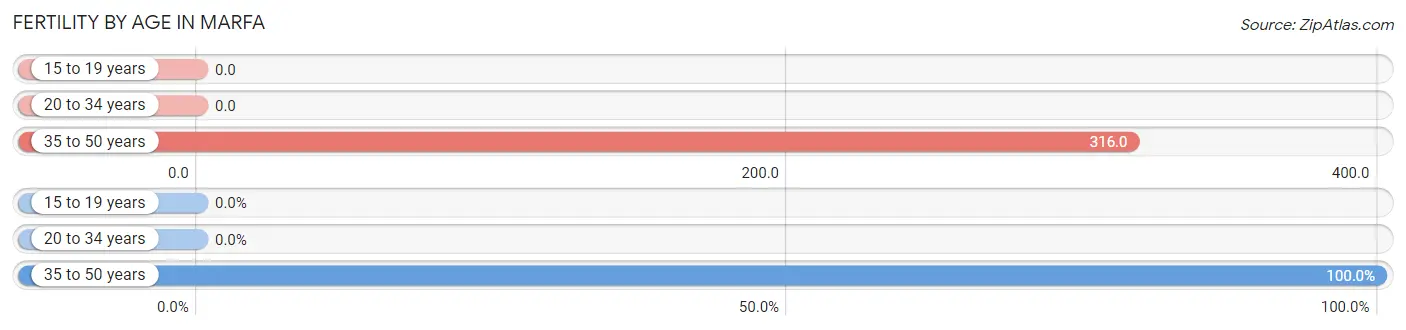
| Age Bracket | Women with Births | Births / 1,000 Women |
| 15 to 19 years | 0 (0.0%) | 0.0 |
| 20 to 34 years | 0 (0.0%) | 0.0 |
| 35 to 50 years | 59 (100.0%) | 316.0 |
| Total | 59 (100.0%) | 269.0 |
Fertility by Age by Marriage Status in Marfa
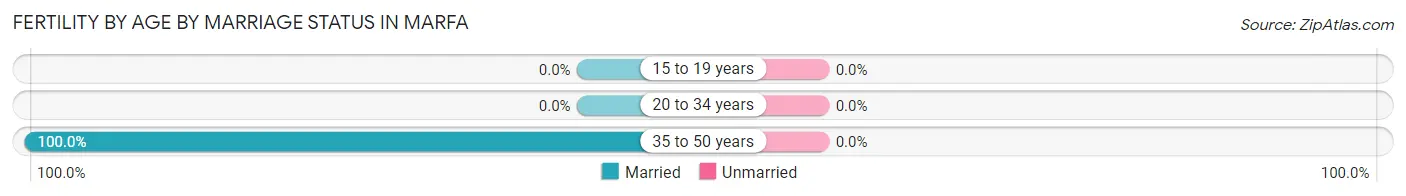
| Age Bracket | Married | Unmarried |
| 15 to 19 years | 0 (0.0%) | 0 (0.0%) |
| 20 to 34 years | 0 (0.0%) | 0 (0.0%) |
| 35 to 50 years | 59 (100.0%) | 0 (0.0%) |
| Total | 59 (100.0%) | 0 (0.0%) |
Fertility by Education in Marfa
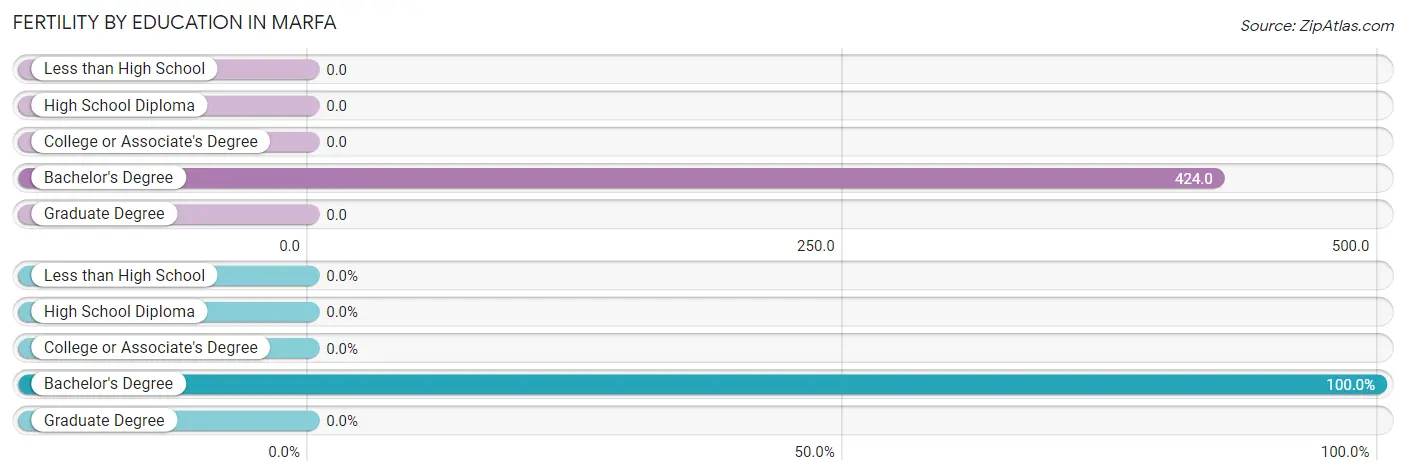
| Educational Attainment | Women with Births | Births / 1,000 Women |
| Less than High School | 0 (0.0%) | 0.0 |
| High School Diploma | 0 (0.0%) | 0.0 |
| College or Associate's Degree | 0 (0.0%) | 0.0 |
| Bachelor's Degree | 59 (100.0%) | 424.0 |
| Graduate Degree | 0 (0.0%) | 0.0 |
| Total | 59 (100.0%) | 269.0 |
Fertility by Education by Marriage Status in Marfa
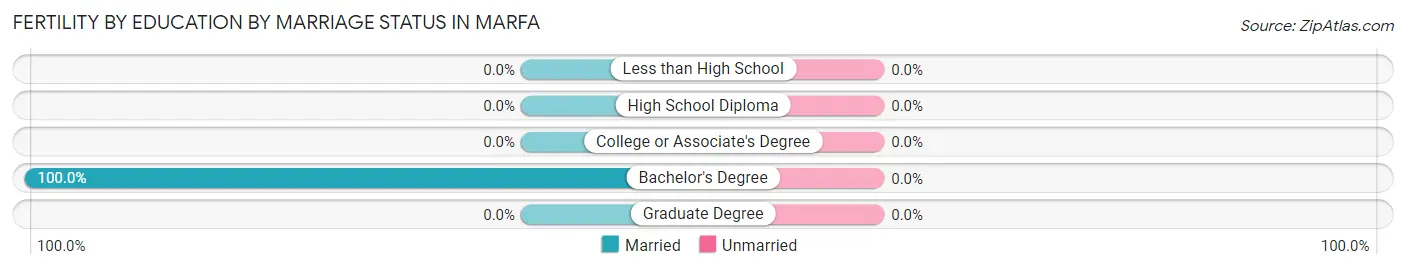
| Educational Attainment | Married | Unmarried |
| Less than High School | 0 (0.0%) | 0 (0.0%) |
| High School Diploma | 0 (0.0%) | 0 (0.0%) |
| College or Associate's Degree | 0 (0.0%) | 0 (0.0%) |
| Bachelor's Degree | 59 (100.0%) | 0 (0.0%) |
| Graduate Degree | 0 (0.0%) | 0 (0.0%) |
| Total | 59 (100.0%) | 0 (0.0%) |
Employment Characteristics in Marfa
Employment by Class of Employer in Marfa
Among the 1,300 employed individuals in Marfa, private company employees (387 | 29.8%), self-employed (not incorporated) (266 | 20.5%), and local government employees (261 | 20.1%) make up the most common classes of employment.
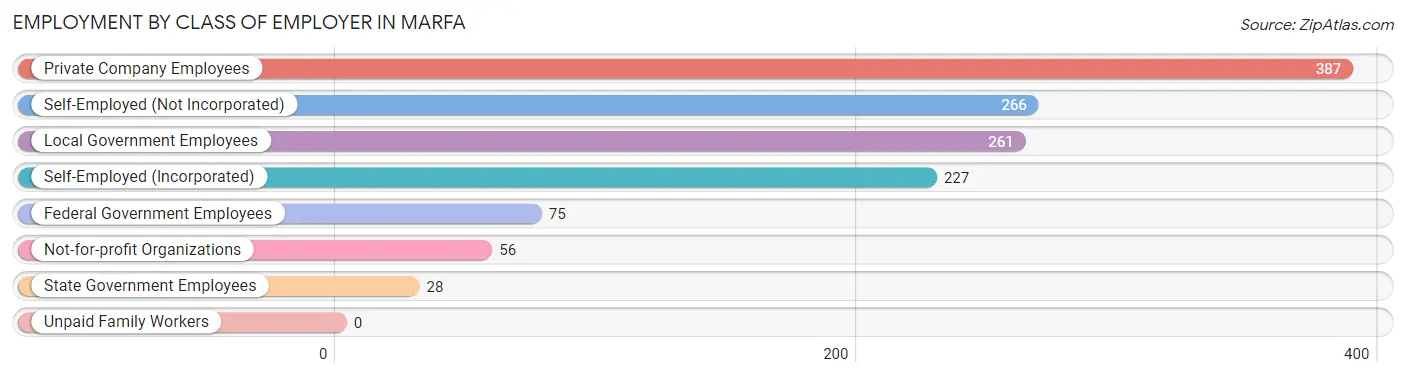
| Employer Class | # Employees | % Employees |
| Private Company Employees | 387 | 29.8% |
| Self-Employed (Incorporated) | 227 | 17.5% |
| Self-Employed (Not Incorporated) | 266 | 20.5% |
| Not-for-profit Organizations | 56 | 4.3% |
| Local Government Employees | 261 | 20.1% |
| State Government Employees | 28 | 2.1% |
| Federal Government Employees | 75 | 5.8% |
| Unpaid Family Workers | 0 | 0.0% |
| Total | 1,300 | 100.0% |
Employment Status by Age in Marfa
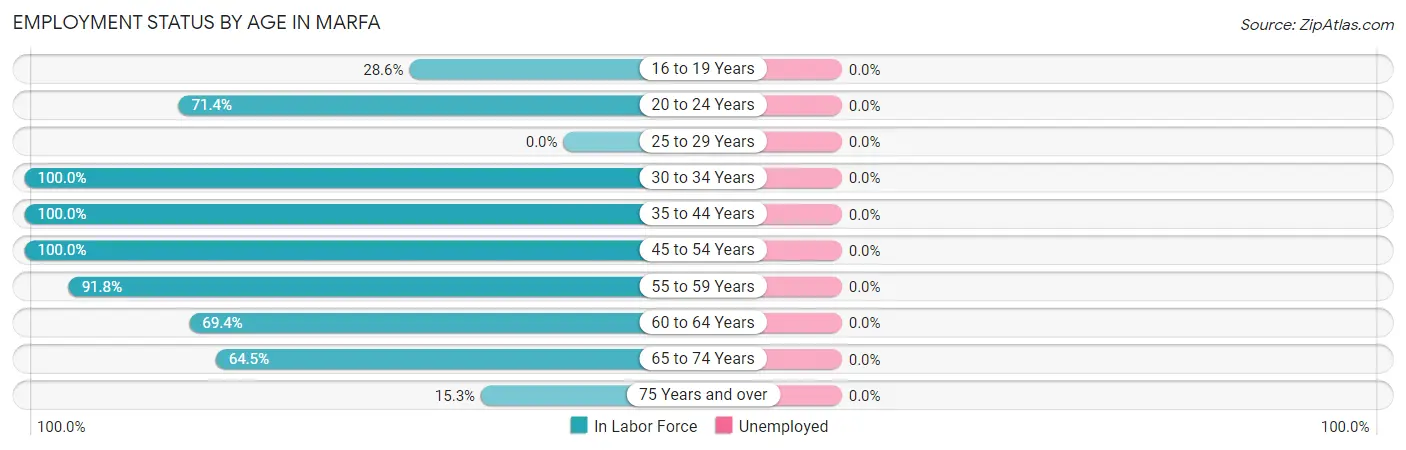
| Age Bracket | In Labor Force | Unemployed |
| 16 to 19 Years | 24 (28.6%) | 0 (0.0%) |
| 20 to 24 Years | 5 (71.4%) | 0 (0.0%) |
| 25 to 29 Years | 0 (0.0%) | 0 (0.0%) |
| 30 to 34 Years | 13 (100.0%) | 0 (0.0%) |
| 35 to 44 Years | 295 (100.0%) | 0 (0.0%) |
| 45 to 54 Years | 311 (100.0%) | 0 (0.0%) |
| 55 to 59 Years | 212 (91.8%) | 0 (0.0%) |
| 60 to 64 Years | 75 (69.4%) | 0 (0.0%) |
| 65 to 74 Years | 322 (64.5%) | 0 (0.0%) |
| 75 Years and over | 43 (15.3%) | 0 (0.0%) |
| Total | 1,300 (71.1%) | 0 (0.0%) |
Employment Status by Educational Attainment in Marfa
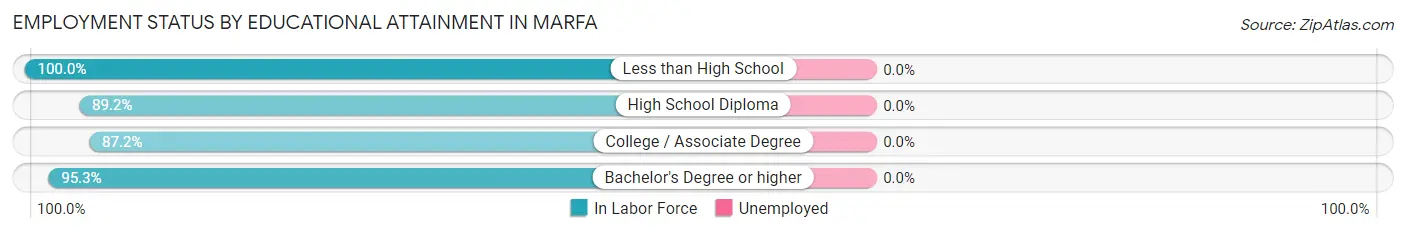
| Educational Attainment | In Labor Force | Unemployed |
| Less than High School | 282 (100.0%) | 0 (0.0%) |
| High School Diploma | 91 (89.2%) | 0 (0.0%) |
| College / Associate Degree | 150 (87.2%) | 0 (0.0%) |
| Bachelor's Degree or higher | 383 (95.3%) | 0 (0.0%) |
| Total | 906 (94.6%) | 0 (0.0%) |
Employment Occupations by Sex in Marfa
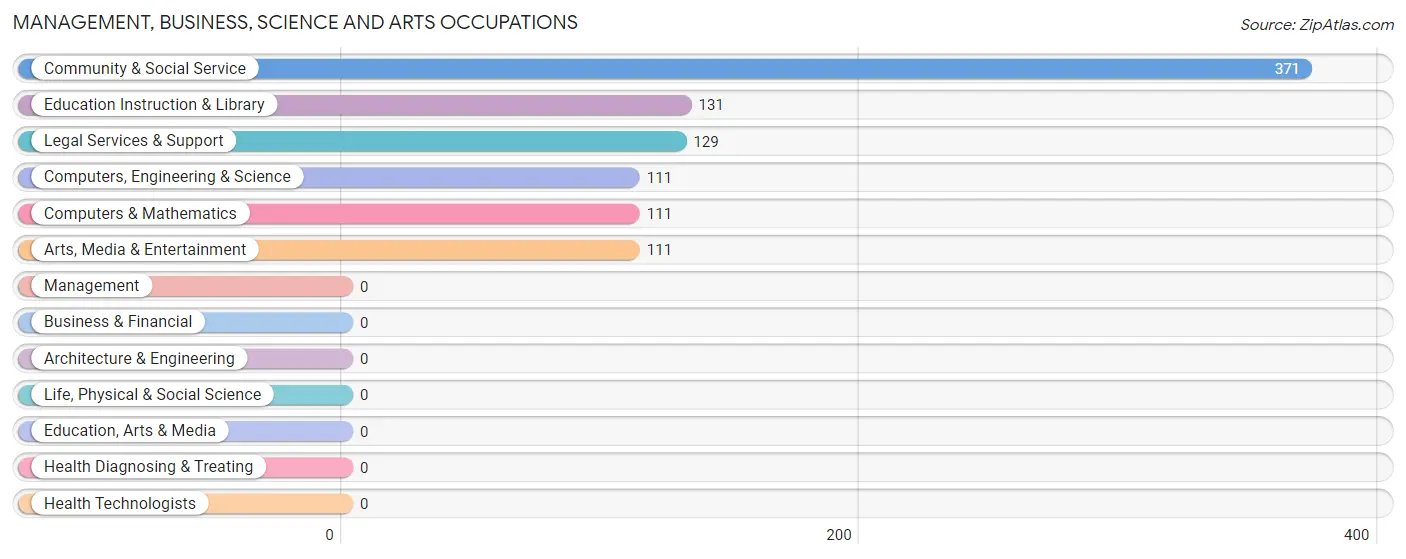
Management, Business, Science and Arts Occupations
The most common Management, Business, Science and Arts occupations in Marfa are Community & Social Service (371 | 28.5%), Education Instruction & Library (131 | 10.1%), Legal Services & Support (129 | 9.9%), Computers, Engineering & Science (111 | 8.5%), and Computers & Mathematics (111 | 8.5%).
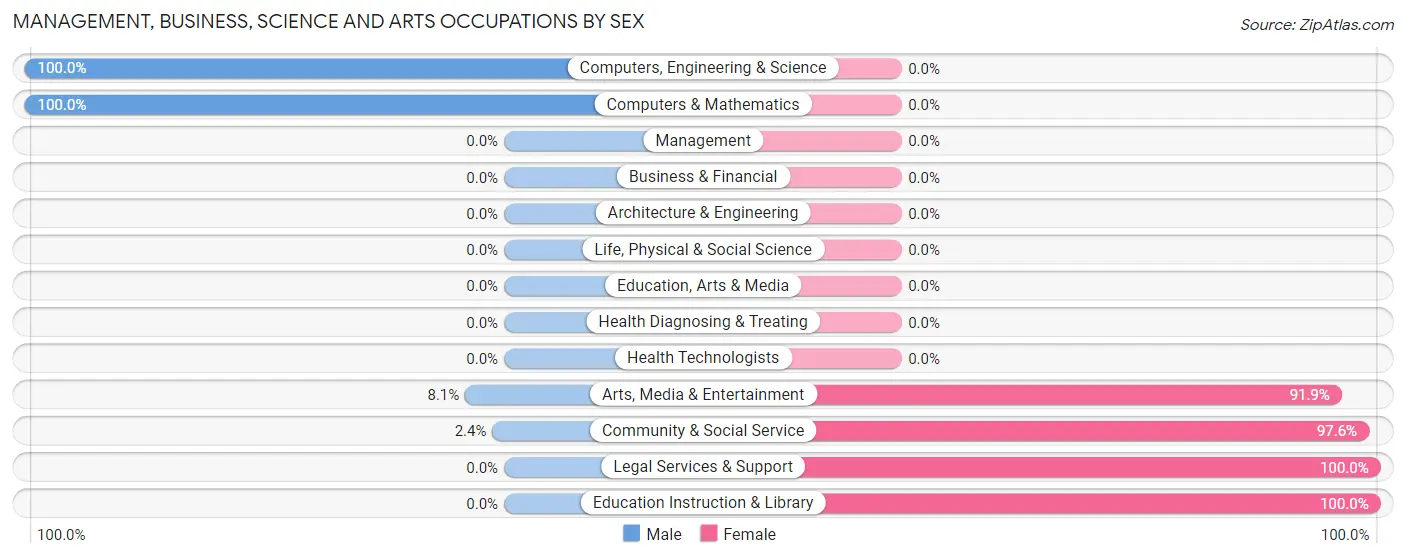
Management, Business, Science and Arts Occupations by Sex
Within the Management, Business, Science and Arts occupations in Marfa, the most male-oriented occupations are Computers, Engineering & Science (100.0%), Computers & Mathematics (100.0%), and Arts, Media & Entertainment (8.1%), while the most female-oriented occupations are Legal Services & Support (100.0%), Education Instruction & Library (100.0%), and Community & Social Service (97.6%).
| Occupation | Male | Female |
| Management | 0 (0.0%) | 0 (0.0%) |
| Business & Financial | 0 (0.0%) | 0 (0.0%) |
| Computers, Engineering & Science | 111 (100.0%) | 0 (0.0%) |
| Computers & Mathematics | 111 (100.0%) | 0 (0.0%) |
| Architecture & Engineering | 0 (0.0%) | 0 (0.0%) |
| Life, Physical & Social Science | 0 (0.0%) | 0 (0.0%) |
| Community & Social Service | 9 (2.4%) | 362 (97.6%) |
| Education, Arts & Media | 0 (0.0%) | 0 (0.0%) |
| Legal Services & Support | 0 (0.0%) | 129 (100.0%) |
| Education Instruction & Library | 0 (0.0%) | 131 (100.0%) |
| Arts, Media & Entertainment | 9 (8.1%) | 102 (91.9%) |
| Health Diagnosing & Treating | 0 (0.0%) | 0 (0.0%) |
| Health Technologists | 0 (0.0%) | 0 (0.0%) |
| Total (Category) | 120 (24.9%) | 362 (75.1%) |
| Total (Overall) | 752 (57.9%) | 548 (42.1%) |
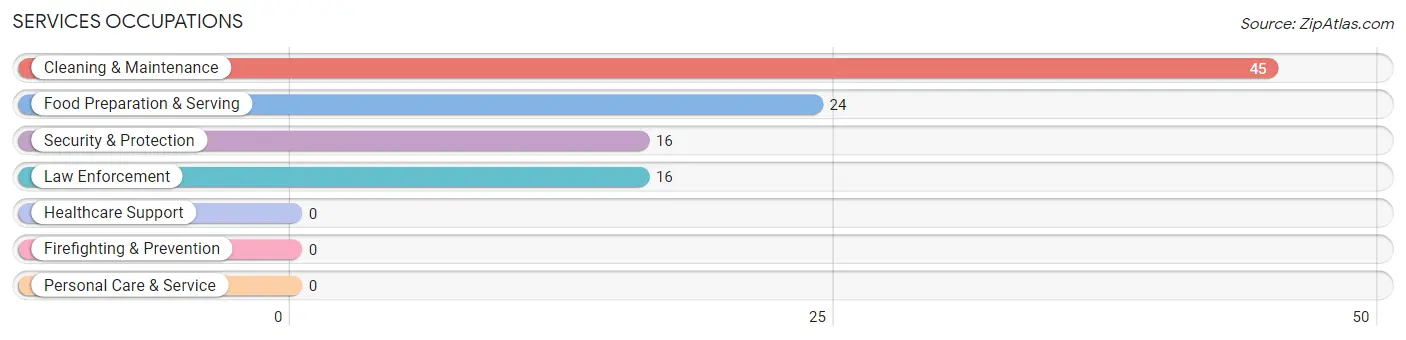
Services Occupations
The most common Services occupations in Marfa are Cleaning & Maintenance (45 | 3.5%), Food Preparation & Serving (24 | 1.8%), Security & Protection (16 | 1.2%), and Law Enforcement (16 | 1.2%).
Services Occupations by Sex
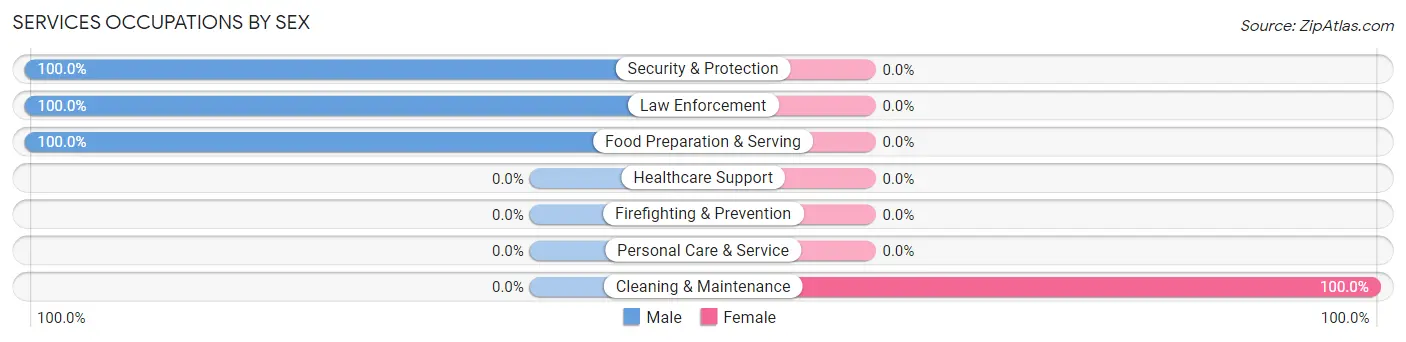
| Occupation | Male | Female |
| Healthcare Support | 0 (0.0%) | 0 (0.0%) |
| Security & Protection | 16 (100.0%) | 0 (0.0%) |
| Firefighting & Prevention | 0 (0.0%) | 0 (0.0%) |
| Law Enforcement | 16 (100.0%) | 0 (0.0%) |
| Food Preparation & Serving | 24 (100.0%) | 0 (0.0%) |
| Cleaning & Maintenance | 0 (0.0%) | 45 (100.0%) |
| Personal Care & Service | 0 (0.0%) | 0 (0.0%) |
| Total (Category) | 40 (47.1%) | 45 (52.9%) |
| Total (Overall) | 752 (57.9%) | 548 (42.1%) |
Sales and Office Occupations
The most common Sales and Office occupations in Marfa are Sales & Related (89 | 6.9%), and Office & Administration (66 | 5.1%).

Sales and Office Occupations by Sex

| Occupation | Male | Female |
| Sales & Related | 47 (52.8%) | 42 (47.2%) |
| Office & Administration | 13 (19.7%) | 53 (80.3%) |
| Total (Category) | 60 (38.7%) | 95 (61.3%) |
| Total (Overall) | 752 (57.9%) | 548 (42.1%) |
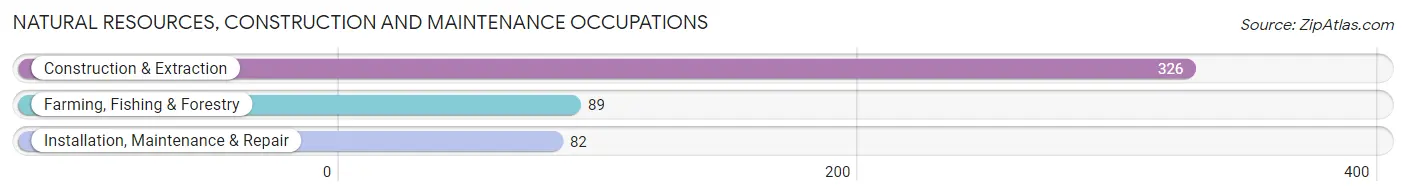
Natural Resources, Construction and Maintenance Occupations
The most common Natural Resources, Construction and Maintenance occupations in Marfa are Construction & Extraction (326 | 25.1%), Farming, Fishing & Forestry (89 | 6.9%), and Installation, Maintenance & Repair (82 | 6.3%).
Natural Resources, Construction and Maintenance Occupations by Sex
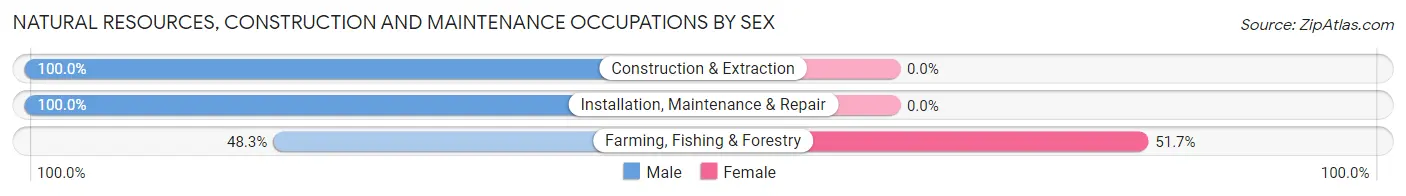
| Occupation | Male | Female |
| Farming, Fishing & Forestry | 43 (48.3%) | 46 (51.7%) |
| Construction & Extraction | 326 (100.0%) | 0 (0.0%) |
| Installation, Maintenance & Repair | 82 (100.0%) | 0 (0.0%) |
| Total (Category) | 451 (90.7%) | 46 (9.3%) |
| Total (Overall) | 752 (57.9%) | 548 (42.1%) |
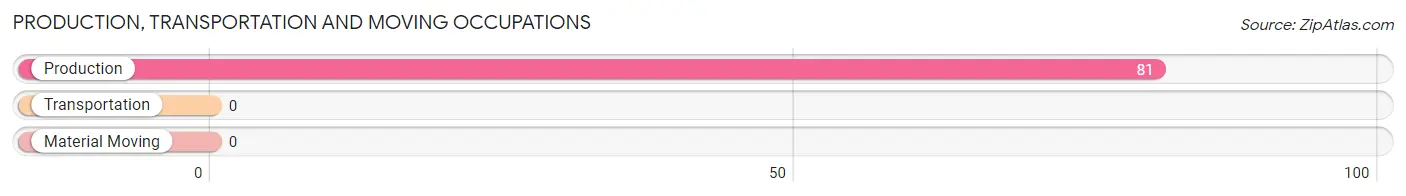
Production, Transportation and Moving Occupations
The most common Production, Transportation and Moving occupations in Marfa are , and Production (81 | 6.2%).
Production, Transportation and Moving Occupations by Sex
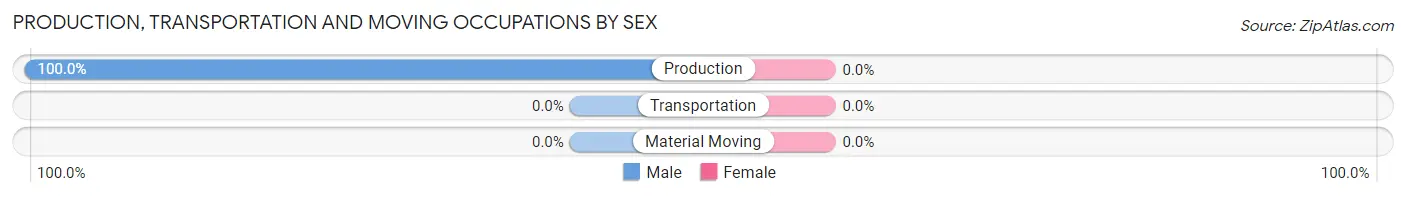
| Occupation | Male | Female |
| Production | 81 (100.0%) | 0 (0.0%) |
| Transportation | 0 (0.0%) | 0 (0.0%) |
| Material Moving | 0 (0.0%) | 0 (0.0%) |
| Total (Category) | 81 (100.0%) | 0 (0.0%) |
| Total (Overall) | 752 (57.9%) | 548 (42.1%) |
Employment Industries by Sex in Marfa
Employment Industries in Marfa
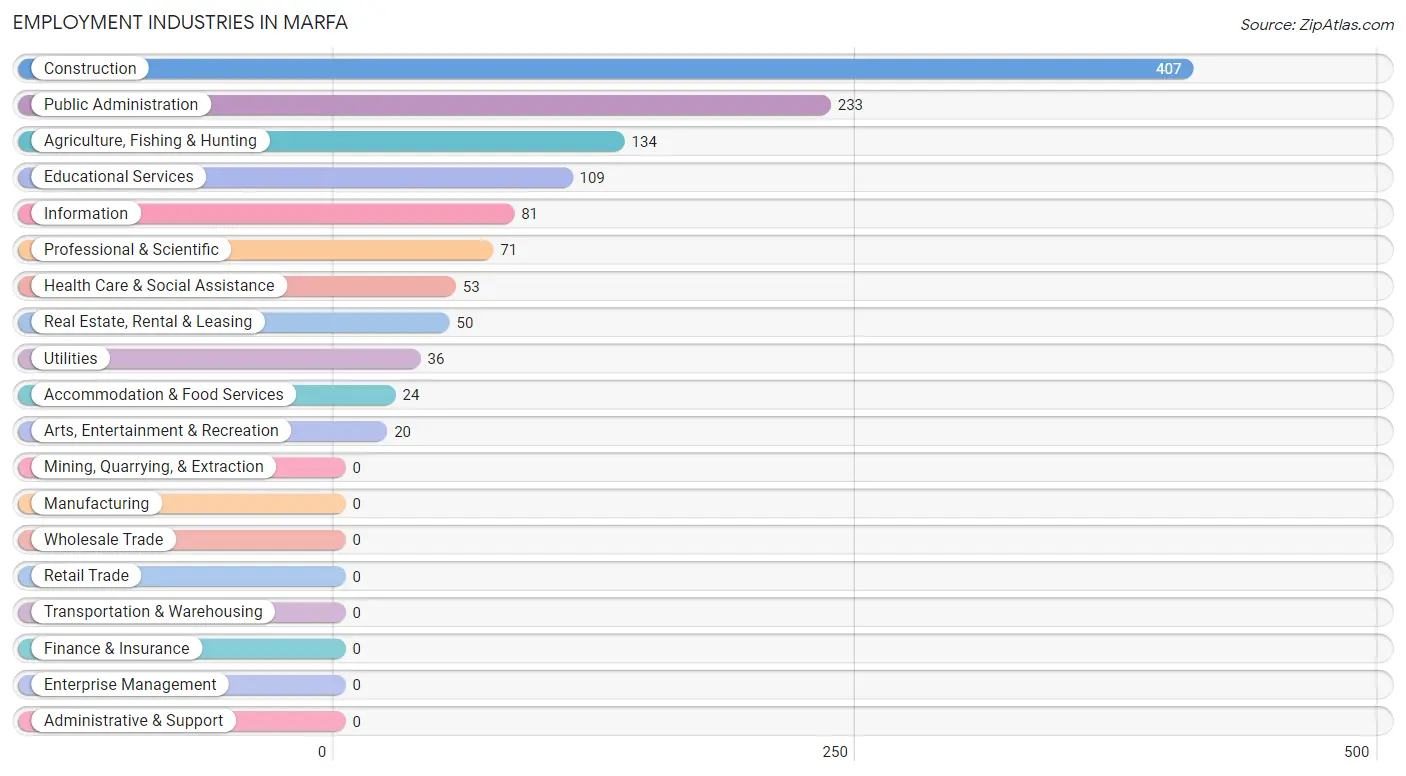
The major employment industries in Marfa include Construction (407 | 31.3%), Public Administration (233 | 17.9%), Agriculture, Fishing & Hunting (134 | 10.3%), Educational Services (109 | 8.4%), and Information (81 | 6.2%).
Employment Industries by Sex in Marfa
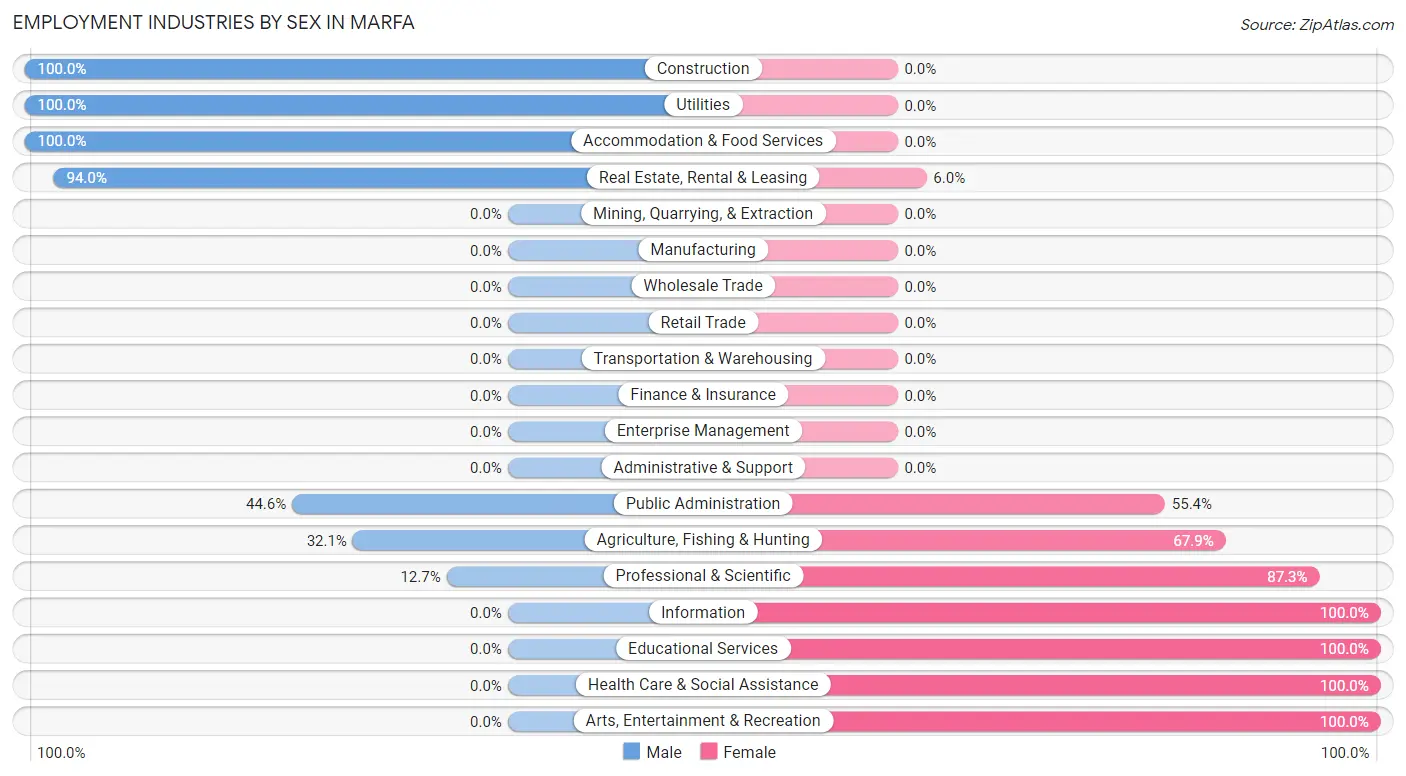
The Marfa industries that see more men than women are Construction (100.0%), Utilities (100.0%), and Accommodation & Food Services (100.0%), whereas the industries that tend to have a higher number of women are Information (100.0%), Educational Services (100.0%), and Health Care & Social Assistance (100.0%).
| Industry | Male | Female |
| Agriculture, Fishing & Hunting | 43 (32.1%) | 91 (67.9%) |
| Mining, Quarrying, & Extraction | 0 (0.0%) | 0 (0.0%) |
| Construction | 407 (100.0%) | 0 (0.0%) |
| Manufacturing | 0 (0.0%) | 0 (0.0%) |
| Wholesale Trade | 0 (0.0%) | 0 (0.0%) |
| Retail Trade | 0 (0.0%) | 0 (0.0%) |
| Transportation & Warehousing | 0 (0.0%) | 0 (0.0%) |
| Utilities | 36 (100.0%) | 0 (0.0%) |
| Information | 0 (0.0%) | 81 (100.0%) |
| Finance & Insurance | 0 (0.0%) | 0 (0.0%) |
| Real Estate, Rental & Leasing | 47 (94.0%) | 3 (6.0%) |
| Professional & Scientific | 9 (12.7%) | 62 (87.3%) |
| Enterprise Management | 0 (0.0%) | 0 (0.0%) |
| Administrative & Support | 0 (0.0%) | 0 (0.0%) |
| Educational Services | 0 (0.0%) | 109 (100.0%) |
| Health Care & Social Assistance | 0 (0.0%) | 53 (100.0%) |
| Arts, Entertainment & Recreation | 0 (0.0%) | 20 (100.0%) |
| Accommodation & Food Services | 24 (100.0%) | 0 (0.0%) |
| Public Administration | 104 (44.6%) | 129 (55.4%) |
| Total | 752 (57.9%) | 548 (42.1%) |
Education in Marfa
School Enrollment in Marfa
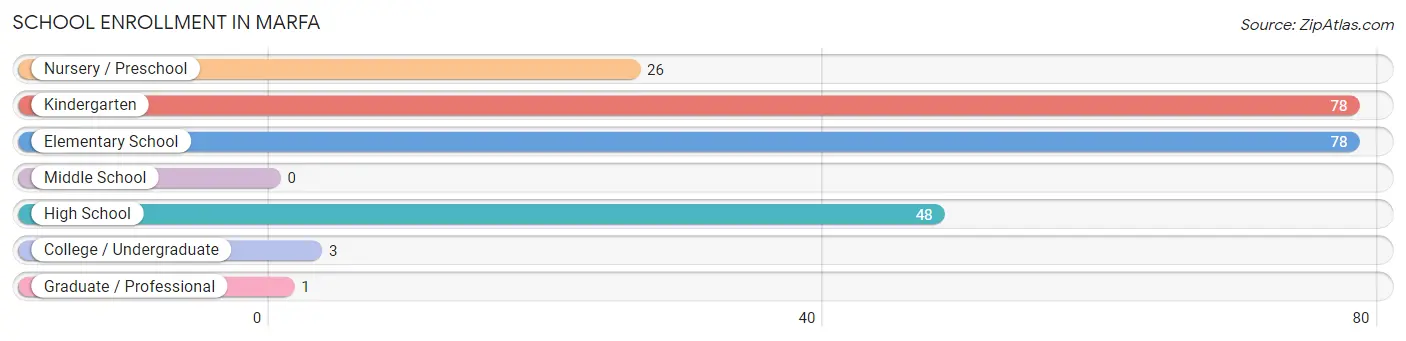
The most common levels of schooling among the 234 students in Marfa are kindergarten (78 | 33.3%), elementary school (78 | 33.3%), and high school (48 | 20.5%).
| School Level | # Students | % Students |
| Nursery / Preschool | 26 | 11.1% |
| Kindergarten | 78 | 33.3% |
| Elementary School | 78 | 33.3% |
| Middle School | 0 | 0.0% |
| High School | 48 | 20.5% |
| College / Undergraduate | 3 | 1.3% |
| Graduate / Professional | 1 | 0.4% |
| Total | 234 | 100.0% |
School Enrollment by Age by Funding Source in Marfa
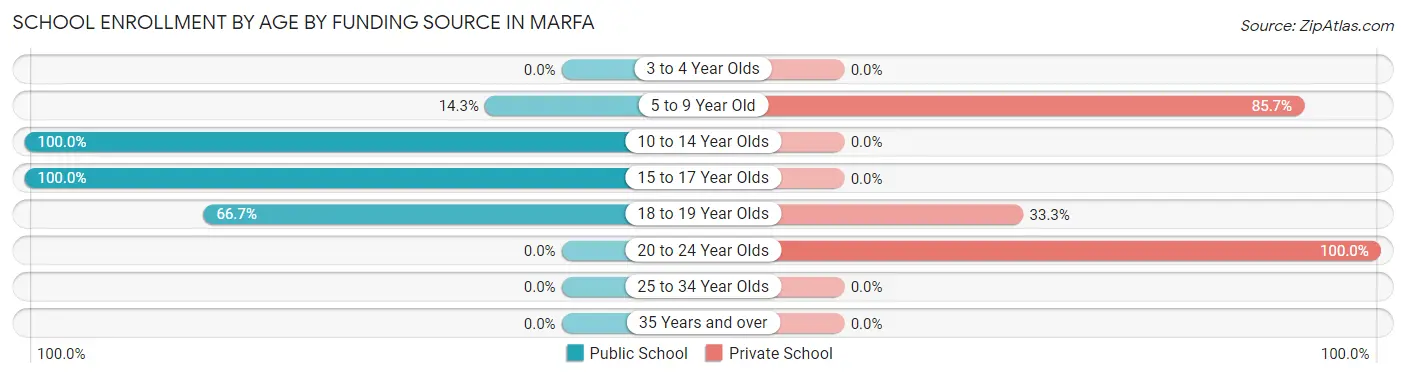
Out of a total of 234 students who are enrolled in schools in Marfa, 158 (67.5%) attend a private institution, while the remaining 76 (32.5%) are enrolled in public schools. The age group of 20 to 24 year olds has the highest likelihood of being enrolled in private schools, with 1 (100.0% in the age bracket) enrolled. Conversely, the age group of 10 to 14 year olds has the lowest likelihood of being enrolled in a private school, with 13 (100.0% in the age bracket) attending a public institution.
| Age Bracket | Public School | Private School |
| 3 to 4 Year Olds | 0 (0.0%) | 0 (0.0%) |
| 5 to 9 Year Old | 26 (14.3%) | 156 (85.7%) |
| 10 to 14 Year Olds | 13 (100.0%) | 0 (0.0%) |
| 15 to 17 Year Olds | 35 (100.0%) | 0 (0.0%) |
| 18 to 19 Year Olds | 2 (66.7%) | 1 (33.3%) |
| 20 to 24 Year Olds | 0 (0.0%) | 1 (100.0%) |
| 25 to 34 Year Olds | 0 (0.0%) | 0 (0.0%) |
| 35 Years and over | 0 (0.0%) | 0 (0.0%) |
| Total | 76 (32.5%) | 158 (67.5%) |
Educational Attainment by Field of Study in Marfa
Literature & languages (181 | 35.5%), visual & performing arts (159 | 31.2%), education (55 | 10.8%), arts & humanities (37 | 7.2%), and social sciences (36 | 7.1%) are the most common fields of study among 510 individuals in Marfa who have obtained a bachelor's degree or higher.
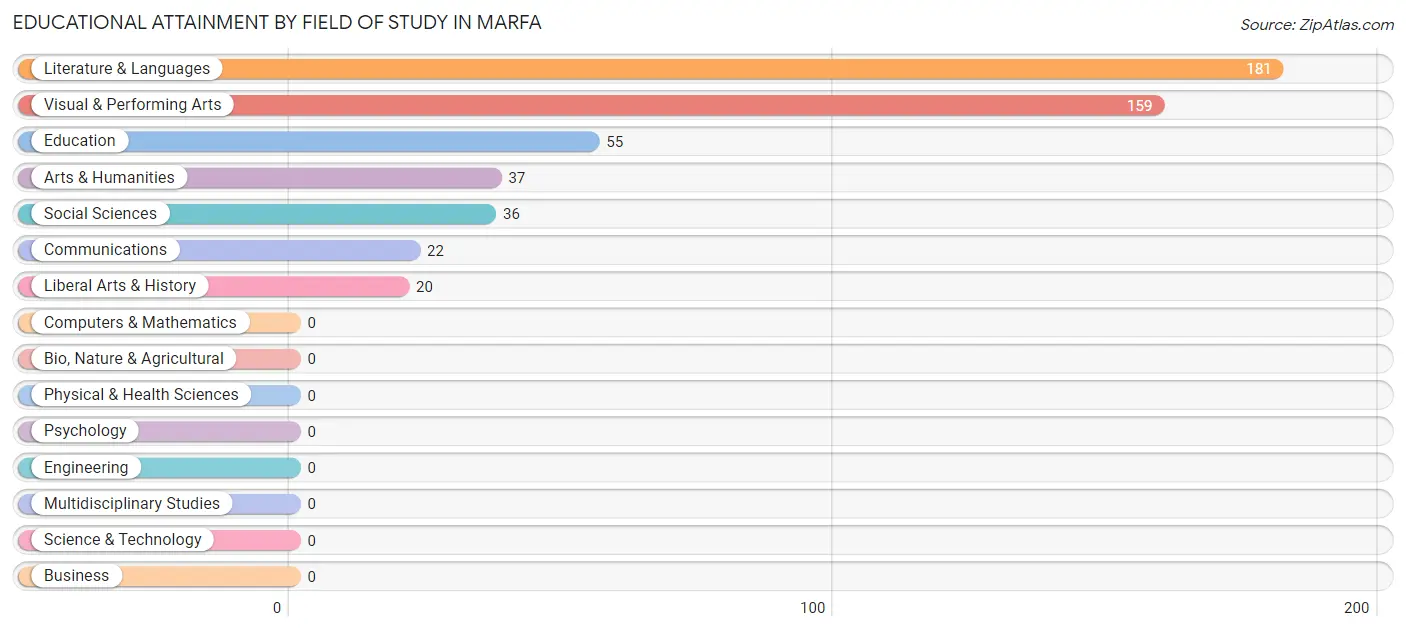
| Field of Study | # Graduates | % Graduates |
| Computers & Mathematics | 0 | 0.0% |
| Bio, Nature & Agricultural | 0 | 0.0% |
| Physical & Health Sciences | 0 | 0.0% |
| Psychology | 0 | 0.0% |
| Social Sciences | 36 | 7.1% |
| Engineering | 0 | 0.0% |
| Multidisciplinary Studies | 0 | 0.0% |
| Science & Technology | 0 | 0.0% |
| Business | 0 | 0.0% |
| Education | 55 | 10.8% |
| Literature & Languages | 181 | 35.5% |
| Liberal Arts & History | 20 | 3.9% |
| Visual & Performing Arts | 159 | 31.2% |
| Communications | 22 | 4.3% |
| Arts & Humanities | 37 | 7.2% |
| Total | 510 | 100.0% |
Transportation & Commute in Marfa
Vehicle Availability by Sex in Marfa
The most prevalent vehicle ownership categories in Marfa are males with 1 vehicle (278, accounting for 37.0%) and females with 1 vehicle (208, making up 50.7%).
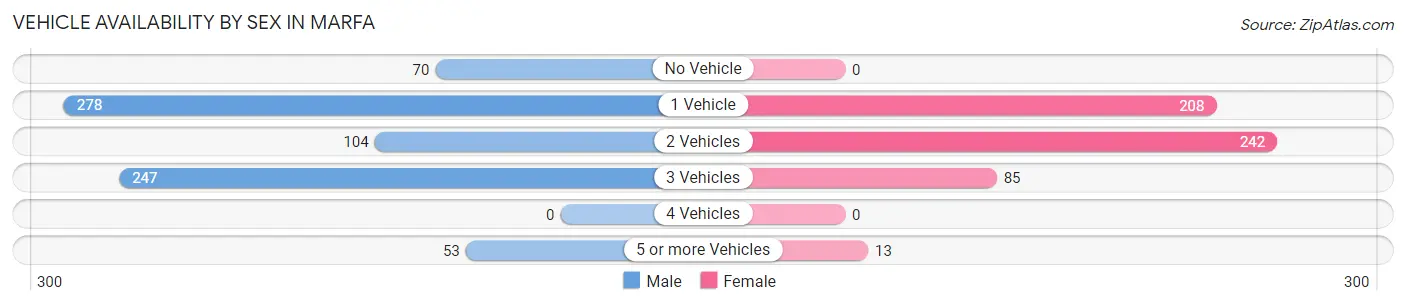
| Vehicles Available | Male | Female |
| No Vehicle | 70 (9.3%) | 0 (0.0%) |
| 1 Vehicle | 278 (37.0%) | 208 (38.0%) |
| 2 Vehicles | 104 (13.8%) | 242 (44.2%) |
| 3 Vehicles | 247 (32.9%) | 85 (15.5%) |
| 4 Vehicles | 0 (0.0%) | 0 (0.0%) |
| 5 or more Vehicles | 53 (7.0%) | 13 (2.4%) |
| Total | 752 (100.0%) | 548 (100.0%) |
Commute Time in Marfa
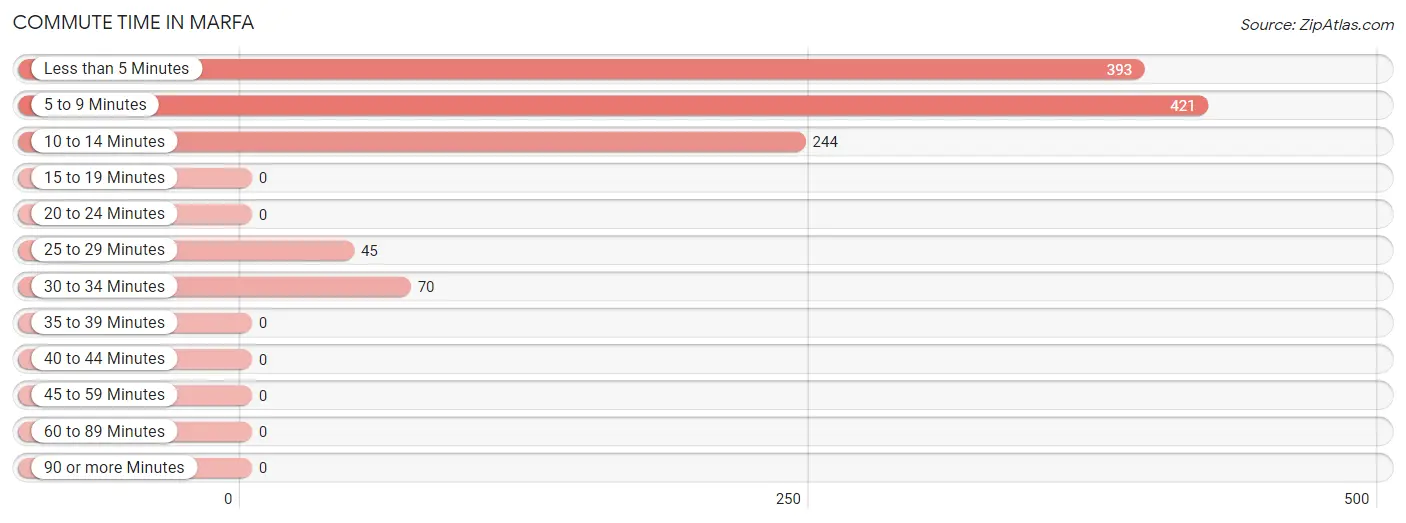
The most frequently occuring commute durations in Marfa are 5 to 9 minutes (421 commuters, 35.9%), less than 5 minutes (393 commuters, 33.5%), and 10 to 14 minutes (244 commuters, 20.8%).
| Commute Time | # Commuters | % Commuters |
| Less than 5 Minutes | 393 | 33.5% |
| 5 to 9 Minutes | 421 | 35.9% |
| 10 to 14 Minutes | 244 | 20.8% |
| 15 to 19 Minutes | 0 | 0.0% |
| 20 to 24 Minutes | 0 | 0.0% |
| 25 to 29 Minutes | 45 | 3.8% |
| 30 to 34 Minutes | 70 | 6.0% |
| 35 to 39 Minutes | 0 | 0.0% |
| 40 to 44 Minutes | 0 | 0.0% |
| 45 to 59 Minutes | 0 | 0.0% |
| 60 to 89 Minutes | 0 | 0.0% |
| 90 or more Minutes | 0 | 0.0% |
Commute Time by Sex in Marfa
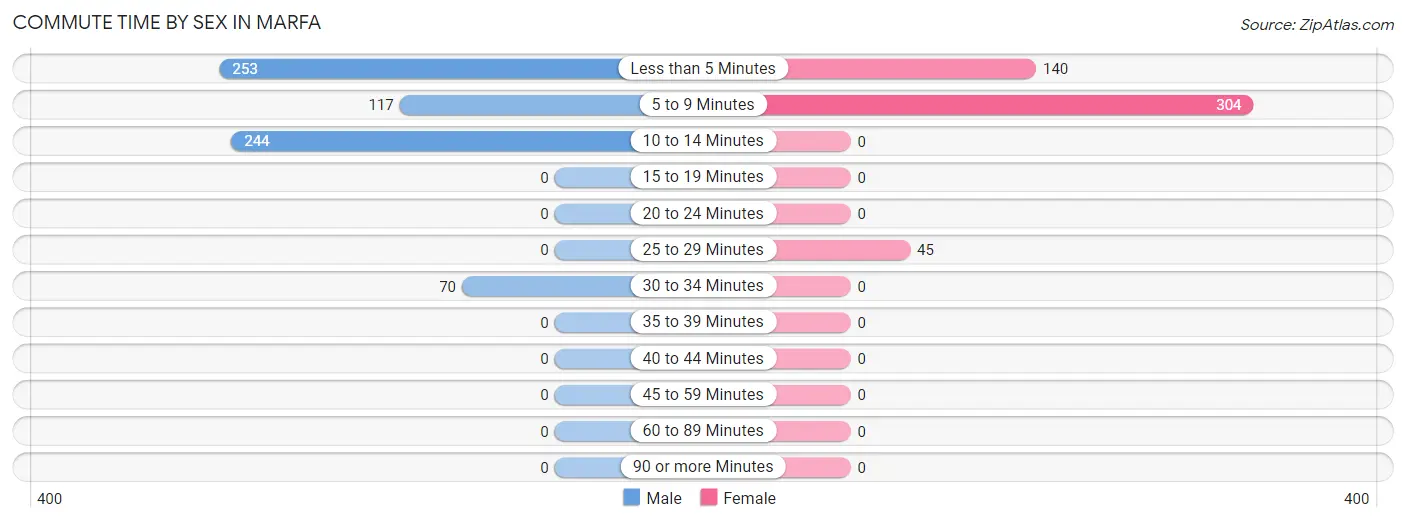
The most common commute times in Marfa are less than 5 minutes (253 commuters, 37.0%) for males and 5 to 9 minutes (304 commuters, 62.2%) for females.
| Commute Time | Male | Female |
| Less than 5 Minutes | 253 (37.0%) | 140 (28.6%) |
| 5 to 9 Minutes | 117 (17.1%) | 304 (62.2%) |
| 10 to 14 Minutes | 244 (35.7%) | 0 (0.0%) |
| 15 to 19 Minutes | 0 (0.0%) | 0 (0.0%) |
| 20 to 24 Minutes | 0 (0.0%) | 0 (0.0%) |
| 25 to 29 Minutes | 0 (0.0%) | 45 (9.2%) |
| 30 to 34 Minutes | 70 (10.2%) | 0 (0.0%) |
| 35 to 39 Minutes | 0 (0.0%) | 0 (0.0%) |
| 40 to 44 Minutes | 0 (0.0%) | 0 (0.0%) |
| 45 to 59 Minutes | 0 (0.0%) | 0 (0.0%) |
| 60 to 89 Minutes | 0 (0.0%) | 0 (0.0%) |
| 90 or more Minutes | 0 (0.0%) | 0 (0.0%) |
Time of Departure to Work by Sex in Marfa
The most frequent times of departure to work in Marfa are 8:00 AM to 8:29 AM (218, 31.9%) for males and 7:30 AM to 7:59 AM (265, 54.2%) for females.
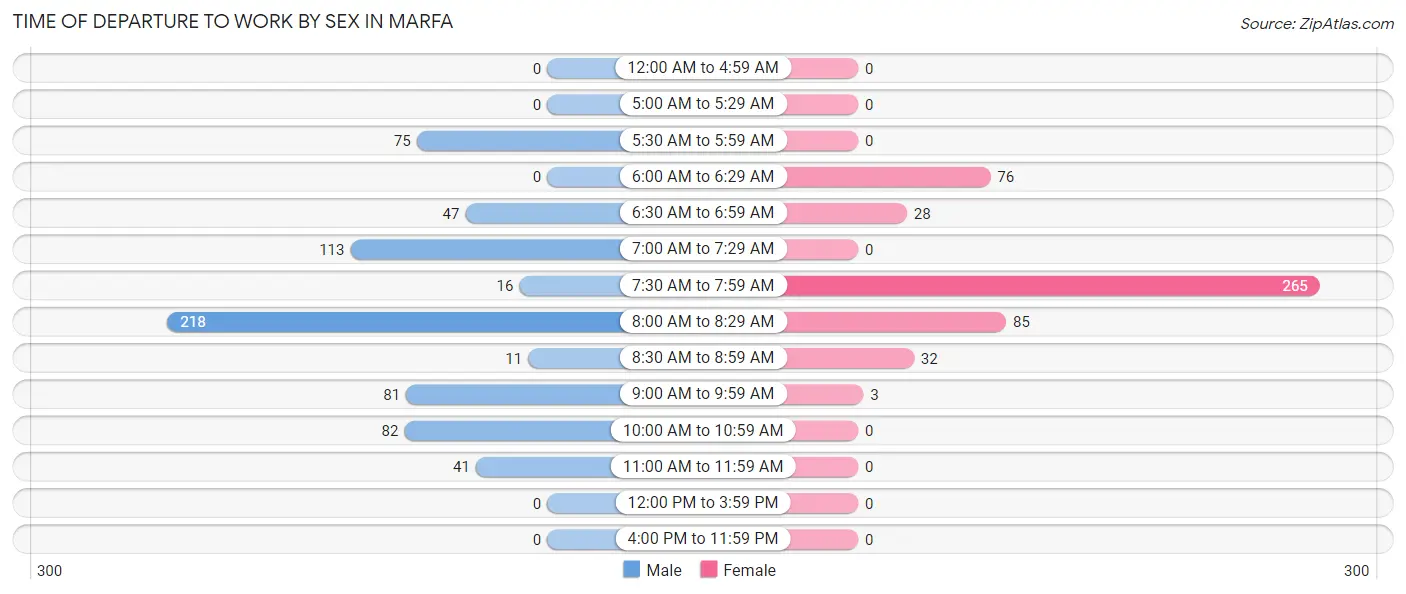
| Time of Departure | Male | Female |
| 12:00 AM to 4:59 AM | 0 (0.0%) | 0 (0.0%) |
| 5:00 AM to 5:29 AM | 0 (0.0%) | 0 (0.0%) |
| 5:30 AM to 5:59 AM | 75 (11.0%) | 0 (0.0%) |
| 6:00 AM to 6:29 AM | 0 (0.0%) | 76 (15.5%) |
| 6:30 AM to 6:59 AM | 47 (6.9%) | 28 (5.7%) |
| 7:00 AM to 7:29 AM | 113 (16.5%) | 0 (0.0%) |
| 7:30 AM to 7:59 AM | 16 (2.3%) | 265 (54.2%) |
| 8:00 AM to 8:29 AM | 218 (31.9%) | 85 (17.4%) |
| 8:30 AM to 8:59 AM | 11 (1.6%) | 32 (6.5%) |
| 9:00 AM to 9:59 AM | 81 (11.8%) | 3 (0.6%) |
| 10:00 AM to 10:59 AM | 82 (12.0%) | 0 (0.0%) |
| 11:00 AM to 11:59 AM | 41 (6.0%) | 0 (0.0%) |
| 12:00 PM to 3:59 PM | 0 (0.0%) | 0 (0.0%) |
| 4:00 PM to 11:59 PM | 0 (0.0%) | 0 (0.0%) |
| Total | 684 (100.0%) | 489 (100.0%) |
Housing Occupancy in Marfa
Occupancy by Ownership in Marfa
Of the total 1,139 dwellings in Marfa, owner-occupied units account for 869 (76.3%), while renter-occupied units make up 270 (23.7%).
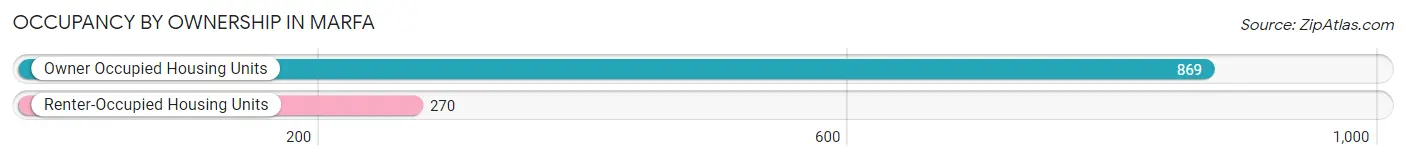
| Occupancy | # Housing Units | % Housing Units |
| Owner Occupied Housing Units | 869 | 76.3% |
| Renter-Occupied Housing Units | 270 | 23.7% |
| Total Occupied Housing Units | 1,139 | 100.0% |
Occupancy by Household Size in Marfa
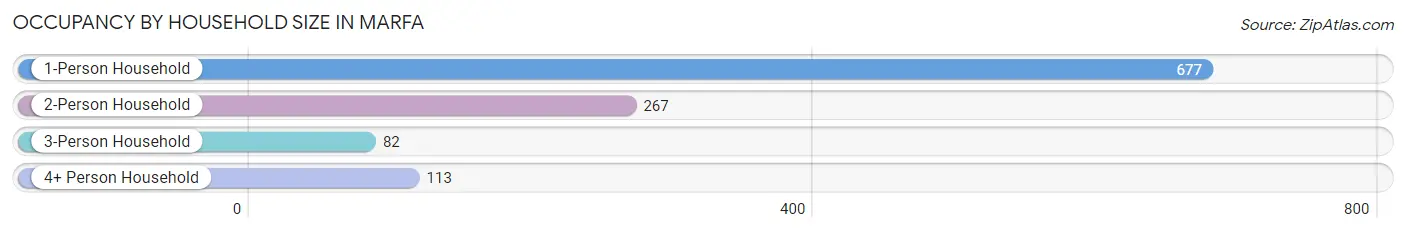
| Household Size | # Housing Units | % Housing Units |
| 1-Person Household | 677 | 59.4% |
| 2-Person Household | 267 | 23.4% |
| 3-Person Household | 82 | 7.2% |
| 4+ Person Household | 113 | 9.9% |
| Total Housing Units | 1,139 | 100.0% |
Occupancy by Ownership by Household Size in Marfa
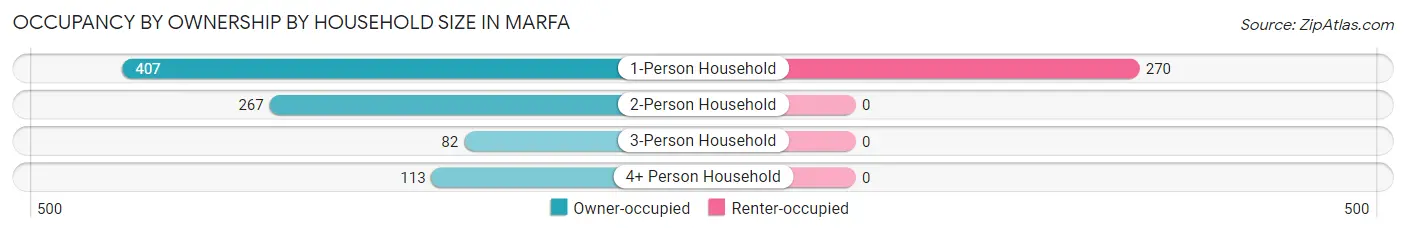
| Household Size | Owner-occupied | Renter-occupied |
| 1-Person Household | 407 (60.1%) | 270 (39.9%) |
| 2-Person Household | 267 (100.0%) | 0 (0.0%) |
| 3-Person Household | 82 (100.0%) | 0 (0.0%) |
| 4+ Person Household | 113 (100.0%) | 0 (0.0%) |
| Total Housing Units | 869 (76.3%) | 270 (23.7%) |
Occupancy by Educational Attainment in Marfa
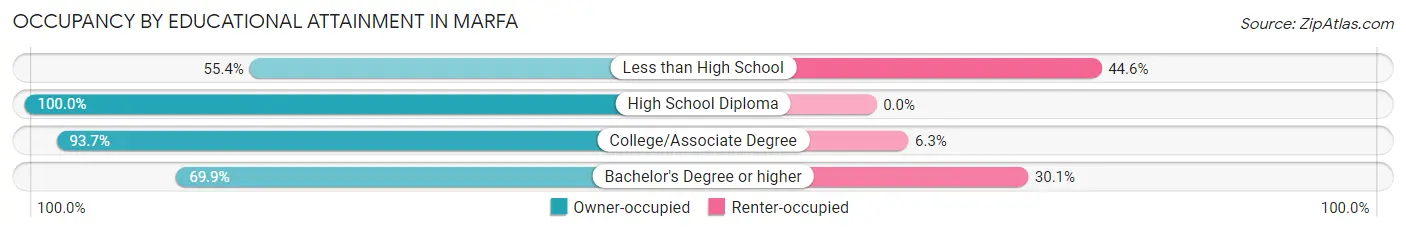
| Household Size | Owner-occupied | Renter-occupied |
| Less than High School | 175 (55.4%) | 141 (44.6%) |
| High School Diploma | 132 (100.0%) | 0 (0.0%) |
| College/Associate Degree | 311 (93.7%) | 21 (6.3%) |
| Bachelor's Degree or higher | 251 (69.9%) | 108 (30.1%) |
Occupancy by Age of Householder in Marfa
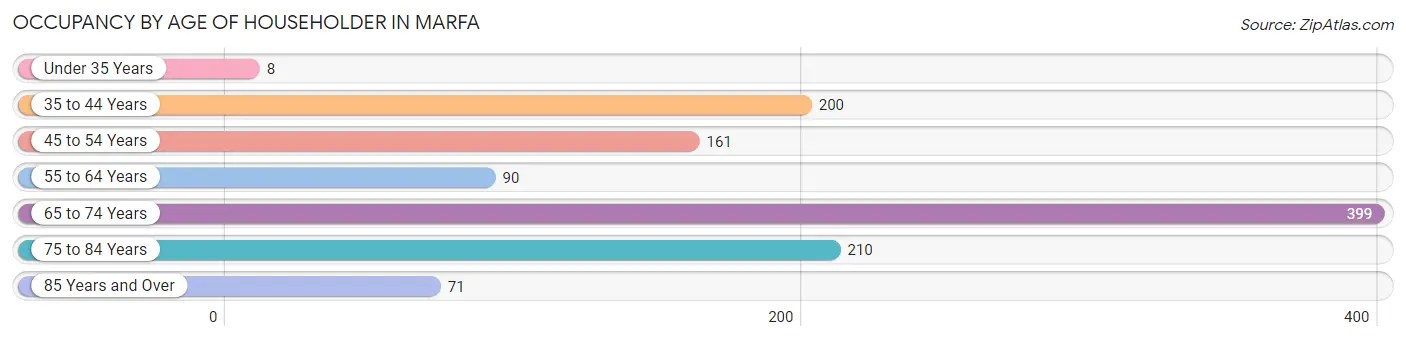
| Age Bracket | # Households | % Households |
| Under 35 Years | 8 | 0.7% |
| 35 to 44 Years | 200 | 17.6% |
| 45 to 54 Years | 161 | 14.1% |
| 55 to 64 Years | 90 | 7.9% |
| 65 to 74 Years | 399 | 35.0% |
| 75 to 84 Years | 210 | 18.4% |
| 85 Years and Over | 71 | 6.2% |
| Total | 1,139 | 100.0% |
Housing Finances in Marfa
Median Income by Occupancy in Marfa
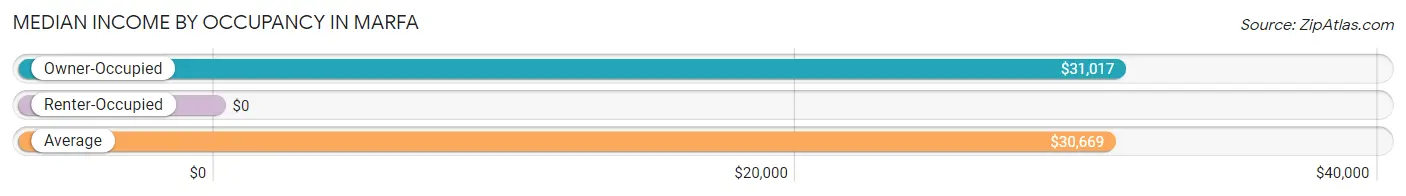
| Occupancy Type | # Households | Median Income |
| Owner-Occupied | 869 (76.3%) | $31,017 |
| Renter-Occupied | 270 (23.7%) | $0 |
| Average | 1,139 (100.0%) | $30,669 |
Occupancy by Householder Income Bracket in Marfa
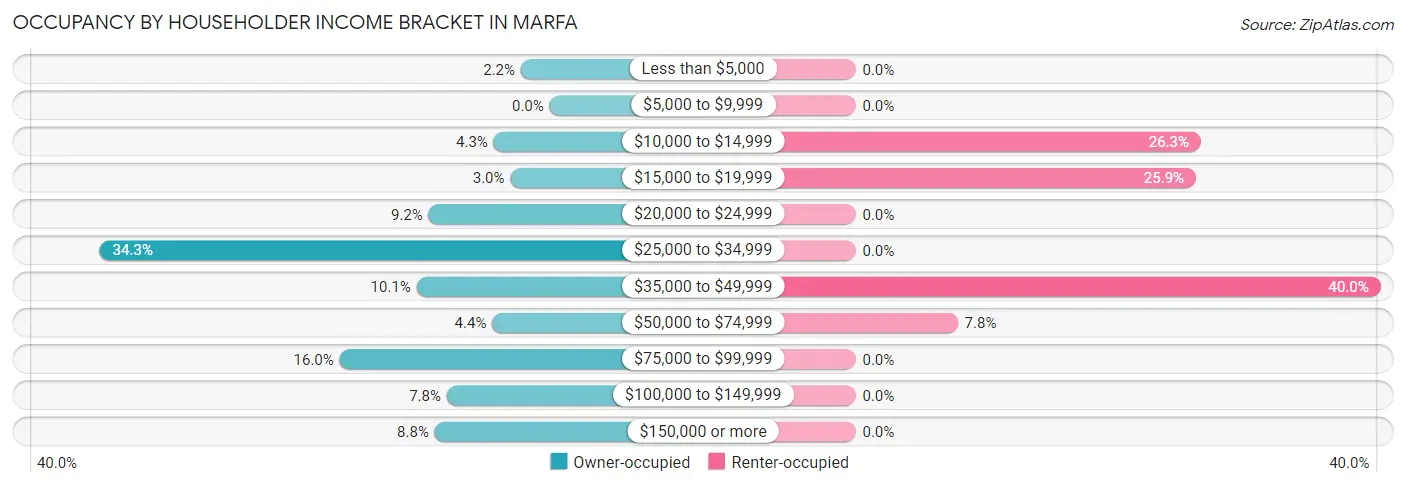
| Income Bracket | Owner-occupied | Renter-occupied |
| Less than $5,000 | 19 (2.2%) | 0 (0.0%) |
| $5,000 to $9,999 | 0 (0.0%) | 0 (0.0%) |
| $10,000 to $14,999 | 37 (4.3%) | 71 (26.3%) |
| $15,000 to $19,999 | 26 (3.0%) | 70 (25.9%) |
| $20,000 to $24,999 | 80 (9.2%) | 0 (0.0%) |
| $25,000 to $34,999 | 298 (34.3%) | 0 (0.0%) |
| $35,000 to $49,999 | 88 (10.1%) | 108 (40.0%) |
| $50,000 to $74,999 | 38 (4.4%) | 21 (7.8%) |
| $75,000 to $99,999 | 139 (16.0%) | 0 (0.0%) |
| $100,000 to $149,999 | 68 (7.8%) | 0 (0.0%) |
| $150,000 or more | 76 (8.7%) | 0 (0.0%) |
| Total | 869 (100.0%) | 270 (100.0%) |
Monthly Housing Cost Tiers in Marfa
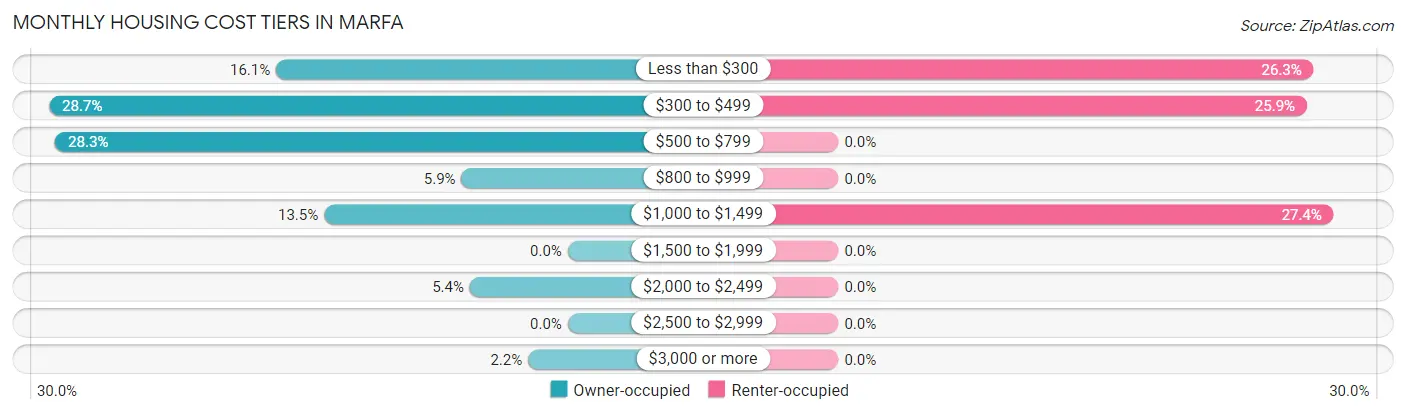
| Monthly Cost | Owner-occupied | Renter-occupied |
| Less than $300 | 140 (16.1%) | 71 (26.3%) |
| $300 to $499 | 249 (28.6%) | 70 (25.9%) |
| $500 to $799 | 246 (28.3%) | 0 (0.0%) |
| $800 to $999 | 51 (5.9%) | 0 (0.0%) |
| $1,000 to $1,499 | 117 (13.5%) | 74 (27.4%) |
| $1,500 to $1,999 | 0 (0.0%) | 0 (0.0%) |
| $2,000 to $2,499 | 47 (5.4%) | 0 (0.0%) |
| $2,500 to $2,999 | 0 (0.0%) | 0 (0.0%) |
| $3,000 or more | 19 (2.2%) | 0 (0.0%) |
| Total | 869 (100.0%) | 270 (100.0%) |
Physical Housing Characteristics in Marfa
Housing Structures in Marfa
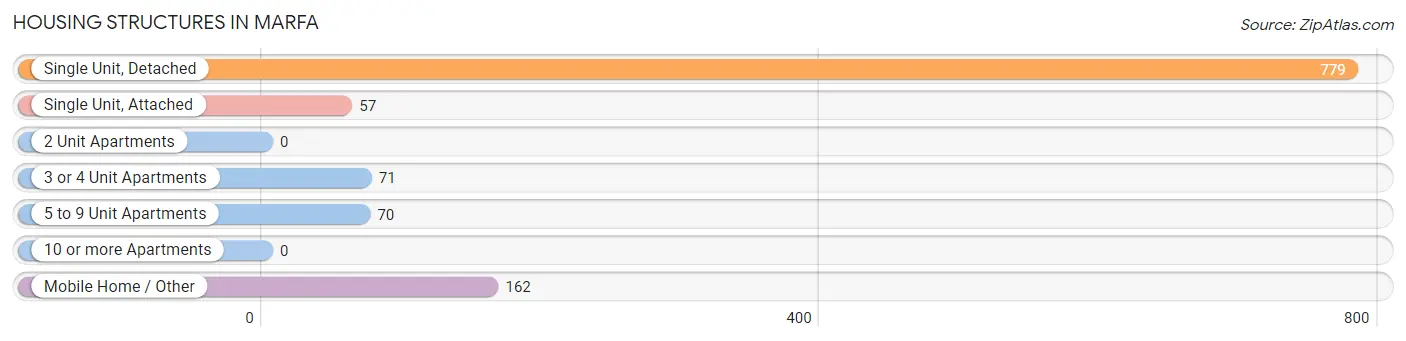
| Structure Type | # Housing Units | % Housing Units |
| Single Unit, Detached | 779 | 68.4% |
| Single Unit, Attached | 57 | 5.0% |
| 2 Unit Apartments | 0 | 0.0% |
| 3 or 4 Unit Apartments | 71 | 6.2% |
| 5 to 9 Unit Apartments | 70 | 6.1% |
| 10 or more Apartments | 0 | 0.0% |
| Mobile Home / Other | 162 | 14.2% |
| Total | 1,139 | 100.0% |
Housing Structures by Occupancy in Marfa
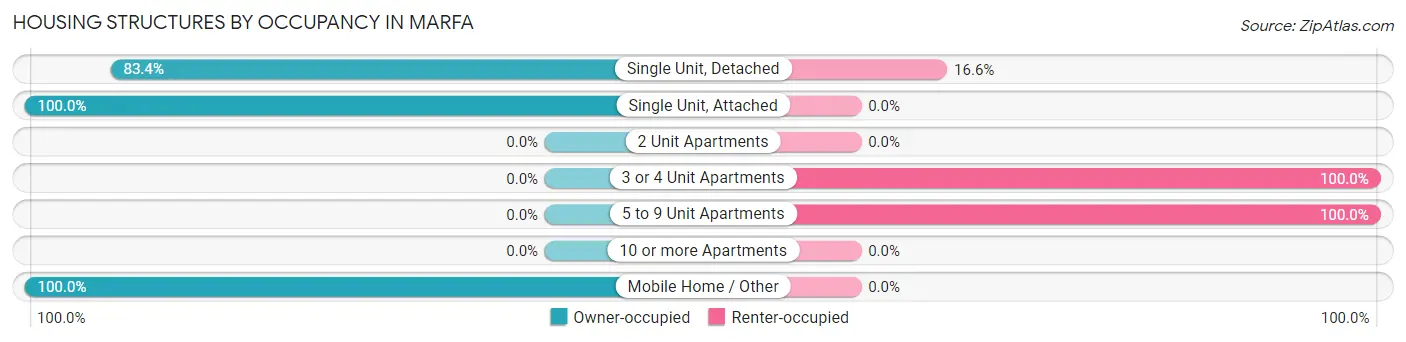
| Structure Type | Owner-occupied | Renter-occupied |
| Single Unit, Detached | 650 (83.4%) | 129 (16.6%) |
| Single Unit, Attached | 57 (100.0%) | 0 (0.0%) |
| 2 Unit Apartments | 0 (0.0%) | 0 (0.0%) |
| 3 or 4 Unit Apartments | 0 (0.0%) | 71 (100.0%) |
| 5 to 9 Unit Apartments | 0 (0.0%) | 70 (100.0%) |
| 10 or more Apartments | 0 (0.0%) | 0 (0.0%) |
| Mobile Home / Other | 162 (100.0%) | 0 (0.0%) |
| Total | 869 (76.3%) | 270 (23.7%) |
Housing Structures by Number of Rooms in Marfa
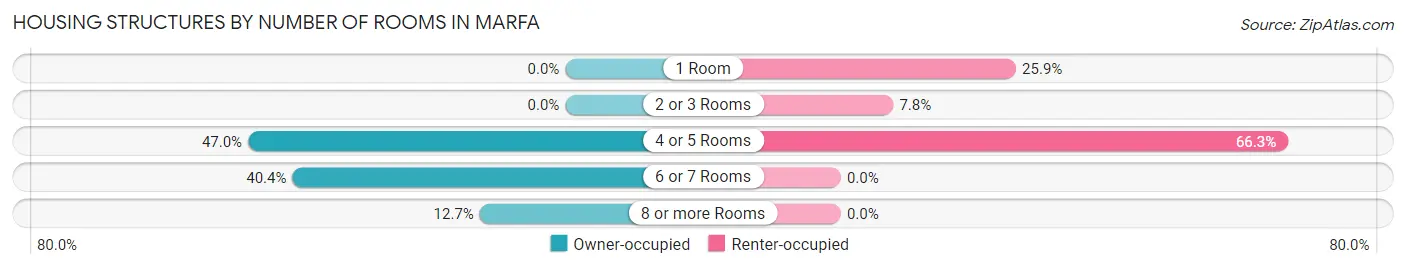
| Number of Rooms | Owner-occupied | Renter-occupied |
| 1 Room | 0 (0.0%) | 70 (25.9%) |
| 2 or 3 Rooms | 0 (0.0%) | 21 (7.8%) |
| 4 or 5 Rooms | 408 (46.9%) | 179 (66.3%) |
| 6 or 7 Rooms | 351 (40.4%) | 0 (0.0%) |
| 8 or more Rooms | 110 (12.7%) | 0 (0.0%) |
| Total | 869 (100.0%) | 270 (100.0%) |
Housing Structure by Heating Type in Marfa
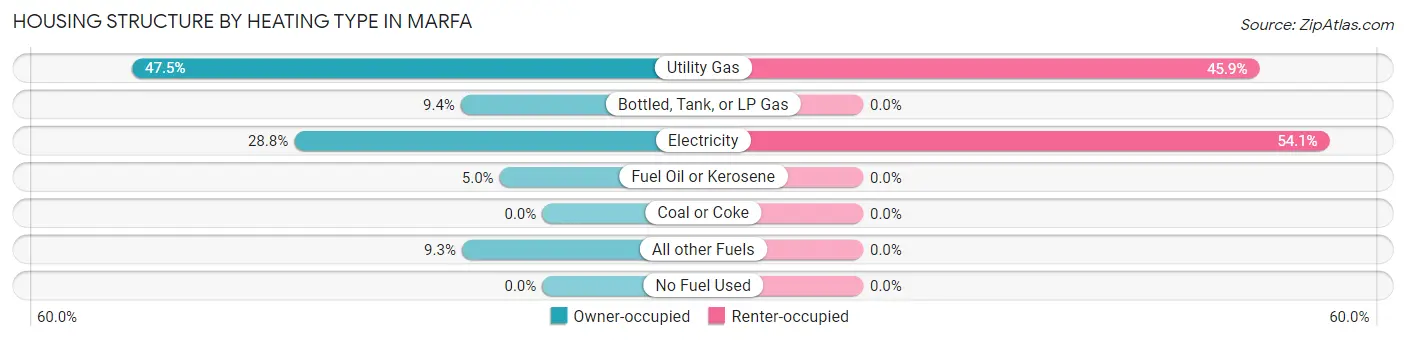
| Heating Type | Owner-occupied | Renter-occupied |
| Utility Gas | 413 (47.5%) | 124 (45.9%) |
| Bottled, Tank, or LP Gas | 82 (9.4%) | 0 (0.0%) |
| Electricity | 250 (28.8%) | 146 (54.1%) |
| Fuel Oil or Kerosene | 43 (5.0%) | 0 (0.0%) |
| Coal or Coke | 0 (0.0%) | 0 (0.0%) |
| All other Fuels | 81 (9.3%) | 0 (0.0%) |
| No Fuel Used | 0 (0.0%) | 0 (0.0%) |
| Total | 869 (100.0%) | 270 (100.0%) |
Household Vehicle Usage in Marfa
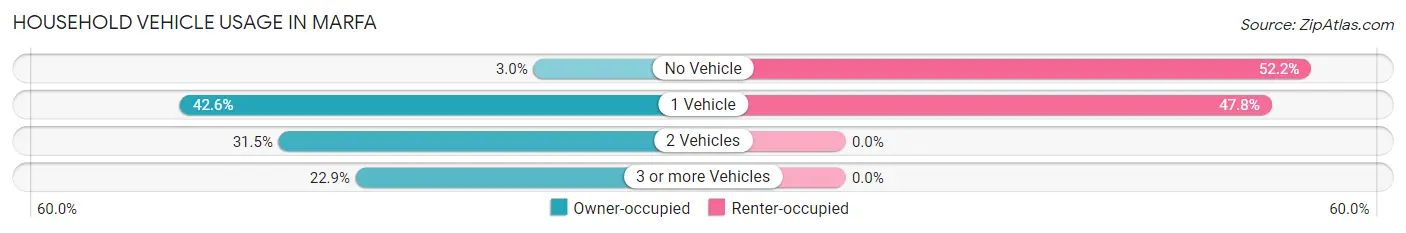
| Vehicles per Household | Owner-occupied | Renter-occupied |
| No Vehicle | 26 (3.0%) | 141 (52.2%) |
| 1 Vehicle | 370 (42.6%) | 129 (47.8%) |
| 2 Vehicles | 274 (31.5%) | 0 (0.0%) |
| 3 or more Vehicles | 199 (22.9%) | 0 (0.0%) |
| Total | 869 (100.0%) | 270 (100.0%) |
Real Estate & Mortgages in Marfa
Real Estate and Mortgage Overview in Marfa
| Characteristic | Without Mortgage | With Mortgage |
| Housing Units | 667 | 202 |
| Median Property Value | $141,900 | $356,800 |
| Median Household Income | $30,959 | $47 |
| Monthly Housing Costs | $475 | $19 |
| Real Estate Taxes | $2,151 | $0 |
Property Value by Mortgage Status in Marfa
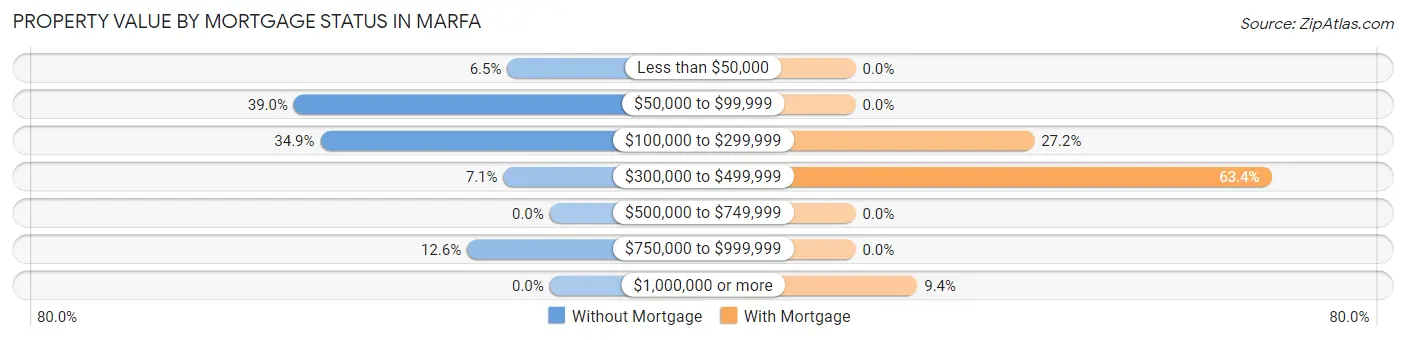
| Property Value | Without Mortgage | With Mortgage |
| Less than $50,000 | 43 (6.5%) | 0 (0.0%) |
| $50,000 to $99,999 | 260 (39.0%) | 0 (0.0%) |
| $100,000 to $299,999 | 233 (34.9%) | 55 (27.2%) |
| $300,000 to $499,999 | 47 (7.0%) | 128 (63.4%) |
| $500,000 to $749,999 | 0 (0.0%) | 0 (0.0%) |
| $750,000 to $999,999 | 84 (12.6%) | 0 (0.0%) |
| $1,000,000 or more | 0 (0.0%) | 19 (9.4%) |
| Total | 667 (100.0%) | 202 (100.0%) |
Household Income by Mortgage Status in Marfa
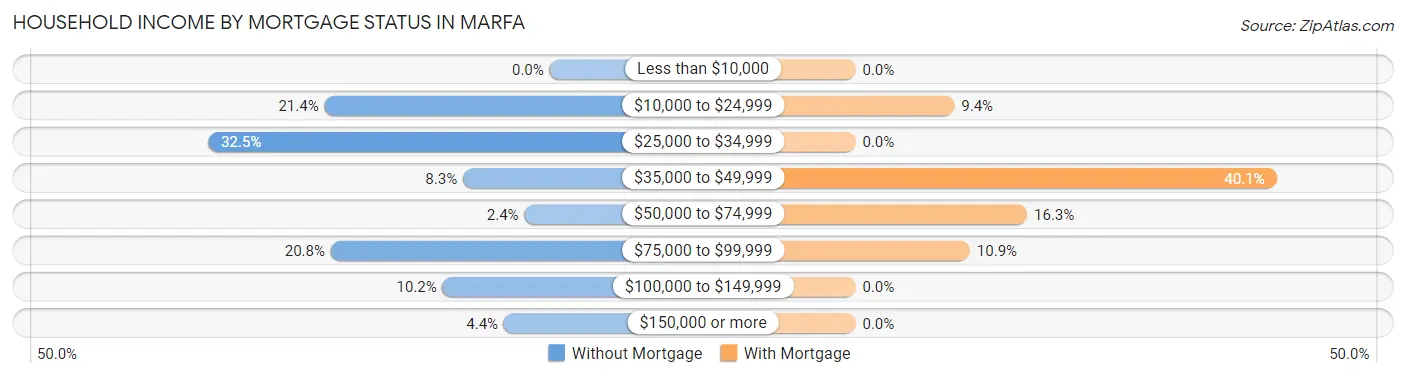
| Household Income | Without Mortgage | With Mortgage |
| Less than $10,000 | 0 (0.0%) | 0 (0.0%) |
| $10,000 to $24,999 | 143 (21.4%) | 19 (9.4%) |
| $25,000 to $34,999 | 217 (32.5%) | 0 (0.0%) |
| $35,000 to $49,999 | 55 (8.3%) | 81 (40.1%) |
| $50,000 to $74,999 | 16 (2.4%) | 33 (16.3%) |
| $75,000 to $99,999 | 139 (20.8%) | 22 (10.9%) |
| $100,000 to $149,999 | 68 (10.2%) | 0 (0.0%) |
| $150,000 or more | 29 (4.3%) | 0 (0.0%) |
| Total | 667 (100.0%) | 202 (100.0%) |
Property Value to Household Income Ratio in Marfa
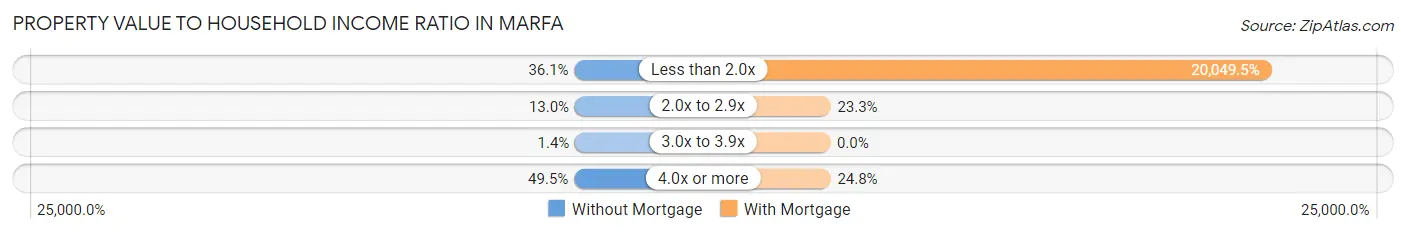
| Value-to-Income Ratio | Without Mortgage | With Mortgage |
| Less than 2.0x | 241 (36.1%) | 40,500 (20,049.5%) |
| 2.0x to 2.9x | 87 (13.0%) | 47 (23.3%) |
| 3.0x to 3.9x | 9 (1.3%) | 0 (0.0%) |
| 4.0x or more | 330 (49.5%) | 50 (24.7%) |
| Total | 667 (100.0%) | 202 (100.0%) |
Real Estate Taxes by Mortgage Status in Marfa
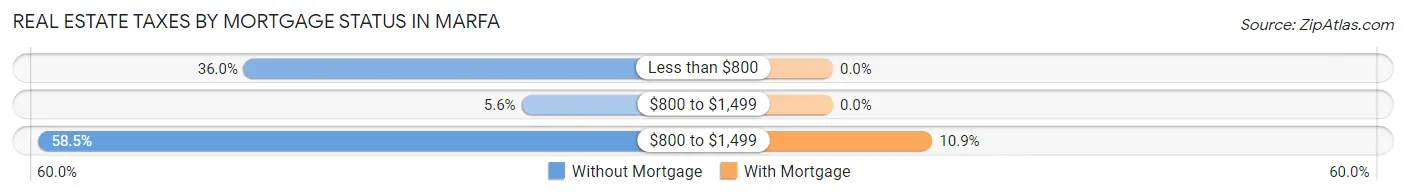
| Property Taxes | Without Mortgage | With Mortgage |
| Less than $800 | 240 (36.0%) | 0 (0.0%) |
| $800 to $1,499 | 37 (5.6%) | 0 (0.0%) |
| $800 to $1,499 | 390 (58.5%) | 22 (10.9%) |
| Total | 667 (100.0%) | 202 (100.0%) |
Health & Disability in Marfa
Health Insurance Coverage by Age in Marfa
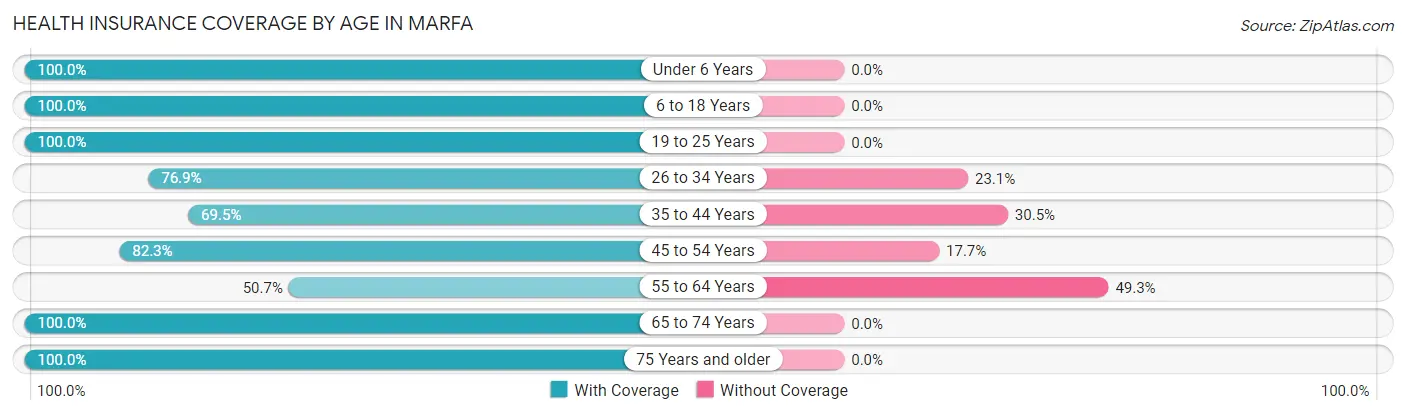
| Age Bracket | With Coverage | Without Coverage |
| Under 6 Years | 209 (100.0%) | 0 (0.0%) |
| 6 to 18 Years | 186 (100.0%) | 0 (0.0%) |
| 19 to 25 Years | 7 (100.0%) | 0 (0.0%) |
| 26 to 34 Years | 10 (76.9%) | 3 (23.1%) |
| 35 to 44 Years | 205 (69.5%) | 90 (30.5%) |
| 45 to 54 Years | 256 (82.3%) | 55 (17.7%) |
| 55 to 64 Years | 172 (50.7%) | 167 (49.3%) |
| 65 to 74 Years | 499 (100.0%) | 0 (0.0%) |
| 75 Years and older | 281 (100.0%) | 0 (0.0%) |
| Total | 1,825 (85.3%) | 315 (14.7%) |
Health Insurance Coverage by Citizenship Status in Marfa
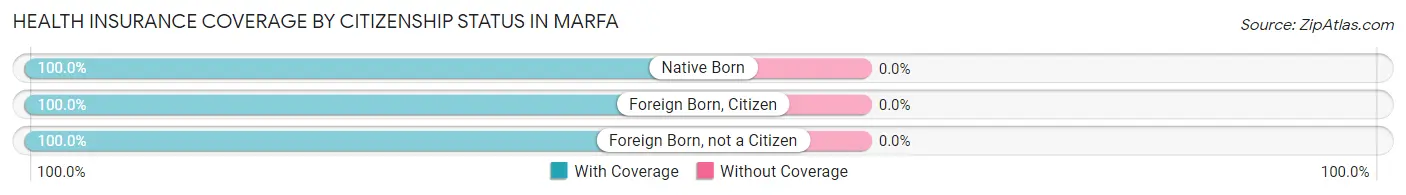
| Citizenship Status | With Coverage | Without Coverage |
| Native Born | 209 (100.0%) | 0 (0.0%) |
| Foreign Born, Citizen | 186 (100.0%) | 0 (0.0%) |
| Foreign Born, not a Citizen | 7 (100.0%) | 0 (0.0%) |
Health Insurance Coverage by Household Income in Marfa
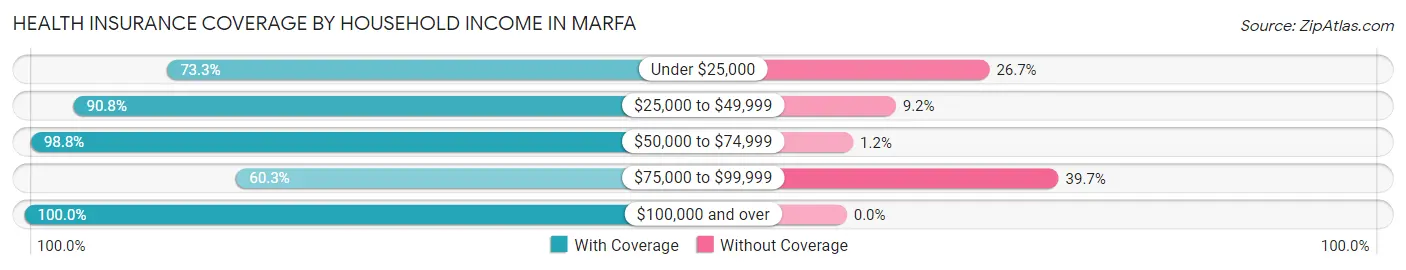
| Household Income | With Coverage | Without Coverage |
| Under $25,000 | 222 (73.3%) | 81 (26.7%) |
| $25,000 to $49,999 | 742 (90.8%) | 75 (9.2%) |
| $50,000 to $74,999 | 250 (98.8%) | 3 (1.2%) |
| $75,000 to $99,999 | 237 (60.3%) | 156 (39.7%) |
| $100,000 and over | 370 (100.0%) | 0 (0.0%) |
Public vs Private Health Insurance Coverage by Age in Marfa
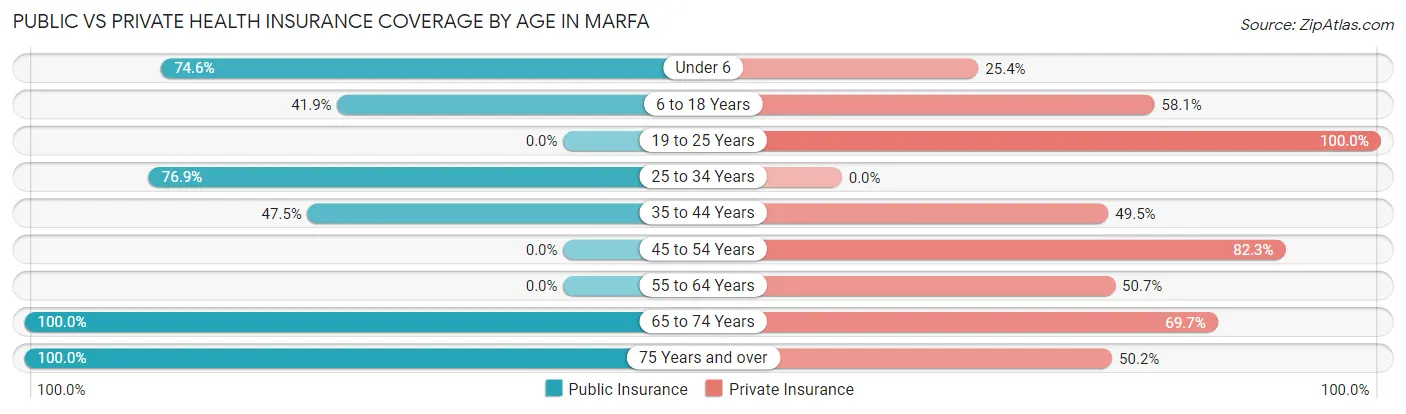
| Age Bracket | Public Insurance | Private Insurance |
| Under 6 | 156 (74.6%) | 53 (25.4%) |
| 6 to 18 Years | 78 (41.9%) | 108 (58.1%) |
| 19 to 25 Years | 0 (0.0%) | 7 (100.0%) |
| 25 to 34 Years | 10 (76.9%) | 0 (0.0%) |
| 35 to 44 Years | 140 (47.5%) | 146 (49.5%) |
| 45 to 54 Years | 0 (0.0%) | 256 (82.3%) |
| 55 to 64 Years | 0 (0.0%) | 172 (50.7%) |
| 65 to 74 Years | 499 (100.0%) | 348 (69.7%) |
| 75 Years and over | 281 (100.0%) | 141 (50.2%) |
| Total | 1,164 (54.4%) | 1,231 (57.5%) |
Disability Status by Sex by Age in Marfa
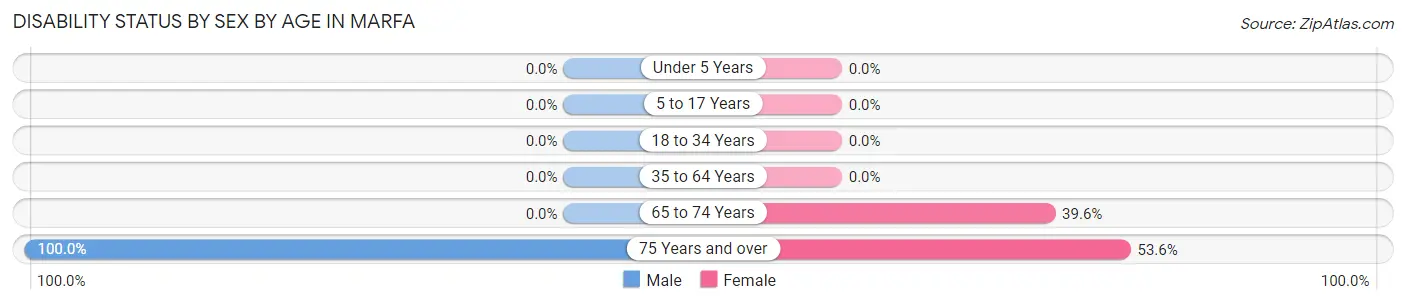
| Age Bracket | Male | Female |
| Under 5 Years | 0 (0.0%) | 0 (0.0%) |
| 5 to 17 Years | 0 (0.0%) | 0 (0.0%) |
| 18 to 34 Years | 0 (0.0%) | 0 (0.0%) |
| 35 to 64 Years | 0 (0.0%) | 0 (0.0%) |
| 65 to 74 Years | 0 (0.0%) | 160 (39.6%) |
| 75 Years and over | 100 (100.0%) | 97 (53.6%) |
Disability Class by Sex by Age in Marfa
Disability Class: Hearing Difficulty
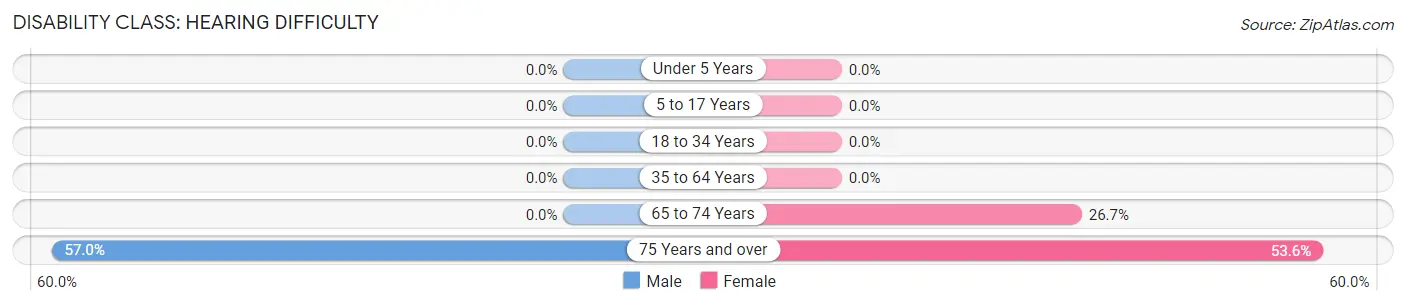
| Age Bracket | Male | Female |
| Under 5 Years | 0 (0.0%) | 0 (0.0%) |
| 5 to 17 Years | 0 (0.0%) | 0 (0.0%) |
| 18 to 34 Years | 0 (0.0%) | 0 (0.0%) |
| 35 to 64 Years | 0 (0.0%) | 0 (0.0%) |
| 65 to 74 Years | 0 (0.0%) | 108 (26.7%) |
| 75 Years and over | 57 (57.0%) | 97 (53.6%) |
Disability Class: Vision Difficulty
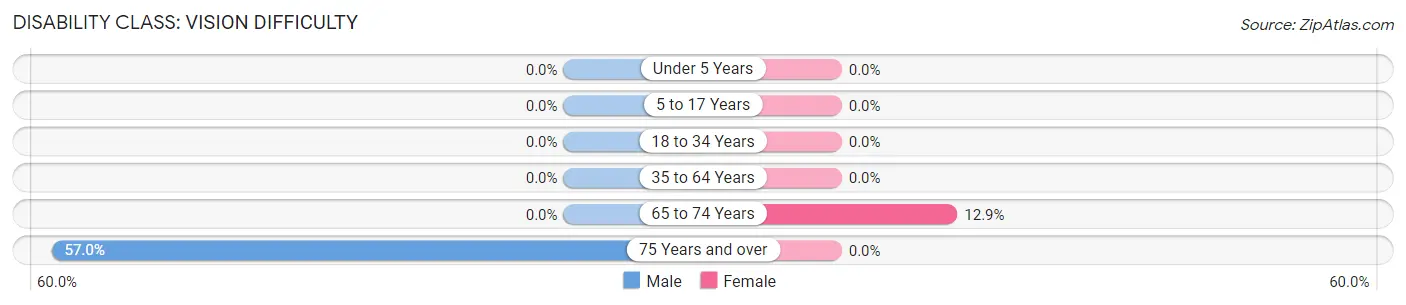
| Age Bracket | Male | Female |
| Under 5 Years | 0 (0.0%) | 0 (0.0%) |
| 5 to 17 Years | 0 (0.0%) | 0 (0.0%) |
| 18 to 34 Years | 0 (0.0%) | 0 (0.0%) |
| 35 to 64 Years | 0 (0.0%) | 0 (0.0%) |
| 65 to 74 Years | 0 (0.0%) | 52 (12.9%) |
| 75 Years and over | 57 (57.0%) | 0 (0.0%) |
Disability Class: Cognitive Difficulty
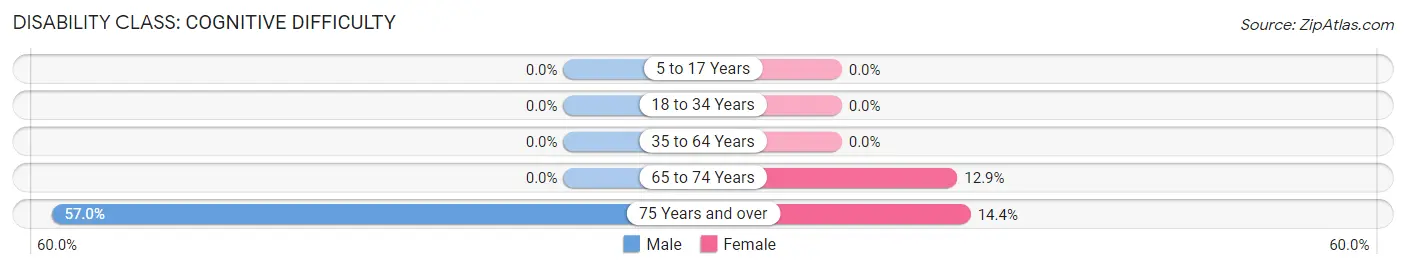
| Age Bracket | Male | Female |
| 5 to 17 Years | 0 (0.0%) | 0 (0.0%) |
| 18 to 34 Years | 0 (0.0%) | 0 (0.0%) |
| 35 to 64 Years | 0 (0.0%) | 0 (0.0%) |
| 65 to 74 Years | 0 (0.0%) | 52 (12.9%) |
| 75 Years and over | 57 (57.0%) | 26 (14.4%) |
Disability Class: Ambulatory Difficulty
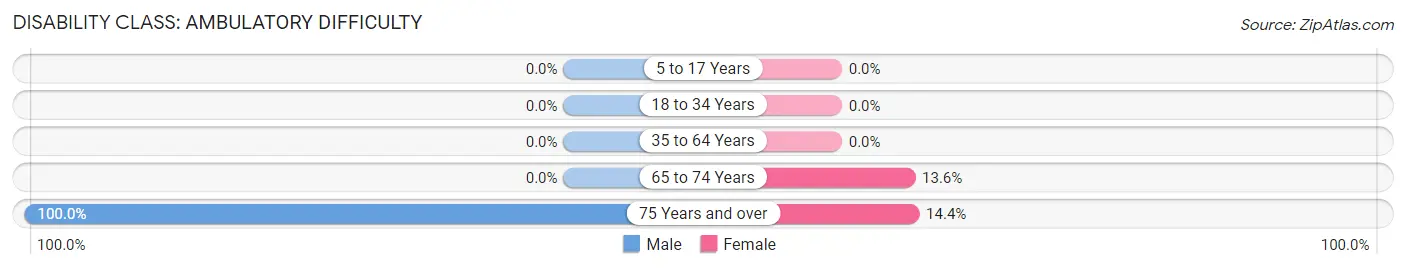
| Age Bracket | Male | Female |
| 5 to 17 Years | 0 (0.0%) | 0 (0.0%) |
| 18 to 34 Years | 0 (0.0%) | 0 (0.0%) |
| 35 to 64 Years | 0 (0.0%) | 0 (0.0%) |
| 65 to 74 Years | 0 (0.0%) | 55 (13.6%) |
| 75 Years and over | 100 (100.0%) | 26 (14.4%) |
Disability Class: Self-Care Difficulty
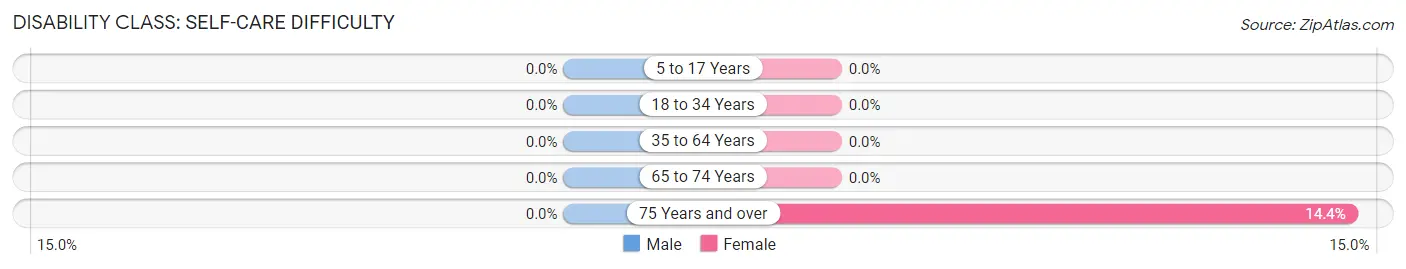
| Age Bracket | Male | Female |
| 5 to 17 Years | 0 (0.0%) | 0 (0.0%) |
| 18 to 34 Years | 0 (0.0%) | 0 (0.0%) |
| 35 to 64 Years | 0 (0.0%) | 0 (0.0%) |
| 65 to 74 Years | 0 (0.0%) | 0 (0.0%) |
| 75 Years and over | 0 (0.0%) | 26 (14.4%) |
Technology Access in Marfa
Computing Device Access in Marfa
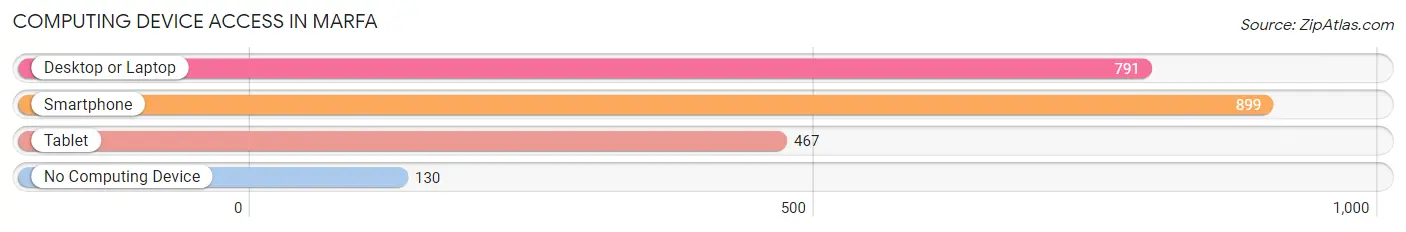
| Device Type | # Households | % Households |
| Desktop or Laptop | 791 | 69.5% |
| Smartphone | 899 | 78.9% |
| Tablet | 467 | 41.0% |
| No Computing Device | 130 | 11.4% |
| Total | 1,139 | 100.0% |
Internet Access in Marfa
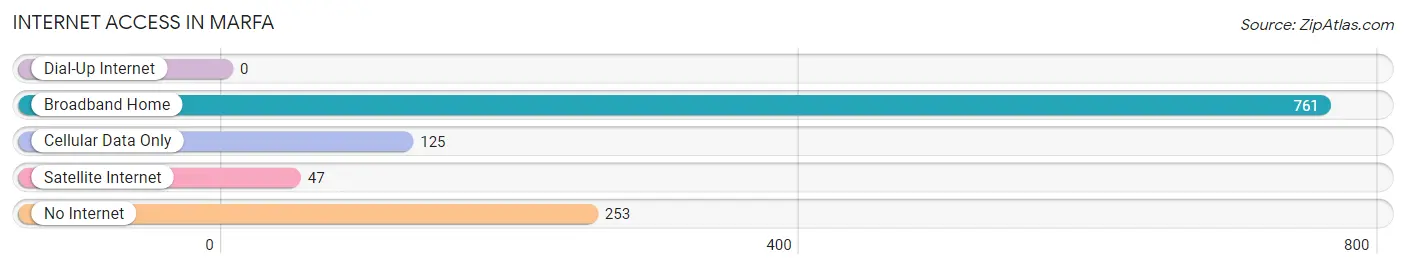
| Internet Type | # Households | % Households |
| Dial-Up Internet | 0 | 0.0% |
| Broadband Home | 761 | 66.8% |
| Cellular Data Only | 125 | 11.0% |
| Satellite Internet | 47 | 4.1% |
| No Internet | 253 | 22.2% |
| Total | 1,139 | 100.0% |
Marfa Summary
Marfa, Texas is a small town located in the Trans-Pecos region of West Texas. It is situated in Presidio County, approximately 200 miles southeast of El Paso and 200 miles northwest of San Antonio. The town is known for its unique art scene, its mysterious Marfa Lights, and its proximity to the Big Bend National Park.
History
Marfa was founded in the late 1880s by a group of ranchers and farmers who were looking for a place to settle in the Trans-Pecos region. The town was named after Marfa Strogoff, a character in a popular novel at the time. The town quickly grew and by the early 1900s, it had become a bustling center of commerce and culture.
In the 1920s, Marfa became a popular destination for Hollywood filmmakers, who used the town as a backdrop for western films. This led to the construction of the Marfa Army Airfield, which was used by the US Army Air Corps during World War II.
In the 1950s, Marfa became a popular destination for artists and intellectuals, who were drawn to the town’s unique landscape and culture. This led to the establishment of the Chinati Foundation, an art museum and sculpture park that is now one of the most important cultural institutions in the region.
Geography
Marfa is located in the Trans-Pecos region of West Texas, in Presidio County. The town is situated at an elevation of 4,685 feet, making it one of the highest towns in the state. The town is surrounded by the Davis Mountains to the north and the Chinati Mountains to the south.
The town is located in a semi-arid climate, with hot summers and mild winters. The average annual temperature is 68 degrees Fahrenheit, with an average annual precipitation of 16 inches.
Economy
Marfa’s economy is largely based on tourism, with the town’s unique art scene and proximity to the Big Bend National Park drawing visitors from around the world. The town is also home to a number of small businesses, including restaurants, galleries, and retail stores.
The town is also home to a number of government and military installations, including the Marfa Army Airfield and the Marfa Municipal Airport. These installations provide jobs for many of the town’s residents.
Demographics
As of the 2010 census, Marfa had a population of 2,121. The town is predominantly white, with a small Hispanic population. The median household income is $31,250, and the median home value is $90,000.
Marfa is a small town with a unique culture and history. It is a popular destination for tourists, artists, and intellectuals, and is home to a number of government and military installations. The town’s economy is largely based on tourism, and its population is predominantly white.
Common Questions
What is Per Capita Income in Marfa?
Per Capita income in Marfa is $36,682.
What is the Median Family Income in Marfa?
Median Family Income in Marfa is $86,250.
What is the Median Household income in Marfa?
Median Household Income in Marfa is $30,669.
What is Income or Wage Gap in Marfa?
Income or Wage Gap in Marfa is 20.0%.
Women in Marfa earn 80.0 cents for every dollar earned by a man.
What is Inequality or Gini Index in Marfa?
Inequality or Gini Index in Marfa is 0.60.
What is the Total Population of Marfa?
Total Population of Marfa is 2,141.
What is the Total Male Population of Marfa?
Total Male Population of Marfa is 1,072.
What is the Total Female Population of Marfa?
Total Female Population of Marfa is 1,069.
What is the Ratio of Males per 100 Females in Marfa?
There are 100.28 Males per 100 Females in Marfa.
What is the Ratio of Females per 100 Males in Marfa?
There are 99.72 Females per 100 Males in Marfa.
What is the Median Population Age in Marfa?
Median Population Age in Marfa is 55.3 Years.
What is the Average Family Size in Marfa
Average Family Size in Marfa is 3.6 People.
What is the Average Household Size in Marfa
Average Household Size in Marfa is 1.9 People.
How Large is the Labor Force in Marfa?
There are 1,300 People in the Labor Forcein in Marfa.
What is the Percentage of People in the Labor Force in Marfa?
71.1% of People are in the Labor Force in Marfa.