Zip Codes with the Highest Percentage of Population Employed in Computer & Mathematics in Mission, TX
RELATED REPORTS & OPTIONS
Computer & Mathematics
Mission
Compare Zip Codes
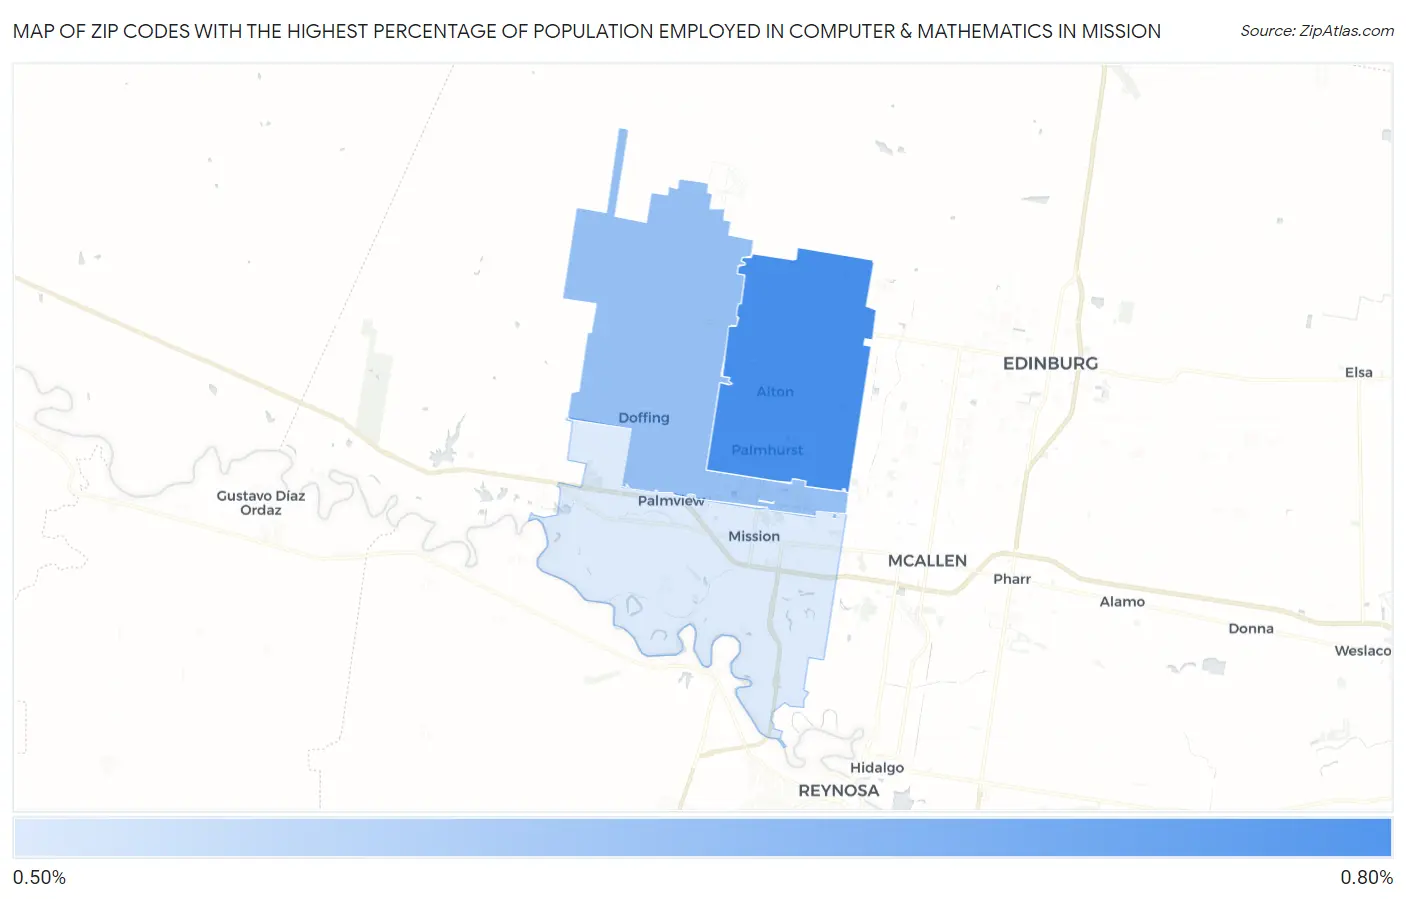
Map of Zip Codes with the Highest Percentage of Population Employed in Computer & Mathematics in Mission
0.54%
0.61%
Zip Codes with the Highest Percentage of Population Employed in Computer & Mathematics in Mission, TX
| Zip Code | % Employed | vs State | vs National | |
| 1. | 78573 | 0.61% | 3.4%(-2.83)#1,133 | 3.5%(-2.92)#19,830 |
| 2. | 78574 | 0.57% | 3.4%(-2.86)#1,143 | 3.5%(-2.95)#20,045 |
| 3. | 78572 | 0.54% | 3.4%(-2.90)#1,159 | 3.5%(-2.98)#20,233 |
1
Common Questions
What are the Top Zip Codes with the Highest Percentage of Population Employed in Computer & Mathematics in Mission, TX?
Top Zip Codes with the Highest Percentage of Population Employed in Computer & Mathematics in Mission, TX are:
What zip code has the Highest Percentage of Population Employed in Computer & Mathematics in Mission, TX?
78573 has the Highest Percentage of Population Employed in Computer & Mathematics in Mission, TX with 0.61%.
What is the Percentage of Population Employed in Computer & Mathematics in Mission, TX?
Percentage of Population Employed in Computer & Mathematics in Mission is 0.94%.
What is the Percentage of Population Employed in Computer & Mathematics in Texas?
Percentage of Population Employed in Computer & Mathematics in Texas is 3.4%.
What is the Percentage of Population Employed in Computer & Mathematics in the United States?
Percentage of Population Employed in Computer & Mathematics in the United States is 3.5%.