Frankston, TX Map & Demographics
Frankston Map
Frankston Overview
$24,573
PER CAPITA INCOME
$61,719
AVG FAMILY INCOME
$56,957
AVG HOUSEHOLD INCOME
1.4%
WAGE / INCOME GAP [ % ]
98.6¢/ $1
WAGE / INCOME GAP [ $ ]
0.32
INEQUALITY / GINI INDEX
1,282
TOTAL POPULATION
644
MALE POPULATION
638
FEMALE POPULATION
100.94
MALES / 100 FEMALES
99.07
FEMALES / 100 MALES
48.4
MEDIAN AGE
3.3
AVG FAMILY SIZE
2.5
AVG HOUSEHOLD SIZE
497
LABOR FORCE [ PEOPLE ]
48.5%
PERCENT IN LABOR FORCE
10.3%
UNEMPLOYMENT RATE
Frankston Zip Codes
Frankston Area Codes
Income in Frankston
Income Overview in Frankston
Per Capita Income in Frankston is $24,573, while median incomes of families and households are $61,719 and $56,957 respectively.
| Characteristic | Number | Measure |
| Per Capita Income | 1,282 | $24,573 |
| Median Family Income | 294 | $61,719 |
| Mean Family Income | 294 | $65,029 |
| Median Household Income | 488 | $56,957 |
| Mean Household Income | 488 | $56,244 |
| Income Deficit | 294 | $0 |
| Wage / Income Gap (%) | 1,282 | 1.42% |
| Wage / Income Gap ($) | 1,282 | 98.58¢ per $1 |
| Gini / Inequality Index | 1,282 | 0.32 |
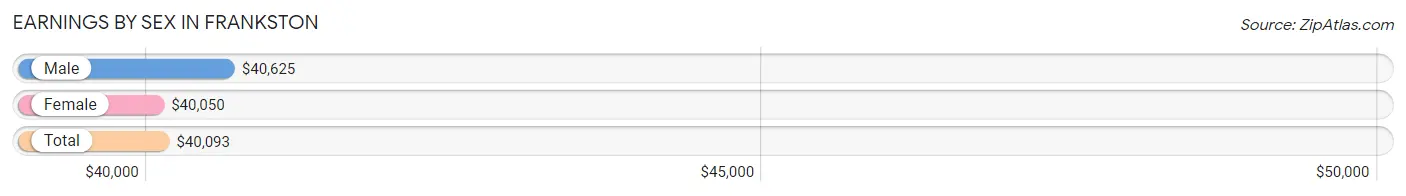
Earnings by Sex in Frankston
Average Earnings in Frankston are $40,093, $40,625 for men and $40,050 for women, a difference of 1.4%.
| Sex | Number | Average Earnings |
| Male | 273 (56.4%) | $40,625 |
| Female | 211 (43.6%) | $40,050 |
| Total | 484 (100.0%) | $40,093 |
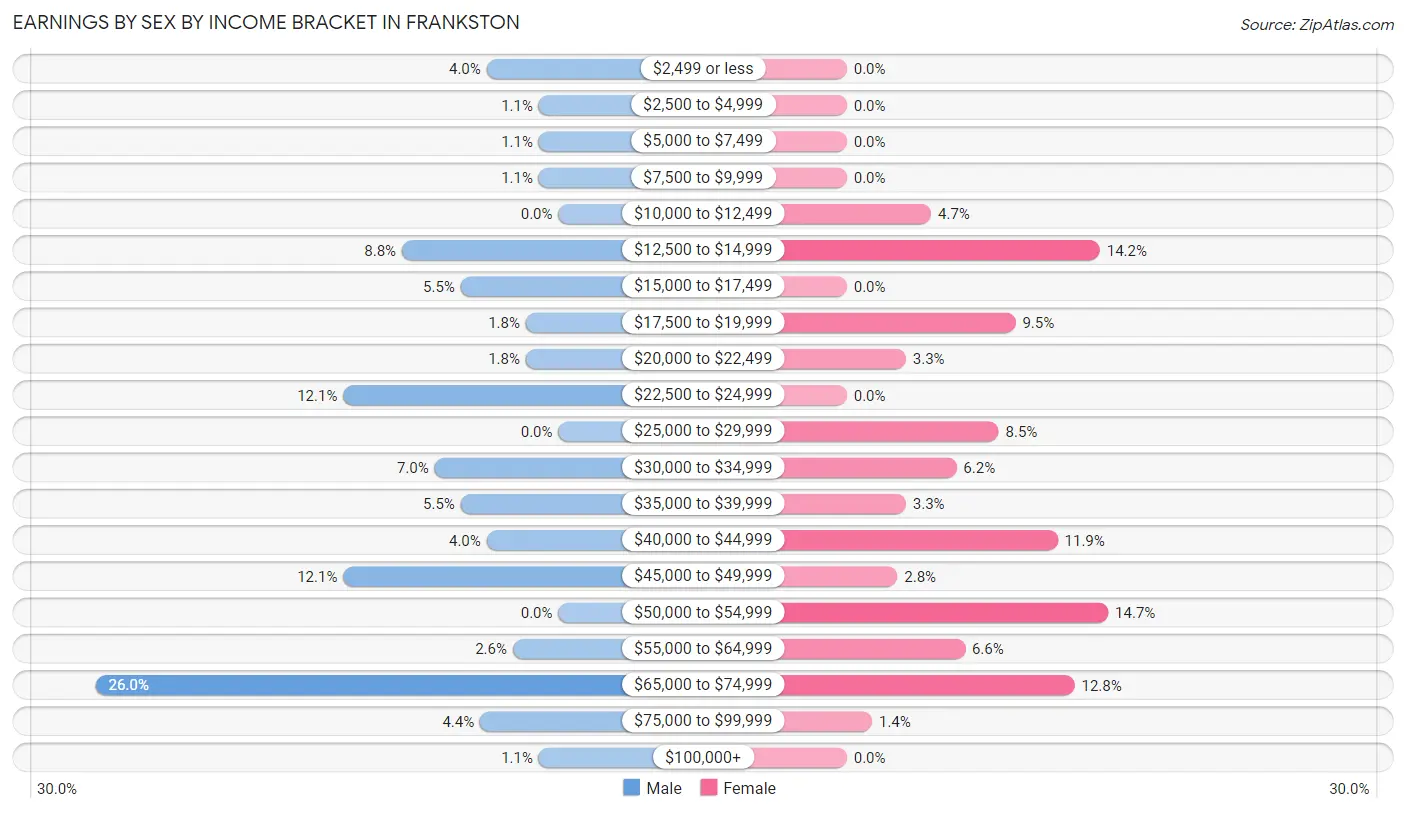
Earnings by Sex by Income Bracket in Frankston
The most common earnings brackets in Frankston are $65,000 to $74,999 for men (71 | 26.0%) and $50,000 to $54,999 for women (31 | 14.7%).
| Income | Male | Female |
| $2,499 or less | 11 (4.0%) | 0 (0.0%) |
| $2,500 to $4,999 | 3 (1.1%) | 0 (0.0%) |
| $5,000 to $7,499 | 3 (1.1%) | 0 (0.0%) |
| $7,500 to $9,999 | 3 (1.1%) | 0 (0.0%) |
| $10,000 to $12,499 | 0 (0.0%) | 10 (4.7%) |
| $12,500 to $14,999 | 24 (8.8%) | 30 (14.2%) |
| $15,000 to $17,499 | 15 (5.5%) | 0 (0.0%) |
| $17,500 to $19,999 | 5 (1.8%) | 20 (9.5%) |
| $20,000 to $22,499 | 5 (1.8%) | 7 (3.3%) |
| $22,500 to $24,999 | 33 (12.1%) | 0 (0.0%) |
| $25,000 to $29,999 | 0 (0.0%) | 18 (8.5%) |
| $30,000 to $34,999 | 19 (7.0%) | 13 (6.2%) |
| $35,000 to $39,999 | 15 (5.5%) | 7 (3.3%) |
| $40,000 to $44,999 | 11 (4.0%) | 25 (11.8%) |
| $45,000 to $49,999 | 33 (12.1%) | 6 (2.8%) |
| $50,000 to $54,999 | 0 (0.0%) | 31 (14.7%) |
| $55,000 to $64,999 | 7 (2.6%) | 14 (6.6%) |
| $65,000 to $74,999 | 71 (26.0%) | 27 (12.8%) |
| $75,000 to $99,999 | 12 (4.4%) | 3 (1.4%) |
| $100,000+ | 3 (1.1%) | 0 (0.0%) |
| Total | 273 (100.0%) | 211 (100.0%) |
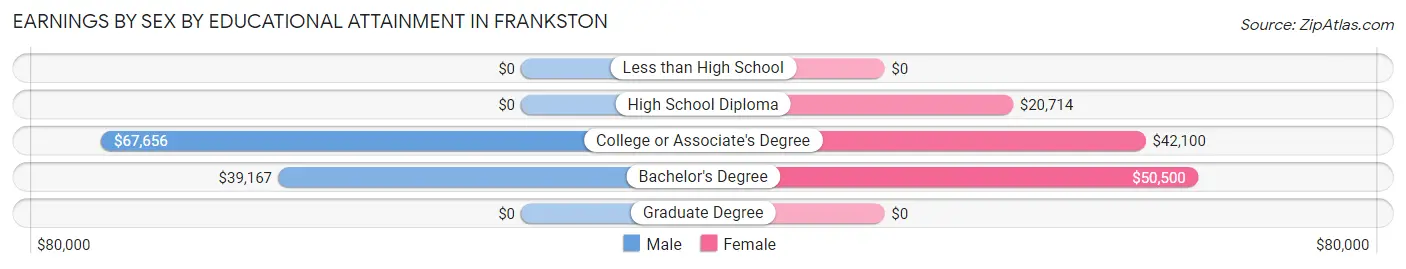
Earnings by Sex by Educational Attainment in Frankston
Average earnings in Frankston are $43,750 for men and $40,400 for women, a difference of 7.7%. Men with an educational attainment of college or associate's degree enjoy the highest average annual earnings of $67,656, while those with bachelor's degree education earn the least with $39,167. Women with an educational attainment of bachelor's degree earn the most with the average annual earnings of $50,500, while those with high school diploma education have the smallest earnings of $20,714.
| Educational Attainment | Male Income | Female Income |
| Less than High School | - | - |
| High School Diploma | - | - |
| College or Associate's Degree | $67,656 | $42,100 |
| Bachelor's Degree | $39,167 | $50,500 |
| Graduate Degree | - | - |
| Total | $43,750 | $40,400 |
Family Income in Frankston
Family Income Brackets in Frankston
According to the Frankston family income data, there are 78 families falling into the $50,000 to $74,999 income range, which is the most common income bracket and makes up 26.5% of all families.
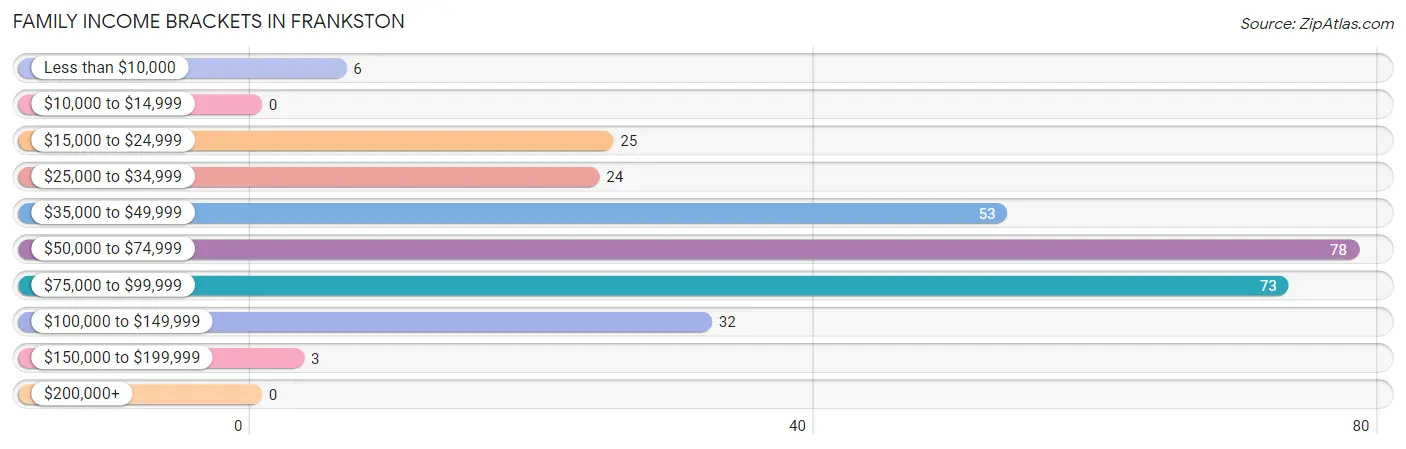
| Income Bracket | # Families | % Families |
| Less than $10,000 | 6 | 2.0% |
| $10,000 to $14,999 | 0 | 0.0% |
| $15,000 to $24,999 | 25 | 8.5% |
| $25,000 to $34,999 | 24 | 8.2% |
| $35,000 to $49,999 | 53 | 18.0% |
| $50,000 to $74,999 | 78 | 26.5% |
| $75,000 to $99,999 | 73 | 24.8% |
| $100,000 to $149,999 | 32 | 10.9% |
| $150,000 to $199,999 | 3 | 1.0% |
| $200,000+ | 0 | 0.0% |
Family Income by Famaliy Size in Frankston
4-person families (36 | 12.2%) account for the highest median family income in Frankston with $98,750 per family, while 3-person families (45 | 15.3%) have the highest median income of $26,375 per family member.
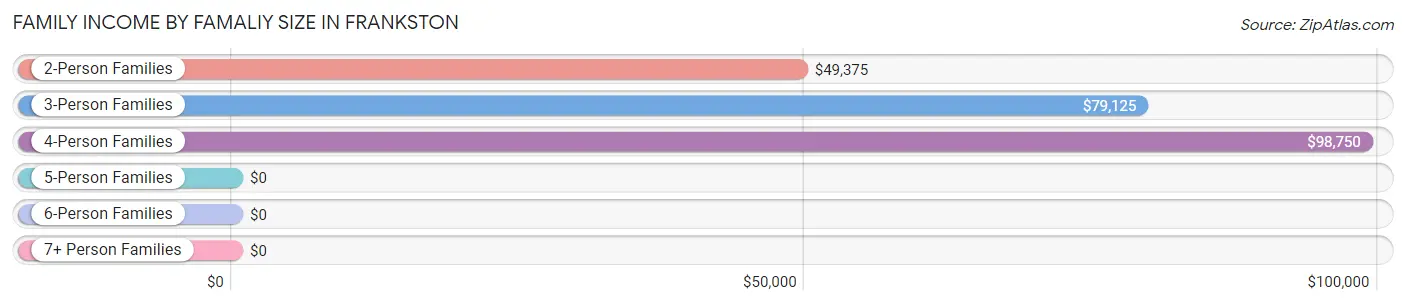
| Income Bracket | # Families | Median Income |
| 2-Person Families | 177 (60.2%) | $49,375 |
| 3-Person Families | 45 (15.3%) | $79,125 |
| 4-Person Families | 36 (12.2%) | $98,750 |
| 5-Person Families | 21 (7.1%) | $0 |
| 6-Person Families | 15 (5.1%) | $0 |
| 7+ Person Families | 0 (0.0%) | $0 |
| Total | 294 (100.0%) | $61,719 |
Family Income by Number of Earners in Frankston
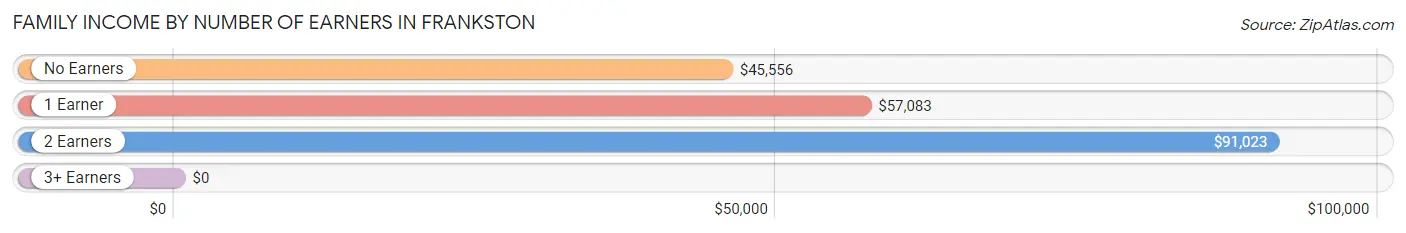
| Number of Earners | # Families | Median Income |
| No Earners | 92 (31.3%) | $45,556 |
| 1 Earner | 131 (44.6%) | $57,083 |
| 2 Earners | 59 (20.1%) | $91,023 |
| 3+ Earners | 12 (4.1%) | $0 |
| Total | 294 (100.0%) | $61,719 |
Household Income in Frankston
Household Income Brackets in Frankston
With 171 households falling in the category, the $50,000 to $74,999 income range is the most frequent in Frankston, accounting for 35.0% of all households.
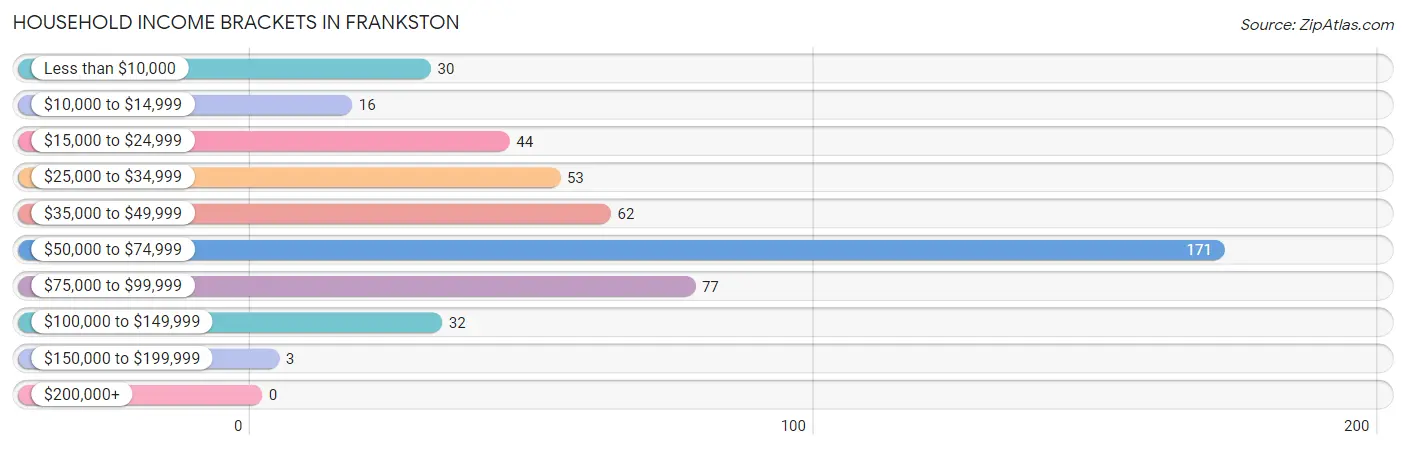
| Income Bracket | # Households | % Households |
| Less than $10,000 | 30 | 6.1% |
| $10,000 to $14,999 | 16 | 3.3% |
| $15,000 to $24,999 | 44 | 9.0% |
| $25,000 to $34,999 | 53 | 10.9% |
| $35,000 to $49,999 | 62 | 12.7% |
| $50,000 to $74,999 | 171 | 35.0% |
| $75,000 to $99,999 | 77 | 15.8% |
| $100,000 to $149,999 | 32 | 6.6% |
| $150,000 to $199,999 | 3 | 0.6% |
| $200,000+ | 0 | 0.0% |
Household Income by Householder Age in Frankston
The median household income in Frankston is $56,957, with the highest median household income of $81,563 found in the 25 to 44 years age bracket for the primary householder. A total of 61 households (12.5%) fall into this category. Meanwhile, the 15 to 24 years age bracket for the primary householder has the lowest median household income of $0, with 52 households (10.7%) in this group.
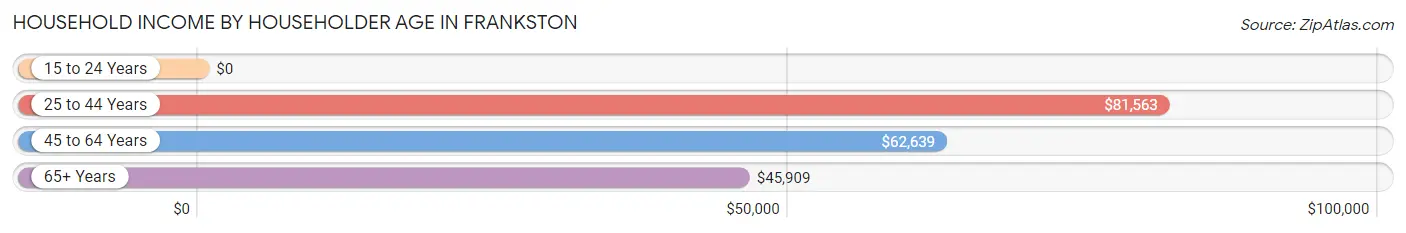
| Income Bracket | # Households | Median Income |
| 15 to 24 Years | 52 (10.7%) | $0 |
| 25 to 44 Years | 61 (12.5%) | $81,563 |
| 45 to 64 Years | 205 (42.0%) | $62,639 |
| 65+ Years | 170 (34.8%) | $45,909 |
| Total | 488 (100.0%) | $56,957 |
Poverty in Frankston
Income Below Poverty by Sex and Age in Frankston
With 9.3% poverty level for males and 9.7% for females among the residents of Frankston, 18 to 24 year old males and 16 and 17 year old females are the most vulnerable to poverty, with 18 males (26.5%) and 14 females (66.7%) in their respective age groups living below the poverty level.
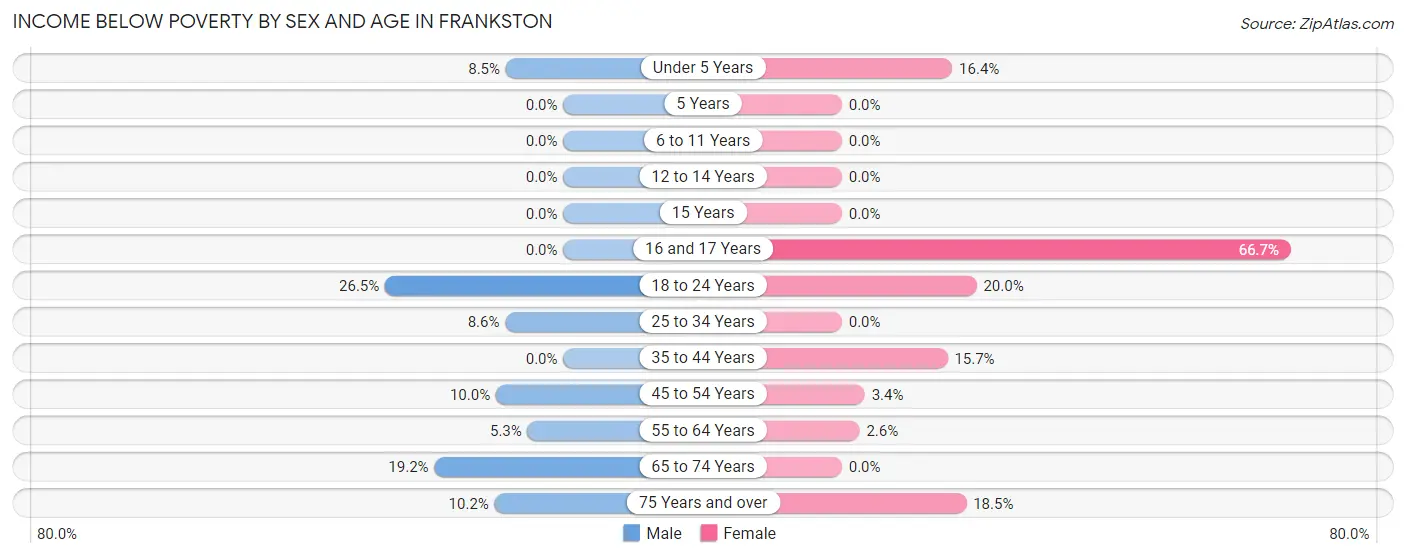
| Age Bracket | Male | Female |
| Under 5 Years | 7 (8.5%) | 10 (16.4%) |
| 5 Years | 0 (0.0%) | 0 (0.0%) |
| 6 to 11 Years | 0 (0.0%) | 0 (0.0%) |
| 12 to 14 Years | 0 (0.0%) | 0 (0.0%) |
| 15 Years | 0 (0.0%) | 0 (0.0%) |
| 16 and 17 Years | 0 (0.0%) | 14 (66.7%) |
| 18 to 24 Years | 18 (26.5%) | 6 (20.0%) |
| 25 to 34 Years | 5 (8.6%) | 0 (0.0%) |
| 35 to 44 Years | 0 (0.0%) | 8 (15.7%) |
| 45 to 54 Years | 7 (10.0%) | 3 (3.4%) |
| 55 to 64 Years | 6 (5.3%) | 3 (2.6%) |
| 65 to 74 Years | 9 (19.2%) | 0 (0.0%) |
| 75 Years and over | 5 (10.2%) | 17 (18.5%) |
| Total | 57 (9.3%) | 61 (9.7%) |
Income Above Poverty by Sex and Age in Frankston
According to the poverty statistics in Frankston, males aged 6 to 11 years and females aged 6 to 11 years are the age groups that are most secure financially, with 100.0% of males and 100.0% of females in these age groups living above the poverty line.
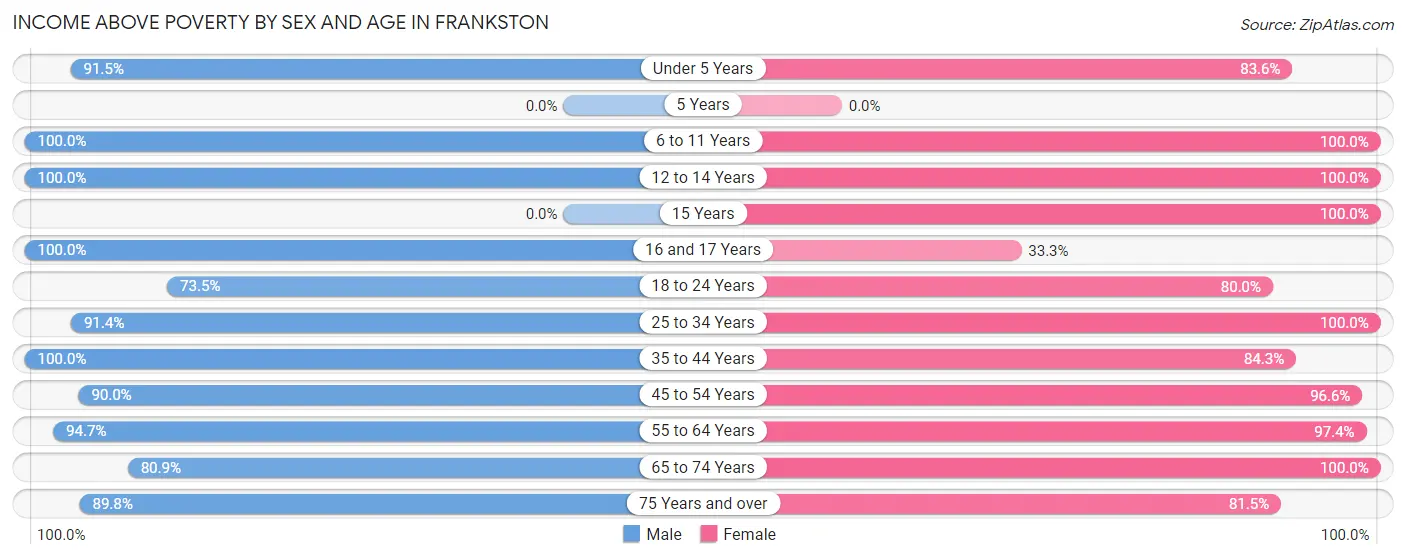
| Age Bracket | Male | Female |
| Under 5 Years | 75 (91.5%) | 51 (83.6%) |
| 5 Years | 0 (0.0%) | 0 (0.0%) |
| 6 to 11 Years | 18 (100.0%) | 30 (100.0%) |
| 12 to 14 Years | 13 (100.0%) | 29 (100.0%) |
| 15 Years | 0 (0.0%) | 25 (100.0%) |
| 16 and 17 Years | 28 (100.0%) | 7 (33.3%) |
| 18 to 24 Years | 50 (73.5%) | 24 (80.0%) |
| 25 to 34 Years | 53 (91.4%) | 41 (100.0%) |
| 35 to 44 Years | 68 (100.0%) | 43 (84.3%) |
| 45 to 54 Years | 63 (90.0%) | 85 (96.6%) |
| 55 to 64 Years | 107 (94.7%) | 111 (97.4%) |
| 65 to 74 Years | 38 (80.8%) | 49 (100.0%) |
| 75 Years and over | 44 (89.8%) | 75 (81.5%) |
| Total | 557 (90.7%) | 570 (90.3%) |
Income Below Poverty Among Married-Couple Families in Frankston
The poverty statistics for married-couple families in Frankston show that 2.9% or 4 of the total 139 families live below the poverty line. Families with no children have the highest poverty rate of 3.6%, comprising of 4 families. On the other hand, families with 1 or 2 children have the lowest poverty rate of 0.0%, which includes 0 families.
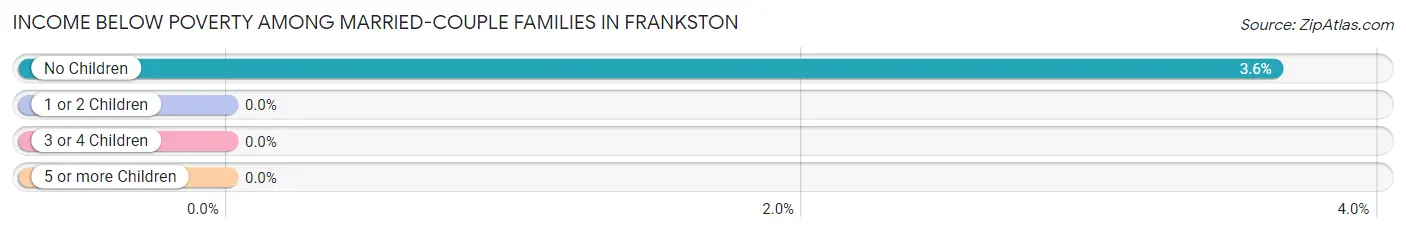
| Children | Above Poverty | Below Poverty |
| No Children | 106 (96.4%) | 4 (3.6%) |
| 1 or 2 Children | 29 (100.0%) | 0 (0.0%) |
| 3 or 4 Children | 0 (0.0%) | 0 (0.0%) |
| 5 or more Children | 0 (0.0%) | 0 (0.0%) |
| Total | 135 (97.1%) | 4 (2.9%) |
Income Below Poverty Among Single-Parent Households in Frankston
According to the poverty data in Frankston, 33.3% or 12 single-father households and 11.8% or 14 single-mother households are living below the poverty line. Among single-father households, those with 1 or 2 children have the highest poverty rate, with 12 households (100.0%) experiencing poverty. Likewise, among single-mother households, those with 1 or 2 children have the highest poverty rate, with 14 households (38.9%) falling below the poverty line.
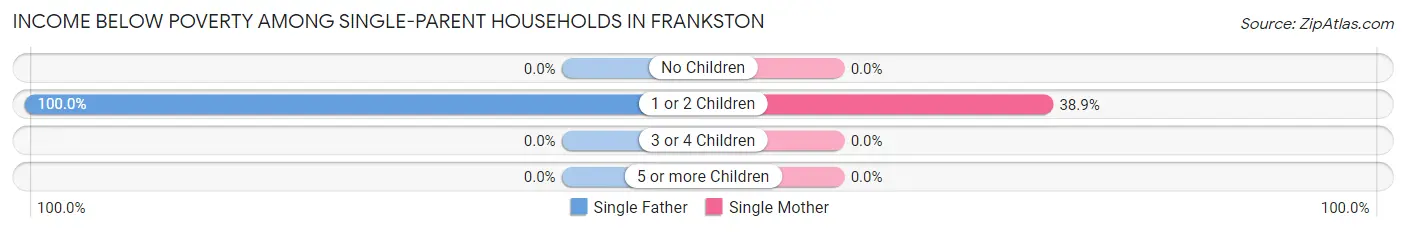
| Children | Single Father | Single Mother |
| No Children | 0 (0.0%) | 0 (0.0%) |
| 1 or 2 Children | 12 (100.0%) | 14 (38.9%) |
| 3 or 4 Children | 0 (0.0%) | 0 (0.0%) |
| 5 or more Children | 0 (0.0%) | 0 (0.0%) |
| Total | 12 (33.3%) | 14 (11.8%) |
Income Below Poverty Among Married-Couple vs Single-Parent Households in Frankston
The poverty data for Frankston shows that 4 of the married-couple family households (2.9%) and 26 of the single-parent households (16.8%) are living below the poverty level. Within the married-couple family households, those with no children have the highest poverty rate, with 4 households (3.6%) falling below the poverty line. Among the single-parent households, those with 1 or 2 children have the highest poverty rate, with 26 household (54.2%) living below poverty.
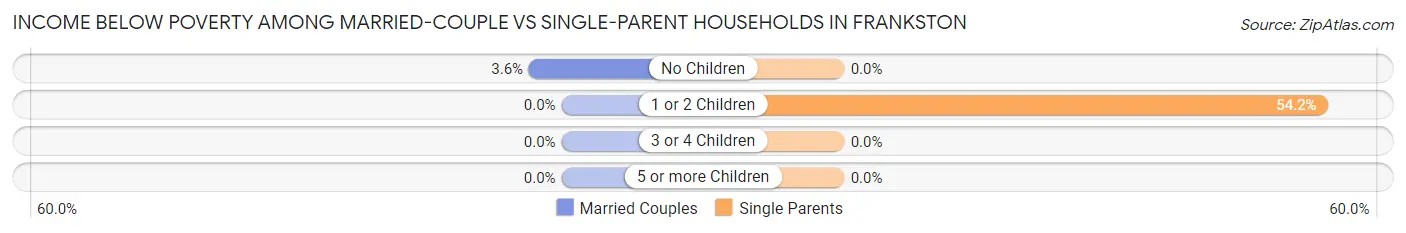
| Children | Married-Couple Families | Single-Parent Households |
| No Children | 4 (3.6%) | 0 (0.0%) |
| 1 or 2 Children | 0 (0.0%) | 26 (54.2%) |
| 3 or 4 Children | 0 (0.0%) | 0 (0.0%) |
| 5 or more Children | 0 (0.0%) | 0 (0.0%) |
| Total | 4 (2.9%) | 26 (16.8%) |
Race in Frankston
The most populous races in Frankston are White / Caucasian (822 | 64.1%), Two or more Races (358 | 27.9%), and Hispanic or Latino (103 | 8.0%).
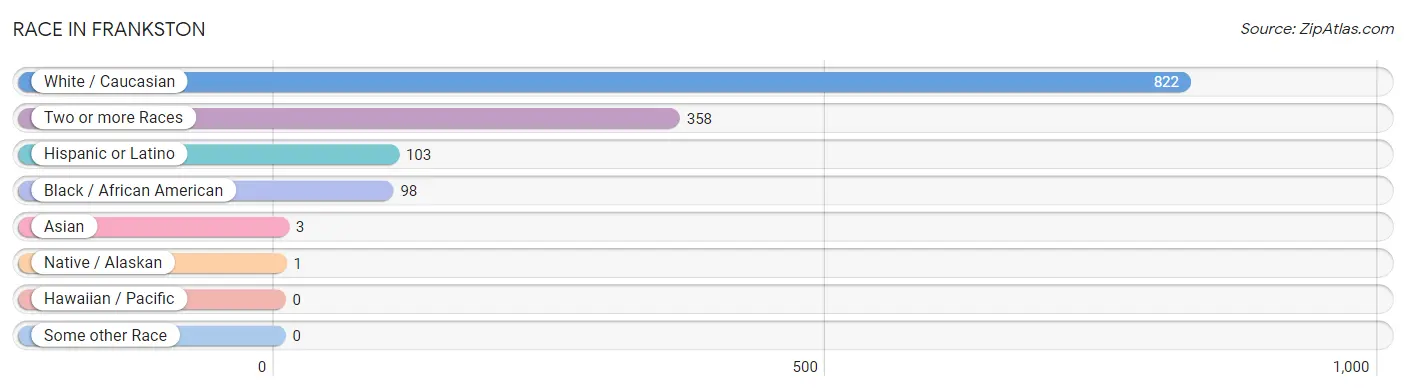
| Race | # Population | % Population |
| Asian | 3 | 0.2% |
| Black / African American | 98 | 7.6% |
| Hawaiian / Pacific | 0 | 0.0% |
| Hispanic or Latino | 103 | 8.0% |
| Native / Alaskan | 1 | 0.1% |
| White / Caucasian | 822 | 64.1% |
| Two or more Races | 358 | 27.9% |
| Some other Race | 0 | 0.0% |
| Total | 1,282 | 100.0% |
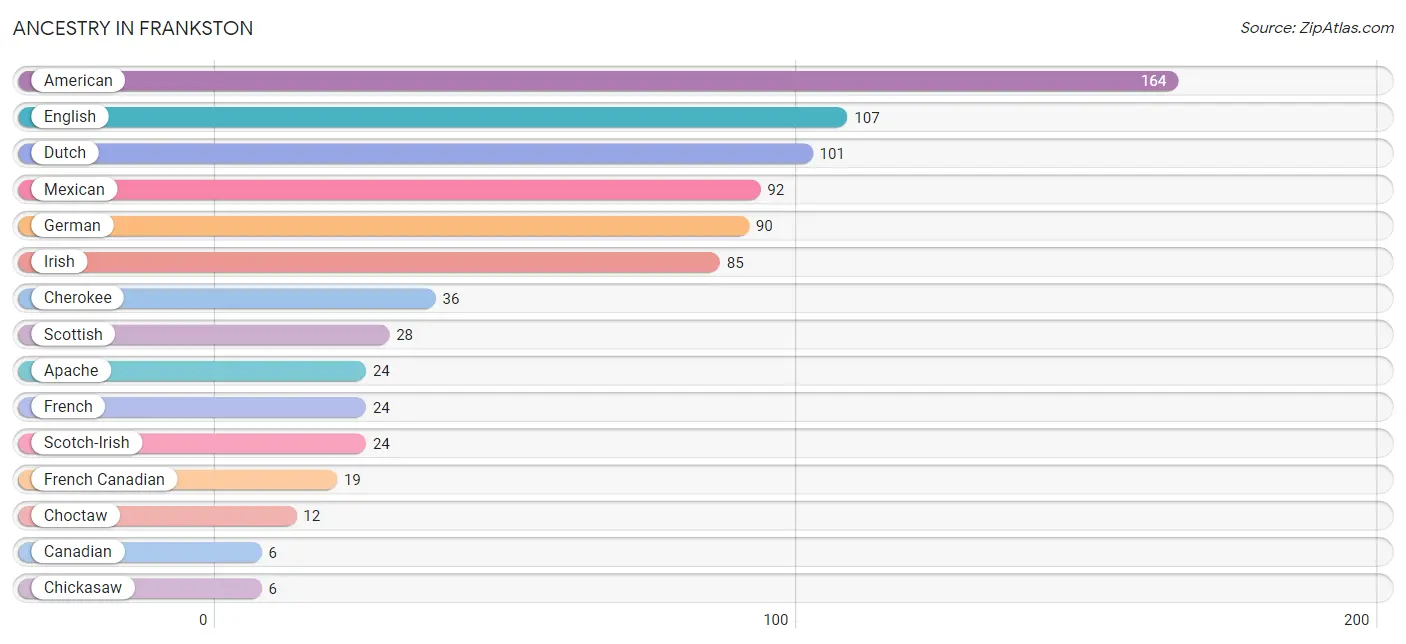
Ancestry in Frankston
The most populous ancestries reported in Frankston are American (164 | 12.8%), English (107 | 8.4%), Dutch (101 | 7.9%), Mexican (92 | 7.2%), and German (90 | 7.0%), together accounting for 43.2% of all Frankston residents.
| Ancestry | # Population | % Population |
| American | 164 | 12.8% |
| Apache | 24 | 1.9% |
| Austrian | 3 | 0.2% |
| British | 2 | 0.2% |
| Burmese | 3 | 0.2% |
| Canadian | 6 | 0.5% |
| Cherokee | 36 | 2.8% |
| Chickasaw | 6 | 0.5% |
| Choctaw | 12 | 0.9% |
| Czech | 4 | 0.3% |
| Danish | 3 | 0.2% |
| Dutch | 101 | 7.9% |
| English | 107 | 8.4% |
| French | 24 | 1.9% |
| French Canadian | 19 | 1.5% |
| German | 90 | 7.0% |
| Irish | 85 | 6.6% |
| Mexican | 92 | 7.2% |
| Norwegian | 6 | 0.5% |
| Scotch-Irish | 24 | 1.9% |
| Scottish | 28 | 2.2% |
| Welsh | 4 | 0.3% | View All 22 Rows |
Immigrants in Frankston
The most numerous immigrant groups reported in Frankston came from Central America (16 | 1.3%), Latin America (16 | 1.3%), Mexico (16 | 1.3%), and Canada (6 | 0.5%), together accounting for 4.2% of all Frankston residents.
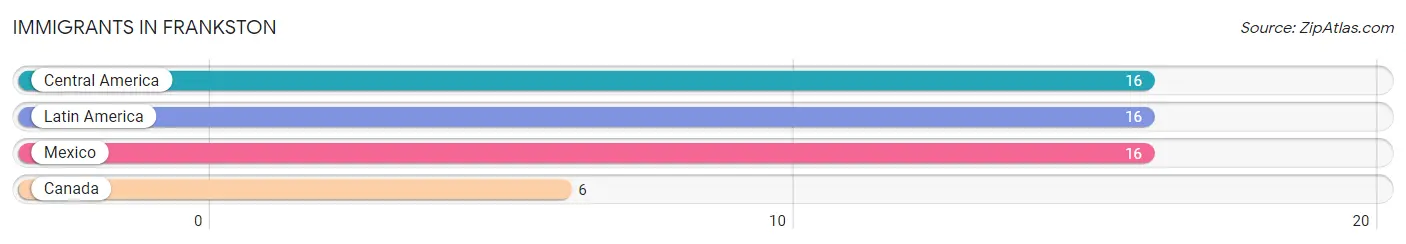
| Immigration Origin | # Population | % Population |
| Canada | 6 | 0.5% |
| Central America | 16 | 1.3% |
| Latin America | 16 | 1.3% |
| Mexico | 16 | 1.3% | View All 4 Rows |
Sex and Age in Frankston
Sex and Age in Frankston
The most populous age groups in Frankston are Under 5 Years (82 | 12.7%) for men and 15 to 19 Years (70 | 11.0%) for women.
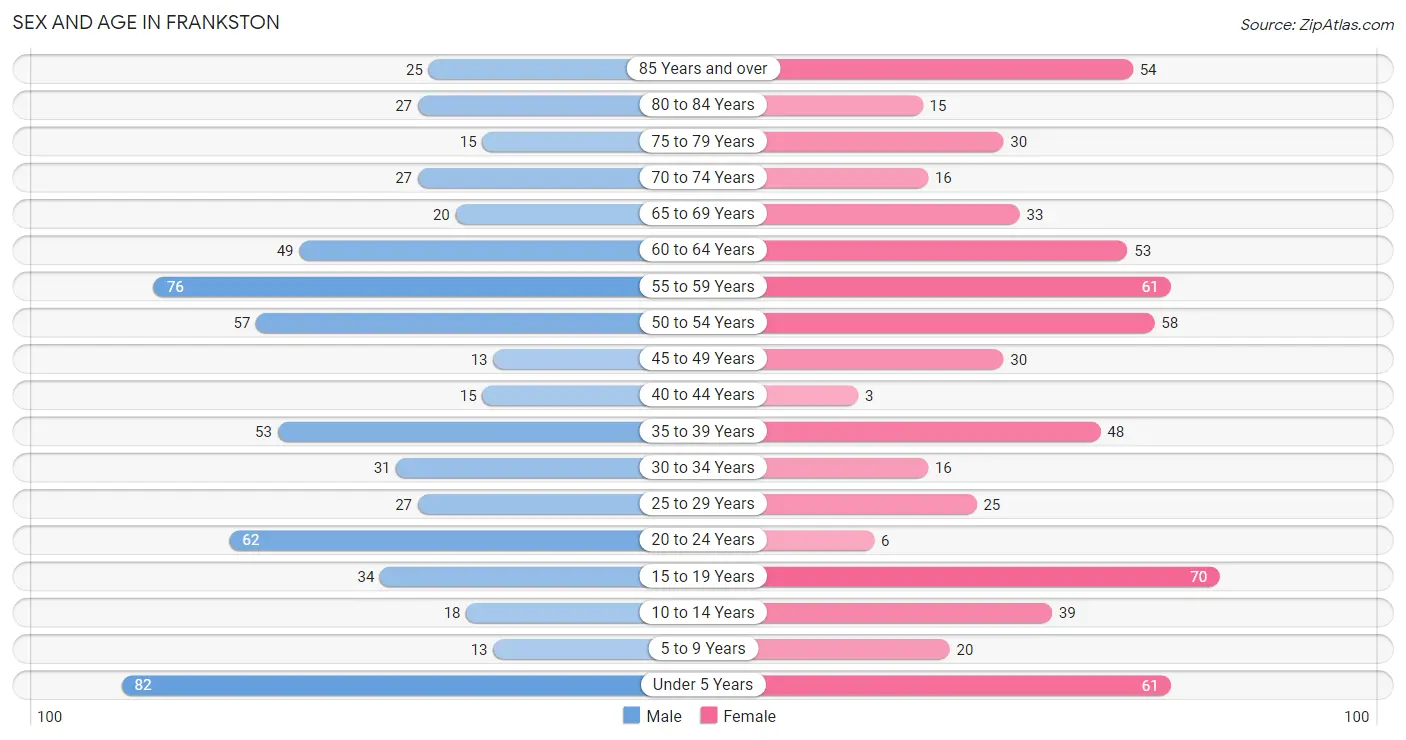
| Age Bracket | Male | Female |
| Under 5 Years | 82 (12.7%) | 61 (9.6%) |
| 5 to 9 Years | 13 (2.0%) | 20 (3.1%) |
| 10 to 14 Years | 18 (2.8%) | 39 (6.1%) |
| 15 to 19 Years | 34 (5.3%) | 70 (11.0%) |
| 20 to 24 Years | 62 (9.6%) | 6 (0.9%) |
| 25 to 29 Years | 27 (4.2%) | 25 (3.9%) |
| 30 to 34 Years | 31 (4.8%) | 16 (2.5%) |
| 35 to 39 Years | 53 (8.2%) | 48 (7.5%) |
| 40 to 44 Years | 15 (2.3%) | 3 (0.5%) |
| 45 to 49 Years | 13 (2.0%) | 30 (4.7%) |
| 50 to 54 Years | 57 (8.8%) | 58 (9.1%) |
| 55 to 59 Years | 76 (11.8%) | 61 (9.6%) |
| 60 to 64 Years | 49 (7.6%) | 53 (8.3%) |
| 65 to 69 Years | 20 (3.1%) | 33 (5.2%) |
| 70 to 74 Years | 27 (4.2%) | 16 (2.5%) |
| 75 to 79 Years | 15 (2.3%) | 30 (4.7%) |
| 80 to 84 Years | 27 (4.2%) | 15 (2.4%) |
| 85 Years and over | 25 (3.9%) | 54 (8.5%) |
| Total | 644 (100.0%) | 638 (100.0%) |
Families and Households in Frankston
Median Family Size in Frankston
The median family size in Frankston is 3.34 persons per family, with single female/mother families (119 | 40.5%) accounting for the largest median family size of 3.57 persons per family. On the other hand, married-couple families (139 | 47.3%) represent the smallest median family size with 3.13 persons per family.
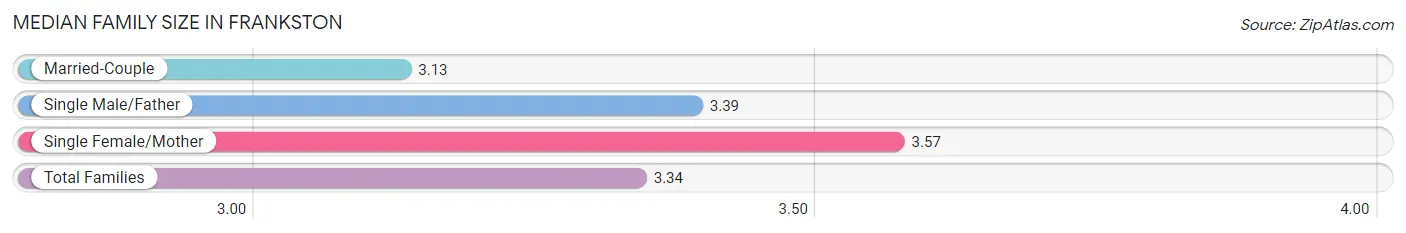
| Family Type | # Families | Family Size |
| Married-Couple | 139 (47.3%) | 3.13 |
| Single Male/Father | 36 (12.2%) | 3.39 |
| Single Female/Mother | 119 (40.5%) | 3.57 |
| Total Families | 294 (100.0%) | 3.34 |
Median Household Size in Frankston
The median household size in Frankston is 2.55 persons per household, with single female/mother households (119 | 24.4%) accounting for the largest median household size of 4.02 persons per household. non-family households (194 | 39.8%) represent the smallest median household size with 1.08 persons per household.
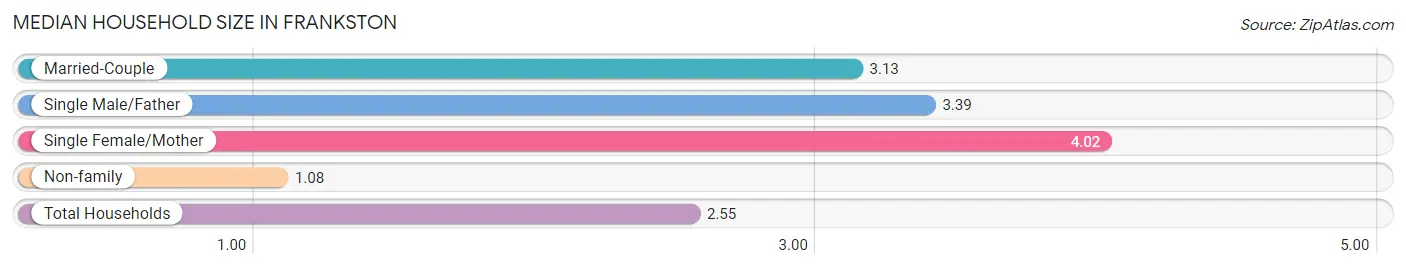
| Household Type | # Households | Household Size |
| Married-Couple | 139 (28.5%) | 3.13 |
| Single Male/Father | 36 (7.4%) | 3.39 |
| Single Female/Mother | 119 (24.4%) | 4.02 |
| Non-family | 194 (39.8%) | 1.08 |
| Total Households | 488 (100.0%) | 2.55 |
Household Size by Marriage Status in Frankston
Out of a total of 488 households in Frankston, 294 (60.3%) are family households, while 194 (39.8%) are nonfamily households. The most numerous type of family households are 2-person households, comprising 162, and the most common type of nonfamily households are 1-person households, comprising 180.
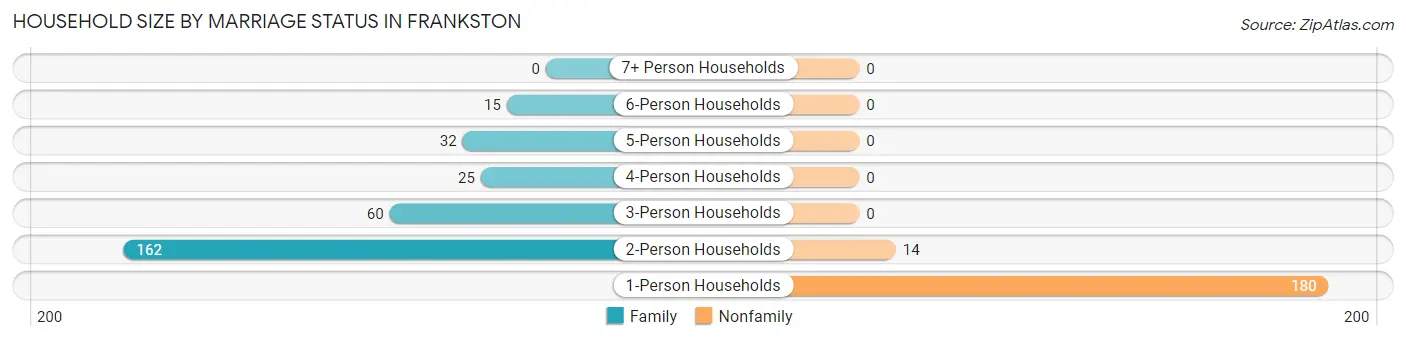
| Household Size | Family Households | Nonfamily Households |
| 1-Person Households | - | 180 (36.9%) |
| 2-Person Households | 162 (33.2%) | 14 (2.9%) |
| 3-Person Households | 60 (12.3%) | 0 (0.0%) |
| 4-Person Households | 25 (5.1%) | 0 (0.0%) |
| 5-Person Households | 32 (6.6%) | 0 (0.0%) |
| 6-Person Households | 15 (3.1%) | 0 (0.0%) |
| 7+ Person Households | 0 (0.0%) | 0 (0.0%) |
| Total | 294 (60.3%) | 194 (39.8%) |
Female Fertility in Frankston
Fertility by Age in Frankston
Average fertility rate in Frankston is 49.0 births per 1,000 women. Women in the age bracket of 20 to 34 years have the highest fertility rate with 213.0 births per 1,000 women. Women in the age bracket of 20 to 34 years acount for 100.0% of all women with births.
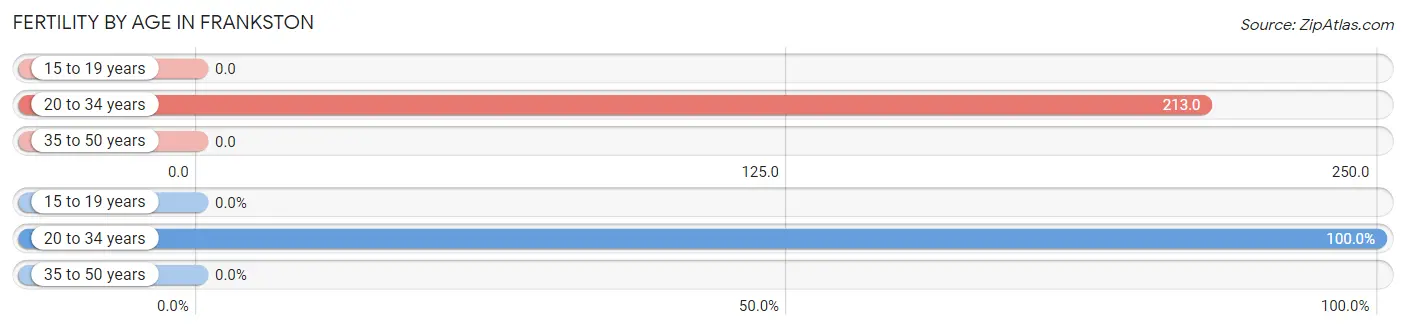
| Age Bracket | Women with Births | Births / 1,000 Women |
| 15 to 19 years | 0 (0.0%) | 0.0 |
| 20 to 34 years | 10 (100.0%) | 213.0 |
| 35 to 50 years | 0 (0.0%) | 0.0 |
| Total | 10 (100.0%) | 49.0 |
Fertility by Age by Marriage Status in Frankston
60.0% of women with births (10) in Frankston are married. The highest percentage of unmarried women with births falls into 20 to 34 years age bracket with 40.0% of them unmarried at the time of birth, while the lowest percentage of unmarried women with births belong to 20 to 34 years age bracket with 40.0% of them unmarried.
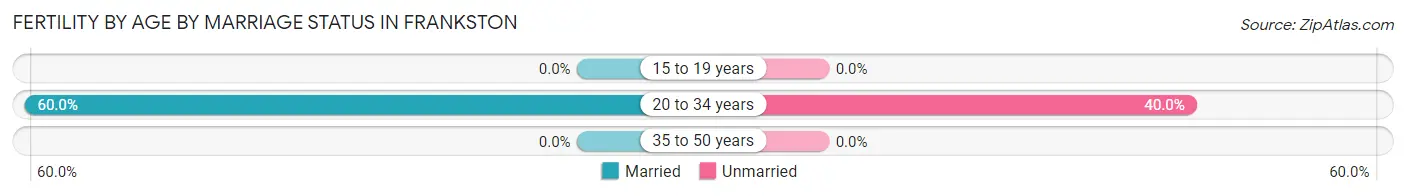
| Age Bracket | Married | Unmarried |
| 15 to 19 years | 0 (0.0%) | 0 (0.0%) |
| 20 to 34 years | 6 (60.0%) | 4 (40.0%) |
| 35 to 50 years | 0 (0.0%) | 0 (0.0%) |
| Total | 6 (60.0%) | 4 (40.0%) |
Fertility by Education in Frankston
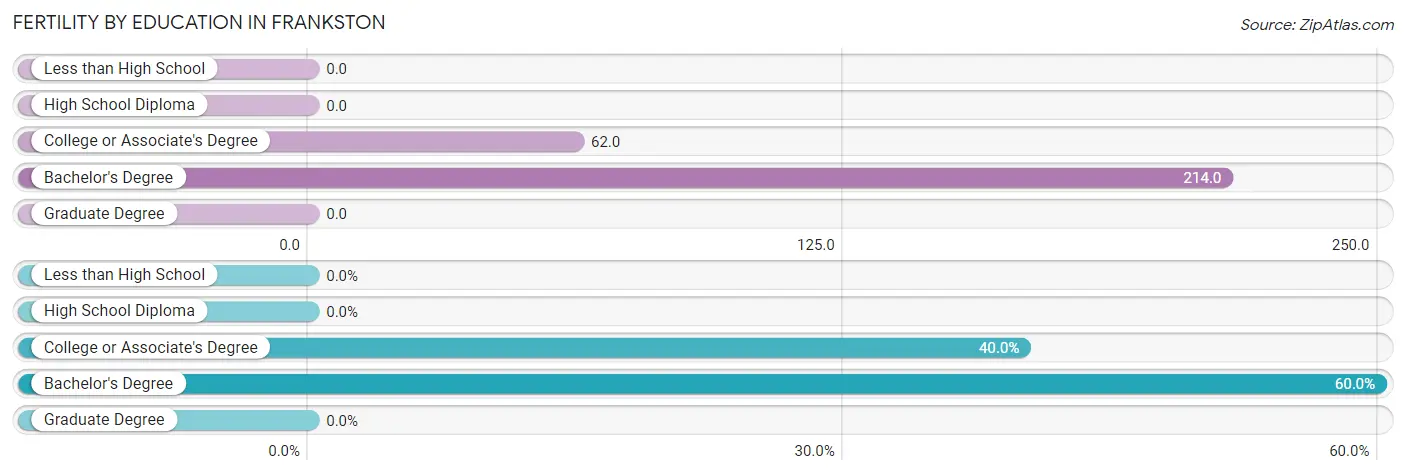
| Educational Attainment | Women with Births | Births / 1,000 Women |
| Less than High School | 0 (0.0%) | 0.0 |
| High School Diploma | 0 (0.0%) | 0.0 |
| College or Associate's Degree | 4 (40.0%) | 62.0 |
| Bachelor's Degree | 6 (60.0%) | 214.0 |
| Graduate Degree | 0 (0.0%) | 0.0 |
| Total | 10 (100.0%) | 49.0 |
Fertility by Education by Marriage Status in Frankston
40.0% of women with births in Frankston are unmarried. Women with the educational attainment of bachelor's degree are most likely to be married with 100.0% of them married at childbirth, while women with the educational attainment of college or associate's degree are least likely to be married with 100.0% of them unmarried at childbirth.
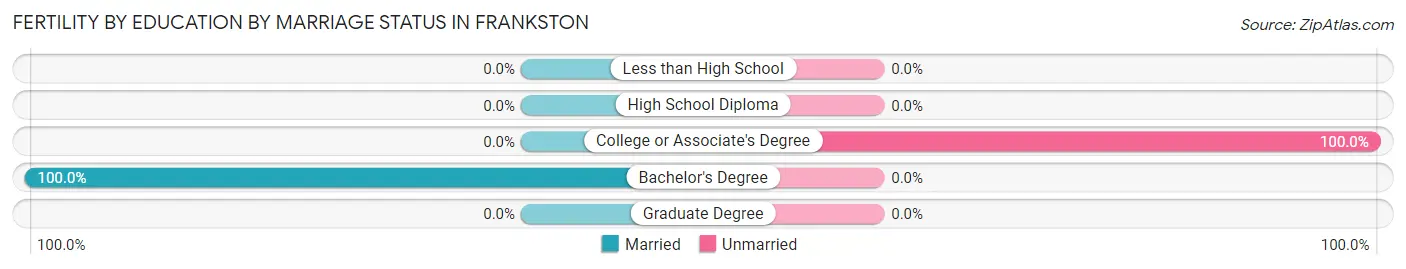
| Educational Attainment | Married | Unmarried |
| Less than High School | 0 (0.0%) | 0 (0.0%) |
| High School Diploma | 0 (0.0%) | 0 (0.0%) |
| College or Associate's Degree | 0 (0.0%) | 4 (100.0%) |
| Bachelor's Degree | 6 (100.0%) | 0 (0.0%) |
| Graduate Degree | 0 (0.0%) | 0 (0.0%) |
| Total | 6 (60.0%) | 4 (40.0%) |
Employment Characteristics in Frankston
Employment by Class of Employer in Frankston
Among the 446 employed individuals in Frankston, private company employees (347 | 77.8%), not-for-profit organizations (33 | 7.4%), and local government employees (26 | 5.8%) make up the most common classes of employment.
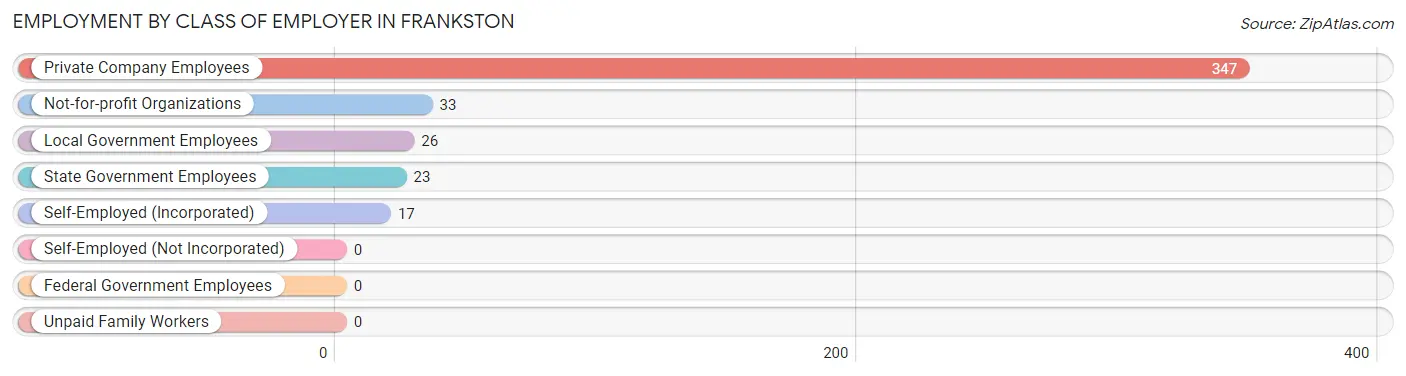
| Employer Class | # Employees | % Employees |
| Private Company Employees | 347 | 77.8% |
| Self-Employed (Incorporated) | 17 | 3.8% |
| Self-Employed (Not Incorporated) | 0 | 0.0% |
| Not-for-profit Organizations | 33 | 7.4% |
| Local Government Employees | 26 | 5.8% |
| State Government Employees | 23 | 5.2% |
| Federal Government Employees | 0 | 0.0% |
| Unpaid Family Workers | 0 | 0.0% |
| Total | 446 | 100.0% |
Employment Status by Age in Frankston
According to the labor force statistics for Frankston, out of the total population over 16 years of age (1,024), 48.5% or 497 individuals are in the labor force, with 10.3% or 51 of them unemployed. The age group with the highest labor force participation rate is 35 to 44 years, with 93.3% or 111 individuals in the labor force. Within the labor force, the 30 to 34 years age range has the highest percentage of unemployed individuals, with 74.3% or 26 of them being unemployed.
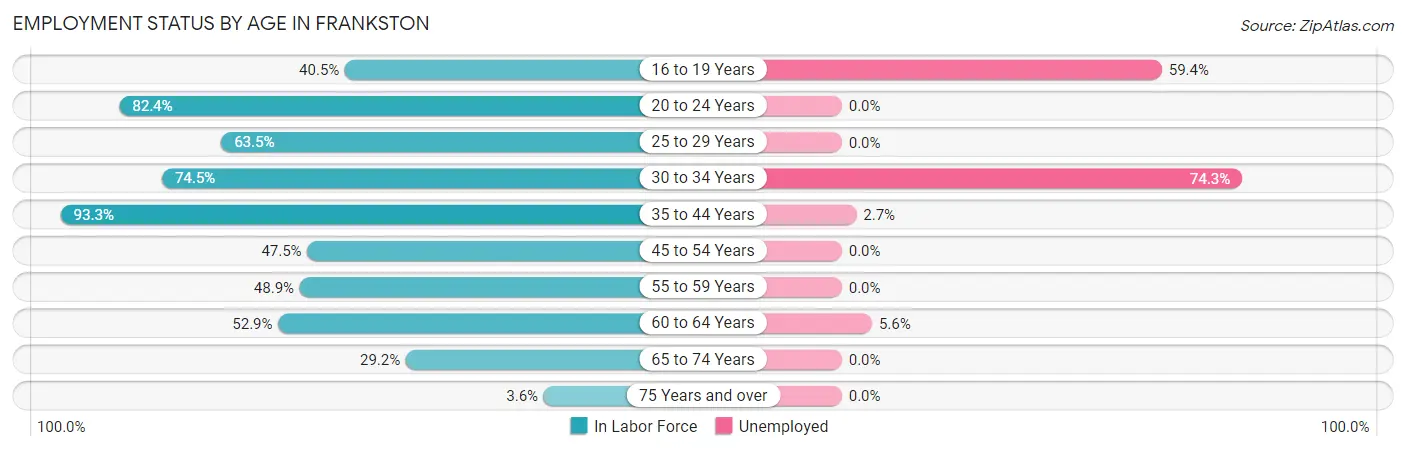
| Age Bracket | In Labor Force | Unemployed |
| 16 to 19 Years | 32 (40.5%) | 19 (59.4%) |
| 20 to 24 Years | 56 (82.4%) | 0 (0.0%) |
| 25 to 29 Years | 33 (63.5%) | 0 (0.0%) |
| 30 to 34 Years | 35 (74.5%) | 26 (74.3%) |
| 35 to 44 Years | 111 (93.3%) | 3 (2.7%) |
| 45 to 54 Years | 75 (47.5%) | 0 (0.0%) |
| 55 to 59 Years | 67 (48.9%) | 0 (0.0%) |
| 60 to 64 Years | 54 (52.9%) | 3 (5.6%) |
| 65 to 74 Years | 28 (29.2%) | 0 (0.0%) |
| 75 Years and over | 6 (3.6%) | 0 (0.0%) |
| Total | 497 (48.5%) | 51 (10.3%) |
Employment Status by Educational Attainment in Frankston
According to labor force statistics for Frankston, 61.0% of individuals (375) out of the total population between 25 and 64 years of age (615) are in the labor force, with 8.5% or 32 of them being unemployed. The group with the highest labor force participation rate are those with the educational attainment of college / associate degree, with 73.5% or 169 individuals in the labor force. Within the labor force, individuals with high school diploma education have the highest percentage of unemployment, with 21.5% or 26 of them being unemployed.
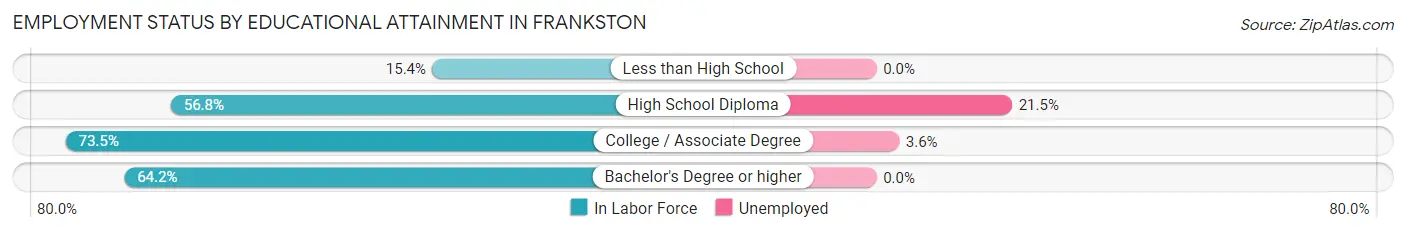
| Educational Attainment | In Labor Force | Unemployed |
| Less than High School | 8 (15.4%) | 0 (0.0%) |
| High School Diploma | 121 (56.8%) | 46 (21.5%) |
| College / Associate Degree | 169 (73.5%) | 8 (3.6%) |
| Bachelor's Degree or higher | 77 (64.2%) | 0 (0.0%) |
| Total | 375 (61.0%) | 52 (8.5%) |
Employment Occupations by Sex in Frankston
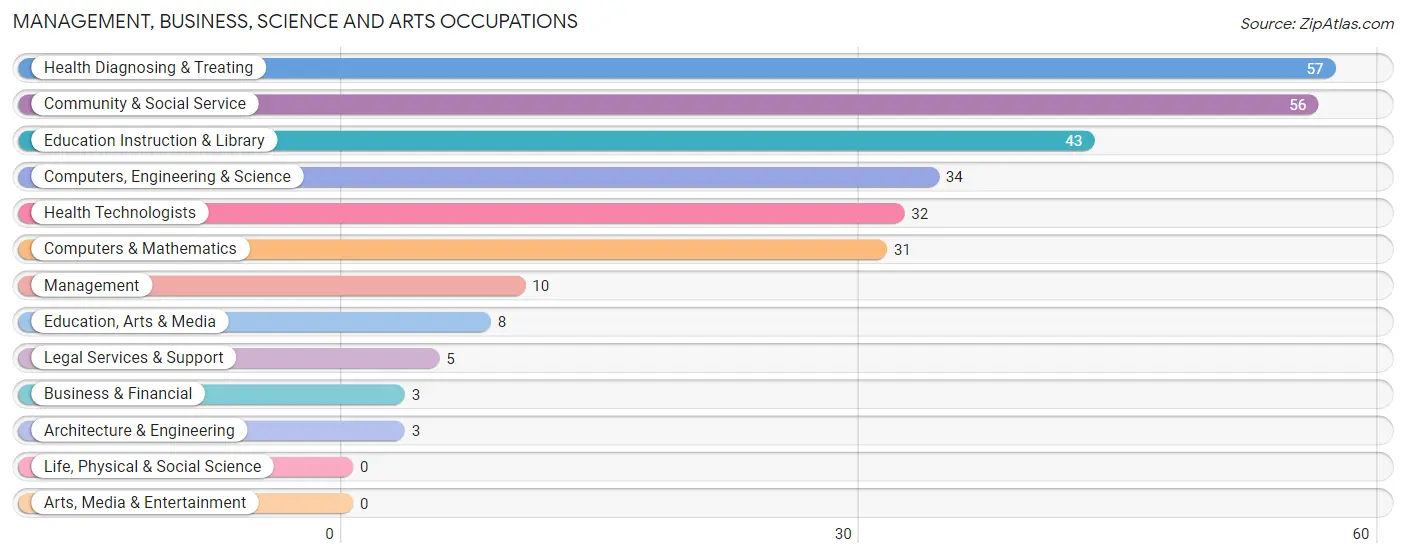
Management, Business, Science and Arts Occupations
The most common Management, Business, Science and Arts occupations in Frankston are Health Diagnosing & Treating (57 | 12.8%), Community & Social Service (56 | 12.6%), Education Instruction & Library (43 | 9.6%), Computers, Engineering & Science (34 | 7.6%), and Health Technologists (32 | 7.2%).
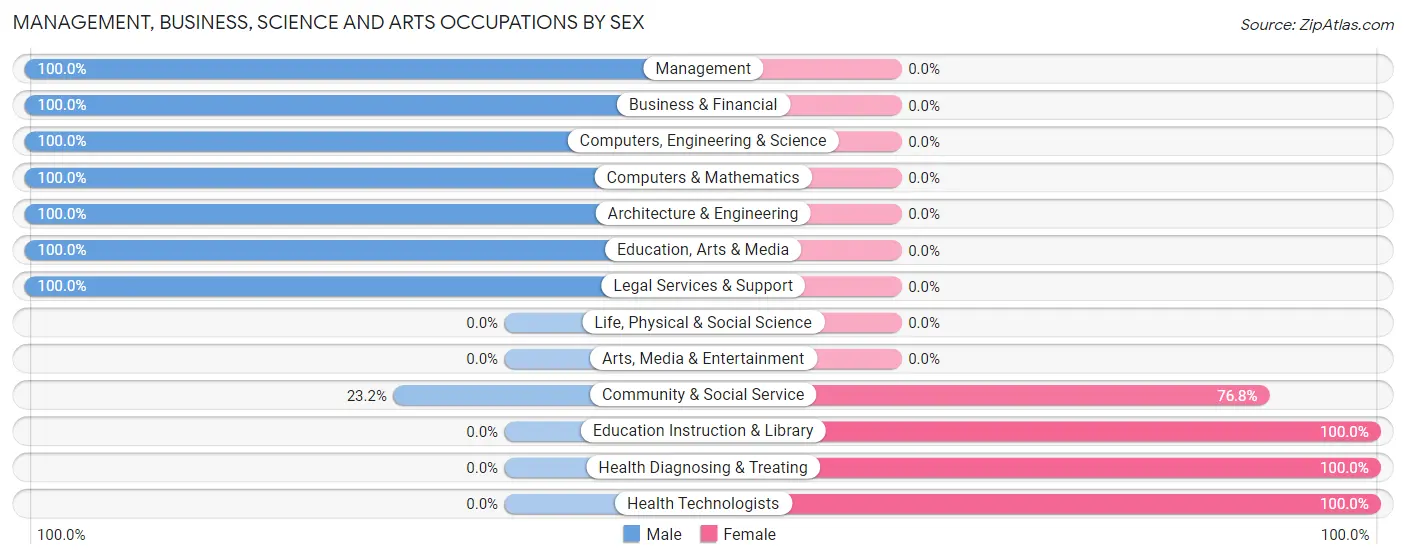
Management, Business, Science and Arts Occupations by Sex
Within the Management, Business, Science and Arts occupations in Frankston, the most male-oriented occupations are Management (100.0%), Business & Financial (100.0%), and Computers, Engineering & Science (100.0%), while the most female-oriented occupations are Education Instruction & Library (100.0%), Health Diagnosing & Treating (100.0%), and Health Technologists (100.0%).
| Occupation | Male | Female |
| Management | 10 (100.0%) | 0 (0.0%) |
| Business & Financial | 3 (100.0%) | 0 (0.0%) |
| Computers, Engineering & Science | 34 (100.0%) | 0 (0.0%) |
| Computers & Mathematics | 31 (100.0%) | 0 (0.0%) |
| Architecture & Engineering | 3 (100.0%) | 0 (0.0%) |
| Life, Physical & Social Science | 0 (0.0%) | 0 (0.0%) |
| Community & Social Service | 13 (23.2%) | 43 (76.8%) |
| Education, Arts & Media | 8 (100.0%) | 0 (0.0%) |
| Legal Services & Support | 5 (100.0%) | 0 (0.0%) |
| Education Instruction & Library | 0 (0.0%) | 43 (100.0%) |
| Arts, Media & Entertainment | 0 (0.0%) | 0 (0.0%) |
| Health Diagnosing & Treating | 0 (0.0%) | 57 (100.0%) |
| Health Technologists | 0 (0.0%) | 32 (100.0%) |
| Total (Category) | 60 (37.5%) | 100 (62.5%) |
| Total (Overall) | 235 (52.7%) | 211 (47.3%) |
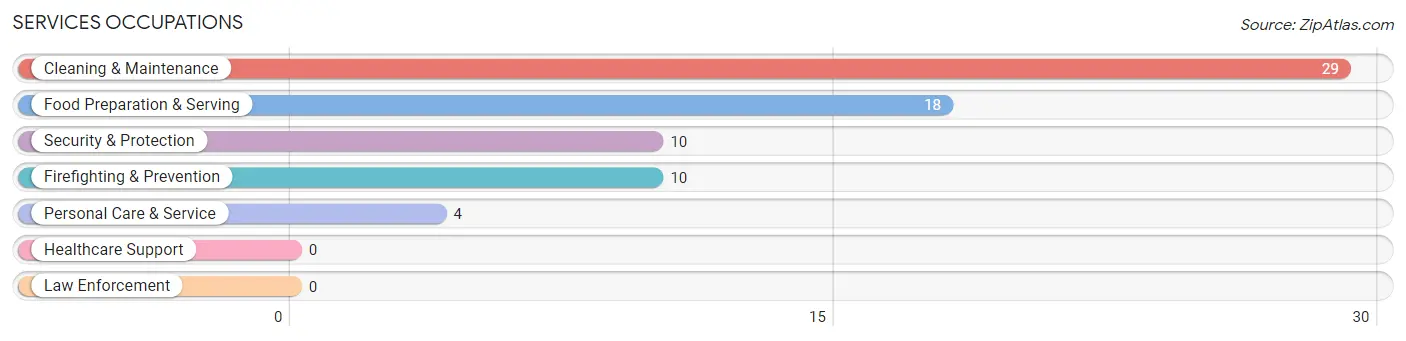
Services Occupations
The most common Services occupations in Frankston are Cleaning & Maintenance (29 | 6.5%), Food Preparation & Serving (18 | 4.0%), Security & Protection (10 | 2.2%), Firefighting & Prevention (10 | 2.2%), and Personal Care & Service (4 | 0.9%).
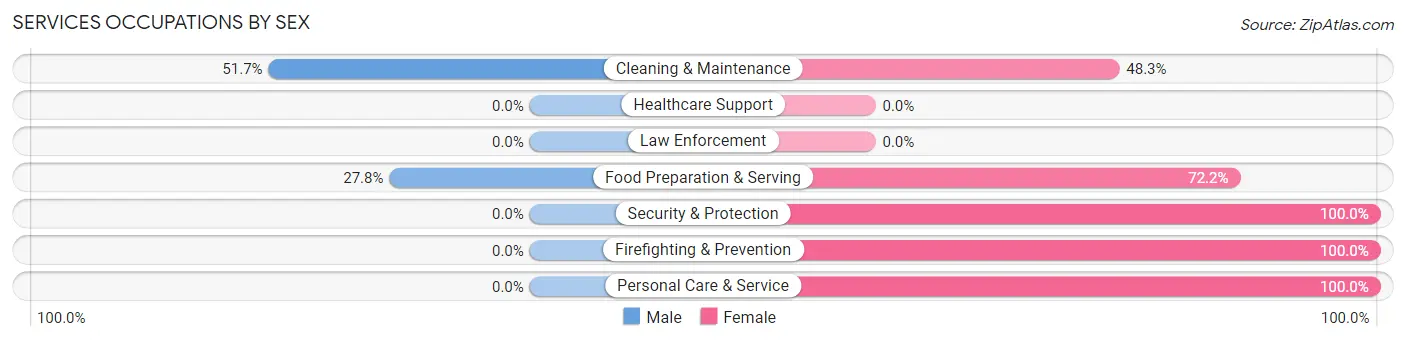
Services Occupations by Sex
Within the Services occupations in Frankston, the most male-oriented occupations are Cleaning & Maintenance (51.7%), and Food Preparation & Serving (27.8%), while the most female-oriented occupations are Security & Protection (100.0%), Firefighting & Prevention (100.0%), and Personal Care & Service (100.0%).
| Occupation | Male | Female |
| Healthcare Support | 0 (0.0%) | 0 (0.0%) |
| Security & Protection | 0 (0.0%) | 10 (100.0%) |
| Firefighting & Prevention | 0 (0.0%) | 10 (100.0%) |
| Law Enforcement | 0 (0.0%) | 0 (0.0%) |
| Food Preparation & Serving | 5 (27.8%) | 13 (72.2%) |
| Cleaning & Maintenance | 15 (51.7%) | 14 (48.3%) |
| Personal Care & Service | 0 (0.0%) | 4 (100.0%) |
| Total (Category) | 20 (32.8%) | 41 (67.2%) |
| Total (Overall) | 235 (52.7%) | 211 (47.3%) |
Sales and Office Occupations
The most common Sales and Office occupations in Frankston are Sales & Related (53 | 11.9%), and Office & Administration (33 | 7.4%).
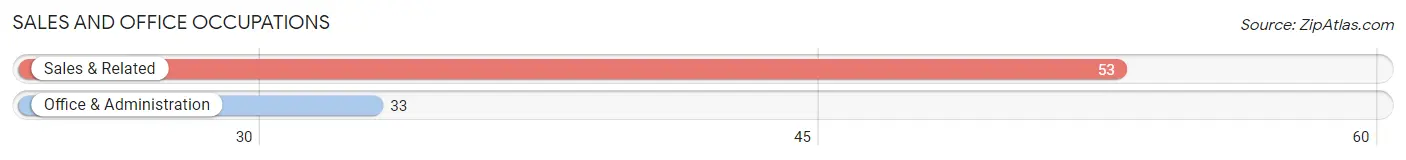
Sales and Office Occupations by Sex
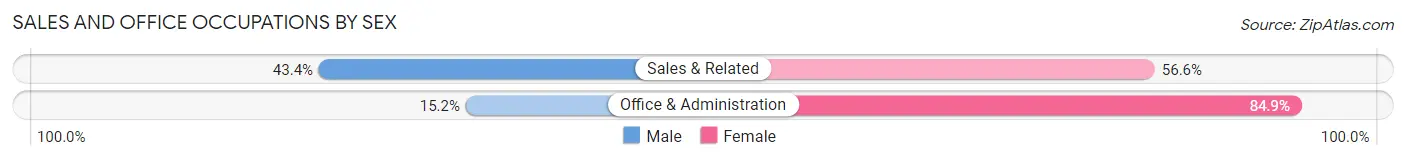
| Occupation | Male | Female |
| Sales & Related | 23 (43.4%) | 30 (56.6%) |
| Office & Administration | 5 (15.1%) | 28 (84.9%) |
| Total (Category) | 28 (32.6%) | 58 (67.4%) |
| Total (Overall) | 235 (52.7%) | 211 (47.3%) |
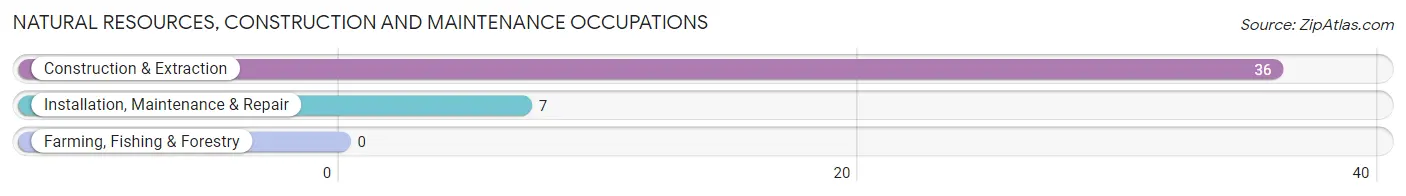
Natural Resources, Construction and Maintenance Occupations
The most common Natural Resources, Construction and Maintenance occupations in Frankston are Construction & Extraction (36 | 8.1%), and Installation, Maintenance & Repair (7 | 1.6%).
Natural Resources, Construction and Maintenance Occupations by Sex
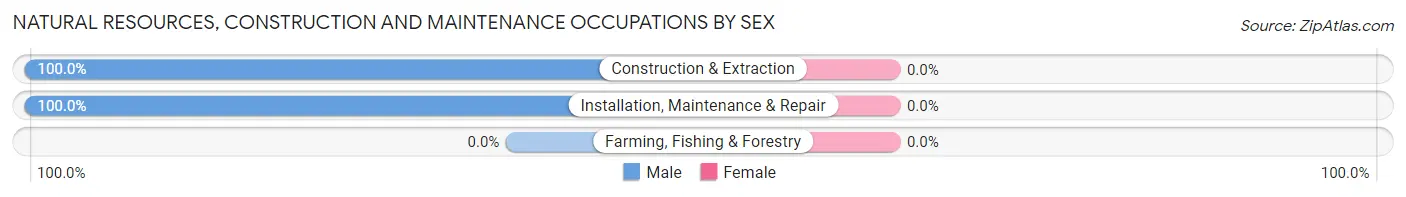
| Occupation | Male | Female |
| Farming, Fishing & Forestry | 0 (0.0%) | 0 (0.0%) |
| Construction & Extraction | 36 (100.0%) | 0 (0.0%) |
| Installation, Maintenance & Repair | 7 (100.0%) | 0 (0.0%) |
| Total (Category) | 43 (100.0%) | 0 (0.0%) |
| Total (Overall) | 235 (52.7%) | 211 (47.3%) |
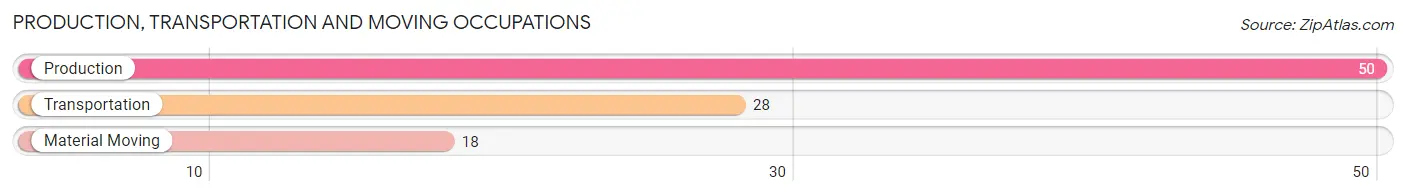
Production, Transportation and Moving Occupations
The most common Production, Transportation and Moving occupations in Frankston are Production (50 | 11.2%), Transportation (28 | 6.3%), and Material Moving (18 | 4.0%).
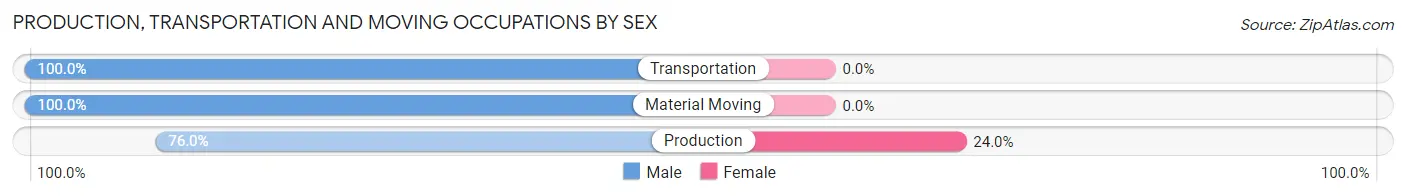
Production, Transportation and Moving Occupations by Sex
| Occupation | Male | Female |
| Production | 38 (76.0%) | 12 (24.0%) |
| Transportation | 28 (100.0%) | 0 (0.0%) |
| Material Moving | 18 (100.0%) | 0 (0.0%) |
| Total (Category) | 84 (87.5%) | 12 (12.5%) |
| Total (Overall) | 235 (52.7%) | 211 (47.3%) |
Employment Industries by Sex in Frankston
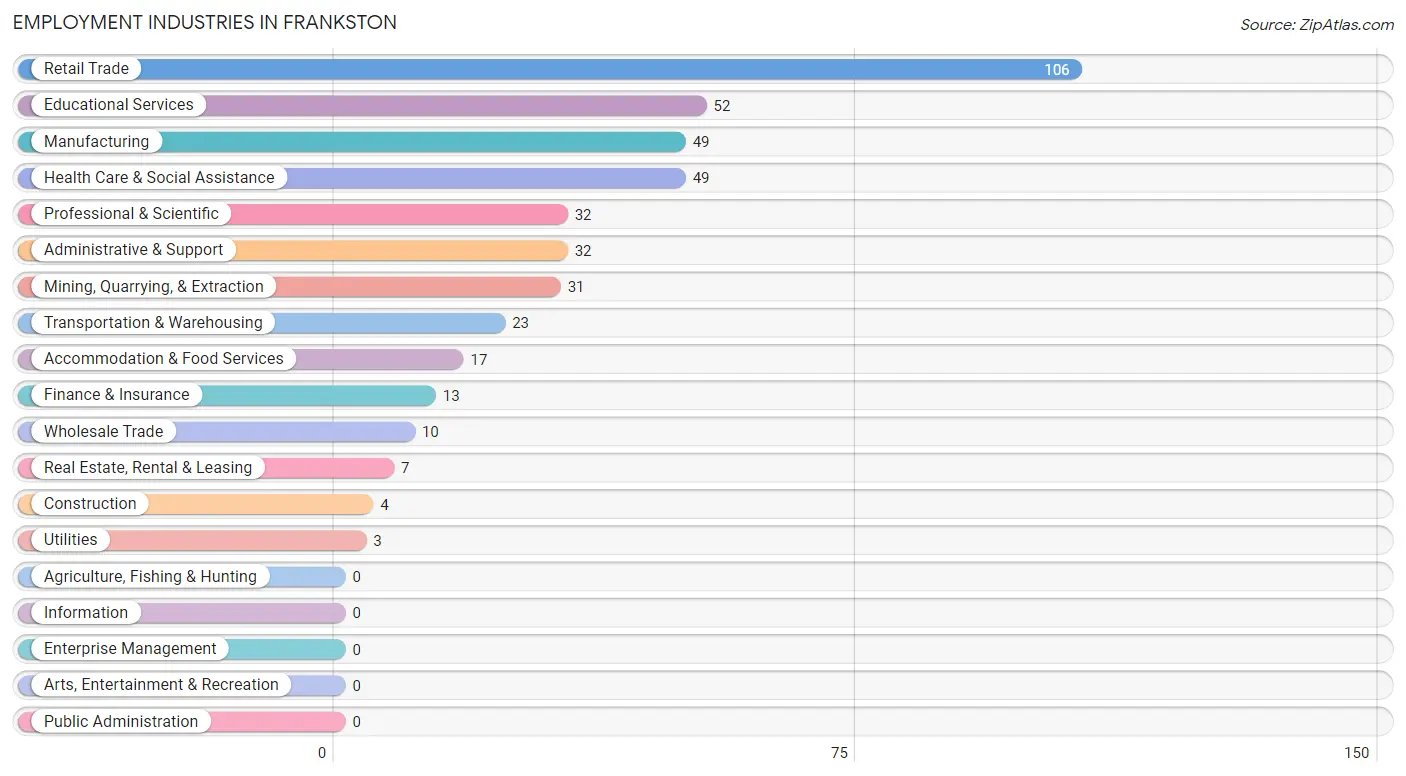
Employment Industries in Frankston
The major employment industries in Frankston include Retail Trade (106 | 23.8%), Educational Services (52 | 11.7%), Manufacturing (49 | 11.0%), Health Care & Social Assistance (49 | 11.0%), and Professional & Scientific (32 | 7.2%).
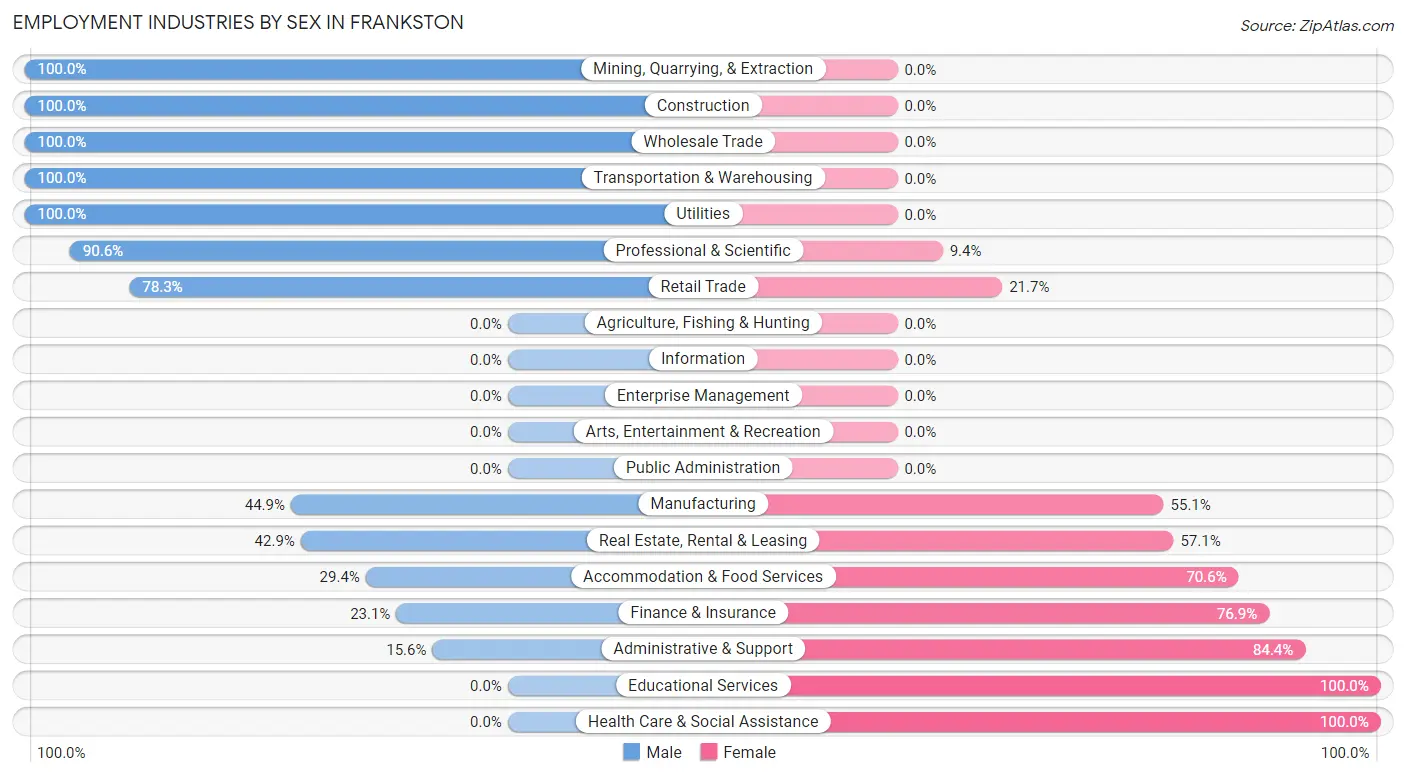
Employment Industries by Sex in Frankston
The Frankston industries that see more men than women are Mining, Quarrying, & Extraction (100.0%), Construction (100.0%), and Wholesale Trade (100.0%), whereas the industries that tend to have a higher number of women are Educational Services (100.0%), Health Care & Social Assistance (100.0%), and Administrative & Support (84.4%).
| Industry | Male | Female |
| Agriculture, Fishing & Hunting | 0 (0.0%) | 0 (0.0%) |
| Mining, Quarrying, & Extraction | 31 (100.0%) | 0 (0.0%) |
| Construction | 4 (100.0%) | 0 (0.0%) |
| Manufacturing | 22 (44.9%) | 27 (55.1%) |
| Wholesale Trade | 10 (100.0%) | 0 (0.0%) |
| Retail Trade | 83 (78.3%) | 23 (21.7%) |
| Transportation & Warehousing | 23 (100.0%) | 0 (0.0%) |
| Utilities | 3 (100.0%) | 0 (0.0%) |
| Information | 0 (0.0%) | 0 (0.0%) |
| Finance & Insurance | 3 (23.1%) | 10 (76.9%) |
| Real Estate, Rental & Leasing | 3 (42.9%) | 4 (57.1%) |
| Professional & Scientific | 29 (90.6%) | 3 (9.4%) |
| Enterprise Management | 0 (0.0%) | 0 (0.0%) |
| Administrative & Support | 5 (15.6%) | 27 (84.4%) |
| Educational Services | 0 (0.0%) | 52 (100.0%) |
| Health Care & Social Assistance | 0 (0.0%) | 49 (100.0%) |
| Arts, Entertainment & Recreation | 0 (0.0%) | 0 (0.0%) |
| Accommodation & Food Services | 5 (29.4%) | 12 (70.6%) |
| Public Administration | 0 (0.0%) | 0 (0.0%) |
| Total | 235 (52.7%) | 211 (47.3%) |
Education in Frankston
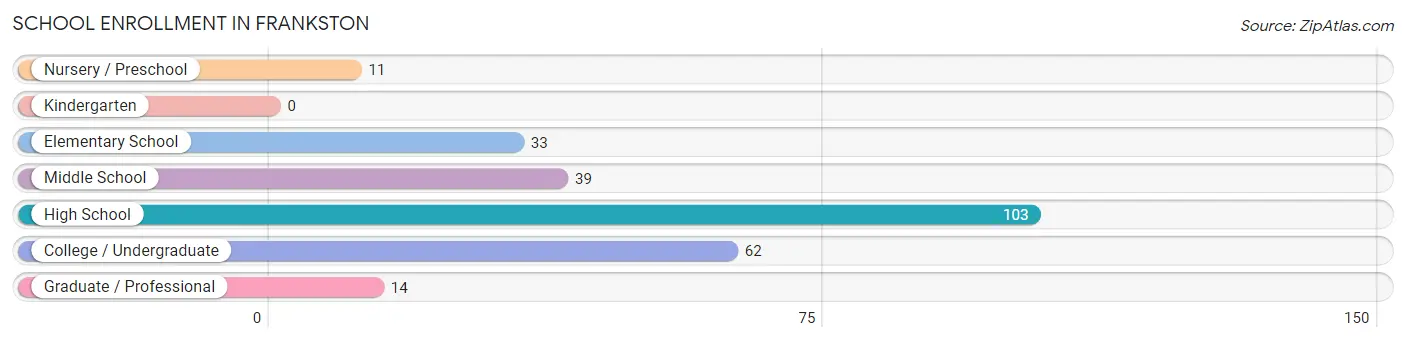
School Enrollment in Frankston
The most common levels of schooling among the 262 students in Frankston are high school (103 | 39.3%), college / undergraduate (62 | 23.7%), and middle school (39 | 14.9%).
| School Level | # Students | % Students |
| Nursery / Preschool | 11 | 4.2% |
| Kindergarten | 0 | 0.0% |
| Elementary School | 33 | 12.6% |
| Middle School | 39 | 14.9% |
| High School | 103 | 39.3% |
| College / Undergraduate | 62 | 23.7% |
| Graduate / Professional | 14 | 5.3% |
| Total | 262 | 100.0% |
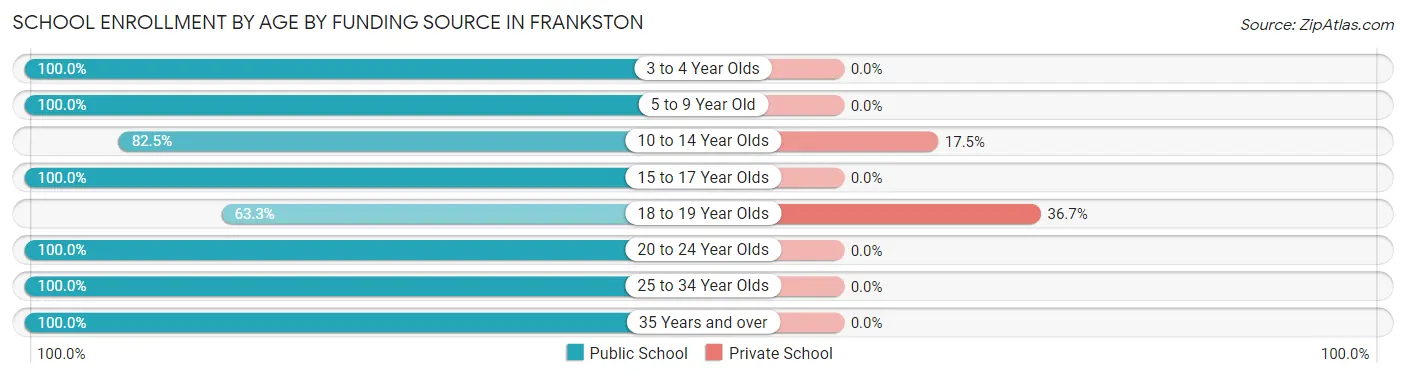
School Enrollment by Age by Funding Source in Frankston
Out of a total of 262 students who are enrolled in schools in Frankston, 21 (8.0%) attend a private institution, while the remaining 241 (92.0%) are enrolled in public schools. The age group of 18 to 19 year olds has the highest likelihood of being enrolled in private schools, with 11 (36.7% in the age bracket) enrolled. Conversely, the age group of 3 to 4 year olds has the lowest likelihood of being enrolled in a private school, with 11 (100.0% in the age bracket) attending a public institution.
| Age Bracket | Public School | Private School |
| 3 to 4 Year Olds | 11 (100.0%) | 0 (0.0%) |
| 5 to 9 Year Old | 33 (100.0%) | 0 (0.0%) |
| 10 to 14 Year Olds | 47 (82.5%) | 10 (17.5%) |
| 15 to 17 Year Olds | 74 (100.0%) | 0 (0.0%) |
| 18 to 19 Year Olds | 19 (63.3%) | 11 (36.7%) |
| 20 to 24 Year Olds | 7 (100.0%) | 0 (0.0%) |
| 25 to 34 Year Olds | 33 (100.0%) | 0 (0.0%) |
| 35 Years and over | 17 (100.0%) | 0 (0.0%) |
| Total | 241 (92.0%) | 21 (8.0%) |
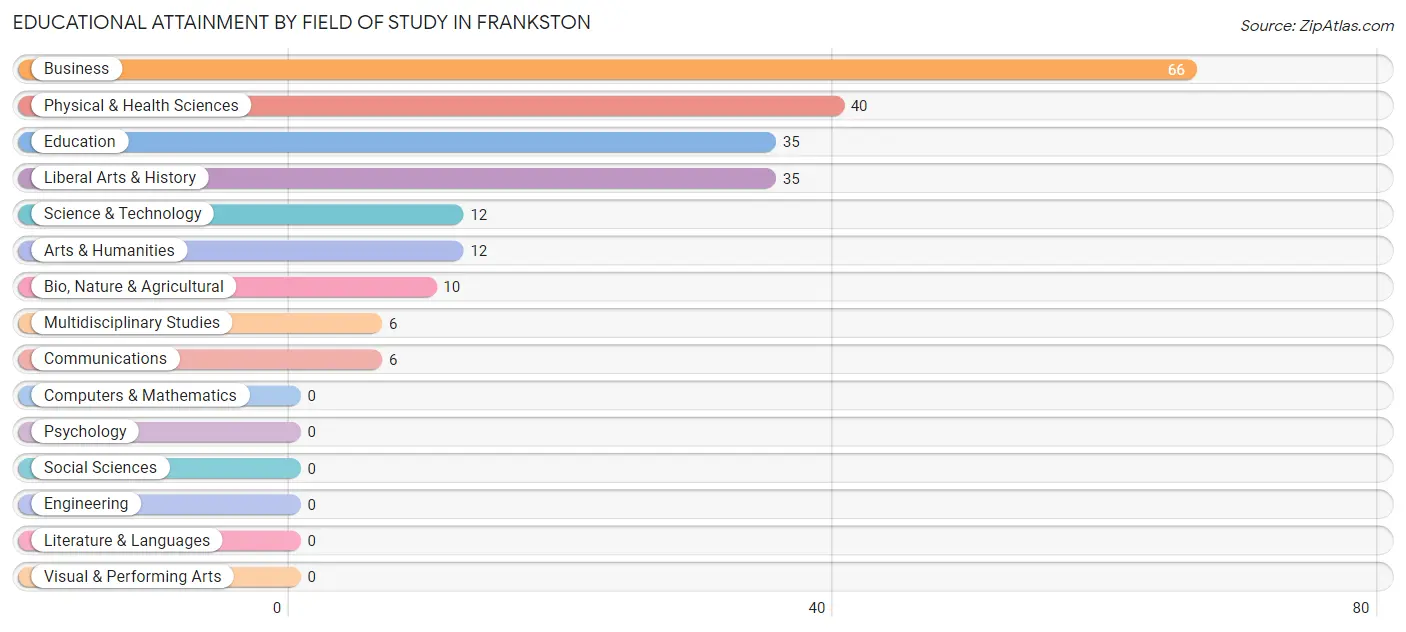
Educational Attainment by Field of Study in Frankston
Business (66 | 29.7%), physical & health sciences (40 | 18.0%), education (35 | 15.8%), liberal arts & history (35 | 15.8%), and science & technology (12 | 5.4%) are the most common fields of study among 222 individuals in Frankston who have obtained a bachelor's degree or higher.
| Field of Study | # Graduates | % Graduates |
| Computers & Mathematics | 0 | 0.0% |
| Bio, Nature & Agricultural | 10 | 4.5% |
| Physical & Health Sciences | 40 | 18.0% |
| Psychology | 0 | 0.0% |
| Social Sciences | 0 | 0.0% |
| Engineering | 0 | 0.0% |
| Multidisciplinary Studies | 6 | 2.7% |
| Science & Technology | 12 | 5.4% |
| Business | 66 | 29.7% |
| Education | 35 | 15.8% |
| Literature & Languages | 0 | 0.0% |
| Liberal Arts & History | 35 | 15.8% |
| Visual & Performing Arts | 0 | 0.0% |
| Communications | 6 | 2.7% |
| Arts & Humanities | 12 | 5.4% |
| Total | 222 | 100.0% |
Transportation & Commute in Frankston
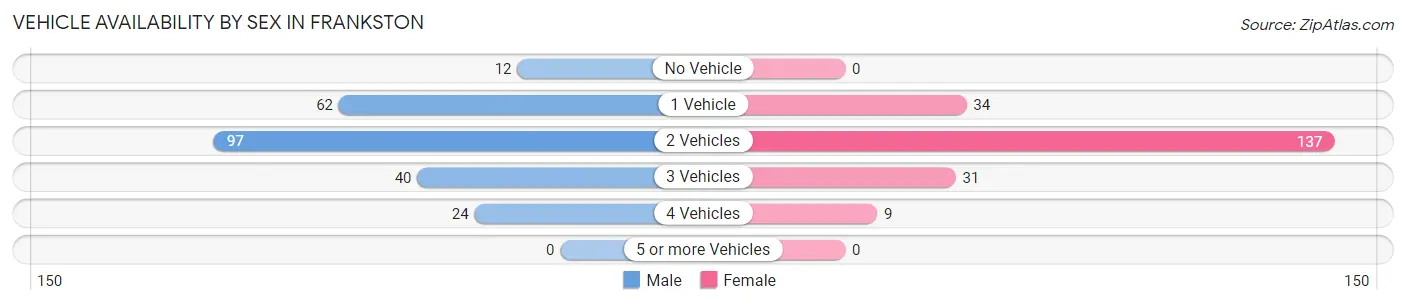
Vehicle Availability by Sex in Frankston
The most prevalent vehicle ownership categories in Frankston are males with 2 vehicles (97, accounting for 41.3%) and females with 2 vehicles (137, making up 46.0%).
| Vehicles Available | Male | Female |
| No Vehicle | 12 (5.1%) | 0 (0.0%) |
| 1 Vehicle | 62 (26.4%) | 34 (16.1%) |
| 2 Vehicles | 97 (41.3%) | 137 (64.9%) |
| 3 Vehicles | 40 (17.0%) | 31 (14.7%) |
| 4 Vehicles | 24 (10.2%) | 9 (4.3%) |
| 5 or more Vehicles | 0 (0.0%) | 0 (0.0%) |
| Total | 235 (100.0%) | 211 (100.0%) |
Commute Time in Frankston
The most frequently occuring commute durations in Frankston are 30 to 34 minutes (97 commuters, 23.7%), less than 5 minutes (61 commuters, 14.9%), and 45 to 59 minutes (59 commuters, 14.4%).
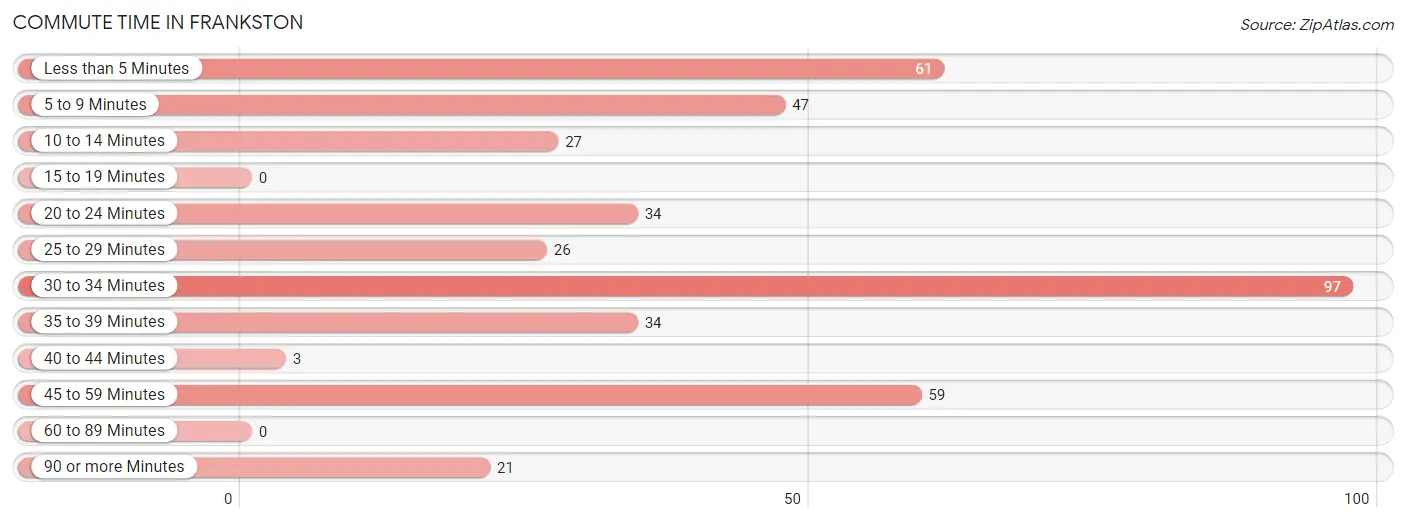
| Commute Time | # Commuters | % Commuters |
| Less than 5 Minutes | 61 | 14.9% |
| 5 to 9 Minutes | 47 | 11.5% |
| 10 to 14 Minutes | 27 | 6.6% |
| 15 to 19 Minutes | 0 | 0.0% |
| 20 to 24 Minutes | 34 | 8.3% |
| 25 to 29 Minutes | 26 | 6.4% |
| 30 to 34 Minutes | 97 | 23.7% |
| 35 to 39 Minutes | 34 | 8.3% |
| 40 to 44 Minutes | 3 | 0.7% |
| 45 to 59 Minutes | 59 | 14.4% |
| 60 to 89 Minutes | 0 | 0.0% |
| 90 or more Minutes | 21 | 5.1% |
Commute Time by Sex in Frankston
The most common commute times in Frankston are 30 to 34 minutes (58 commuters, 28.7%) for males and 45 to 59 minutes (52 commuters, 25.1%) for females.
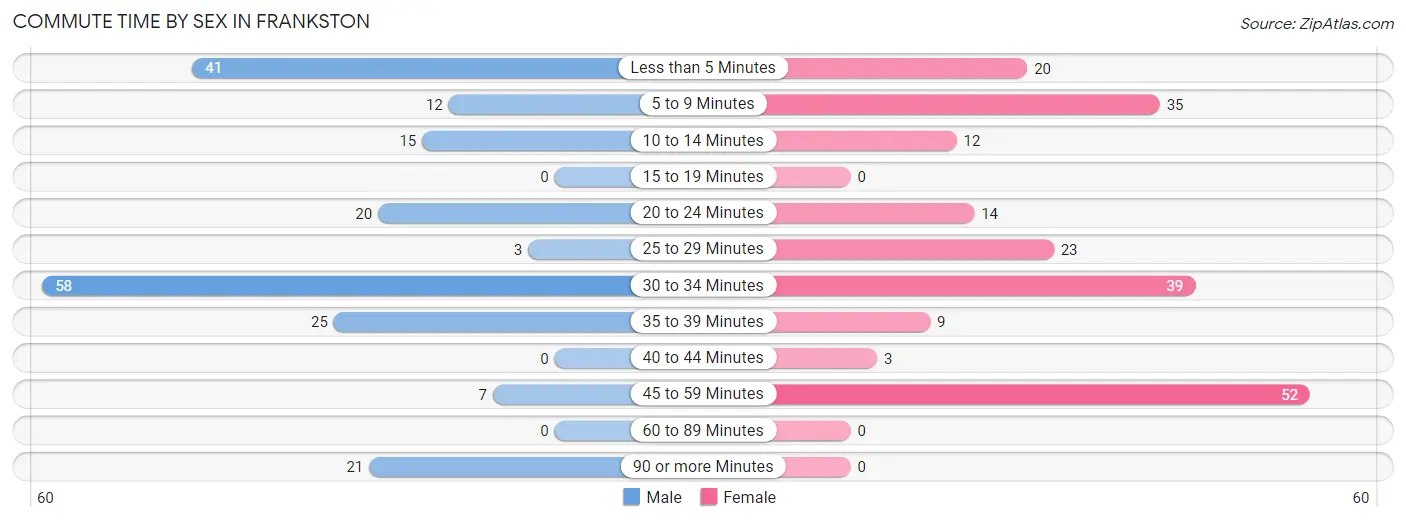
| Commute Time | Male | Female |
| Less than 5 Minutes | 41 (20.3%) | 20 (9.7%) |
| 5 to 9 Minutes | 12 (5.9%) | 35 (16.9%) |
| 10 to 14 Minutes | 15 (7.4%) | 12 (5.8%) |
| 15 to 19 Minutes | 0 (0.0%) | 0 (0.0%) |
| 20 to 24 Minutes | 20 (9.9%) | 14 (6.8%) |
| 25 to 29 Minutes | 3 (1.5%) | 23 (11.1%) |
| 30 to 34 Minutes | 58 (28.7%) | 39 (18.8%) |
| 35 to 39 Minutes | 25 (12.4%) | 9 (4.3%) |
| 40 to 44 Minutes | 0 (0.0%) | 3 (1.5%) |
| 45 to 59 Minutes | 7 (3.5%) | 52 (25.1%) |
| 60 to 89 Minutes | 0 (0.0%) | 0 (0.0%) |
| 90 or more Minutes | 21 (10.4%) | 0 (0.0%) |
Time of Departure to Work by Sex in Frankston
The most frequent times of departure to work in Frankston are 8:00 AM to 8:29 AM (48, 23.8%) for males and 7:00 AM to 7:29 AM (84, 40.6%) for females.
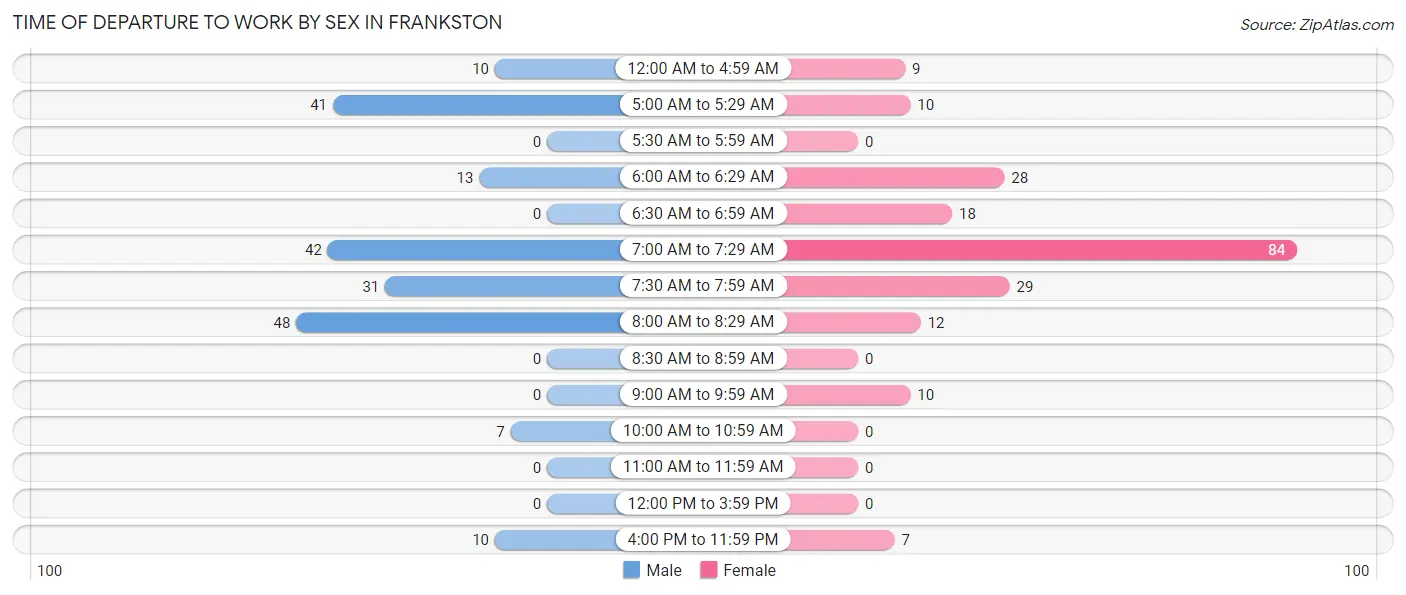
| Time of Departure | Male | Female |
| 12:00 AM to 4:59 AM | 10 (5.0%) | 9 (4.3%) |
| 5:00 AM to 5:29 AM | 41 (20.3%) | 10 (4.8%) |
| 5:30 AM to 5:59 AM | 0 (0.0%) | 0 (0.0%) |
| 6:00 AM to 6:29 AM | 13 (6.4%) | 28 (13.5%) |
| 6:30 AM to 6:59 AM | 0 (0.0%) | 18 (8.7%) |
| 7:00 AM to 7:29 AM | 42 (20.8%) | 84 (40.6%) |
| 7:30 AM to 7:59 AM | 31 (15.3%) | 29 (14.0%) |
| 8:00 AM to 8:29 AM | 48 (23.8%) | 12 (5.8%) |
| 8:30 AM to 8:59 AM | 0 (0.0%) | 0 (0.0%) |
| 9:00 AM to 9:59 AM | 0 (0.0%) | 10 (4.8%) |
| 10:00 AM to 10:59 AM | 7 (3.5%) | 0 (0.0%) |
| 11:00 AM to 11:59 AM | 0 (0.0%) | 0 (0.0%) |
| 12:00 PM to 3:59 PM | 0 (0.0%) | 0 (0.0%) |
| 4:00 PM to 11:59 PM | 10 (5.0%) | 7 (3.4%) |
| Total | 202 (100.0%) | 207 (100.0%) |
Housing Occupancy in Frankston
Occupancy by Ownership in Frankston
Of the total 488 dwellings in Frankston, owner-occupied units account for 325 (66.6%), while renter-occupied units make up 163 (33.4%).
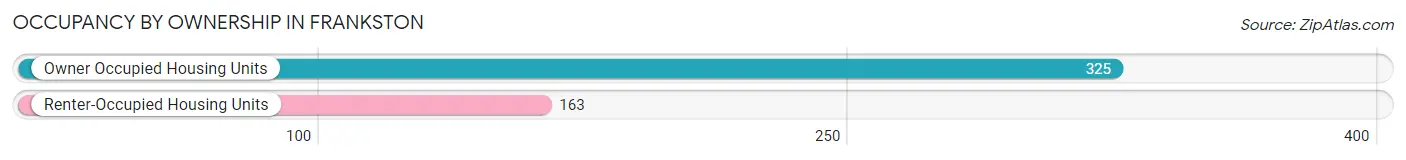
| Occupancy | # Housing Units | % Housing Units |
| Owner Occupied Housing Units | 325 | 66.6% |
| Renter-Occupied Housing Units | 163 | 33.4% |
| Total Occupied Housing Units | 488 | 100.0% |
Occupancy by Household Size in Frankston
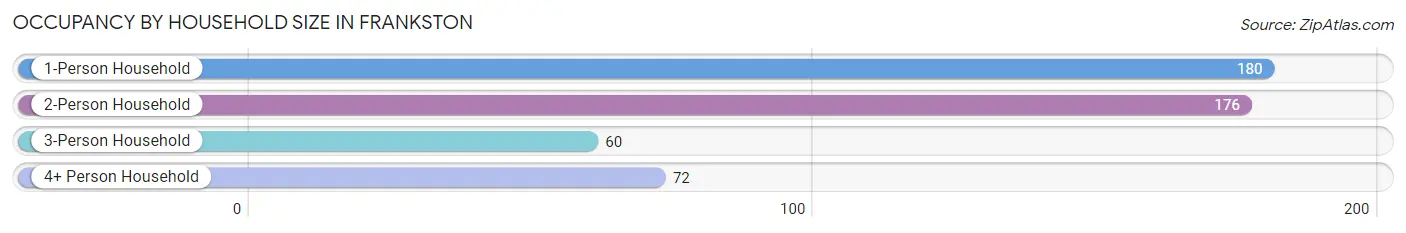
| Household Size | # Housing Units | % Housing Units |
| 1-Person Household | 180 | 36.9% |
| 2-Person Household | 176 | 36.1% |
| 3-Person Household | 60 | 12.3% |
| 4+ Person Household | 72 | 14.7% |
| Total Housing Units | 488 | 100.0% |
Occupancy by Ownership by Household Size in Frankston
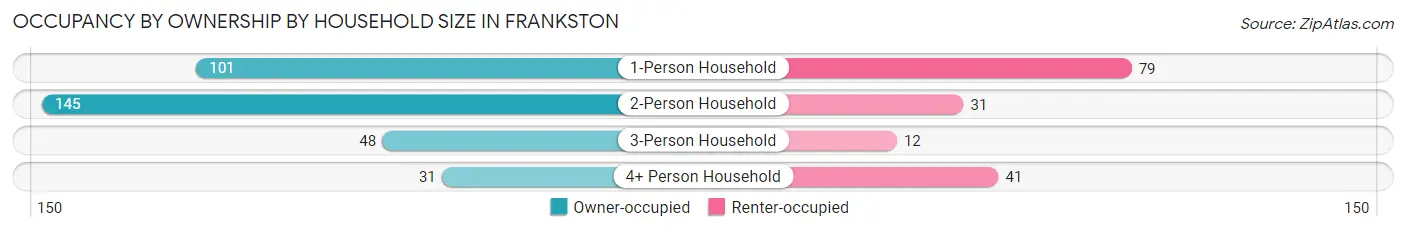
| Household Size | Owner-occupied | Renter-occupied |
| 1-Person Household | 101 (56.1%) | 79 (43.9%) |
| 2-Person Household | 145 (82.4%) | 31 (17.6%) |
| 3-Person Household | 48 (80.0%) | 12 (20.0%) |
| 4+ Person Household | 31 (43.1%) | 41 (56.9%) |
| Total Housing Units | 325 (66.6%) | 163 (33.4%) |
Occupancy by Educational Attainment in Frankston
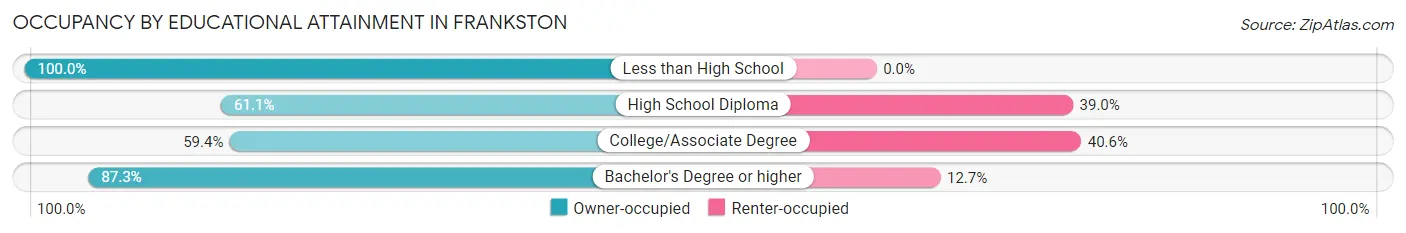
| Household Size | Owner-occupied | Renter-occupied |
| Less than High School | 25 (100.0%) | 0 (0.0%) |
| High School Diploma | 105 (61.1%) | 67 (39.0%) |
| College/Associate Degree | 126 (59.4%) | 86 (40.6%) |
| Bachelor's Degree or higher | 69 (87.3%) | 10 (12.7%) |
Occupancy by Age of Householder in Frankston
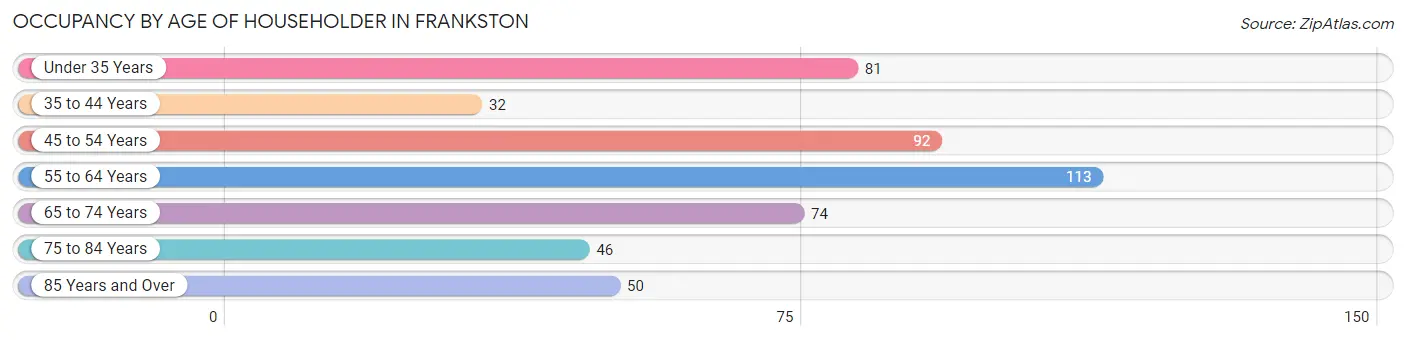
| Age Bracket | # Households | % Households |
| Under 35 Years | 81 | 16.6% |
| 35 to 44 Years | 32 | 6.6% |
| 45 to 54 Years | 92 | 18.9% |
| 55 to 64 Years | 113 | 23.2% |
| 65 to 74 Years | 74 | 15.2% |
| 75 to 84 Years | 46 | 9.4% |
| 85 Years and Over | 50 | 10.2% |
| Total | 488 | 100.0% |
Housing Finances in Frankston
Median Income by Occupancy in Frankston
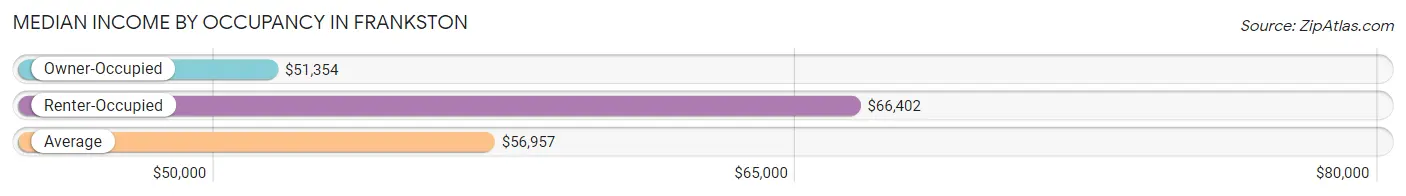
| Occupancy Type | # Households | Median Income |
| Owner-Occupied | 325 (66.6%) | $51,354 |
| Renter-Occupied | 163 (33.4%) | $66,402 |
| Average | 488 (100.0%) | $56,957 |
Occupancy by Householder Income Bracket in Frankston
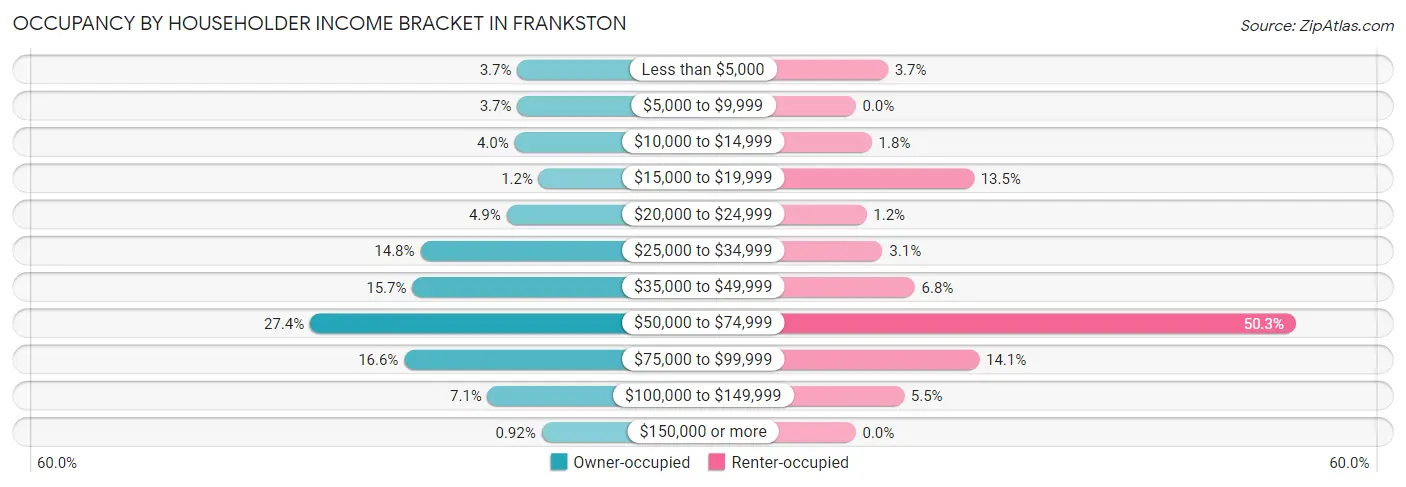
| Income Bracket | Owner-occupied | Renter-occupied |
| Less than $5,000 | 12 (3.7%) | 6 (3.7%) |
| $5,000 to $9,999 | 12 (3.7%) | 0 (0.0%) |
| $10,000 to $14,999 | 13 (4.0%) | 3 (1.8%) |
| $15,000 to $19,999 | 4 (1.2%) | 22 (13.5%) |
| $20,000 to $24,999 | 16 (4.9%) | 2 (1.2%) |
| $25,000 to $34,999 | 48 (14.8%) | 5 (3.1%) |
| $35,000 to $49,999 | 51 (15.7%) | 11 (6.8%) |
| $50,000 to $74,999 | 89 (27.4%) | 82 (50.3%) |
| $75,000 to $99,999 | 54 (16.6%) | 23 (14.1%) |
| $100,000 to $149,999 | 23 (7.1%) | 9 (5.5%) |
| $150,000 or more | 3 (0.9%) | 0 (0.0%) |
| Total | 325 (100.0%) | 163 (100.0%) |
Monthly Housing Cost Tiers in Frankston
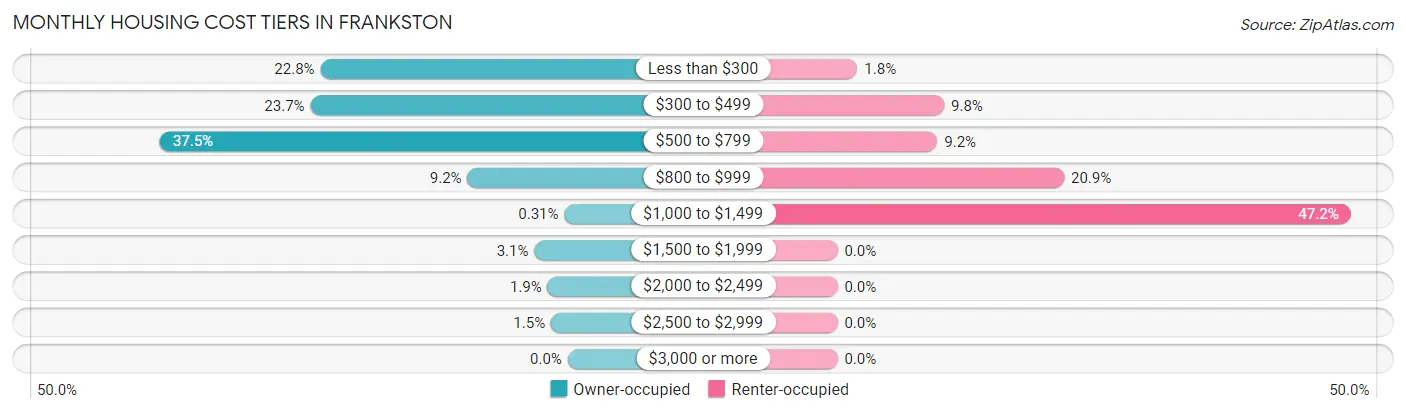
| Monthly Cost | Owner-occupied | Renter-occupied |
| Less than $300 | 74 (22.8%) | 3 (1.8%) |
| $300 to $499 | 77 (23.7%) | 16 (9.8%) |
| $500 to $799 | 122 (37.5%) | 15 (9.2%) |
| $800 to $999 | 30 (9.2%) | 34 (20.9%) |
| $1,000 to $1,499 | 1 (0.3%) | 77 (47.2%) |
| $1,500 to $1,999 | 10 (3.1%) | 0 (0.0%) |
| $2,000 to $2,499 | 6 (1.8%) | 0 (0.0%) |
| $2,500 to $2,999 | 5 (1.5%) | 0 (0.0%) |
| $3,000 or more | 0 (0.0%) | 0 (0.0%) |
| Total | 325 (100.0%) | 163 (100.0%) |
Physical Housing Characteristics in Frankston
Housing Structures in Frankston
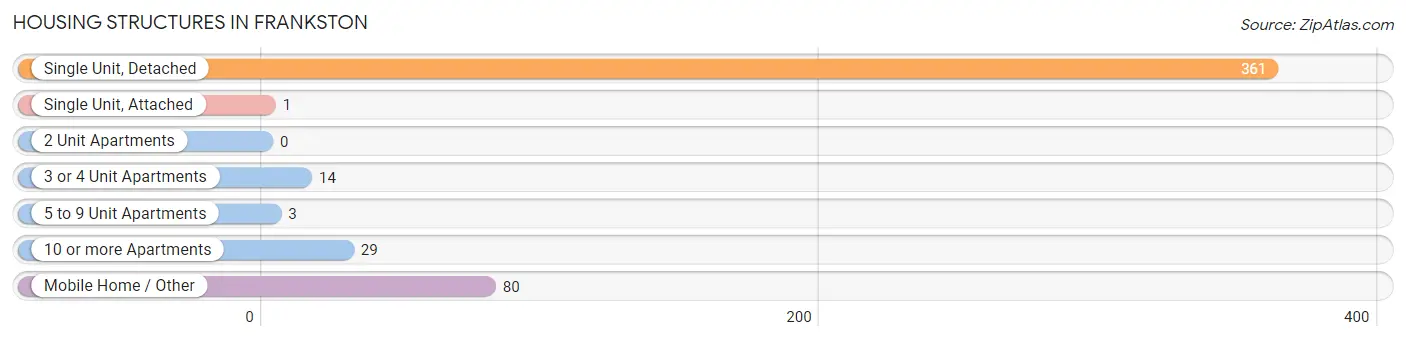
| Structure Type | # Housing Units | % Housing Units |
| Single Unit, Detached | 361 | 74.0% |
| Single Unit, Attached | 1 | 0.2% |
| 2 Unit Apartments | 0 | 0.0% |
| 3 or 4 Unit Apartments | 14 | 2.9% |
| 5 to 9 Unit Apartments | 3 | 0.6% |
| 10 or more Apartments | 29 | 5.9% |
| Mobile Home / Other | 80 | 16.4% |
| Total | 488 | 100.0% |
Housing Structures by Occupancy in Frankston
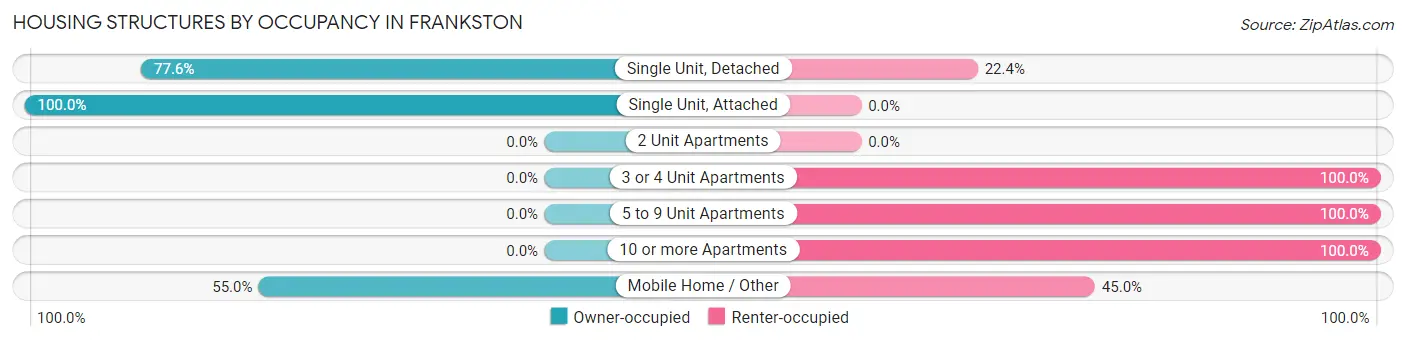
| Structure Type | Owner-occupied | Renter-occupied |
| Single Unit, Detached | 280 (77.6%) | 81 (22.4%) |
| Single Unit, Attached | 1 (100.0%) | 0 (0.0%) |
| 2 Unit Apartments | 0 (0.0%) | 0 (0.0%) |
| 3 or 4 Unit Apartments | 0 (0.0%) | 14 (100.0%) |
| 5 to 9 Unit Apartments | 0 (0.0%) | 3 (100.0%) |
| 10 or more Apartments | 0 (0.0%) | 29 (100.0%) |
| Mobile Home / Other | 44 (55.0%) | 36 (45.0%) |
| Total | 325 (66.6%) | 163 (33.4%) |
Housing Structures by Number of Rooms in Frankston
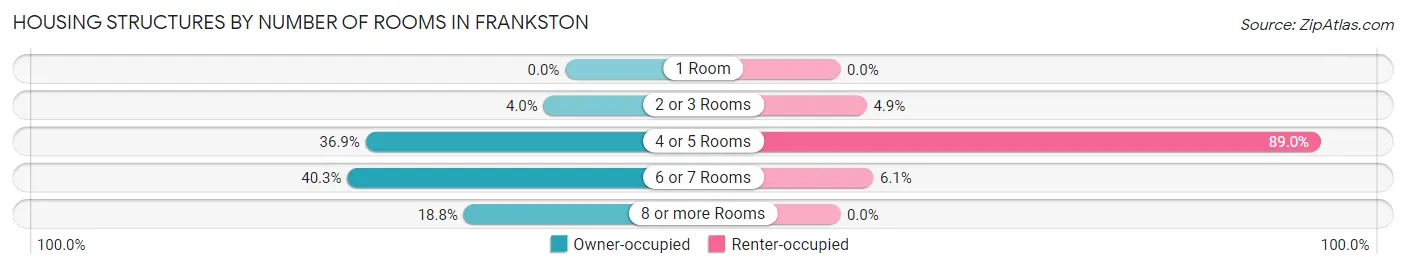
| Number of Rooms | Owner-occupied | Renter-occupied |
| 1 Room | 0 (0.0%) | 0 (0.0%) |
| 2 or 3 Rooms | 13 (4.0%) | 8 (4.9%) |
| 4 or 5 Rooms | 120 (36.9%) | 145 (89.0%) |
| 6 or 7 Rooms | 131 (40.3%) | 10 (6.1%) |
| 8 or more Rooms | 61 (18.8%) | 0 (0.0%) |
| Total | 325 (100.0%) | 163 (100.0%) |
Housing Structure by Heating Type in Frankston
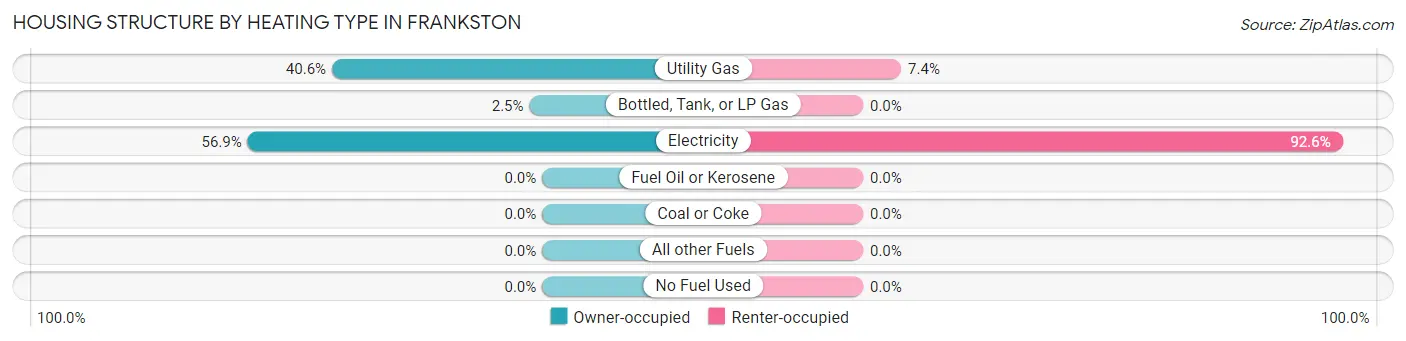
| Heating Type | Owner-occupied | Renter-occupied |
| Utility Gas | 132 (40.6%) | 12 (7.4%) |
| Bottled, Tank, or LP Gas | 8 (2.5%) | 0 (0.0%) |
| Electricity | 185 (56.9%) | 151 (92.6%) |
| Fuel Oil or Kerosene | 0 (0.0%) | 0 (0.0%) |
| Coal or Coke | 0 (0.0%) | 0 (0.0%) |
| All other Fuels | 0 (0.0%) | 0 (0.0%) |
| No Fuel Used | 0 (0.0%) | 0 (0.0%) |
| Total | 325 (100.0%) | 163 (100.0%) |
Household Vehicle Usage in Frankston
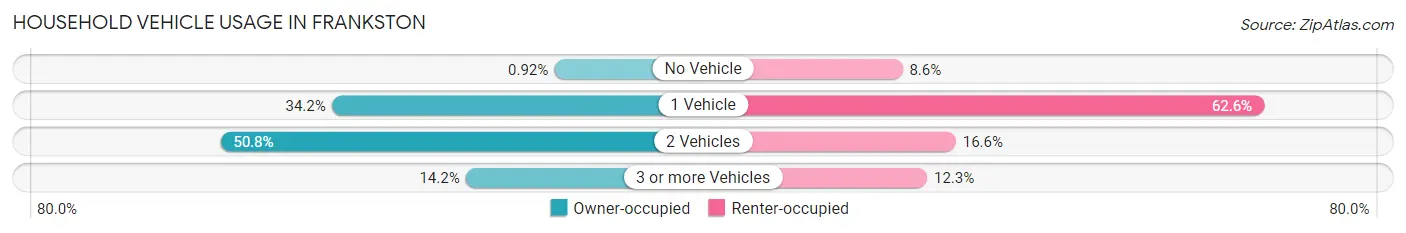
| Vehicles per Household | Owner-occupied | Renter-occupied |
| No Vehicle | 3 (0.9%) | 14 (8.6%) |
| 1 Vehicle | 111 (34.2%) | 102 (62.6%) |
| 2 Vehicles | 165 (50.8%) | 27 (16.6%) |
| 3 or more Vehicles | 46 (14.1%) | 20 (12.3%) |
| Total | 325 (100.0%) | 163 (100.0%) |
Real Estate & Mortgages in Frankston
Real Estate and Mortgage Overview in Frankston
| Characteristic | Without Mortgage | With Mortgage |
| Housing Units | 279 | 46 |
| Median Property Value | $88,500 | $154,200 |
| Median Household Income | $50,729 | $3 |
| Monthly Housing Costs | $475 | $0 |
| Real Estate Taxes | $905 | $4 |
Property Value by Mortgage Status in Frankston
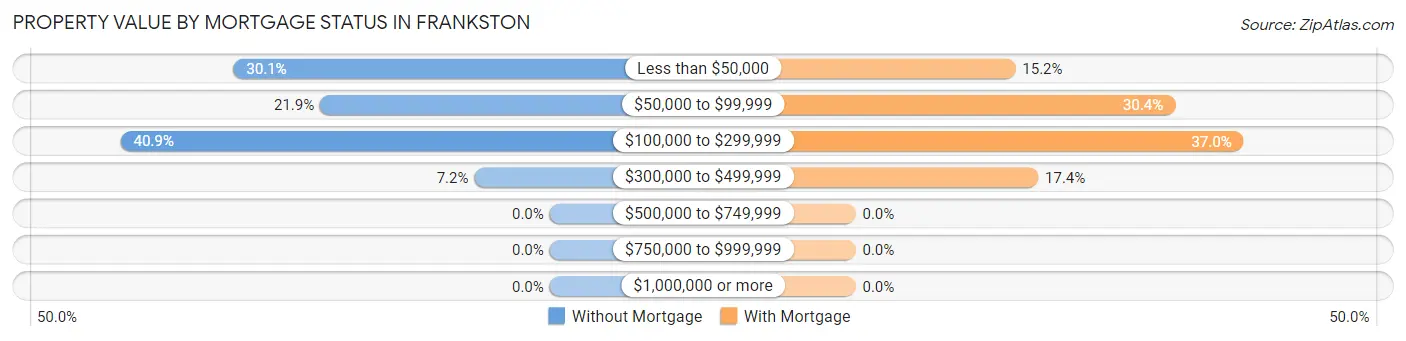
| Property Value | Without Mortgage | With Mortgage |
| Less than $50,000 | 84 (30.1%) | 7 (15.2%) |
| $50,000 to $99,999 | 61 (21.9%) | 14 (30.4%) |
| $100,000 to $299,999 | 114 (40.9%) | 17 (37.0%) |
| $300,000 to $499,999 | 20 (7.2%) | 8 (17.4%) |
| $500,000 to $749,999 | 0 (0.0%) | 0 (0.0%) |
| $750,000 to $999,999 | 0 (0.0%) | 0 (0.0%) |
| $1,000,000 or more | 0 (0.0%) | 0 (0.0%) |
| Total | 279 (100.0%) | 46 (100.0%) |
Household Income by Mortgage Status in Frankston
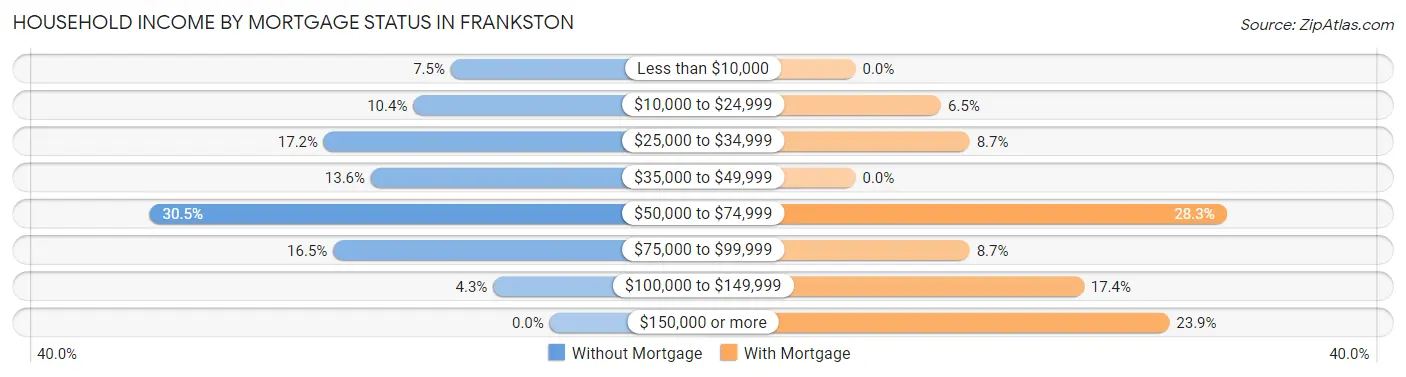
| Household Income | Without Mortgage | With Mortgage |
| Less than $10,000 | 21 (7.5%) | 0 (0.0%) |
| $10,000 to $24,999 | 29 (10.4%) | 3 (6.5%) |
| $25,000 to $34,999 | 48 (17.2%) | 4 (8.7%) |
| $35,000 to $49,999 | 38 (13.6%) | 0 (0.0%) |
| $50,000 to $74,999 | 85 (30.5%) | 13 (28.3%) |
| $75,000 to $99,999 | 46 (16.5%) | 4 (8.7%) |
| $100,000 to $149,999 | 12 (4.3%) | 8 (17.4%) |
| $150,000 or more | 0 (0.0%) | 11 (23.9%) |
| Total | 279 (100.0%) | 46 (100.0%) |
Property Value to Household Income Ratio in Frankston
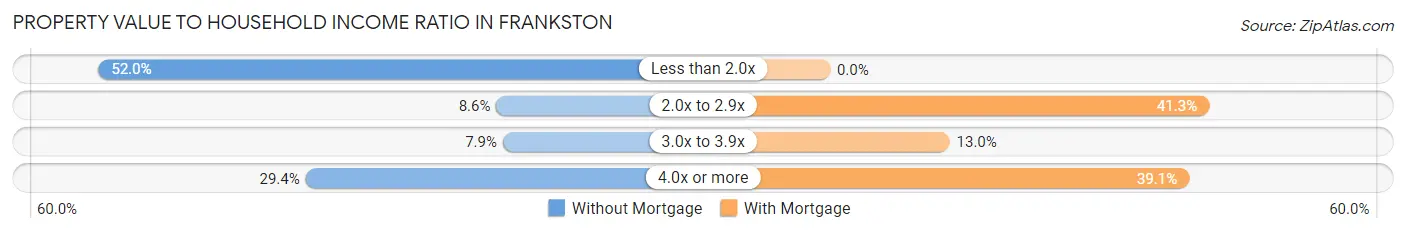
| Value-to-Income Ratio | Without Mortgage | With Mortgage |
| Less than 2.0x | 145 (52.0%) | 0 (0.0%) |
| 2.0x to 2.9x | 24 (8.6%) | 19 (41.3%) |
| 3.0x to 3.9x | 22 (7.9%) | 6 (13.0%) |
| 4.0x or more | 82 (29.4%) | 18 (39.1%) |
| Total | 279 (100.0%) | 46 (100.0%) |
Real Estate Taxes by Mortgage Status in Frankston
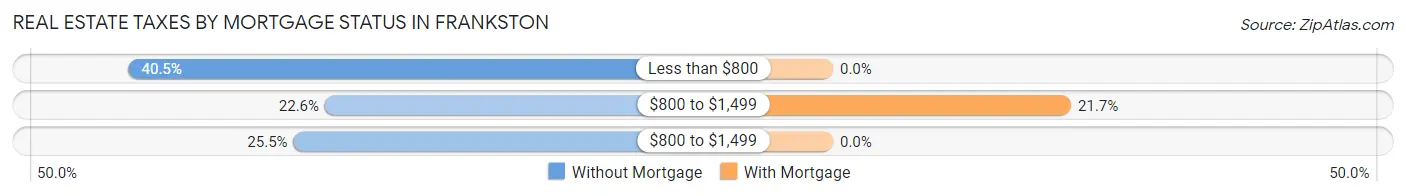
| Property Taxes | Without Mortgage | With Mortgage |
| Less than $800 | 113 (40.5%) | 0 (0.0%) |
| $800 to $1,499 | 63 (22.6%) | 10 (21.7%) |
| $800 to $1,499 | 71 (25.5%) | 0 (0.0%) |
| Total | 279 (100.0%) | 46 (100.0%) |
Health & Disability in Frankston
Health Insurance Coverage by Age in Frankston
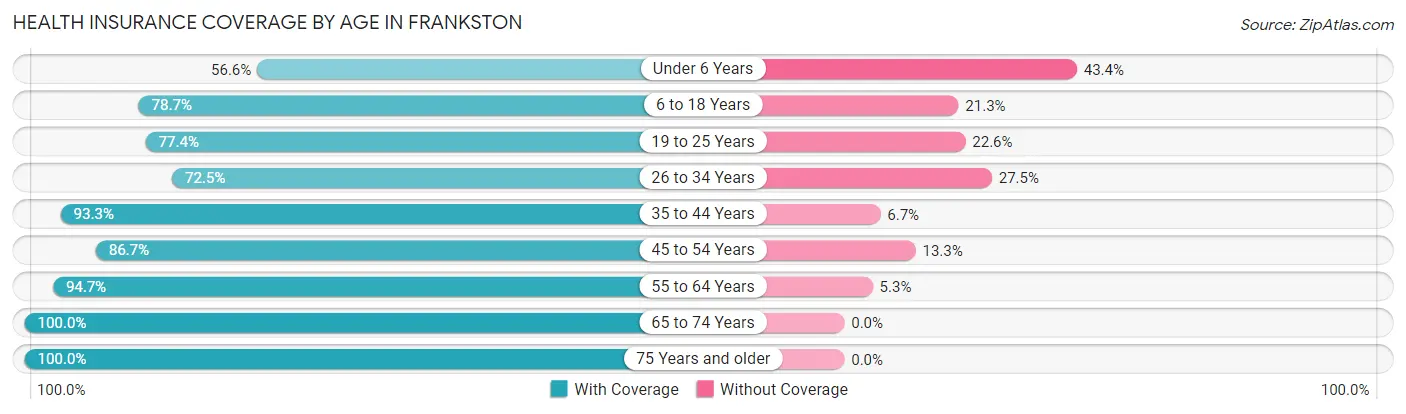
| Age Bracket | With Coverage | Without Coverage |
| Under 6 Years | 81 (56.6%) | 62 (43.4%) |
| 6 to 18 Years | 148 (78.7%) | 40 (21.3%) |
| 19 to 25 Years | 72 (77.4%) | 21 (22.6%) |
| 26 to 34 Years | 58 (72.5%) | 22 (27.5%) |
| 35 to 44 Years | 111 (93.3%) | 8 (6.7%) |
| 45 to 54 Years | 137 (86.7%) | 21 (13.3%) |
| 55 to 64 Years | 215 (94.7%) | 12 (5.3%) |
| 65 to 74 Years | 96 (100.0%) | 0 (0.0%) |
| 75 Years and older | 141 (100.0%) | 0 (0.0%) |
| Total | 1,059 (85.1%) | 186 (14.9%) |
Health Insurance Coverage by Citizenship Status in Frankston
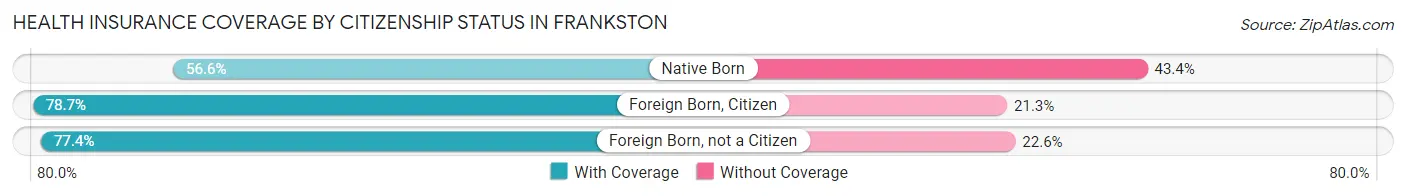
| Citizenship Status | With Coverage | Without Coverage |
| Native Born | 81 (56.6%) | 62 (43.4%) |
| Foreign Born, Citizen | 148 (78.7%) | 40 (21.3%) |
| Foreign Born, not a Citizen | 72 (77.4%) | 21 (22.6%) |
Health Insurance Coverage by Household Income in Frankston
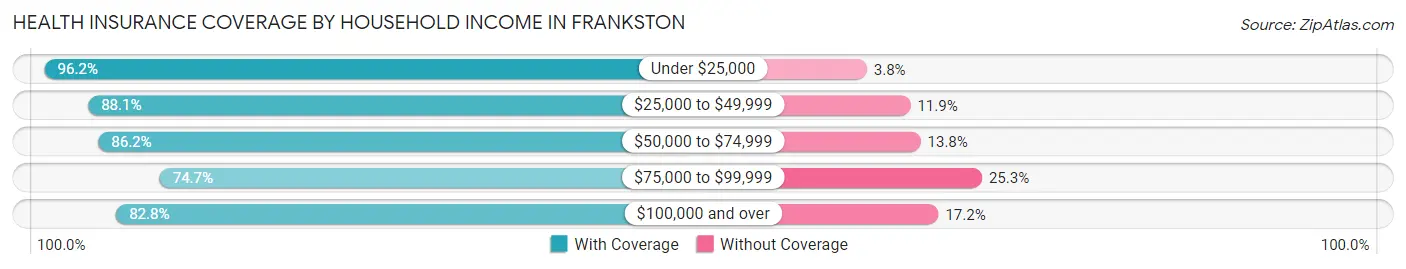
| Household Income | With Coverage | Without Coverage |
| Under $25,000 | 128 (96.2%) | 5 (3.8%) |
| $25,000 to $49,999 | 192 (88.1%) | 26 (11.9%) |
| $50,000 to $74,999 | 436 (86.2%) | 70 (13.8%) |
| $75,000 to $99,999 | 168 (74.7%) | 57 (25.3%) |
| $100,000 and over | 135 (82.8%) | 28 (17.2%) |
Public vs Private Health Insurance Coverage by Age in Frankston
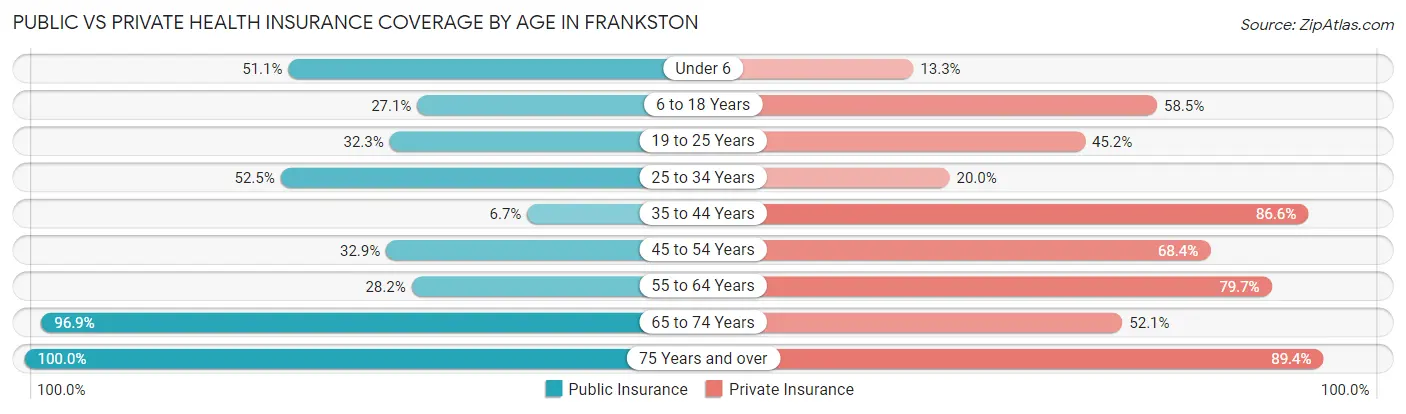
| Age Bracket | Public Insurance | Private Insurance |
| Under 6 | 73 (51.0%) | 19 (13.3%) |
| 6 to 18 Years | 51 (27.1%) | 110 (58.5%) |
| 19 to 25 Years | 30 (32.3%) | 42 (45.2%) |
| 25 to 34 Years | 42 (52.5%) | 16 (20.0%) |
| 35 to 44 Years | 8 (6.7%) | 103 (86.6%) |
| 45 to 54 Years | 52 (32.9%) | 108 (68.3%) |
| 55 to 64 Years | 64 (28.2%) | 181 (79.7%) |
| 65 to 74 Years | 93 (96.9%) | 50 (52.1%) |
| 75 Years and over | 141 (100.0%) | 126 (89.4%) |
| Total | 554 (44.5%) | 755 (60.6%) |
Disability Status by Sex by Age in Frankston
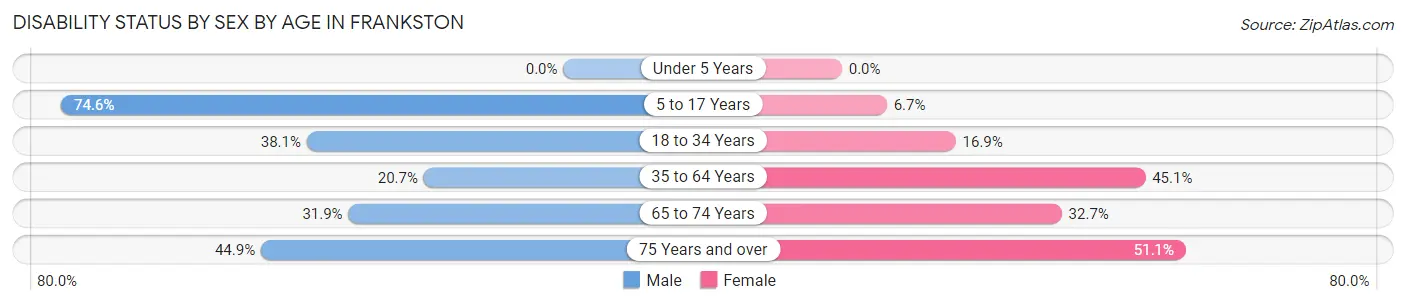
| Age Bracket | Male | Female |
| Under 5 Years | 0 (0.0%) | 0 (0.0%) |
| 5 to 17 Years | 44 (74.6%) | 7 (6.7%) |
| 18 to 34 Years | 48 (38.1%) | 12 (16.9%) |
| 35 to 64 Years | 52 (20.7%) | 114 (45.1%) |
| 65 to 74 Years | 15 (31.9%) | 16 (32.7%) |
| 75 Years and over | 22 (44.9%) | 47 (51.1%) |
Disability Class by Sex by Age in Frankston
Disability Class: Hearing Difficulty
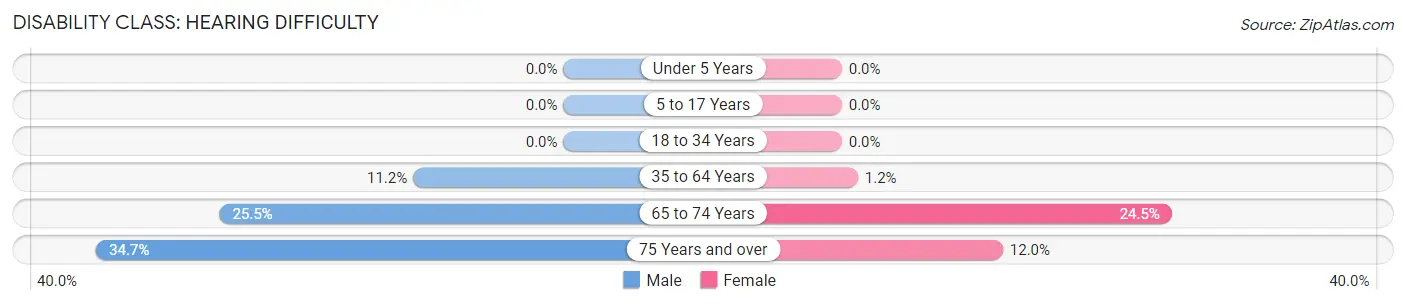
| Age Bracket | Male | Female |
| Under 5 Years | 0 (0.0%) | 0 (0.0%) |
| 5 to 17 Years | 0 (0.0%) | 0 (0.0%) |
| 18 to 34 Years | 0 (0.0%) | 0 (0.0%) |
| 35 to 64 Years | 28 (11.2%) | 3 (1.2%) |
| 65 to 74 Years | 12 (25.5%) | 12 (24.5%) |
| 75 Years and over | 17 (34.7%) | 11 (12.0%) |
Disability Class: Vision Difficulty
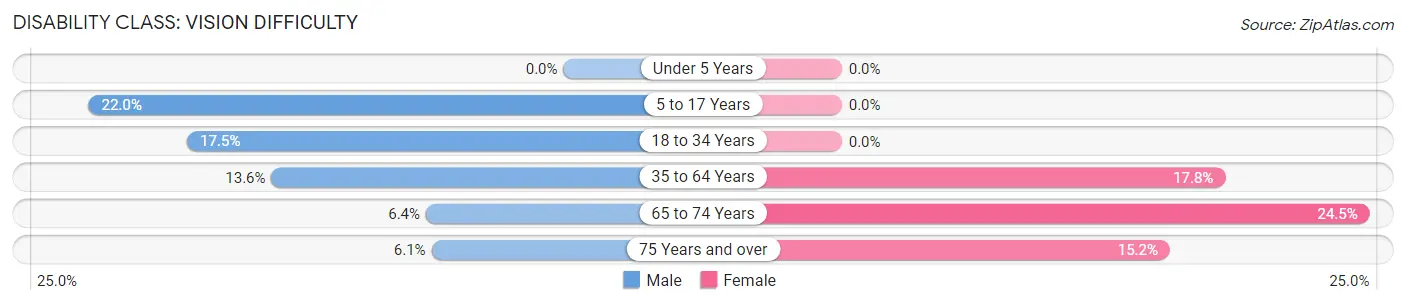
| Age Bracket | Male | Female |
| Under 5 Years | 0 (0.0%) | 0 (0.0%) |
| 5 to 17 Years | 13 (22.0%) | 0 (0.0%) |
| 18 to 34 Years | 22 (17.5%) | 0 (0.0%) |
| 35 to 64 Years | 34 (13.6%) | 45 (17.8%) |
| 65 to 74 Years | 3 (6.4%) | 12 (24.5%) |
| 75 Years and over | 3 (6.1%) | 14 (15.2%) |
Disability Class: Cognitive Difficulty
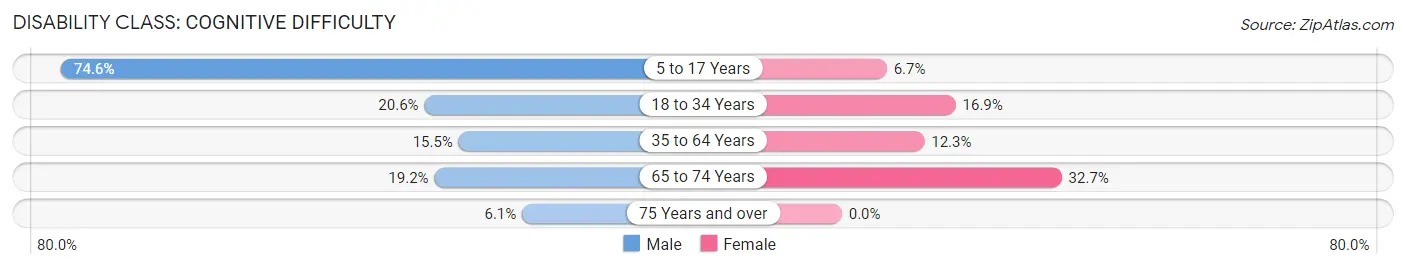
| Age Bracket | Male | Female |
| 5 to 17 Years | 44 (74.6%) | 7 (6.7%) |
| 18 to 34 Years | 26 (20.6%) | 12 (16.9%) |
| 35 to 64 Years | 39 (15.5%) | 31 (12.2%) |
| 65 to 74 Years | 9 (19.2%) | 16 (32.7%) |
| 75 Years and over | 3 (6.1%) | 0 (0.0%) |
Disability Class: Ambulatory Difficulty
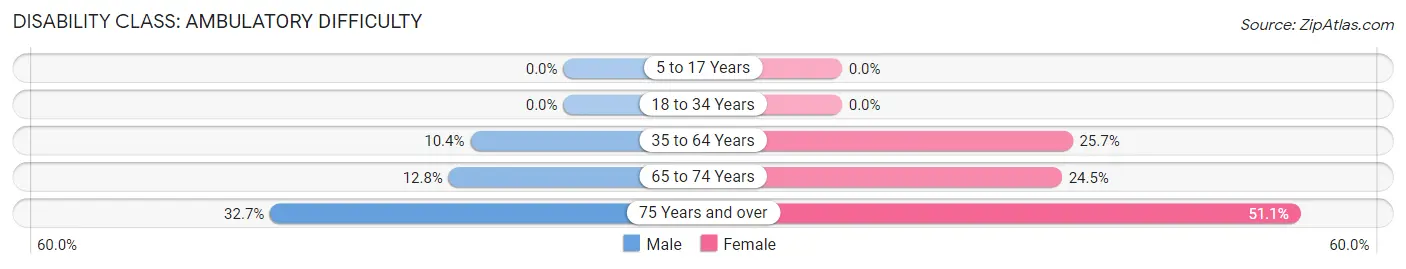
| Age Bracket | Male | Female |
| 5 to 17 Years | 0 (0.0%) | 0 (0.0%) |
| 18 to 34 Years | 0 (0.0%) | 0 (0.0%) |
| 35 to 64 Years | 26 (10.4%) | 65 (25.7%) |
| 65 to 74 Years | 6 (12.8%) | 12 (24.5%) |
| 75 Years and over | 16 (32.7%) | 47 (51.1%) |
Disability Class: Self-Care Difficulty
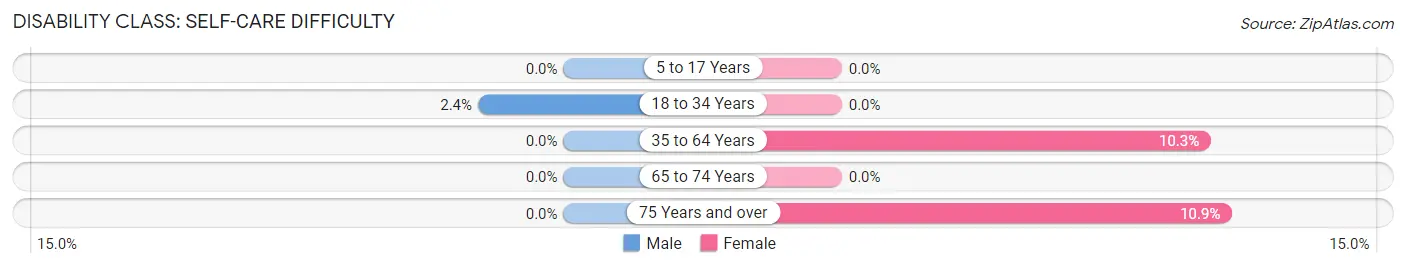
| Age Bracket | Male | Female |
| 5 to 17 Years | 0 (0.0%) | 0 (0.0%) |
| 18 to 34 Years | 3 (2.4%) | 0 (0.0%) |
| 35 to 64 Years | 0 (0.0%) | 26 (10.3%) |
| 65 to 74 Years | 0 (0.0%) | 0 (0.0%) |
| 75 Years and over | 0 (0.0%) | 10 (10.9%) |
Technology Access in Frankston
Computing Device Access in Frankston
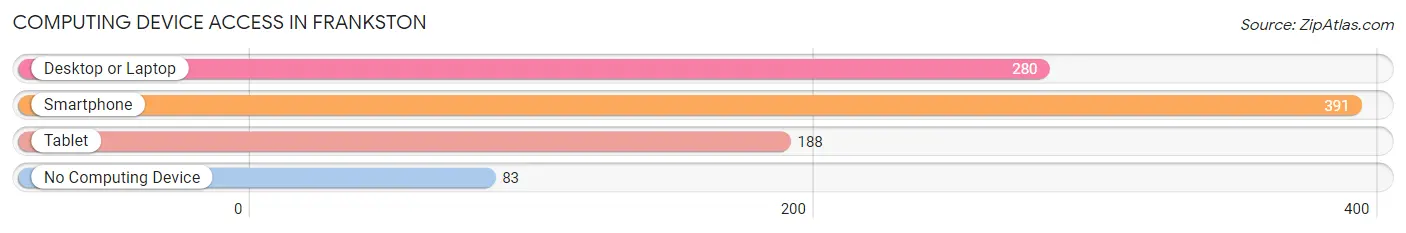
| Device Type | # Households | % Households |
| Desktop or Laptop | 280 | 57.4% |
| Smartphone | 391 | 80.1% |
| Tablet | 188 | 38.5% |
| No Computing Device | 83 | 17.0% |
| Total | 488 | 100.0% |
Internet Access in Frankston
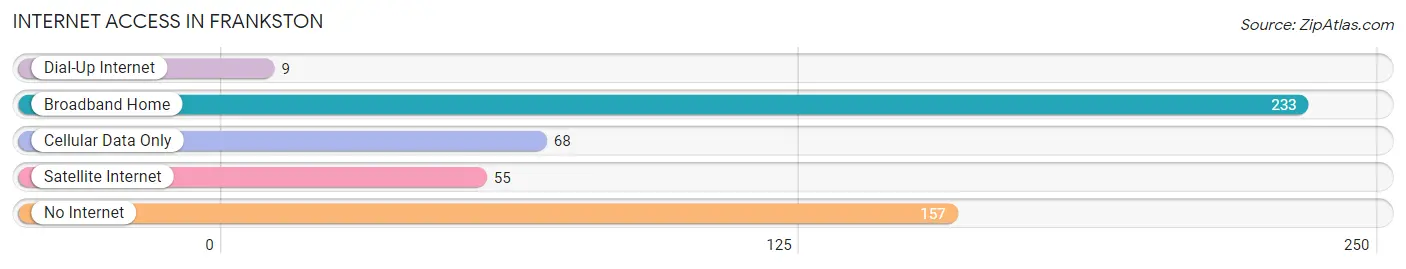
| Internet Type | # Households | % Households |
| Dial-Up Internet | 9 | 1.8% |
| Broadband Home | 233 | 47.7% |
| Cellular Data Only | 68 | 13.9% |
| Satellite Internet | 55 | 11.3% |
| No Internet | 157 | 32.2% |
| Total | 488 | 100.0% |
Frankston Summary
Frankston, Texas is a small town located in Anderson County, Texas, United States. It is situated about 75 miles southeast of Dallas and about 25 miles north of Tyler. The population of Frankston was 1,125 at the 2010 census.
History
Frankston was founded in 1873 by a group of settlers from Tennessee. The town was named after Frank Stone, one of the original settlers. The town was incorporated in 1876 and the first post office was established in 1877.
The town grew slowly but steadily over the years, and by the early 1900s, it had become a thriving community. The town was home to several businesses, including a cotton gin, a sawmill, a gristmill, and a blacksmith shop.
In the 1920s, the town began to experience a period of growth and prosperity. The population increased from 500 in 1920 to 1,000 in 1930. During this time, the town was home to several businesses, including a bank, a hotel, a movie theater, and a variety of stores.
In the 1940s, the town experienced a period of decline. The population decreased from 1,000 in 1940 to 800 in 1950. The decline was due to the closure of several businesses and the lack of new businesses.
In the 1950s, the town began to experience a period of growth and prosperity once again. The population increased from 800 in 1950 to 1,000 in 1960. During this time, the town was home to several businesses, including a bank, a hotel, a movie theater, and a variety of stores.
Geography
Frankston is located at 31°45'25" North, 95°37'45" West (31.756944, -95.629167). The town is situated in the Piney Woods region of East Texas. The terrain is mostly flat with some rolling hills. The town is located near the Neches River and Lake Palestine.
Economy
The economy of Frankston is largely based on agriculture and timber. The town is home to several farms and ranches, as well as a sawmill and a cotton gin. The town is also home to several small businesses, including a bank, a hotel, a movie theater, and a variety of stores.
Demographics
As of the 2010 census, the population of Frankston was 1,125. The racial makeup of the town was 95.2% White, 0.7% African American, 0.2% Native American, 0.2% Asian, 0.1% Pacific Islander, 2.3% from other races, and 1.4% from two or more races. Hispanic or Latino of any race were 4.2% of the population.
The median income for a household in the town was $31,250, and the median income for a family was $37,500. The per capita income for the town was $17,845. About 16.2% of families and 19.2% of the population were below the poverty line, including 25.2% of those under age 18 and 10.2% of those age 65 or over.
Common Questions
What is Per Capita Income in Frankston?
Per Capita income in Frankston is $24,573.
What is the Median Family Income in Frankston?
Median Family Income in Frankston is $61,719.
What is the Median Household income in Frankston?
Median Household Income in Frankston is $56,957.
What is Income or Wage Gap in Frankston?
Income or Wage Gap in Frankston is 1.4%.
Women in Frankston earn 98.6 cents for every dollar earned by a man.
What is Inequality or Gini Index in Frankston?
Inequality or Gini Index in Frankston is 0.32.
What is the Total Population of Frankston?
Total Population of Frankston is 1,282.
What is the Total Male Population of Frankston?
Total Male Population of Frankston is 644.
What is the Total Female Population of Frankston?
Total Female Population of Frankston is 638.
What is the Ratio of Males per 100 Females in Frankston?
There are 100.94 Males per 100 Females in Frankston.
What is the Ratio of Females per 100 Males in Frankston?
There are 99.07 Females per 100 Males in Frankston.
What is the Median Population Age in Frankston?
Median Population Age in Frankston is 48.4 Years.
What is the Average Family Size in Frankston
Average Family Size in Frankston is 3.3 People.
What is the Average Household Size in Frankston
Average Household Size in Frankston is 2.5 People.
How Large is the Labor Force in Frankston?
There are 497 People in the Labor Forcein in Frankston.
What is the Percentage of People in the Labor Force in Frankston?
48.5% of People are in the Labor Force in Frankston.
What is the Unemployment Rate in Frankston?
Unemployment Rate in Frankston is 10.3%.