La Grange, TX Map & Demographics
La Grange Map
La Grange Overview
$27,687
PER CAPITA INCOME
$81,220
AVG FAMILY INCOME
$53,191
AVG HOUSEHOLD INCOME
27.7%
WAGE / INCOME GAP [ % ]
72.3¢/ $1
WAGE / INCOME GAP [ $ ]
0.46
INEQUALITY / GINI INDEX
4,416
TOTAL POPULATION
1,893
MALE POPULATION
2,523
FEMALE POPULATION
75.03
MALES / 100 FEMALES
133.28
FEMALES / 100 MALES
45.1
MEDIAN AGE
3.6
AVG FAMILY SIZE
2.5
AVG HOUSEHOLD SIZE
2,132
LABOR FORCE [ PEOPLE ]
60.2%
PERCENT IN LABOR FORCE
6.8%
UNEMPLOYMENT RATE
La Grange Zip Codes
La Grange Area Codes
Income in La Grange
Income Overview in La Grange
Per Capita Income in La Grange is $27,687, while median incomes of families and households are $81,220 and $53,191 respectively.
| Characteristic | Number | Measure |
| Per Capita Income | 4,416 | $27,687 |
| Median Family Income | 942 | $81,220 |
| Mean Family Income | 942 | $85,804 |
| Median Household Income | 1,740 | $53,191 |
| Mean Household Income | 1,740 | $66,347 |
| Income Deficit | 942 | $0 |
| Wage / Income Gap (%) | 4,416 | 27.69% |
| Wage / Income Gap ($) | 4,416 | 72.31¢ per $1 |
| Gini / Inequality Index | 4,416 | 0.46 |
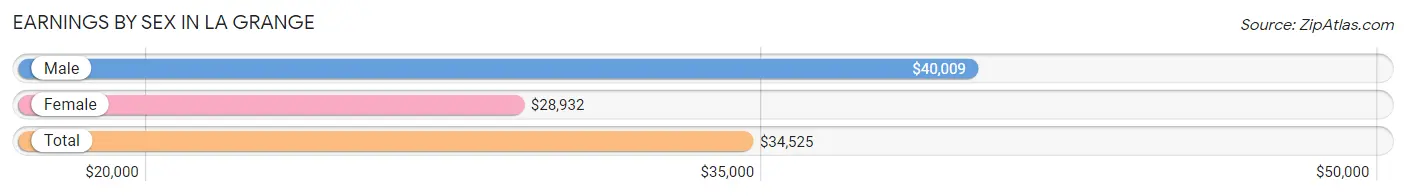
Earnings by Sex in La Grange
Average Earnings in La Grange are $34,525, $40,009 for men and $28,932 for women, a difference of 27.7%.
| Sex | Number | Average Earnings |
| Male | 945 (42.7%) | $40,009 |
| Female | 1,270 (57.3%) | $28,932 |
| Total | 2,215 (100.0%) | $34,525 |
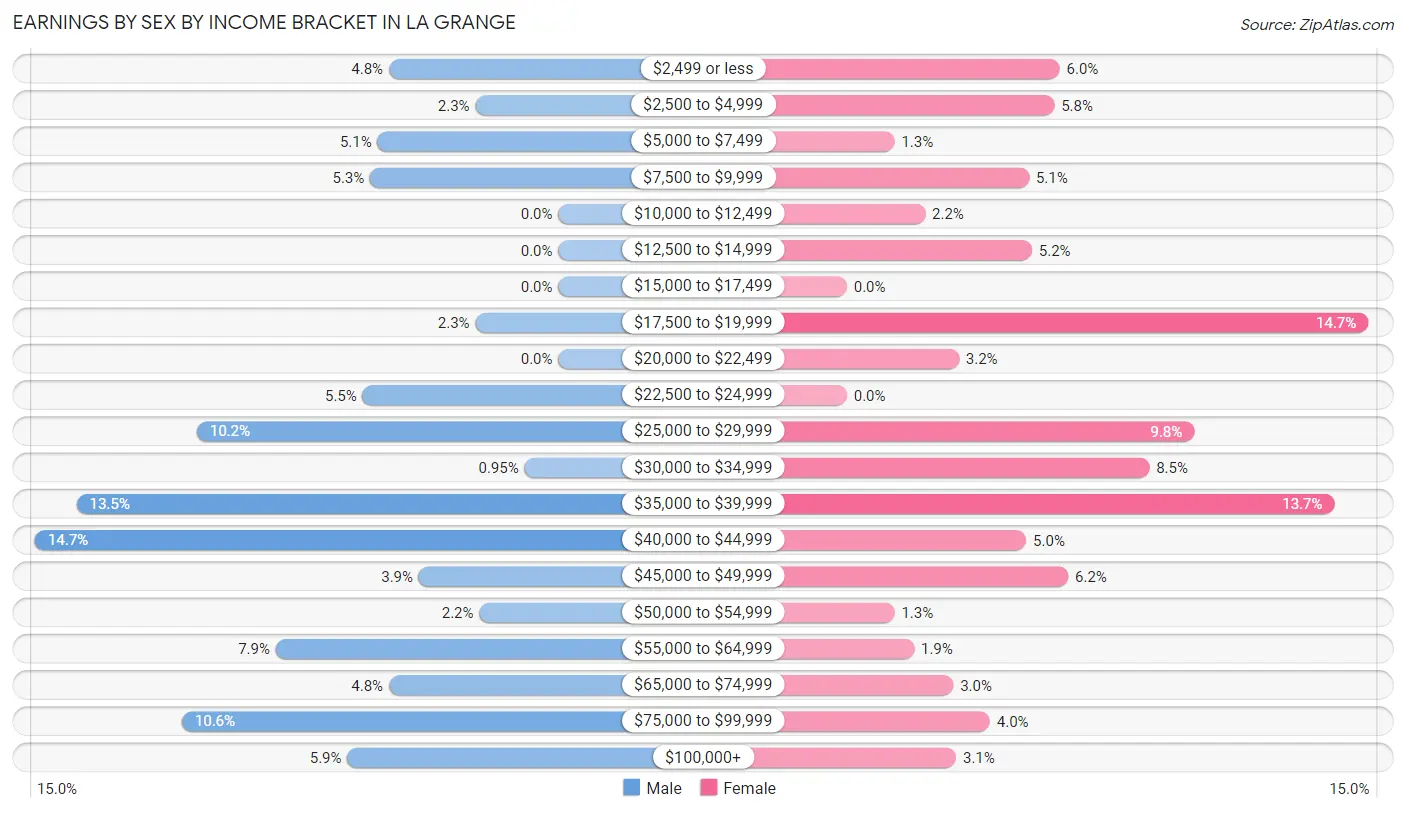
Earnings by Sex by Income Bracket in La Grange
The most common earnings brackets in La Grange are $40,000 to $44,999 for men (139 | 14.7%) and $17,500 to $19,999 for women (186 | 14.6%).
| Income | Male | Female |
| $2,499 or less | 45 (4.8%) | 76 (6.0%) |
| $2,500 to $4,999 | 22 (2.3%) | 74 (5.8%) |
| $5,000 to $7,499 | 48 (5.1%) | 17 (1.3%) |
| $7,500 to $9,999 | 50 (5.3%) | 65 (5.1%) |
| $10,000 to $12,499 | 0 (0.0%) | 28 (2.2%) |
| $12,500 to $14,999 | 0 (0.0%) | 66 (5.2%) |
| $15,000 to $17,499 | 0 (0.0%) | 0 (0.0%) |
| $17,500 to $19,999 | 22 (2.3%) | 186 (14.6%) |
| $20,000 to $22,499 | 0 (0.0%) | 40 (3.2%) |
| $22,500 to $24,999 | 52 (5.5%) | 0 (0.0%) |
| $25,000 to $29,999 | 96 (10.2%) | 124 (9.8%) |
| $30,000 to $34,999 | 9 (0.9%) | 108 (8.5%) |
| $35,000 to $39,999 | 128 (13.5%) | 174 (13.7%) |
| $40,000 to $44,999 | 139 (14.7%) | 64 (5.0%) |
| $45,000 to $49,999 | 37 (3.9%) | 79 (6.2%) |
| $50,000 to $54,999 | 21 (2.2%) | 17 (1.3%) |
| $55,000 to $64,999 | 75 (7.9%) | 24 (1.9%) |
| $65,000 to $74,999 | 45 (4.8%) | 38 (3.0%) |
| $75,000 to $99,999 | 100 (10.6%) | 51 (4.0%) |
| $100,000+ | 56 (5.9%) | 39 (3.1%) |
| Total | 945 (100.0%) | 1,270 (100.0%) |
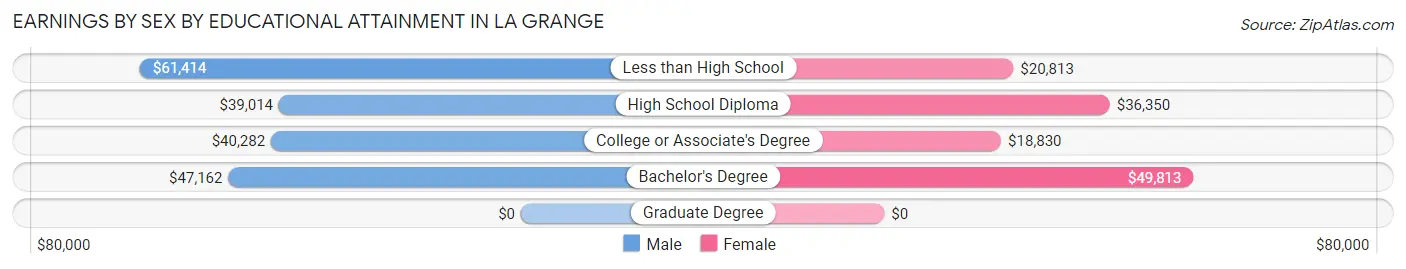
Earnings by Sex by Educational Attainment in La Grange
Average earnings in La Grange are $40,486 for men and $33,900 for women, a difference of 16.3%. Men with an educational attainment of less than high school enjoy the highest average annual earnings of $61,414, while those with high school diploma education earn the least with $39,014. Women with an educational attainment of bachelor's degree earn the most with the average annual earnings of $49,813, while those with college or associate's degree education have the smallest earnings of $18,830.
| Educational Attainment | Male Income | Female Income |
| Less than High School | $61,414 | $20,813 |
| High School Diploma | $39,014 | $36,350 |
| College or Associate's Degree | $40,282 | $18,830 |
| Bachelor's Degree | $47,162 | $49,813 |
| Graduate Degree | - | - |
| Total | $40,486 | $33,900 |
Family Income in La Grange
Family Income Brackets in La Grange
According to the La Grange family income data, there are 287 families falling into the $100,000 to $149,999 income range, which is the most common income bracket and makes up 30.5% of all families. Conversely, the $10,000 to $14,999 income bracket is the least frequent group with only 17 families (1.8%) belonging to this category.
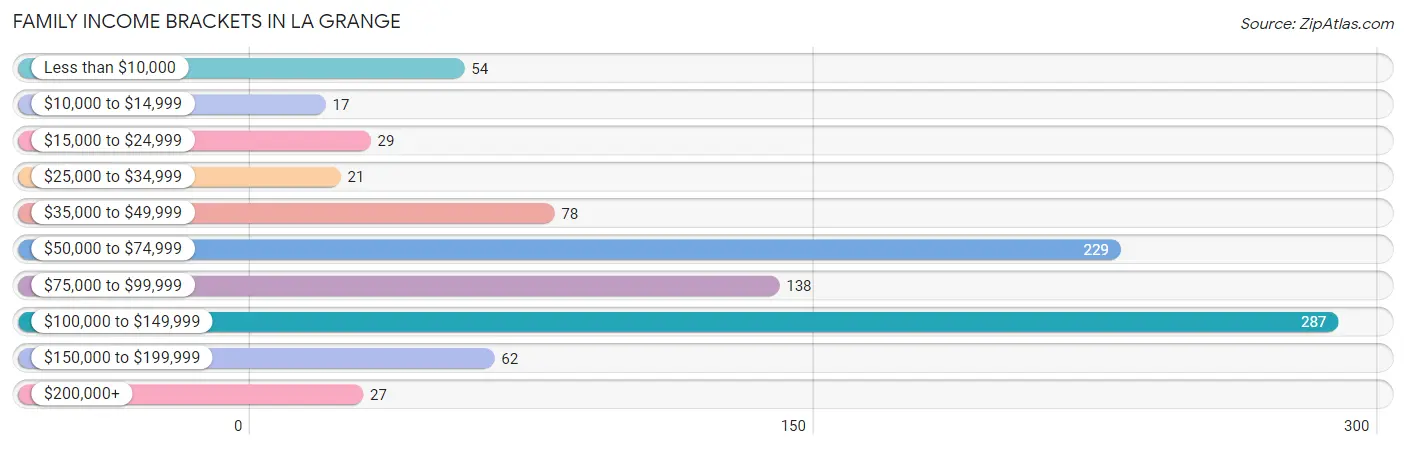
| Income Bracket | # Families | % Families |
| Less than $10,000 | 54 | 5.7% |
| $10,000 to $14,999 | 17 | 1.8% |
| $15,000 to $24,999 | 29 | 3.1% |
| $25,000 to $34,999 | 21 | 2.2% |
| $35,000 to $49,999 | 78 | 8.3% |
| $50,000 to $74,999 | 229 | 24.3% |
| $75,000 to $99,999 | 138 | 14.6% |
| $100,000 to $149,999 | 287 | 30.5% |
| $150,000 to $199,999 | 62 | 6.6% |
| $200,000+ | 27 | 2.9% |
Family Income by Famaliy Size in La Grange
3-person families (103 | 10.9%) account for the highest median family income in La Grange with $106,449 per family, while 3-person families (103 | 10.9%) have the highest median income of $35,483 per family member.
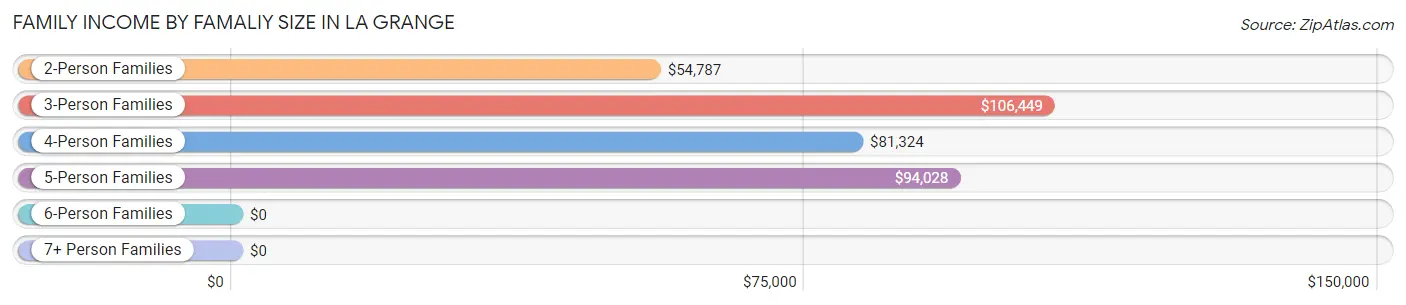
| Income Bracket | # Families | Median Income |
| 2-Person Families | 516 (54.8%) | $54,787 |
| 3-Person Families | 103 (10.9%) | $106,449 |
| 4-Person Families | 156 (16.6%) | $81,324 |
| 5-Person Families | 70 (7.4%) | $94,028 |
| 6-Person Families | 48 (5.1%) | $0 |
| 7+ Person Families | 49 (5.2%) | $0 |
| Total | 942 (100.0%) | $81,220 |
Family Income by Number of Earners in La Grange
The median family income in La Grange is $81,220, with families comprising 3+ earners (222) having the highest median family income of $102,656, while families with no earners (250) have the lowest median family income of $54,388, accounting for 23.6% and 26.5% of families, respectively.
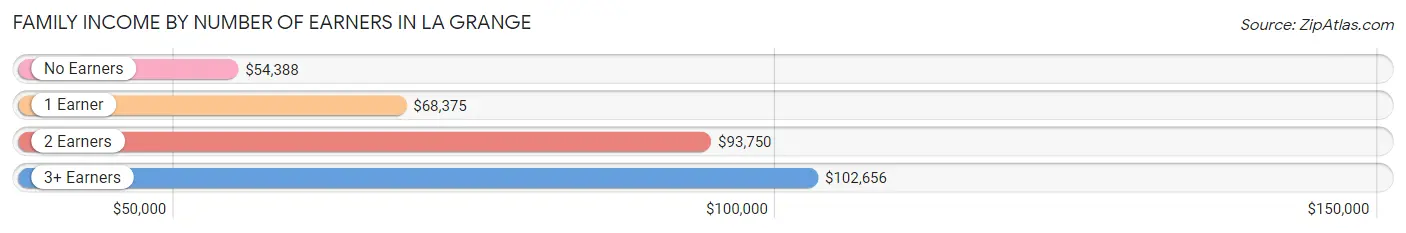
| Number of Earners | # Families | Median Income |
| No Earners | 250 (26.5%) | $54,388 |
| 1 Earner | 204 (21.7%) | $68,375 |
| 2 Earners | 266 (28.2%) | $93,750 |
| 3+ Earners | 222 (23.6%) | $102,656 |
| Total | 942 (100.0%) | $81,220 |
Household Income in La Grange
Household Income Brackets in La Grange
With 364 households falling in the category, the $100,000 to $149,999 income range is the most frequent in La Grange, accounting for 20.9% of all households. In contrast, only 50 households (2.9%) fall into the $200,000+ income bracket, making it the least populous group.
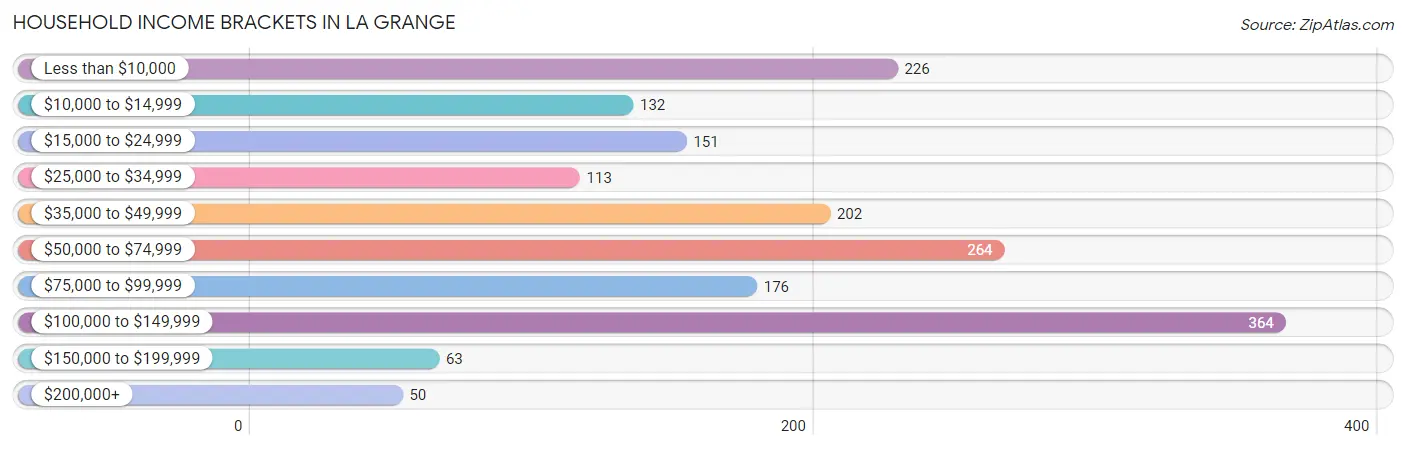
| Income Bracket | # Households | % Households |
| Less than $10,000 | 226 | 13.0% |
| $10,000 to $14,999 | 132 | 7.6% |
| $15,000 to $24,999 | 151 | 8.7% |
| $25,000 to $34,999 | 113 | 6.5% |
| $35,000 to $49,999 | 202 | 11.6% |
| $50,000 to $74,999 | 264 | 15.2% |
| $75,000 to $99,999 | 176 | 10.1% |
| $100,000 to $149,999 | 364 | 20.9% |
| $150,000 to $199,999 | 63 | 3.6% |
| $200,000+ | 50 | 2.9% |
Household Income by Householder Age in La Grange
The median household income in La Grange is $53,191, with the highest median household income of $52,686 found in the 65+ years age bracket for the primary householder. A total of 690 households (39.7%) fall into this category. Meanwhile, the 15 to 24 years age bracket for the primary householder has the lowest median household income of $0, with 48 households (2.8%) in this group.
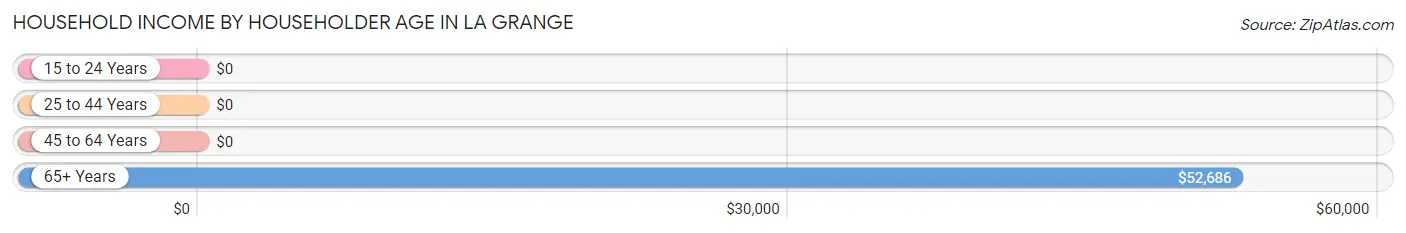
| Income Bracket | # Households | Median Income |
| 15 to 24 Years | 48 (2.8%) | $0 |
| 25 to 44 Years | 349 (20.1%) | $0 |
| 45 to 64 Years | 653 (37.5%) | $0 |
| 65+ Years | 690 (39.7%) | $52,686 |
| Total | 1,740 (100.0%) | $53,191 |
Poverty in La Grange
Income Below Poverty by Sex and Age in La Grange
With 14.1% poverty level for males and 16.7% for females among the residents of La Grange, 6 to 11 year old males and 16 and 17 year old females are the most vulnerable to poverty, with 62 males (41.9%) and 26 females (47.3%) in their respective age groups living below the poverty level.
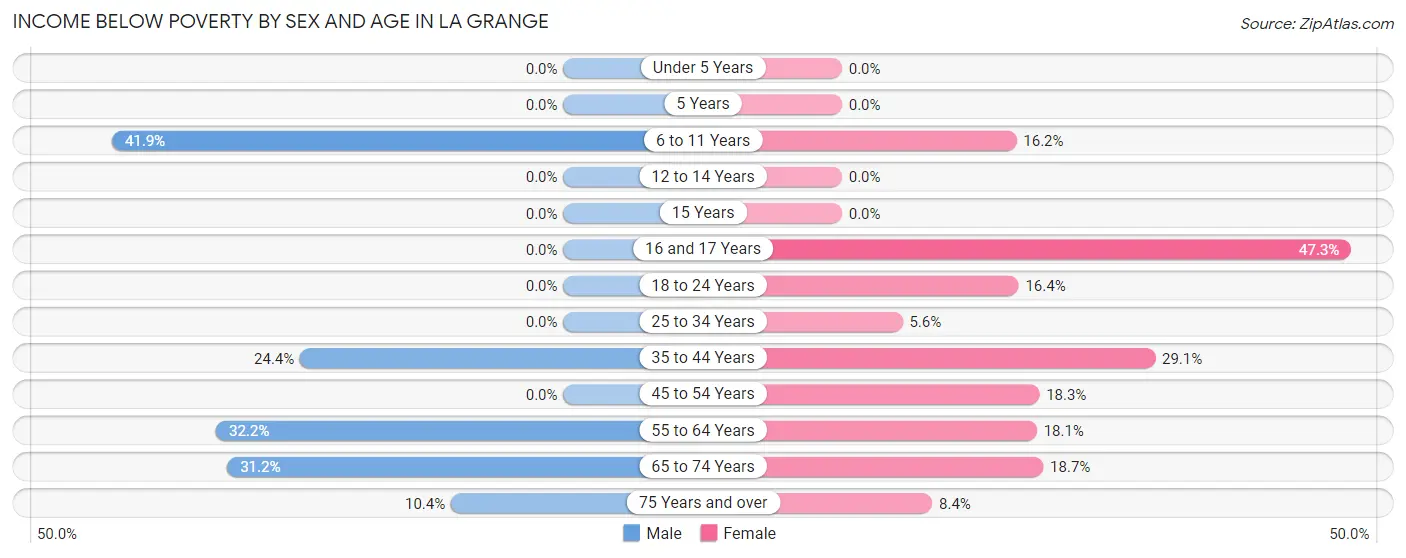
| Age Bracket | Male | Female |
| Under 5 Years | 0 (0.0%) | 0 (0.0%) |
| 5 Years | 0 (0.0%) | 0 (0.0%) |
| 6 to 11 Years | 62 (41.9%) | 46 (16.2%) |
| 12 to 14 Years | 0 (0.0%) | 0 (0.0%) |
| 15 Years | 0 (0.0%) | 0 (0.0%) |
| 16 and 17 Years | 0 (0.0%) | 26 (47.3%) |
| 18 to 24 Years | 0 (0.0%) | 31 (16.4%) |
| 25 to 34 Years | 0 (0.0%) | 17 (5.6%) |
| 35 to 44 Years | 32 (24.4%) | 109 (29.1%) |
| 45 to 54 Years | 0 (0.0%) | 37 (18.3%) |
| 55 to 64 Years | 88 (32.2%) | 70 (18.1%) |
| 65 to 74 Years | 68 (31.2%) | 63 (18.7%) |
| 75 Years and over | 10 (10.4%) | 16 (8.4%) |
| Total | 260 (14.1%) | 415 (16.7%) |
Income Above Poverty by Sex and Age in La Grange
According to the poverty statistics in La Grange, males aged under 5 years and females aged under 5 years are the age groups that are most secure financially, with 100.0% of males and 100.0% of females in these age groups living above the poverty line.
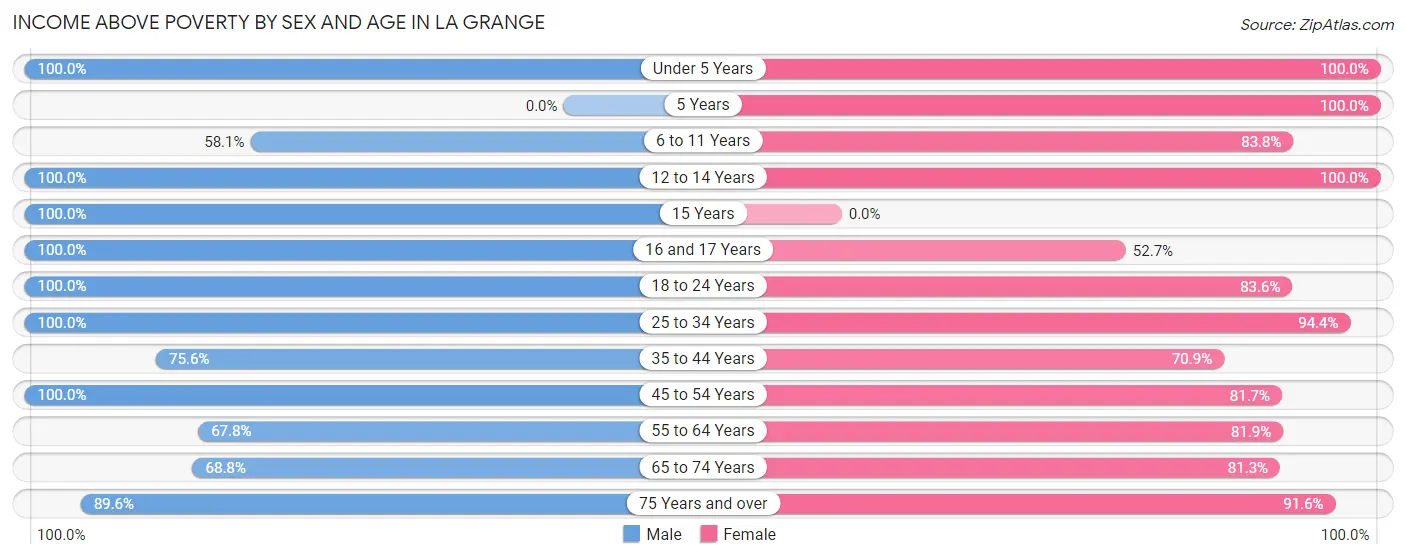
| Age Bracket | Male | Female |
| Under 5 Years | 141 (100.0%) | 82 (100.0%) |
| 5 Years | 0 (0.0%) | 36 (100.0%) |
| 6 to 11 Years | 86 (58.1%) | 238 (83.8%) |
| 12 to 14 Years | 87 (100.0%) | 51 (100.0%) |
| 15 Years | 46 (100.0%) | 0 (0.0%) |
| 16 and 17 Years | 20 (100.0%) | 29 (52.7%) |
| 18 to 24 Years | 96 (100.0%) | 158 (83.6%) |
| 25 to 34 Years | 144 (100.0%) | 285 (94.4%) |
| 35 to 44 Years | 99 (75.6%) | 266 (70.9%) |
| 45 to 54 Years | 439 (100.0%) | 165 (81.7%) |
| 55 to 64 Years | 185 (67.8%) | 317 (81.9%) |
| 65 to 74 Years | 150 (68.8%) | 274 (81.3%) |
| 75 Years and over | 86 (89.6%) | 175 (91.6%) |
| Total | 1,579 (85.9%) | 2,076 (83.3%) |
Income Below Poverty Among Married-Couple Families in La Grange
The poverty statistics for married-couple families in La Grange show that 6.8% or 46 of the total 680 families live below the poverty line. Families with no children have the highest poverty rate of 9.7%, comprising of 46 families. On the other hand, families with 1 or 2 children have the lowest poverty rate of 0.0%, which includes 0 families.
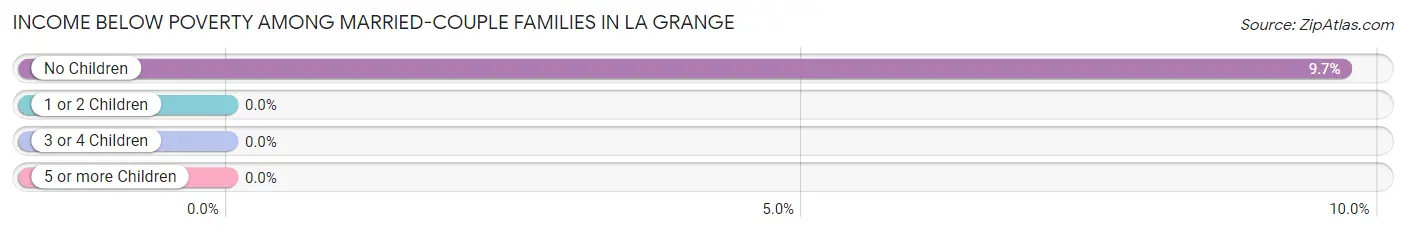
| Children | Above Poverty | Below Poverty |
| No Children | 428 (90.3%) | 46 (9.7%) |
| 1 or 2 Children | 133 (100.0%) | 0 (0.0%) |
| 3 or 4 Children | 73 (100.0%) | 0 (0.0%) |
| 5 or more Children | 0 (0.0%) | 0 (0.0%) |
| Total | 634 (93.2%) | 46 (6.8%) |
Income Below Poverty Among Single-Parent Households in La Grange
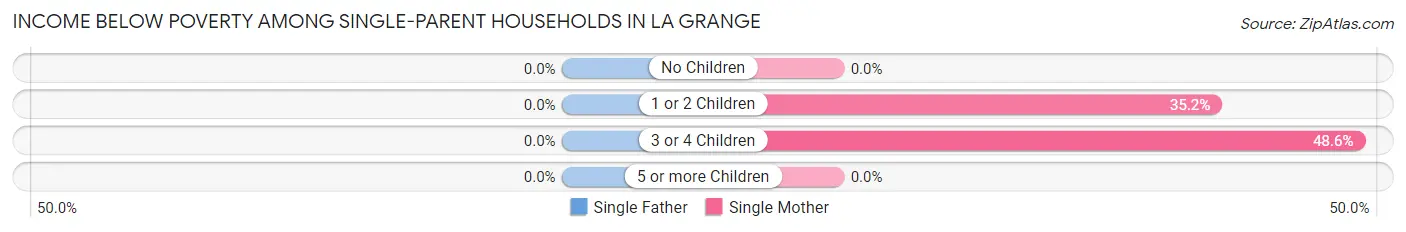
| Children | Single Father | Single Mother |
| No Children | 0 (0.0%) | 0 (0.0%) |
| 1 or 2 Children | 0 (0.0%) | 37 (35.2%) |
| 3 or 4 Children | 0 (0.0%) | 17 (48.6%) |
| 5 or more Children | 0 (0.0%) | 0 (0.0%) |
| Total | 0 (0.0%) | 54 (25.8%) |
Income Below Poverty Among Married-Couple vs Single-Parent Households in La Grange
The poverty data for La Grange shows that 46 of the married-couple family households (6.8%) and 54 of the single-parent households (20.6%) are living below the poverty level. Within the married-couple family households, those with no children have the highest poverty rate, with 46 households (9.7%) falling below the poverty line. Among the single-parent households, those with 3 or 4 children have the highest poverty rate, with 17 household (48.6%) living below poverty.
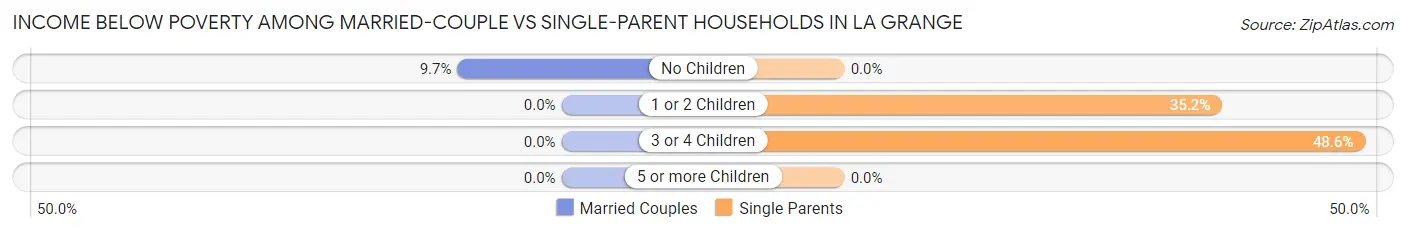
| Children | Married-Couple Families | Single-Parent Households |
| No Children | 46 (9.7%) | 0 (0.0%) |
| 1 or 2 Children | 0 (0.0%) | 37 (35.2%) |
| 3 or 4 Children | 0 (0.0%) | 17 (48.6%) |
| 5 or more Children | 0 (0.0%) | 0 (0.0%) |
| Total | 46 (6.8%) | 54 (20.6%) |
Race in La Grange
The most populous races in La Grange are White / Caucasian (3,499 | 79.2%), Hispanic or Latino (1,337 | 30.3%), and Black / African American (444 | 10.1%).
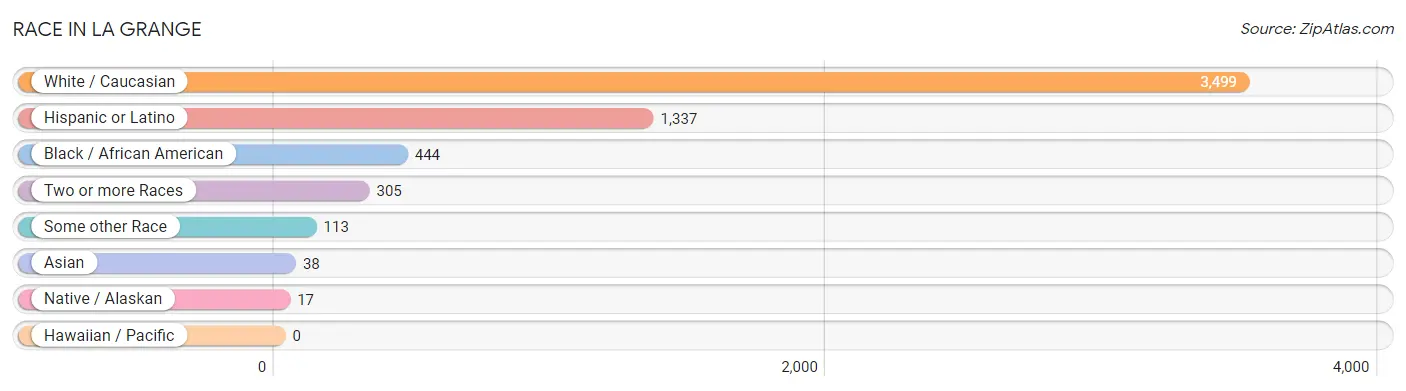
| Race | # Population | % Population |
| Asian | 38 | 0.9% |
| Black / African American | 444 | 10.1% |
| Hawaiian / Pacific | 0 | 0.0% |
| Hispanic or Latino | 1,337 | 30.3% |
| Native / Alaskan | 17 | 0.4% |
| White / Caucasian | 3,499 | 79.2% |
| Two or more Races | 305 | 6.9% |
| Some other Race | 113 | 2.6% |
| Total | 4,416 | 100.0% |
Ancestry in La Grange
The most populous ancestries reported in La Grange are Mexican (1,296 | 29.3%), German (618 | 14.0%), English (491 | 11.1%), Czech (248 | 5.6%), and European (246 | 5.6%), together accounting for 65.6% of all La Grange residents.
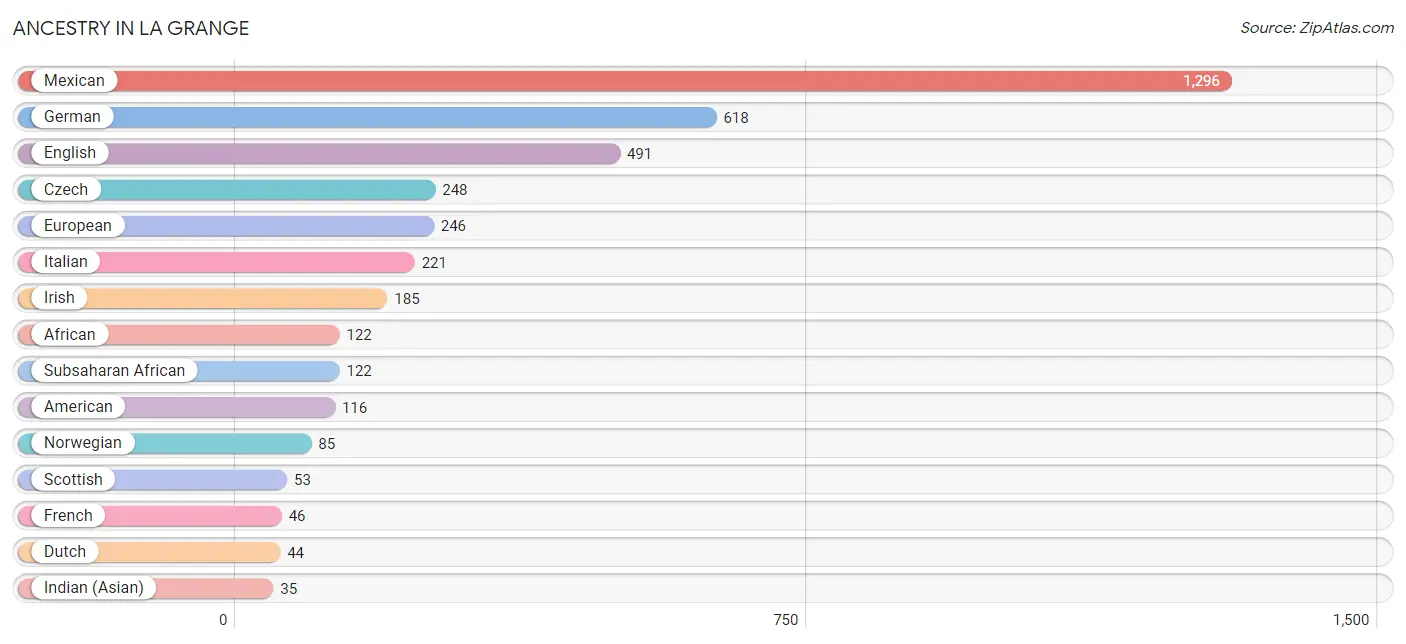
| Ancestry | # Population | % Population |
| African | 122 | 2.8% |
| American | 116 | 2.6% |
| Arab | 21 | 0.5% |
| Choctaw | 17 | 0.4% |
| Czech | 248 | 5.6% |
| Danish | 23 | 0.5% |
| Dutch | 44 | 1.0% |
| English | 491 | 11.1% |
| European | 246 | 5.6% |
| French | 46 | 1.0% |
| German | 618 | 14.0% |
| Indian (Asian) | 35 | 0.8% |
| Irish | 185 | 4.2% |
| Italian | 221 | 5.0% |
| Japanese | 21 | 0.5% |
| Korean | 21 | 0.5% |
| Lebanese | 21 | 0.5% |
| Lithuanian | 28 | 0.6% |
| Mexican | 1,296 | 29.3% |
| Norwegian | 85 | 1.9% |
| Polish | 11 | 0.3% |
| Scotch-Irish | 22 | 0.5% |
| Scottish | 53 | 1.2% |
| Spaniard | 20 | 0.4% |
| Spanish | 18 | 0.4% |
| Subsaharan African | 122 | 2.8% | View All 26 Rows |
Immigrants in La Grange
The most numerous immigrant groups reported in La Grange came from Latin America (425 | 9.6%), Central America (370 | 8.4%), Mexico (370 | 8.4%), Asia (42 | 0.9%), and Caribbean (35 | 0.8%), together accounting for 28.1% of all La Grange residents.
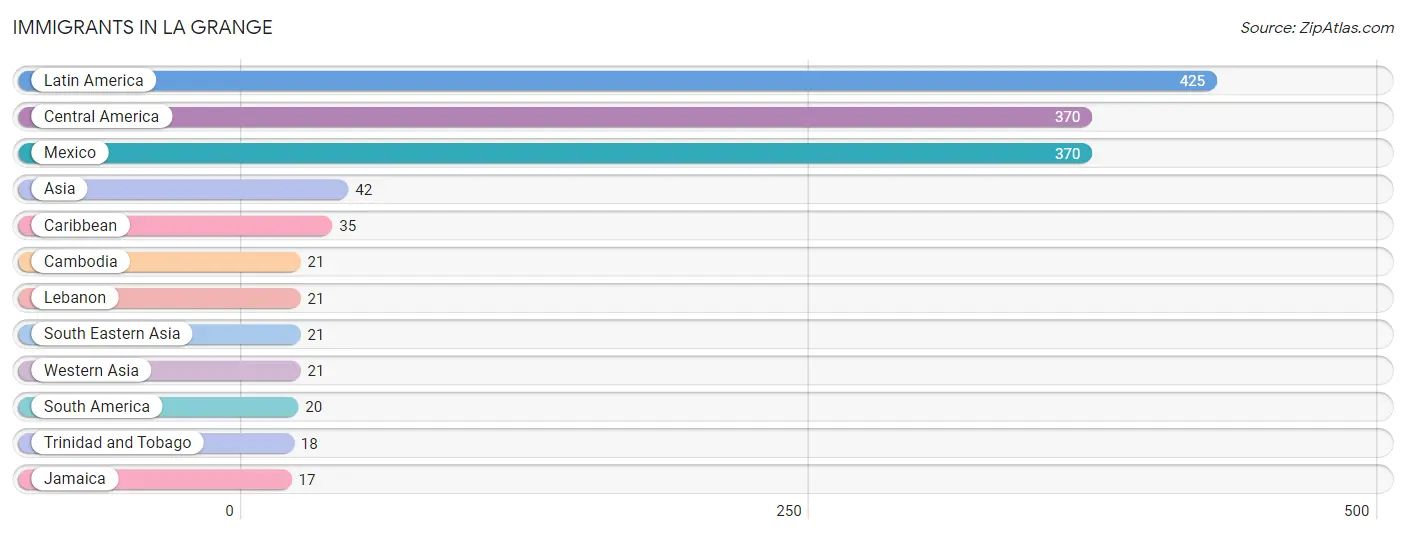
| Immigration Origin | # Population | % Population |
| Asia | 42 | 0.9% |
| Cambodia | 21 | 0.5% |
| Caribbean | 35 | 0.8% |
| Central America | 370 | 8.4% |
| Jamaica | 17 | 0.4% |
| Latin America | 425 | 9.6% |
| Lebanon | 21 | 0.5% |
| Mexico | 370 | 8.4% |
| South America | 20 | 0.4% |
| South Eastern Asia | 21 | 0.5% |
| Trinidad and Tobago | 18 | 0.4% |
| Western Asia | 21 | 0.5% | View All 12 Rows |
Sex and Age in La Grange
Sex and Age in La Grange
The most populous age groups in La Grange are 50 to 54 Years (269 | 14.2%) for men and 40 to 44 Years (327 | 13.0%) for women.
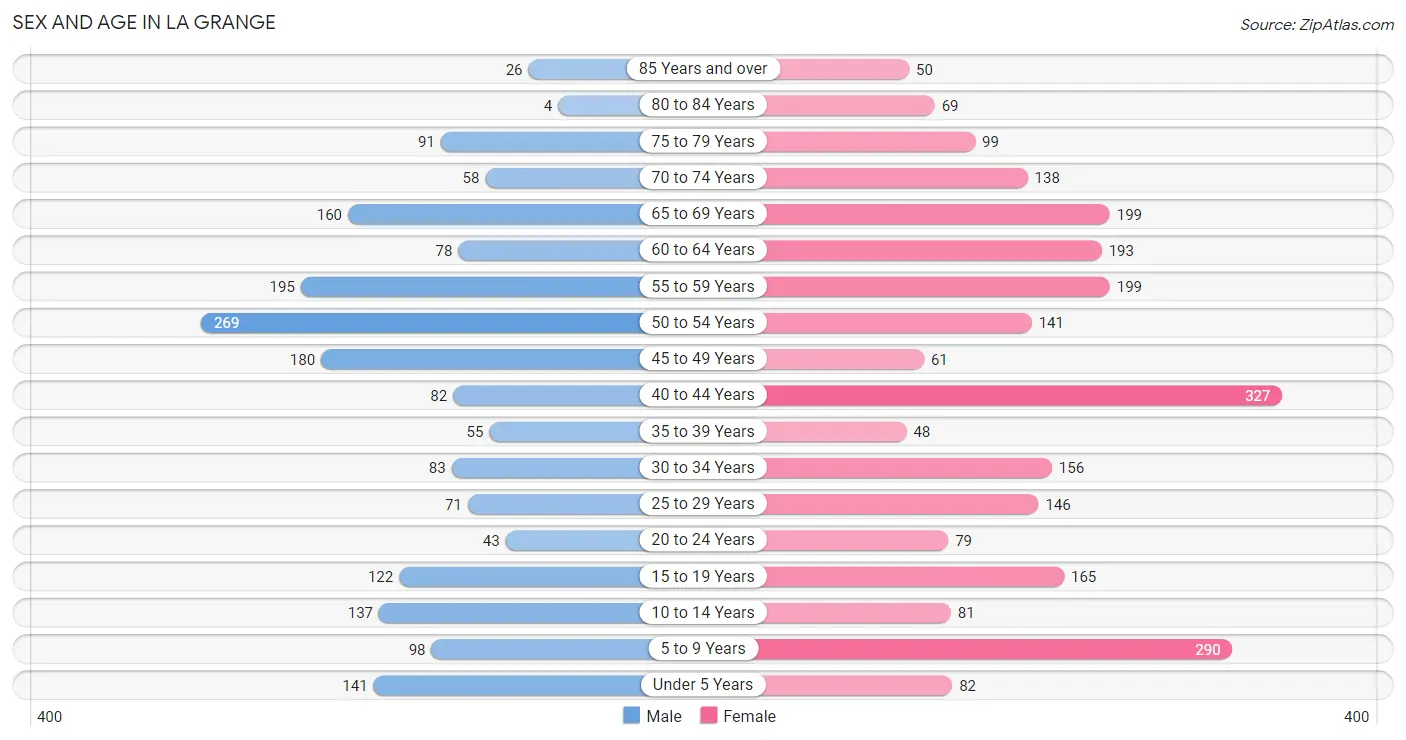
| Age Bracket | Male | Female |
| Under 5 Years | 141 (7.4%) | 82 (3.3%) |
| 5 to 9 Years | 98 (5.2%) | 290 (11.5%) |
| 10 to 14 Years | 137 (7.2%) | 81 (3.2%) |
| 15 to 19 Years | 122 (6.4%) | 165 (6.5%) |
| 20 to 24 Years | 43 (2.3%) | 79 (3.1%) |
| 25 to 29 Years | 71 (3.7%) | 146 (5.8%) |
| 30 to 34 Years | 83 (4.4%) | 156 (6.2%) |
| 35 to 39 Years | 55 (2.9%) | 48 (1.9%) |
| 40 to 44 Years | 82 (4.3%) | 327 (13.0%) |
| 45 to 49 Years | 180 (9.5%) | 61 (2.4%) |
| 50 to 54 Years | 269 (14.2%) | 141 (5.6%) |
| 55 to 59 Years | 195 (10.3%) | 199 (7.9%) |
| 60 to 64 Years | 78 (4.1%) | 193 (7.6%) |
| 65 to 69 Years | 160 (8.5%) | 199 (7.9%) |
| 70 to 74 Years | 58 (3.1%) | 138 (5.5%) |
| 75 to 79 Years | 91 (4.8%) | 99 (3.9%) |
| 80 to 84 Years | 4 (0.2%) | 69 (2.7%) |
| 85 Years and over | 26 (1.4%) | 50 (2.0%) |
| Total | 1,893 (100.0%) | 2,523 (100.0%) |
Families and Households in La Grange
Median Family Size in La Grange
The median family size in La Grange is 3.58 persons per family, with single female/mother families (209 | 22.2%) accounting for the largest median family size of 4.85 persons per family. On the other hand, married-couple families (680 | 72.2%) represent the smallest median family size with 3.20 persons per family.
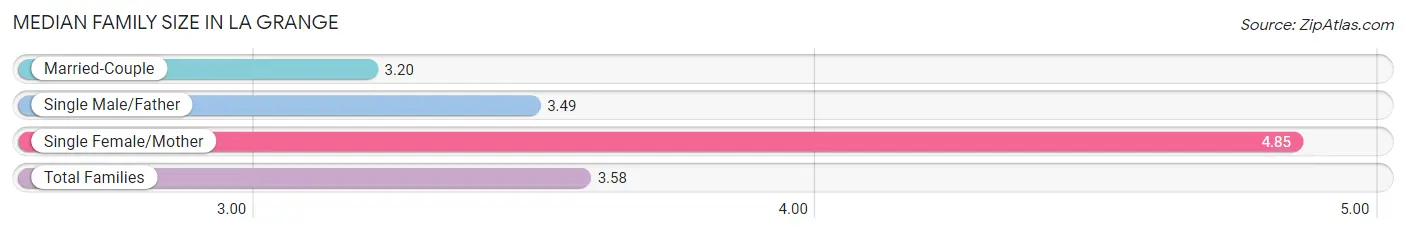
| Family Type | # Families | Family Size |
| Married-Couple | 680 (72.2%) | 3.20 |
| Single Male/Father | 53 (5.6%) | 3.49 |
| Single Female/Mother | 209 (22.2%) | 4.85 |
| Total Families | 942 (100.0%) | 3.58 |
Median Household Size in La Grange
The median household size in La Grange is 2.47 persons per household, with single female/mother households (209 | 12.0%) accounting for the largest median household size of 4.85 persons per household. non-family households (798 | 45.9%) represent the smallest median household size with 1.14 persons per household.
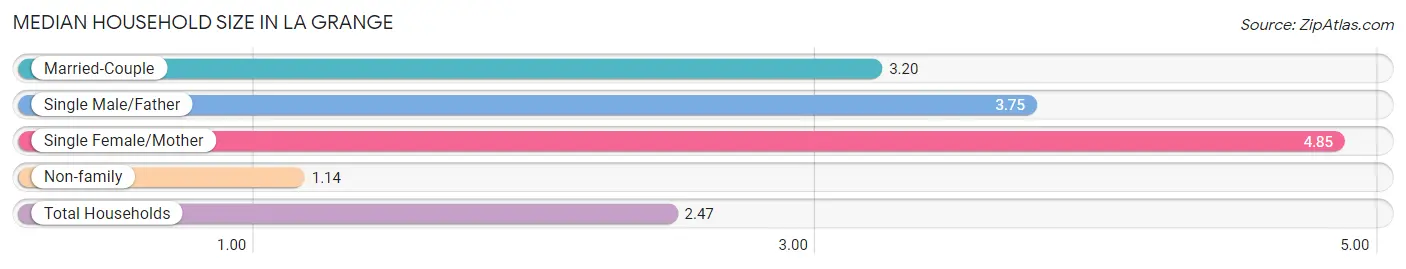
| Household Type | # Households | Household Size |
| Married-Couple | 680 (39.1%) | 3.20 |
| Single Male/Father | 53 (3.0%) | 3.75 |
| Single Female/Mother | 209 (12.0%) | 4.85 |
| Non-family | 798 (45.9%) | 1.14 |
| Total Households | 1,740 (100.0%) | 2.47 |
Household Size by Marriage Status in La Grange
Out of a total of 1,740 households in La Grange, 942 (54.1%) are family households, while 798 (45.9%) are nonfamily households. The most numerous type of family households are 2-person households, comprising 516, and the most common type of nonfamily households are 1-person households, comprising 699.
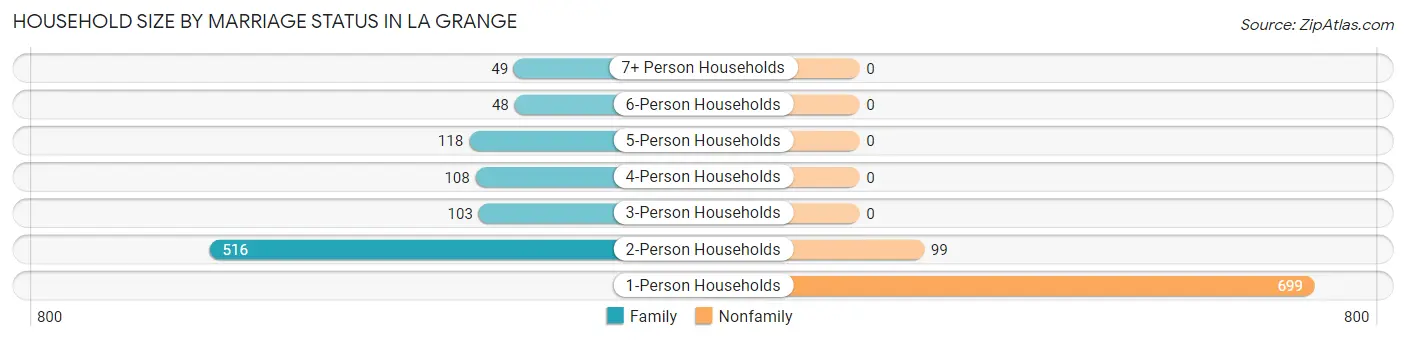
| Household Size | Family Households | Nonfamily Households |
| 1-Person Households | - | 699 (40.2%) |
| 2-Person Households | 516 (29.7%) | 99 (5.7%) |
| 3-Person Households | 103 (5.9%) | 0 (0.0%) |
| 4-Person Households | 108 (6.2%) | 0 (0.0%) |
| 5-Person Households | 118 (6.8%) | 0 (0.0%) |
| 6-Person Households | 48 (2.8%) | 0 (0.0%) |
| 7+ Person Households | 49 (2.8%) | 0 (0.0%) |
| Total | 942 (54.1%) | 798 (45.9%) |
Female Fertility in La Grange
Fertility by Age in La Grange
Average fertility rate in La Grange is 80.0 births per 1,000 women. Women in the age bracket of 20 to 34 years have the highest fertility rate with 136.0 births per 1,000 women. Women in the age bracket of 20 to 34 years acount for 65.0% of all women with births.
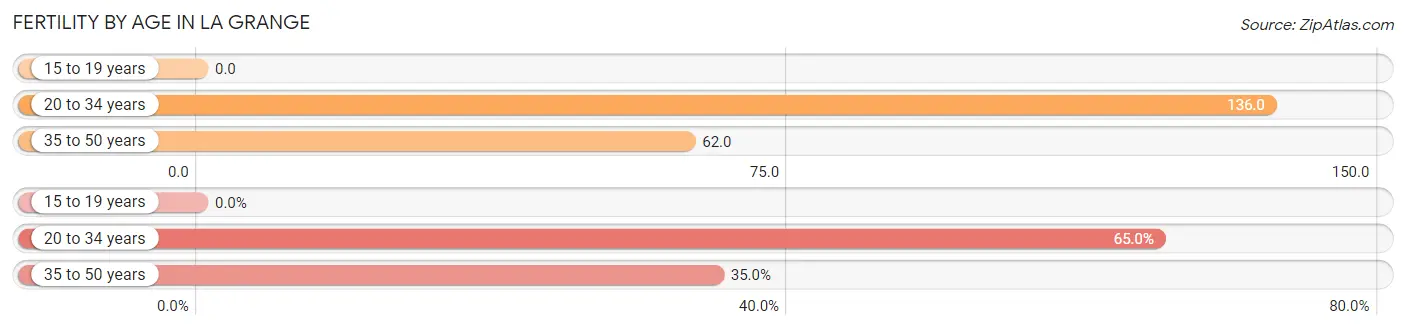
| Age Bracket | Women with Births | Births / 1,000 Women |
| 15 to 19 years | 0 (0.0%) | 0.0 |
| 20 to 34 years | 52 (65.0%) | 136.0 |
| 35 to 50 years | 28 (35.0%) | 62.0 |
| Total | 80 (100.0%) | 80.0 |
Fertility by Age by Marriage Status in La Grange
57.5% of women with births (80) in La Grange are married. The highest percentage of unmarried women with births falls into 20 to 34 years age bracket with 65.4% of them unmarried at the time of birth, while the lowest percentage of unmarried women with births belong to 35 to 50 years age bracket with 0.0% of them unmarried.
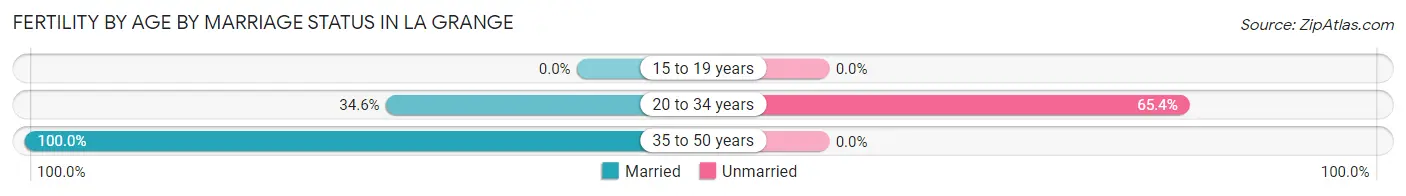
| Age Bracket | Married | Unmarried |
| 15 to 19 years | 0 (0.0%) | 0 (0.0%) |
| 20 to 34 years | 18 (34.6%) | 34 (65.4%) |
| 35 to 50 years | 28 (100.0%) | 0 (0.0%) |
| Total | 46 (57.5%) | 34 (42.5%) |
Fertility by Education in La Grange
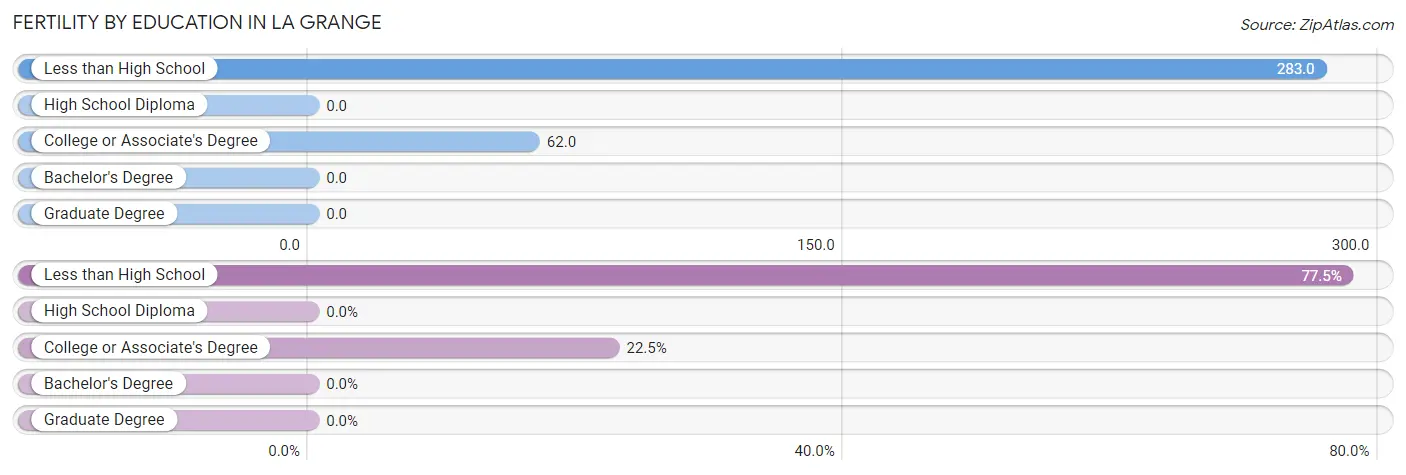
| Educational Attainment | Women with Births | Births / 1,000 Women |
| Less than High School | 62 (77.5%) | 283.0 |
| High School Diploma | 0 (0.0%) | 0.0 |
| College or Associate's Degree | 18 (22.5%) | 62.0 |
| Bachelor's Degree | 0 (0.0%) | 0.0 |
| Graduate Degree | 0 (0.0%) | 0.0 |
| Total | 80 (100.0%) | 80.0 |
Fertility by Education by Marriage Status in La Grange
42.5% of women with births in La Grange are unmarried. Women with the educational attainment of college or associate's degree are most likely to be married with 100.0% of them married at childbirth, while women with the educational attainment of less than high school are least likely to be married with 54.8% of them unmarried at childbirth.
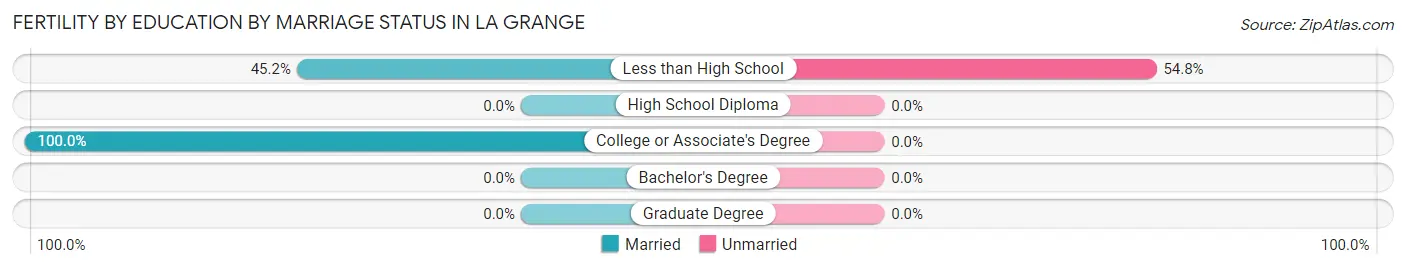
| Educational Attainment | Married | Unmarried |
| Less than High School | 28 (45.2%) | 34 (54.8%) |
| High School Diploma | 0 (0.0%) | 0 (0.0%) |
| College or Associate's Degree | 18 (100.0%) | 0 (0.0%) |
| Bachelor's Degree | 0 (0.0%) | 0 (0.0%) |
| Graduate Degree | 0 (0.0%) | 0 (0.0%) |
| Total | 46 (57.5%) | 34 (42.5%) |
Employment Characteristics in La Grange
Employment by Class of Employer in La Grange
Among the 1,987 employed individuals in La Grange, private company employees (1,413 | 71.1%), self-employed (not incorporated) (170 | 8.6%), and local government employees (167 | 8.4%) make up the most common classes of employment.
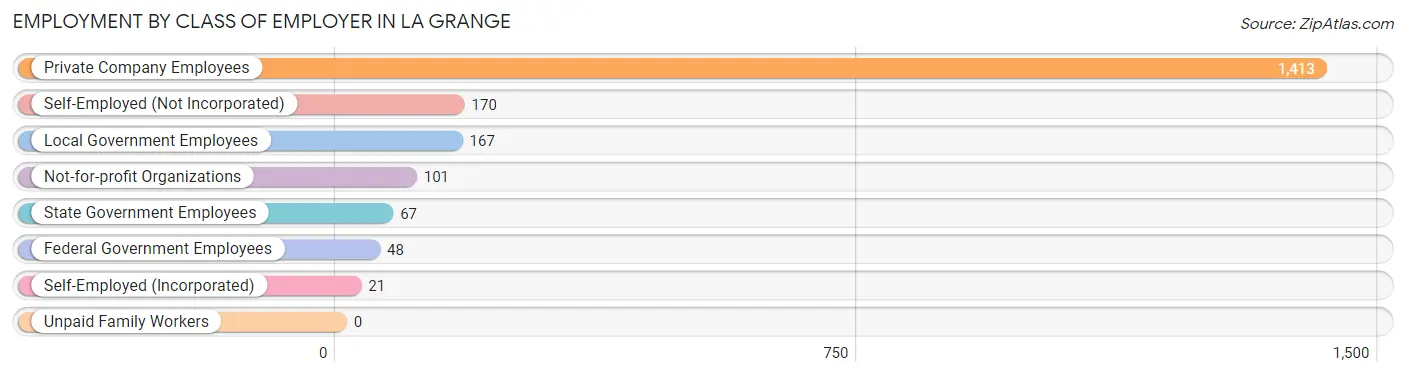
| Employer Class | # Employees | % Employees |
| Private Company Employees | 1,413 | 71.1% |
| Self-Employed (Incorporated) | 21 | 1.1% |
| Self-Employed (Not Incorporated) | 170 | 8.6% |
| Not-for-profit Organizations | 101 | 5.1% |
| Local Government Employees | 167 | 8.4% |
| State Government Employees | 67 | 3.4% |
| Federal Government Employees | 48 | 2.4% |
| Unpaid Family Workers | 0 | 0.0% |
| Total | 1,987 | 100.0% |
Employment Status by Age in La Grange
According to the labor force statistics for La Grange, out of the total population over 16 years of age (3,541), 60.2% or 2,132 individuals are in the labor force, with 6.8% or 145 of them unemployed. The age group with the highest labor force participation rate is 25 to 29 years, with 95.4% or 207 individuals in the labor force. Within the labor force, the 60 to 64 years age range has the highest percentage of unemployed individuals, with 14.2% or 17 of them being unemployed.
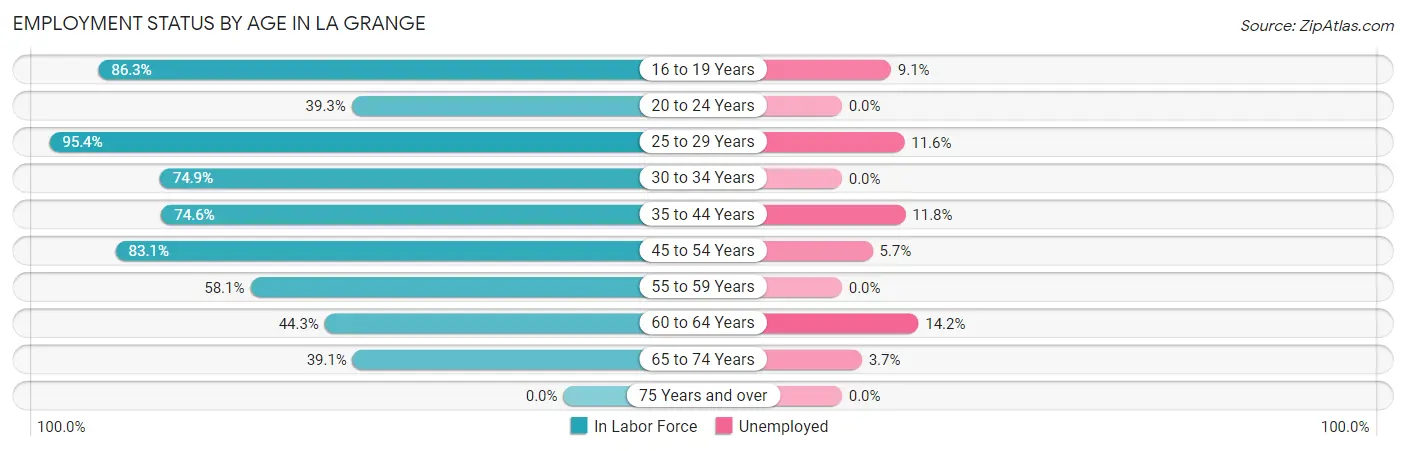
| Age Bracket | In Labor Force | Unemployed |
| 16 to 19 Years | 208 (86.3%) | 19 (9.1%) |
| 20 to 24 Years | 48 (39.3%) | 0 (0.0%) |
| 25 to 29 Years | 207 (95.4%) | 24 (11.6%) |
| 30 to 34 Years | 179 (74.9%) | 0 (0.0%) |
| 35 to 44 Years | 382 (74.6%) | 45 (11.8%) |
| 45 to 54 Years | 541 (83.1%) | 31 (5.7%) |
| 55 to 59 Years | 229 (58.1%) | 0 (0.0%) |
| 60 to 64 Years | 120 (44.3%) | 17 (14.2%) |
| 65 to 74 Years | 217 (39.1%) | 8 (3.7%) |
| 75 Years and over | 0 (0.0%) | 0 (0.0%) |
| Total | 2,132 (60.2%) | 145 (6.8%) |
Employment Status by Educational Attainment in La Grange
According to labor force statistics for La Grange, 72.6% of individuals (1,658) out of the total population between 25 and 64 years of age (2,284) are in the labor force, with 7.1% or 118 of them being unemployed. The group with the highest labor force participation rate are those with the educational attainment of college / associate degree, with 87.2% or 389 individuals in the labor force. Within the labor force, individuals with bachelor's degree or higher education have the highest percentage of unemployment, with 19.9% or 48 of them being unemployed.
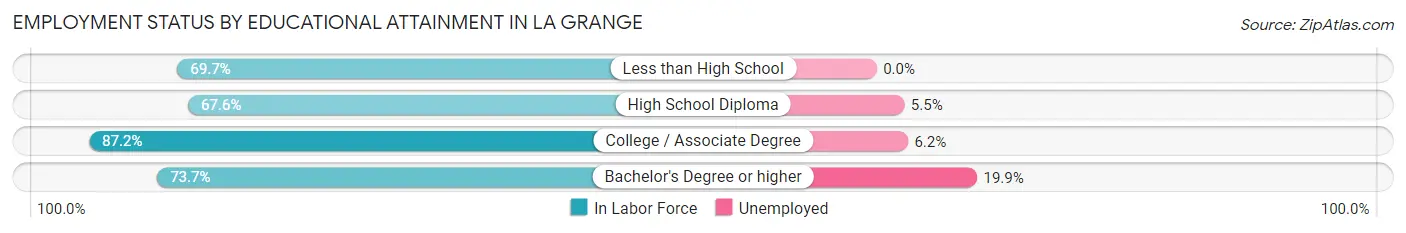
| Educational Attainment | In Labor Force | Unemployed |
| Less than High School | 216 (69.7%) | 0 (0.0%) |
| High School Diploma | 812 (67.6%) | 66 (5.5%) |
| College / Associate Degree | 389 (87.2%) | 28 (6.2%) |
| Bachelor's Degree or higher | 241 (73.7%) | 65 (19.9%) |
| Total | 1,658 (72.6%) | 162 (7.1%) |
Employment Occupations by Sex in La Grange
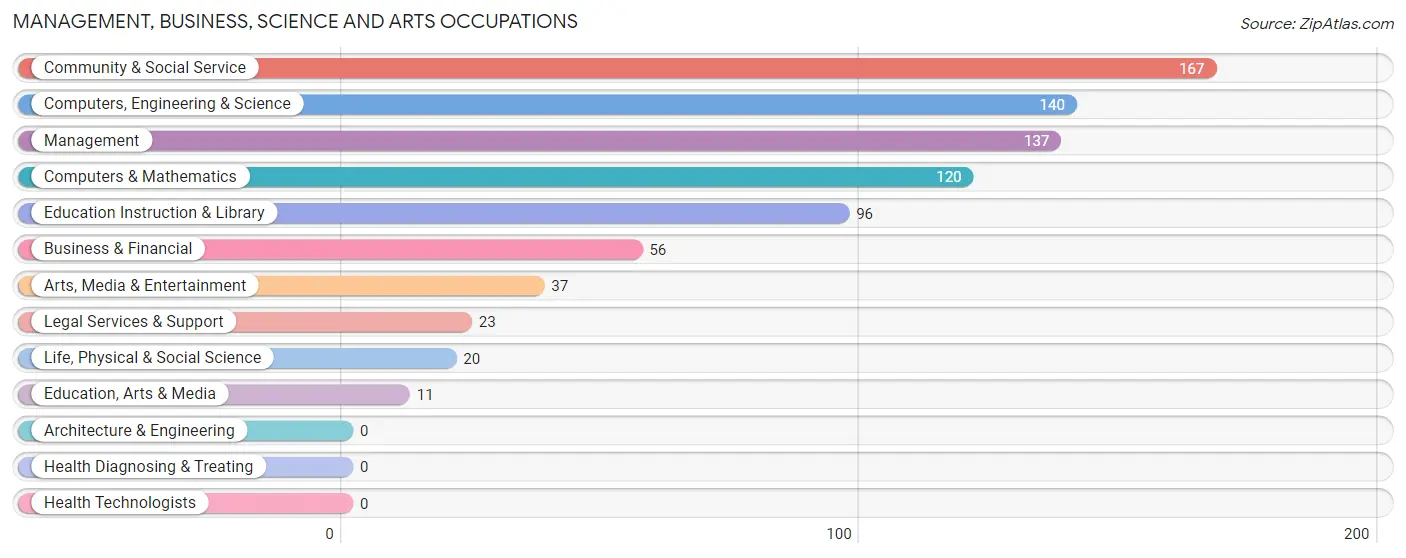
Management, Business, Science and Arts Occupations
The most common Management, Business, Science and Arts occupations in La Grange are Community & Social Service (167 | 8.4%), Computers, Engineering & Science (140 | 7.0%), Management (137 | 6.9%), Computers & Mathematics (120 | 6.0%), and Education Instruction & Library (96 | 4.8%).
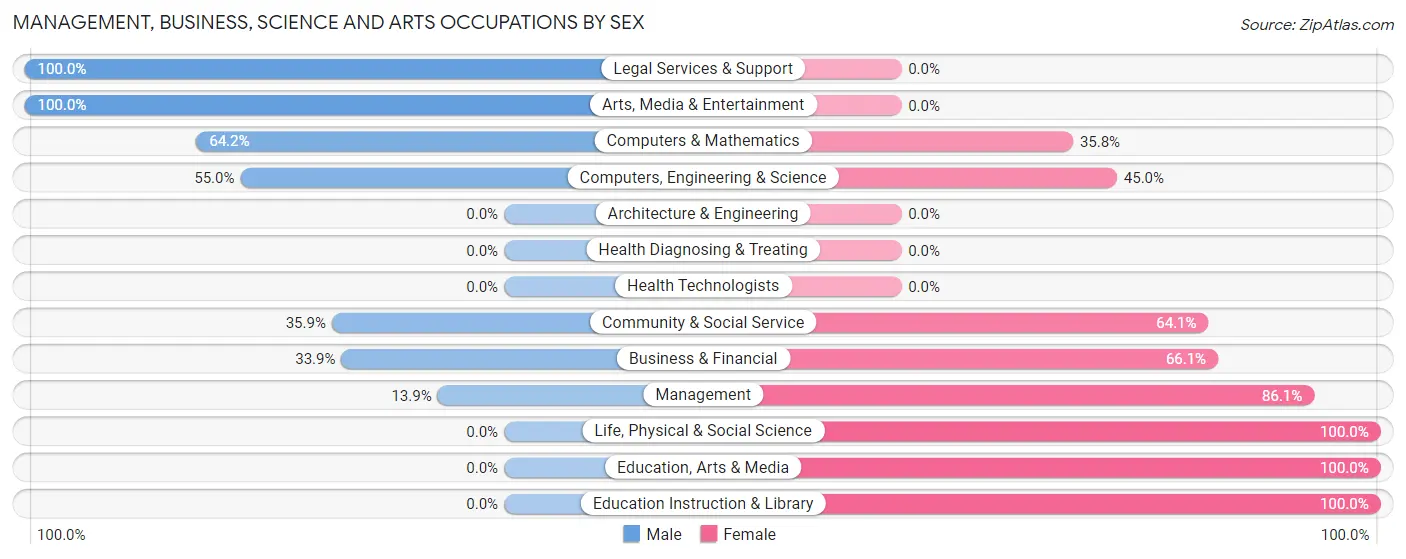
Management, Business, Science and Arts Occupations by Sex
Within the Management, Business, Science and Arts occupations in La Grange, the most male-oriented occupations are Legal Services & Support (100.0%), Arts, Media & Entertainment (100.0%), and Computers & Mathematics (64.2%), while the most female-oriented occupations are Life, Physical & Social Science (100.0%), Education, Arts & Media (100.0%), and Education Instruction & Library (100.0%).
| Occupation | Male | Female |
| Management | 19 (13.9%) | 118 (86.1%) |
| Business & Financial | 19 (33.9%) | 37 (66.1%) |
| Computers, Engineering & Science | 77 (55.0%) | 63 (45.0%) |
| Computers & Mathematics | 77 (64.2%) | 43 (35.8%) |
| Architecture & Engineering | 0 (0.0%) | 0 (0.0%) |
| Life, Physical & Social Science | 0 (0.0%) | 20 (100.0%) |
| Community & Social Service | 60 (35.9%) | 107 (64.1%) |
| Education, Arts & Media | 0 (0.0%) | 11 (100.0%) |
| Legal Services & Support | 23 (100.0%) | 0 (0.0%) |
| Education Instruction & Library | 0 (0.0%) | 96 (100.0%) |
| Arts, Media & Entertainment | 37 (100.0%) | 0 (0.0%) |
| Health Diagnosing & Treating | 0 (0.0%) | 0 (0.0%) |
| Health Technologists | 0 (0.0%) | 0 (0.0%) |
| Total (Category) | 175 (35.0%) | 325 (65.0%) |
| Total (Overall) | 796 (40.1%) | 1,191 (59.9%) |
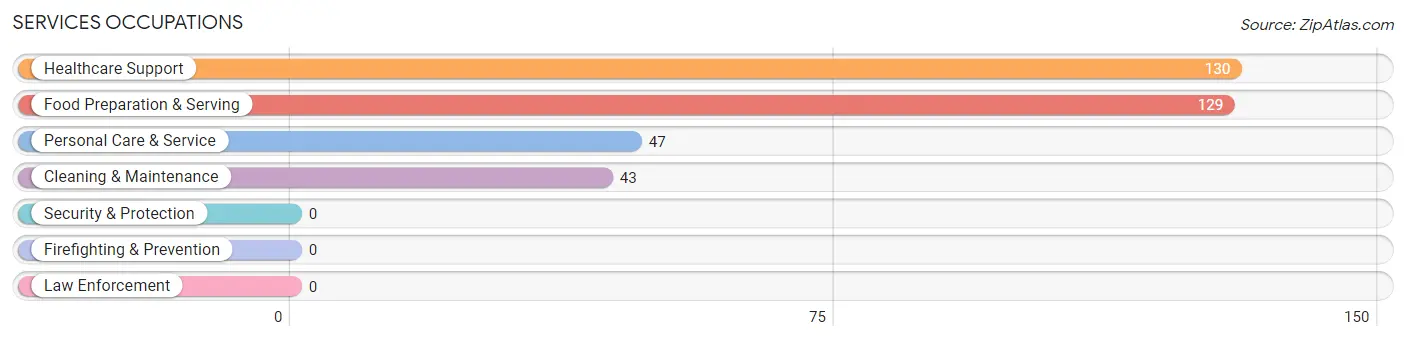
Services Occupations
The most common Services occupations in La Grange are Healthcare Support (130 | 6.5%), Food Preparation & Serving (129 | 6.5%), Personal Care & Service (47 | 2.4%), and Cleaning & Maintenance (43 | 2.2%).
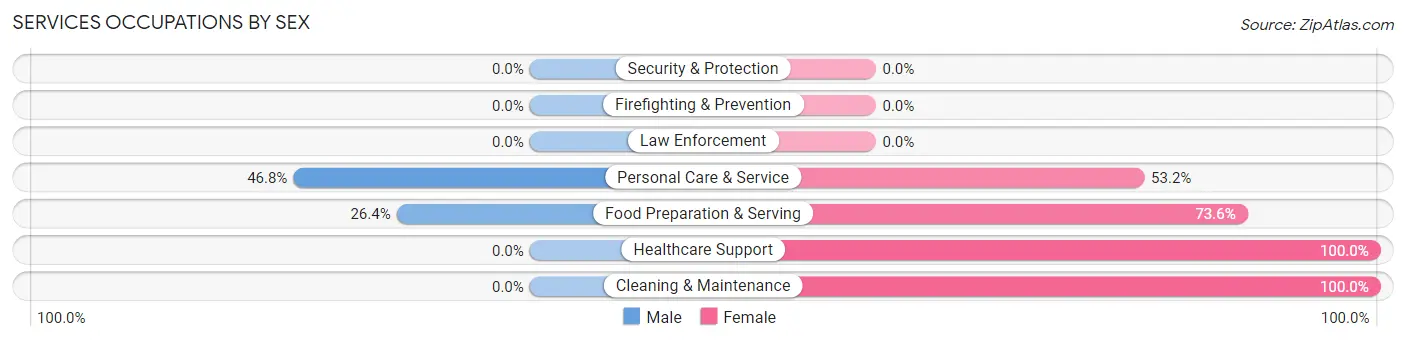
Services Occupations by Sex
Within the Services occupations in La Grange, the most male-oriented occupations are Personal Care & Service (46.8%), and Food Preparation & Serving (26.4%), while the most female-oriented occupations are Healthcare Support (100.0%), Cleaning & Maintenance (100.0%), and Food Preparation & Serving (73.6%).
| Occupation | Male | Female |
| Healthcare Support | 0 (0.0%) | 130 (100.0%) |
| Security & Protection | 0 (0.0%) | 0 (0.0%) |
| Firefighting & Prevention | 0 (0.0%) | 0 (0.0%) |
| Law Enforcement | 0 (0.0%) | 0 (0.0%) |
| Food Preparation & Serving | 34 (26.4%) | 95 (73.6%) |
| Cleaning & Maintenance | 0 (0.0%) | 43 (100.0%) |
| Personal Care & Service | 22 (46.8%) | 25 (53.2%) |
| Total (Category) | 56 (16.1%) | 293 (84.0%) |
| Total (Overall) | 796 (40.1%) | 1,191 (59.9%) |
Sales and Office Occupations
The most common Sales and Office occupations in La Grange are Office & Administration (220 | 11.1%), and Sales & Related (113 | 5.7%).

Sales and Office Occupations by Sex

| Occupation | Male | Female |
| Sales & Related | 38 (33.6%) | 75 (66.4%) |
| Office & Administration | 128 (58.2%) | 92 (41.8%) |
| Total (Category) | 166 (49.8%) | 167 (50.1%) |
| Total (Overall) | 796 (40.1%) | 1,191 (59.9%) |
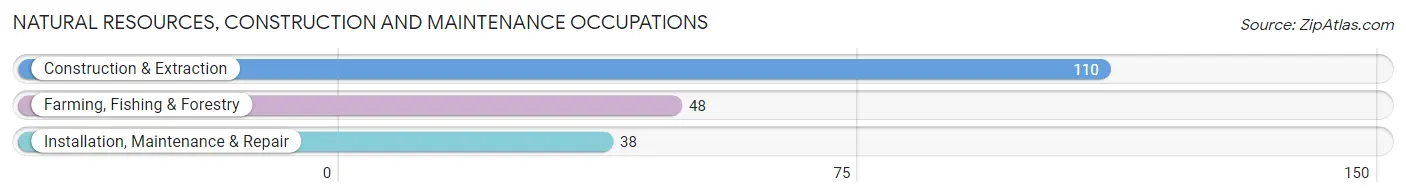
Natural Resources, Construction and Maintenance Occupations
The most common Natural Resources, Construction and Maintenance occupations in La Grange are Construction & Extraction (110 | 5.5%), Farming, Fishing & Forestry (48 | 2.4%), and Installation, Maintenance & Repair (38 | 1.9%).
Natural Resources, Construction and Maintenance Occupations by Sex
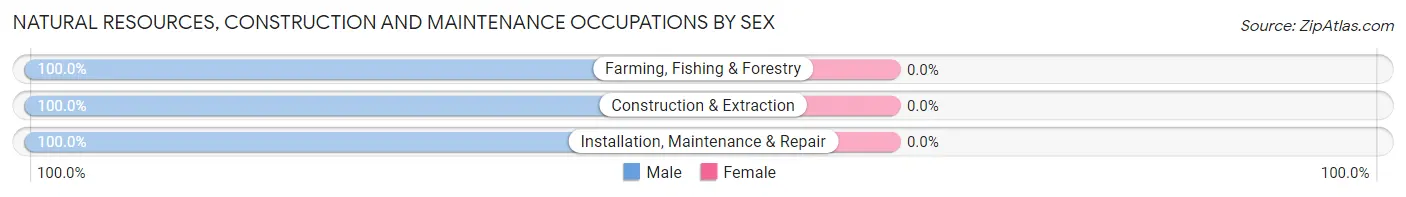
| Occupation | Male | Female |
| Farming, Fishing & Forestry | 48 (100.0%) | 0 (0.0%) |
| Construction & Extraction | 110 (100.0%) | 0 (0.0%) |
| Installation, Maintenance & Repair | 38 (100.0%) | 0 (0.0%) |
| Total (Category) | 196 (100.0%) | 0 (0.0%) |
| Total (Overall) | 796 (40.1%) | 1,191 (59.9%) |
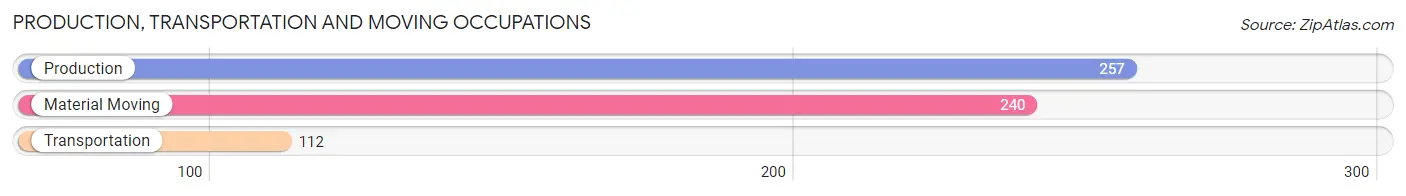
Production, Transportation and Moving Occupations
The most common Production, Transportation and Moving occupations in La Grange are Production (257 | 12.9%), Material Moving (240 | 12.1%), and Transportation (112 | 5.6%).
Production, Transportation and Moving Occupations by Sex
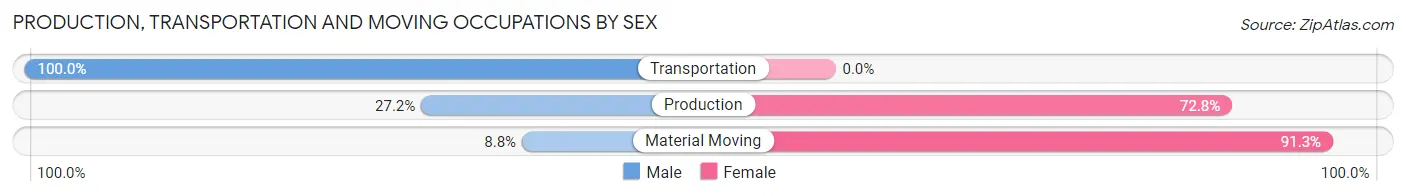
| Occupation | Male | Female |
| Production | 70 (27.2%) | 187 (72.8%) |
| Transportation | 112 (100.0%) | 0 (0.0%) |
| Material Moving | 21 (8.7%) | 219 (91.2%) |
| Total (Category) | 203 (33.3%) | 406 (66.7%) |
| Total (Overall) | 796 (40.1%) | 1,191 (59.9%) |
Employment Industries by Sex in La Grange
Employment Industries in La Grange
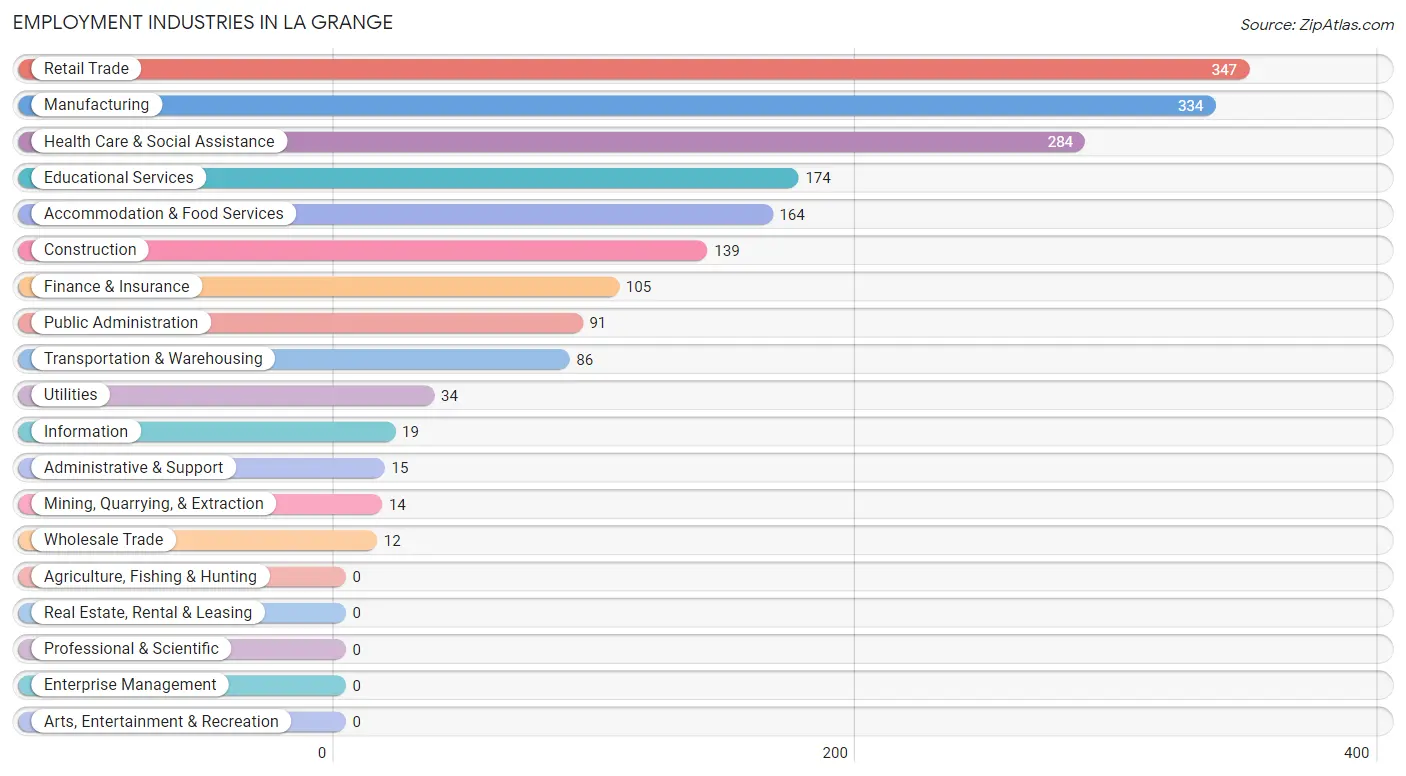
The major employment industries in La Grange include Retail Trade (347 | 17.5%), Manufacturing (334 | 16.8%), Health Care & Social Assistance (284 | 14.3%), Educational Services (174 | 8.8%), and Accommodation & Food Services (164 | 8.3%).
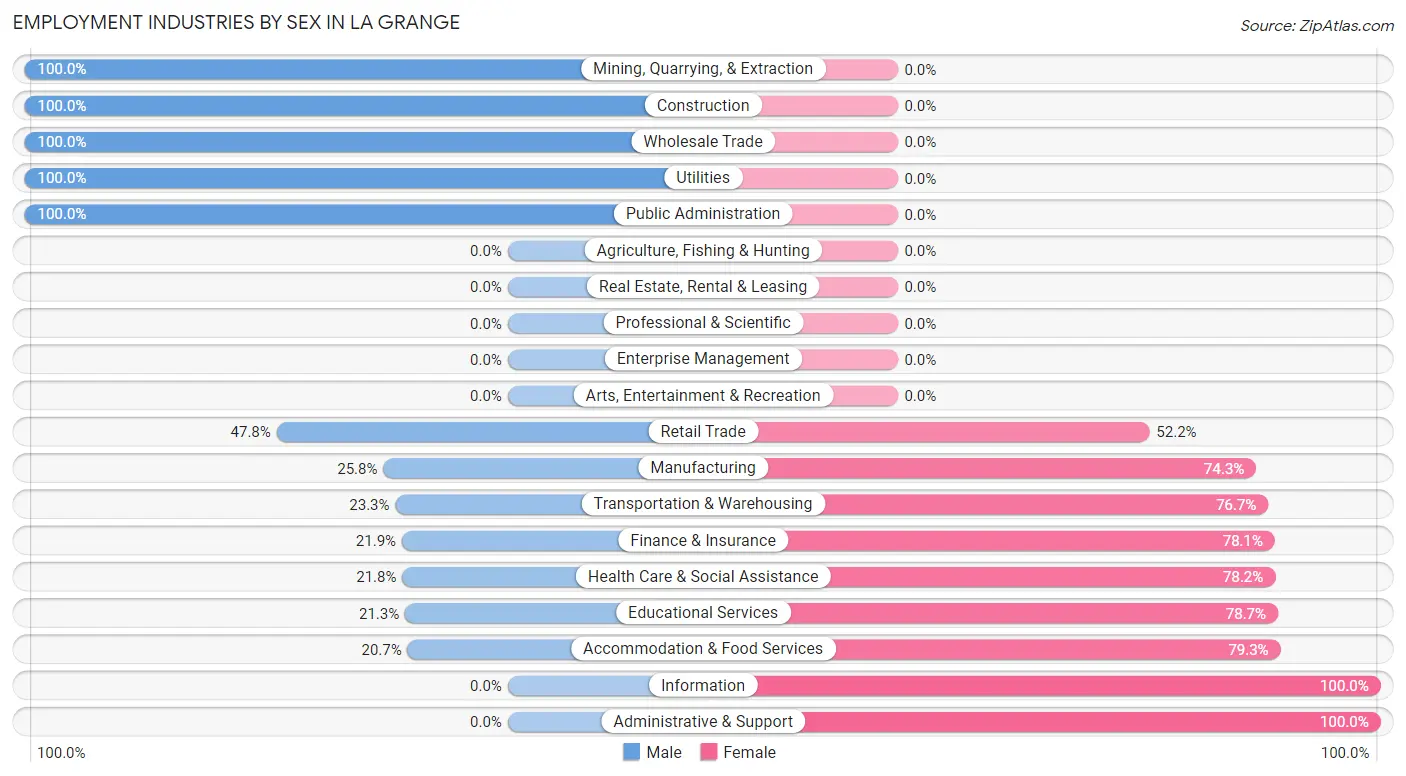
Employment Industries by Sex in La Grange
The La Grange industries that see more men than women are Mining, Quarrying, & Extraction (100.0%), Construction (100.0%), and Wholesale Trade (100.0%), whereas the industries that tend to have a higher number of women are Information (100.0%), Administrative & Support (100.0%), and Accommodation & Food Services (79.3%).
| Industry | Male | Female |
| Agriculture, Fishing & Hunting | 0 (0.0%) | 0 (0.0%) |
| Mining, Quarrying, & Extraction | 14 (100.0%) | 0 (0.0%) |
| Construction | 139 (100.0%) | 0 (0.0%) |
| Manufacturing | 86 (25.8%) | 248 (74.3%) |
| Wholesale Trade | 12 (100.0%) | 0 (0.0%) |
| Retail Trade | 166 (47.8%) | 181 (52.2%) |
| Transportation & Warehousing | 20 (23.3%) | 66 (76.7%) |
| Utilities | 34 (100.0%) | 0 (0.0%) |
| Information | 0 (0.0%) | 19 (100.0%) |
| Finance & Insurance | 23 (21.9%) | 82 (78.1%) |
| Real Estate, Rental & Leasing | 0 (0.0%) | 0 (0.0%) |
| Professional & Scientific | 0 (0.0%) | 0 (0.0%) |
| Enterprise Management | 0 (0.0%) | 0 (0.0%) |
| Administrative & Support | 0 (0.0%) | 15 (100.0%) |
| Educational Services | 37 (21.3%) | 137 (78.7%) |
| Health Care & Social Assistance | 62 (21.8%) | 222 (78.2%) |
| Arts, Entertainment & Recreation | 0 (0.0%) | 0 (0.0%) |
| Accommodation & Food Services | 34 (20.7%) | 130 (79.3%) |
| Public Administration | 91 (100.0%) | 0 (0.0%) |
| Total | 796 (40.1%) | 1,191 (59.9%) |
Education in La Grange
School Enrollment in La Grange
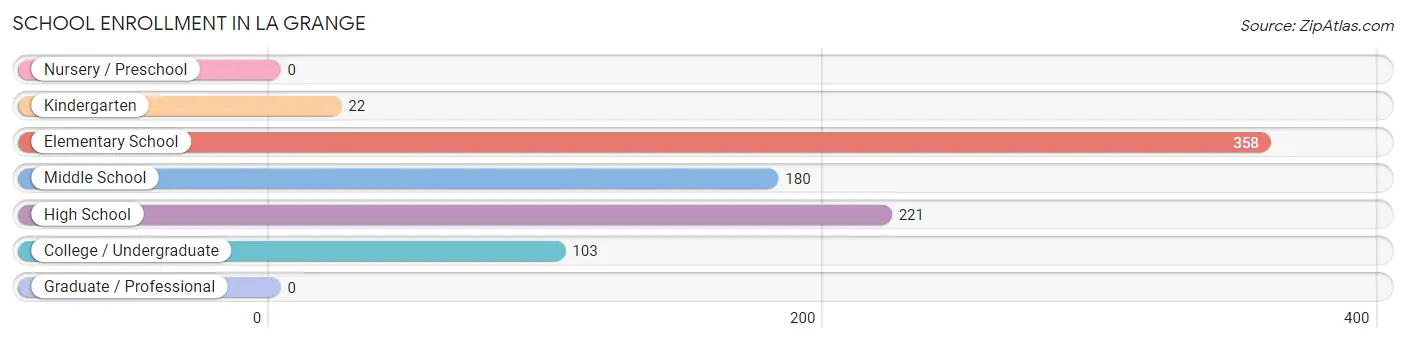
The most common levels of schooling among the 884 students in La Grange are elementary school (358 | 40.5%), high school (221 | 25.0%), and middle school (180 | 20.4%).
| School Level | # Students | % Students |
| Nursery / Preschool | 0 | 0.0% |
| Kindergarten | 22 | 2.5% |
| Elementary School | 358 | 40.5% |
| Middle School | 180 | 20.4% |
| High School | 221 | 25.0% |
| College / Undergraduate | 103 | 11.7% |
| Graduate / Professional | 0 | 0.0% |
| Total | 884 | 100.0% |
School Enrollment by Age by Funding Source in La Grange
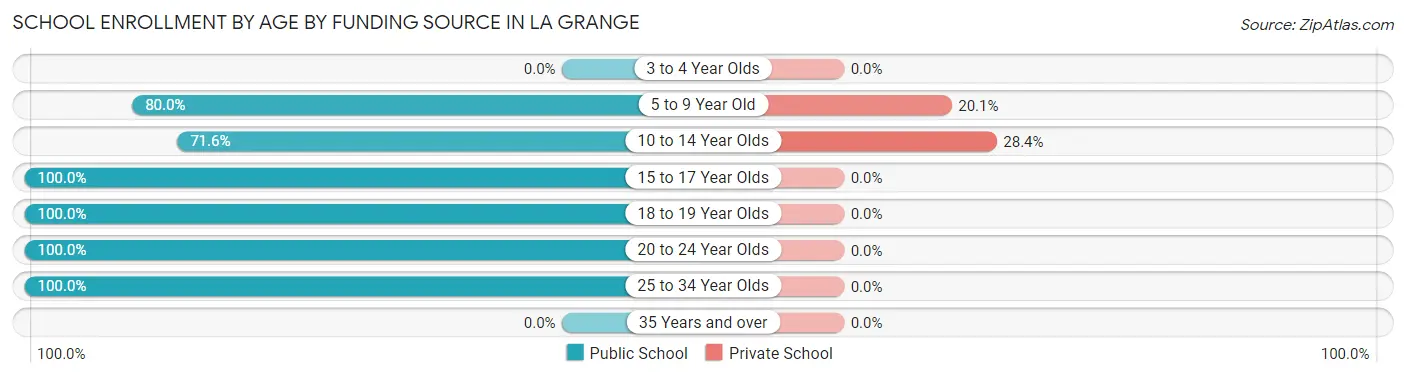
Out of a total of 884 students who are enrolled in schools in La Grange, 137 (15.5%) attend a private institution, while the remaining 747 (84.5%) are enrolled in public schools. The age group of 10 to 14 year olds has the highest likelihood of being enrolled in private schools, with 62 (28.4% in the age bracket) enrolled. Conversely, the age group of 15 to 17 year olds has the lowest likelihood of being enrolled in a private school, with 121 (100.0% in the age bracket) attending a public institution.
| Age Bracket | Public School | Private School |
| 3 to 4 Year Olds | 0 (0.0%) | 0 (0.0%) |
| 5 to 9 Year Old | 299 (79.9%) | 75 (20.1%) |
| 10 to 14 Year Olds | 156 (71.6%) | 62 (28.4%) |
| 15 to 17 Year Olds | 121 (100.0%) | 0 (0.0%) |
| 18 to 19 Year Olds | 68 (100.0%) | 0 (0.0%) |
| 20 to 24 Year Olds | 79 (100.0%) | 0 (0.0%) |
| 25 to 34 Year Olds | 24 (100.0%) | 0 (0.0%) |
| 35 Years and over | 0 (0.0%) | 0 (0.0%) |
| Total | 747 (84.5%) | 137 (15.5%) |
Educational Attainment by Field of Study in La Grange
Education (195 | 25.9%), business (181 | 24.1%), social sciences (119 | 15.8%), engineering (96 | 12.8%), and bio, nature & agricultural (40 | 5.3%) are the most common fields of study among 752 individuals in La Grange who have obtained a bachelor's degree or higher.
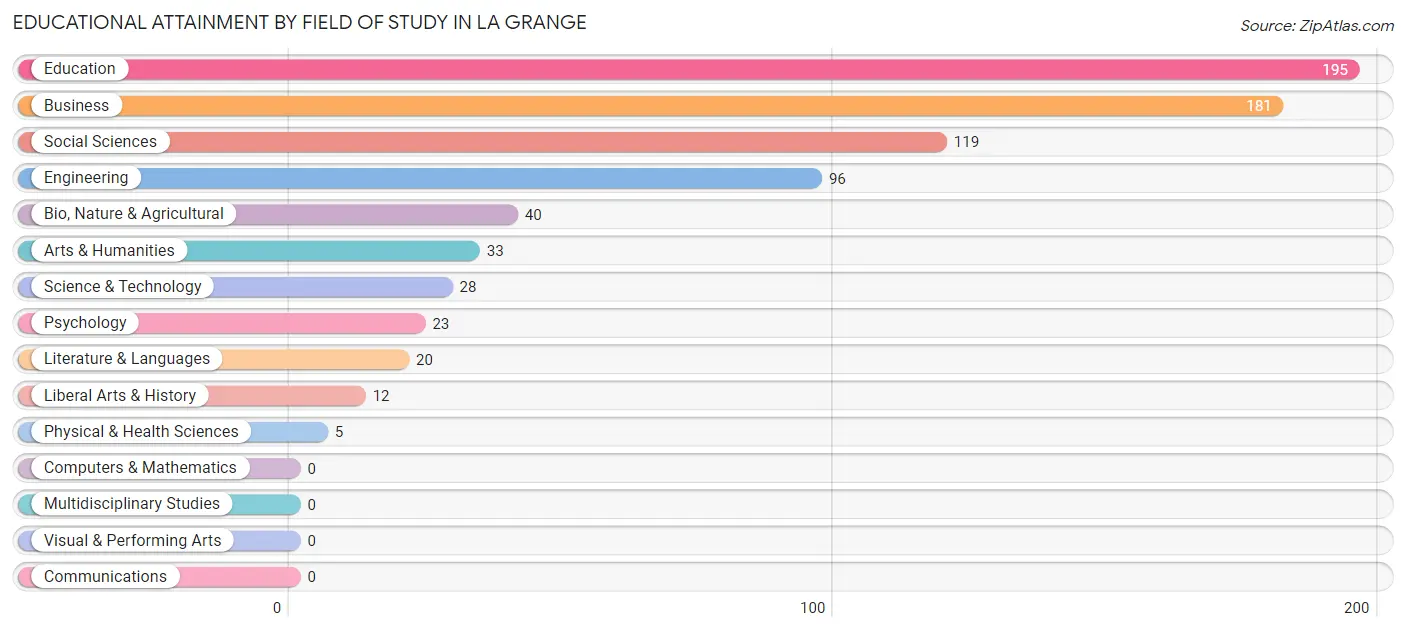
| Field of Study | # Graduates | % Graduates |
| Computers & Mathematics | 0 | 0.0% |
| Bio, Nature & Agricultural | 40 | 5.3% |
| Physical & Health Sciences | 5 | 0.7% |
| Psychology | 23 | 3.1% |
| Social Sciences | 119 | 15.8% |
| Engineering | 96 | 12.8% |
| Multidisciplinary Studies | 0 | 0.0% |
| Science & Technology | 28 | 3.7% |
| Business | 181 | 24.1% |
| Education | 195 | 25.9% |
| Literature & Languages | 20 | 2.7% |
| Liberal Arts & History | 12 | 1.6% |
| Visual & Performing Arts | 0 | 0.0% |
| Communications | 0 | 0.0% |
| Arts & Humanities | 33 | 4.4% |
| Total | 752 | 100.0% |
Transportation & Commute in La Grange
Vehicle Availability by Sex in La Grange
The most prevalent vehicle ownership categories in La Grange are males with 2 vehicles (352, accounting for 44.2%) and females with 2 vehicles (490, making up 29.5%).
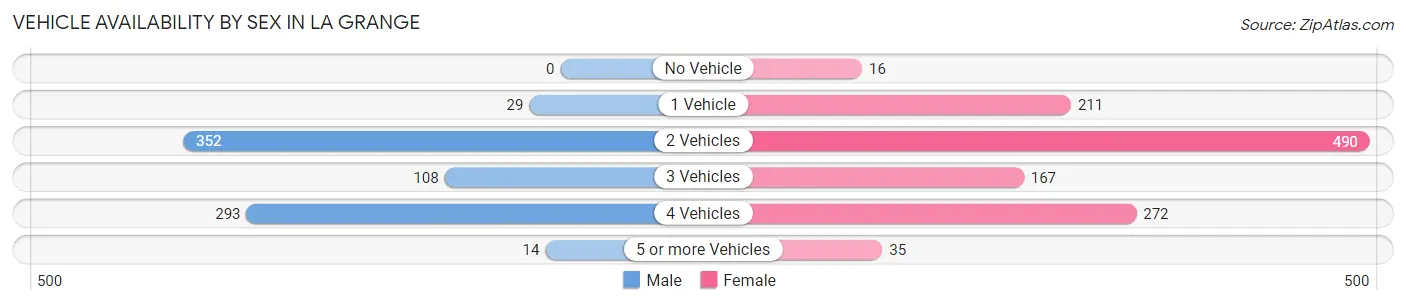
| Vehicles Available | Male | Female |
| No Vehicle | 0 (0.0%) | 16 (1.3%) |
| 1 Vehicle | 29 (3.6%) | 211 (17.7%) |
| 2 Vehicles | 352 (44.2%) | 490 (41.1%) |
| 3 Vehicles | 108 (13.6%) | 167 (14.0%) |
| 4 Vehicles | 293 (36.8%) | 272 (22.8%) |
| 5 or more Vehicles | 14 (1.8%) | 35 (2.9%) |
| Total | 796 (100.0%) | 1,191 (100.0%) |
Commute Time in La Grange
The most frequently occuring commute durations in La Grange are 10 to 14 minutes (767 commuters, 39.7%), 5 to 9 minutes (612 commuters, 31.6%), and less than 5 minutes (199 commuters, 10.3%).
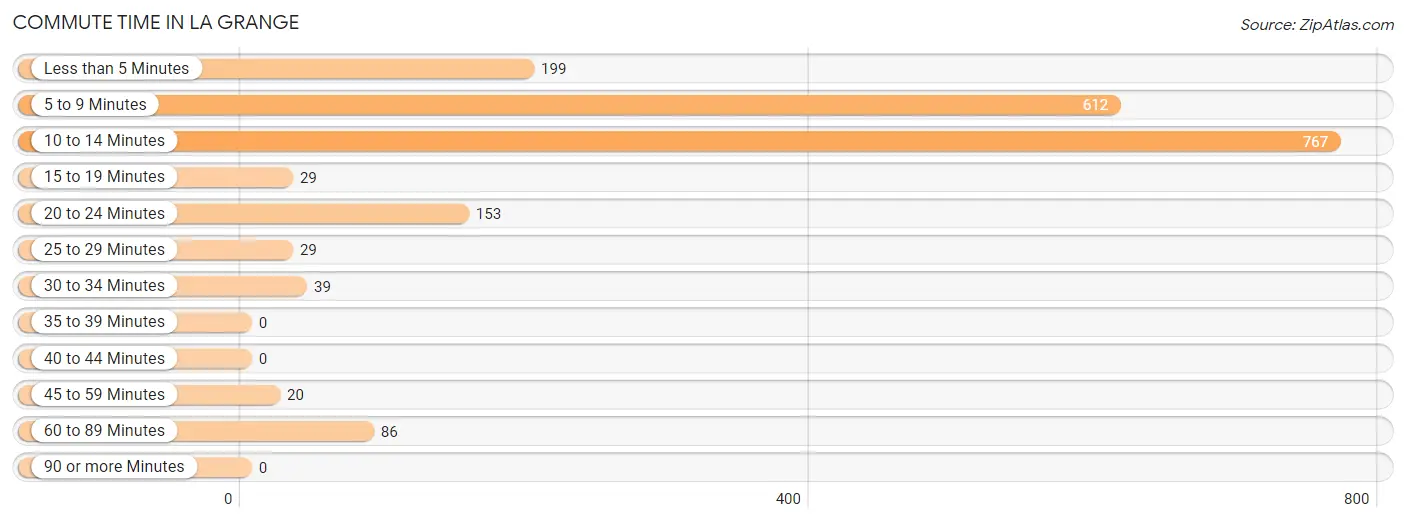
| Commute Time | # Commuters | % Commuters |
| Less than 5 Minutes | 199 | 10.3% |
| 5 to 9 Minutes | 612 | 31.6% |
| 10 to 14 Minutes | 767 | 39.7% |
| 15 to 19 Minutes | 29 | 1.5% |
| 20 to 24 Minutes | 153 | 7.9% |
| 25 to 29 Minutes | 29 | 1.5% |
| 30 to 34 Minutes | 39 | 2.0% |
| 35 to 39 Minutes | 0 | 0.0% |
| 40 to 44 Minutes | 0 | 0.0% |
| 45 to 59 Minutes | 20 | 1.0% |
| 60 to 89 Minutes | 86 | 4.4% |
| 90 or more Minutes | 0 | 0.0% |
Commute Time by Sex in La Grange
The most common commute times in La Grange are 10 to 14 minutes (320 commuters, 40.2%) for males and 10 to 14 minutes (447 commuters, 39.3%) for females.
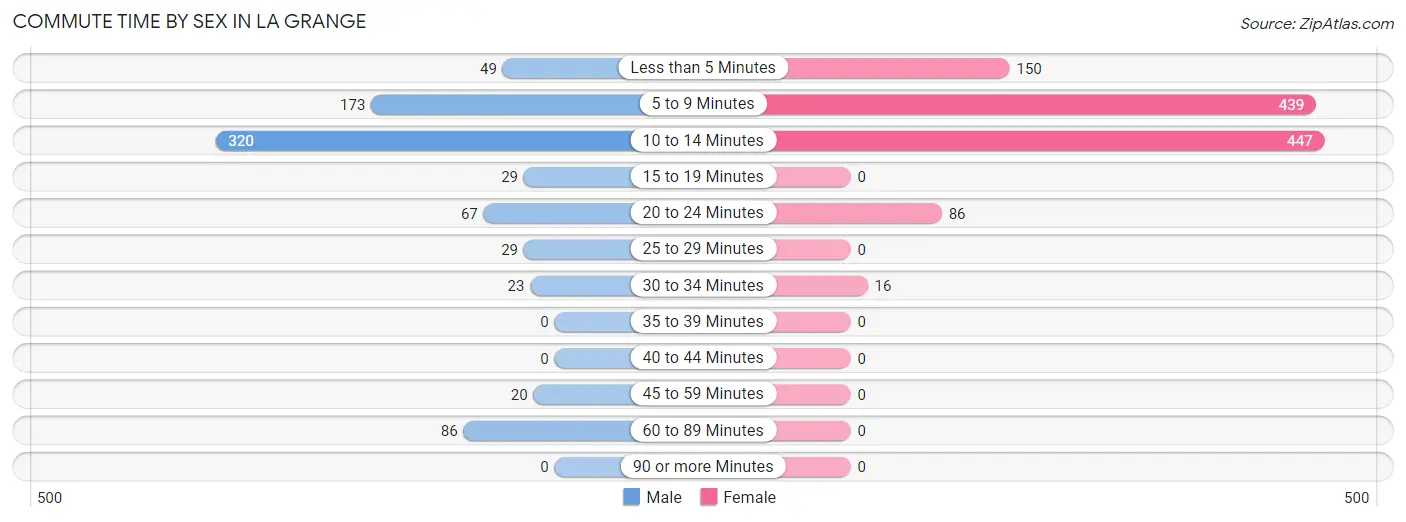
| Commute Time | Male | Female |
| Less than 5 Minutes | 49 (6.2%) | 150 (13.2%) |
| 5 to 9 Minutes | 173 (21.7%) | 439 (38.6%) |
| 10 to 14 Minutes | 320 (40.2%) | 447 (39.3%) |
| 15 to 19 Minutes | 29 (3.6%) | 0 (0.0%) |
| 20 to 24 Minutes | 67 (8.4%) | 86 (7.6%) |
| 25 to 29 Minutes | 29 (3.6%) | 0 (0.0%) |
| 30 to 34 Minutes | 23 (2.9%) | 16 (1.4%) |
| 35 to 39 Minutes | 0 (0.0%) | 0 (0.0%) |
| 40 to 44 Minutes | 0 (0.0%) | 0 (0.0%) |
| 45 to 59 Minutes | 20 (2.5%) | 0 (0.0%) |
| 60 to 89 Minutes | 86 (10.8%) | 0 (0.0%) |
| 90 or more Minutes | 0 (0.0%) | 0 (0.0%) |
Time of Departure to Work by Sex in La Grange
The most frequent times of departure to work in La Grange are 6:00 AM to 6:29 AM (161, 20.2%) for males and 7:30 AM to 7:59 AM (471, 41.4%) for females.
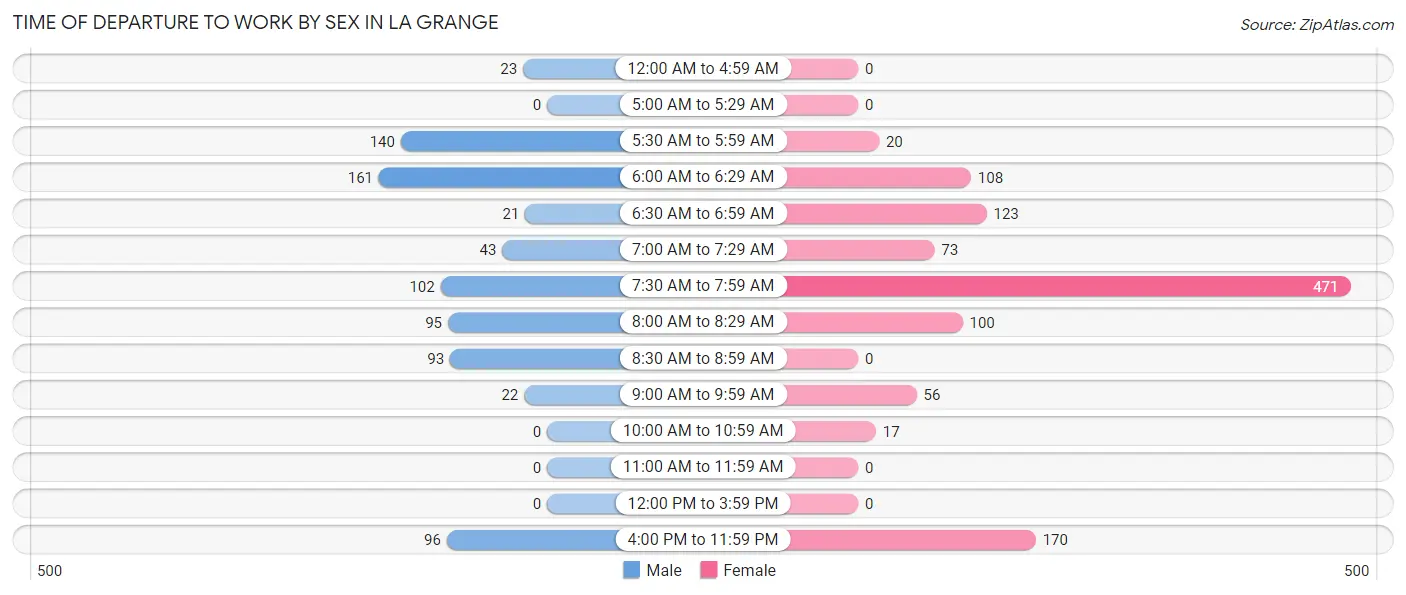
| Time of Departure | Male | Female |
| 12:00 AM to 4:59 AM | 23 (2.9%) | 0 (0.0%) |
| 5:00 AM to 5:29 AM | 0 (0.0%) | 0 (0.0%) |
| 5:30 AM to 5:59 AM | 140 (17.6%) | 20 (1.8%) |
| 6:00 AM to 6:29 AM | 161 (20.2%) | 108 (9.5%) |
| 6:30 AM to 6:59 AM | 21 (2.6%) | 123 (10.8%) |
| 7:00 AM to 7:29 AM | 43 (5.4%) | 73 (6.4%) |
| 7:30 AM to 7:59 AM | 102 (12.8%) | 471 (41.4%) |
| 8:00 AM to 8:29 AM | 95 (11.9%) | 100 (8.8%) |
| 8:30 AM to 8:59 AM | 93 (11.7%) | 0 (0.0%) |
| 9:00 AM to 9:59 AM | 22 (2.8%) | 56 (4.9%) |
| 10:00 AM to 10:59 AM | 0 (0.0%) | 17 (1.5%) |
| 11:00 AM to 11:59 AM | 0 (0.0%) | 0 (0.0%) |
| 12:00 PM to 3:59 PM | 0 (0.0%) | 0 (0.0%) |
| 4:00 PM to 11:59 PM | 96 (12.1%) | 170 (14.9%) |
| Total | 796 (100.0%) | 1,138 (100.0%) |
Housing Occupancy in La Grange
Occupancy by Ownership in La Grange
Of the total 1,740 dwellings in La Grange, owner-occupied units account for 1,032 (59.3%), while renter-occupied units make up 708 (40.7%).
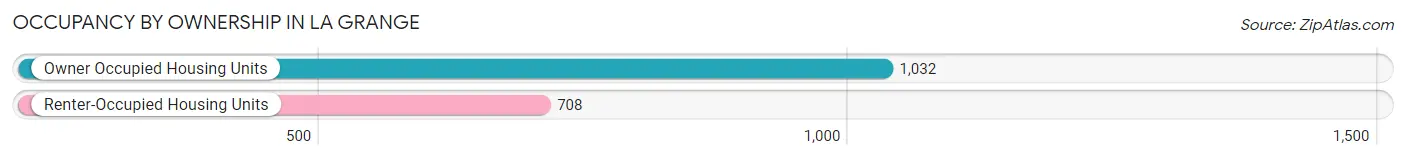
| Occupancy | # Housing Units | % Housing Units |
| Owner Occupied Housing Units | 1,032 | 59.3% |
| Renter-Occupied Housing Units | 708 | 40.7% |
| Total Occupied Housing Units | 1,740 | 100.0% |
Occupancy by Household Size in La Grange
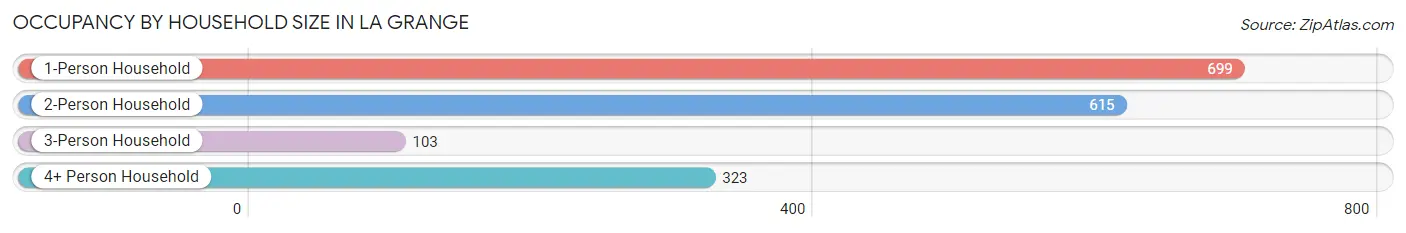
| Household Size | # Housing Units | % Housing Units |
| 1-Person Household | 699 | 40.2% |
| 2-Person Household | 615 | 35.3% |
| 3-Person Household | 103 | 5.9% |
| 4+ Person Household | 323 | 18.6% |
| Total Housing Units | 1,740 | 100.0% |
Occupancy by Ownership by Household Size in La Grange
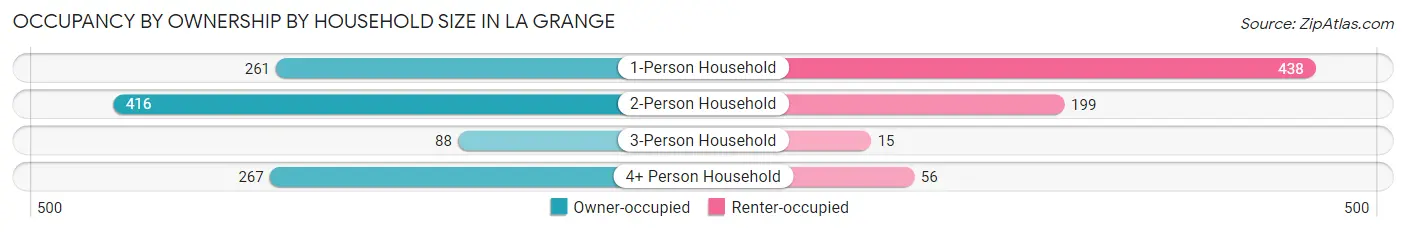
| Household Size | Owner-occupied | Renter-occupied |
| 1-Person Household | 261 (37.3%) | 438 (62.7%) |
| 2-Person Household | 416 (67.6%) | 199 (32.4%) |
| 3-Person Household | 88 (85.4%) | 15 (14.6%) |
| 4+ Person Household | 267 (82.7%) | 56 (17.3%) |
| Total Housing Units | 1,032 (59.3%) | 708 (40.7%) |
Occupancy by Educational Attainment in La Grange
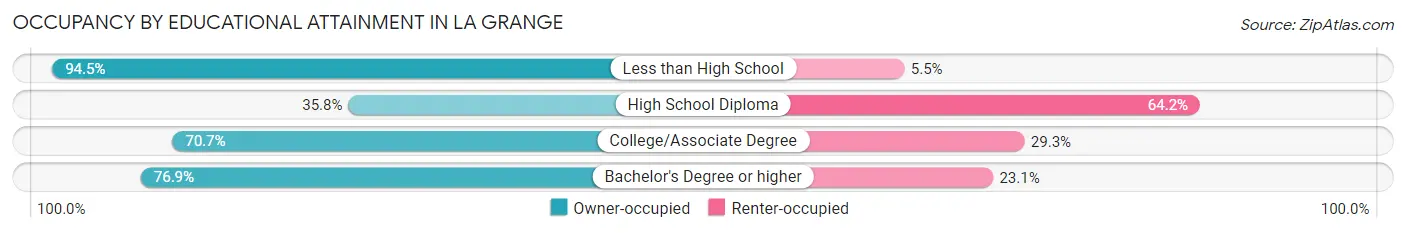
| Household Size | Owner-occupied | Renter-occupied |
| Less than High School | 138 (94.5%) | 8 (5.5%) |
| High School Diploma | 269 (35.8%) | 482 (64.2%) |
| College/Associate Degree | 268 (70.7%) | 111 (29.3%) |
| Bachelor's Degree or higher | 357 (76.9%) | 107 (23.1%) |
Occupancy by Age of Householder in La Grange
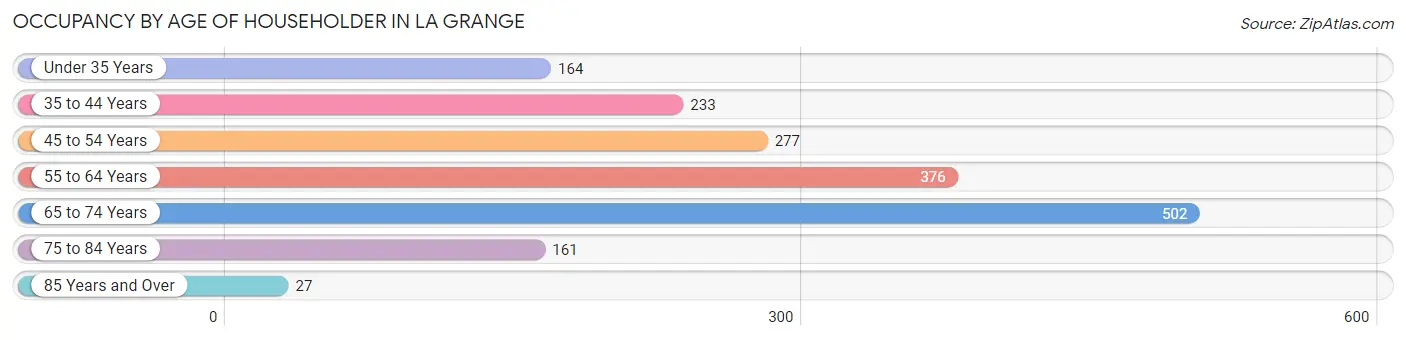
| Age Bracket | # Households | % Households |
| Under 35 Years | 164 | 9.4% |
| 35 to 44 Years | 233 | 13.4% |
| 45 to 54 Years | 277 | 15.9% |
| 55 to 64 Years | 376 | 21.6% |
| 65 to 74 Years | 502 | 28.8% |
| 75 to 84 Years | 161 | 9.2% |
| 85 Years and Over | 27 | 1.5% |
| Total | 1,740 | 100.0% |
Housing Finances in La Grange
Median Income by Occupancy in La Grange
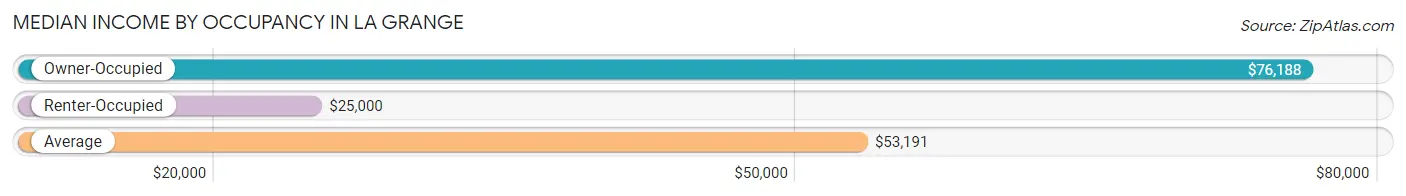
| Occupancy Type | # Households | Median Income |
| Owner-Occupied | 1,032 (59.3%) | $76,188 |
| Renter-Occupied | 708 (40.7%) | $25,000 |
| Average | 1,740 (100.0%) | $53,191 |
Occupancy by Householder Income Bracket in La Grange
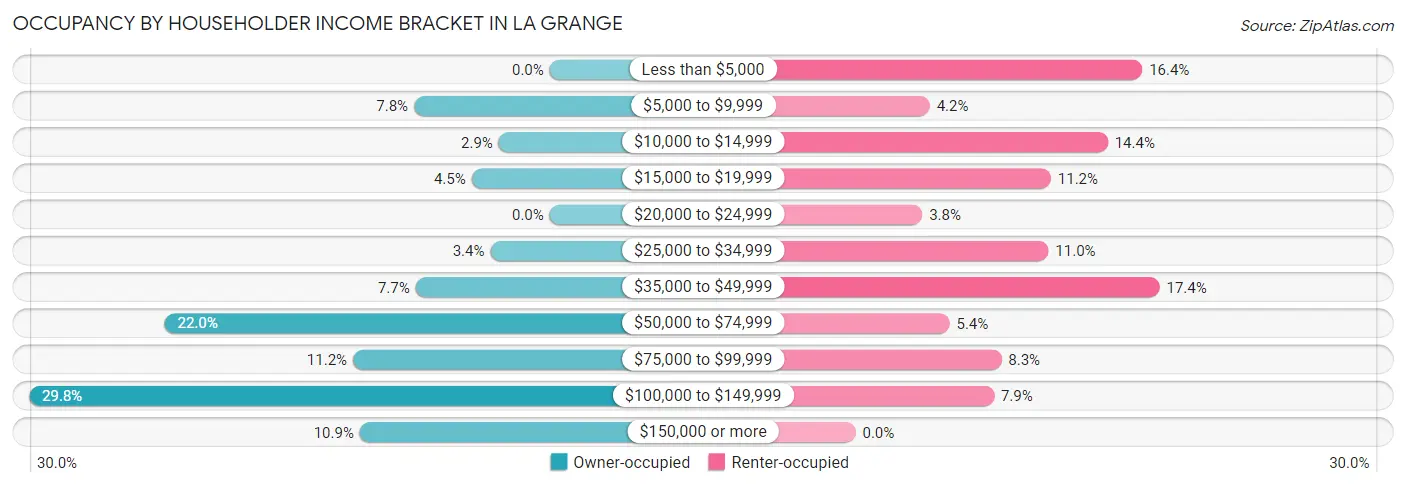
| Income Bracket | Owner-occupied | Renter-occupied |
| Less than $5,000 | 0 (0.0%) | 116 (16.4%) |
| $5,000 to $9,999 | 80 (7.7%) | 30 (4.2%) |
| $10,000 to $14,999 | 30 (2.9%) | 102 (14.4%) |
| $15,000 to $19,999 | 46 (4.5%) | 79 (11.2%) |
| $20,000 to $24,999 | 0 (0.0%) | 27 (3.8%) |
| $25,000 to $34,999 | 35 (3.4%) | 78 (11.0%) |
| $35,000 to $49,999 | 79 (7.7%) | 123 (17.4%) |
| $50,000 to $74,999 | 227 (22.0%) | 38 (5.4%) |
| $75,000 to $99,999 | 116 (11.2%) | 59 (8.3%) |
| $100,000 to $149,999 | 307 (29.7%) | 56 (7.9%) |
| $150,000 or more | 112 (10.8%) | 0 (0.0%) |
| Total | 1,032 (100.0%) | 708 (100.0%) |
Monthly Housing Cost Tiers in La Grange
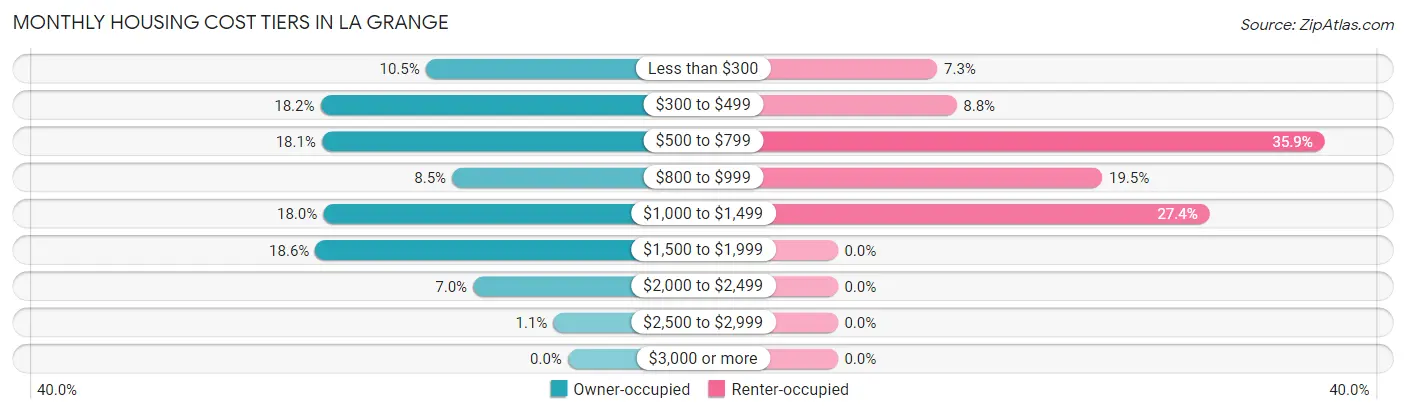
| Monthly Cost | Owner-occupied | Renter-occupied |
| Less than $300 | 108 (10.5%) | 52 (7.3%) |
| $300 to $499 | 188 (18.2%) | 62 (8.8%) |
| $500 to $799 | 187 (18.1%) | 254 (35.9%) |
| $800 to $999 | 88 (8.5%) | 138 (19.5%) |
| $1,000 to $1,499 | 186 (18.0%) | 194 (27.4%) |
| $1,500 to $1,999 | 192 (18.6%) | 0 (0.0%) |
| $2,000 to $2,499 | 72 (7.0%) | 0 (0.0%) |
| $2,500 to $2,999 | 11 (1.1%) | 0 (0.0%) |
| $3,000 or more | 0 (0.0%) | 0 (0.0%) |
| Total | 1,032 (100.0%) | 708 (100.0%) |
Physical Housing Characteristics in La Grange
Housing Structures in La Grange
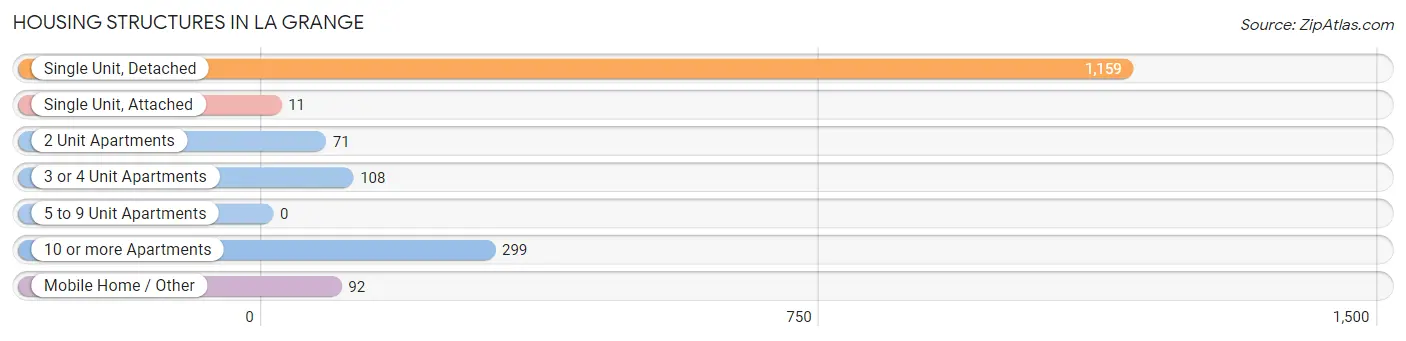
| Structure Type | # Housing Units | % Housing Units |
| Single Unit, Detached | 1,159 | 66.6% |
| Single Unit, Attached | 11 | 0.6% |
| 2 Unit Apartments | 71 | 4.1% |
| 3 or 4 Unit Apartments | 108 | 6.2% |
| 5 to 9 Unit Apartments | 0 | 0.0% |
| 10 or more Apartments | 299 | 17.2% |
| Mobile Home / Other | 92 | 5.3% |
| Total | 1,740 | 100.0% |
Housing Structures by Occupancy in La Grange
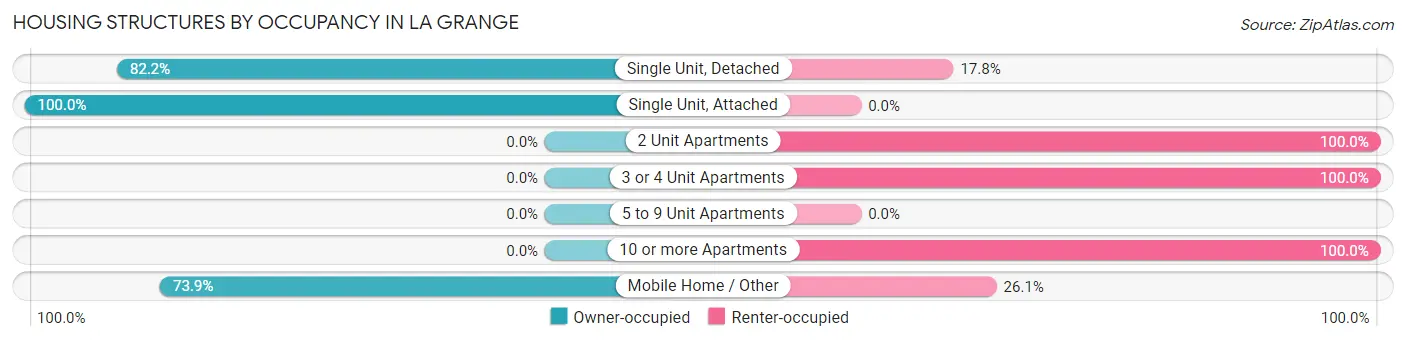
| Structure Type | Owner-occupied | Renter-occupied |
| Single Unit, Detached | 953 (82.2%) | 206 (17.8%) |
| Single Unit, Attached | 11 (100.0%) | 0 (0.0%) |
| 2 Unit Apartments | 0 (0.0%) | 71 (100.0%) |
| 3 or 4 Unit Apartments | 0 (0.0%) | 108 (100.0%) |
| 5 to 9 Unit Apartments | 0 (0.0%) | 0 (0.0%) |
| 10 or more Apartments | 0 (0.0%) | 299 (100.0%) |
| Mobile Home / Other | 68 (73.9%) | 24 (26.1%) |
| Total | 1,032 (59.3%) | 708 (40.7%) |
Housing Structures by Number of Rooms in La Grange
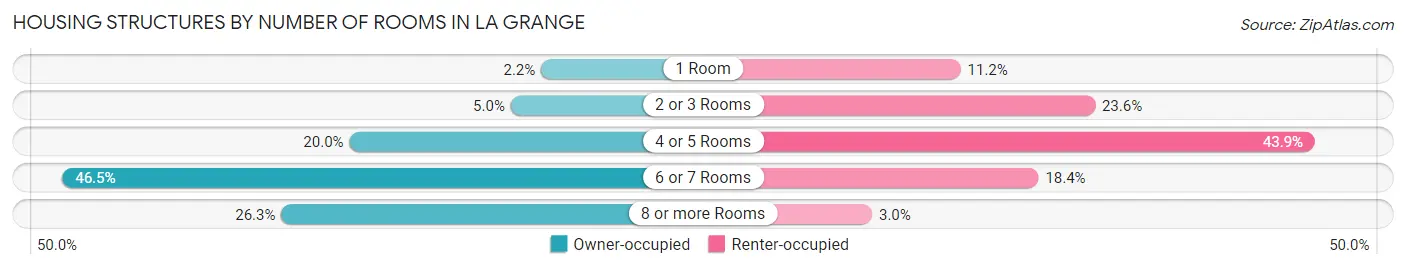
| Number of Rooms | Owner-occupied | Renter-occupied |
| 1 Room | 23 (2.2%) | 79 (11.2%) |
| 2 or 3 Rooms | 52 (5.0%) | 167 (23.6%) |
| 4 or 5 Rooms | 206 (20.0%) | 311 (43.9%) |
| 6 or 7 Rooms | 480 (46.5%) | 130 (18.4%) |
| 8 or more Rooms | 271 (26.3%) | 21 (3.0%) |
| Total | 1,032 (100.0%) | 708 (100.0%) |
Housing Structure by Heating Type in La Grange
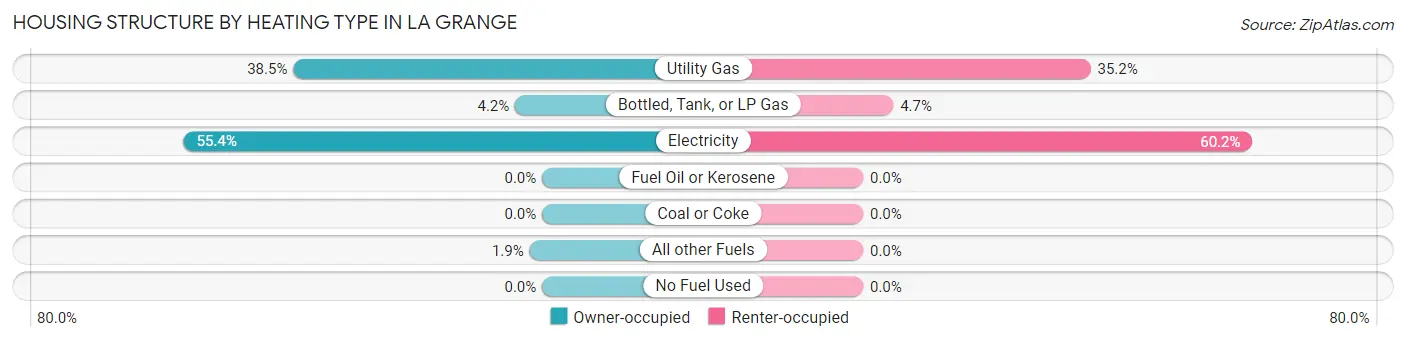
| Heating Type | Owner-occupied | Renter-occupied |
| Utility Gas | 397 (38.5%) | 249 (35.2%) |
| Bottled, Tank, or LP Gas | 43 (4.2%) | 33 (4.7%) |
| Electricity | 572 (55.4%) | 426 (60.2%) |
| Fuel Oil or Kerosene | 0 (0.0%) | 0 (0.0%) |
| Coal or Coke | 0 (0.0%) | 0 (0.0%) |
| All other Fuels | 20 (1.9%) | 0 (0.0%) |
| No Fuel Used | 0 (0.0%) | 0 (0.0%) |
| Total | 1,032 (100.0%) | 708 (100.0%) |
Household Vehicle Usage in La Grange
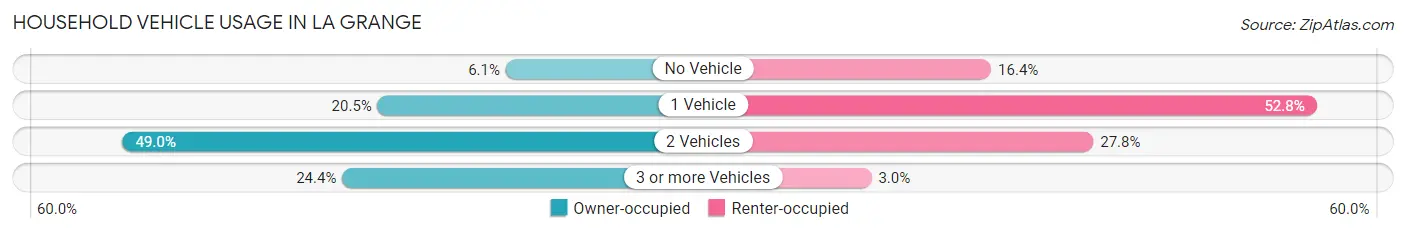
| Vehicles per Household | Owner-occupied | Renter-occupied |
| No Vehicle | 63 (6.1%) | 116 (16.4%) |
| 1 Vehicle | 211 (20.4%) | 374 (52.8%) |
| 2 Vehicles | 506 (49.0%) | 197 (27.8%) |
| 3 or more Vehicles | 252 (24.4%) | 21 (3.0%) |
| Total | 1,032 (100.0%) | 708 (100.0%) |
Real Estate & Mortgages in La Grange
Real Estate and Mortgage Overview in La Grange
| Characteristic | Without Mortgage | With Mortgage |
| Housing Units | 616 | 416 |
| Median Property Value | $200,000 | $311,800 |
| Median Household Income | $81,829 | $8 |
| Monthly Housing Costs | $520 | $0 |
| Real Estate Taxes | $2,634 | $0 |
Property Value by Mortgage Status in La Grange
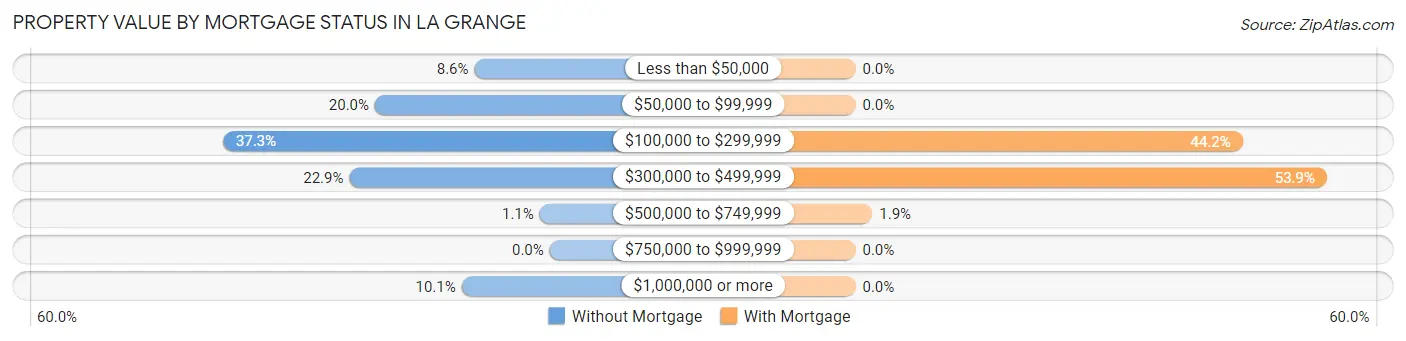
| Property Value | Without Mortgage | With Mortgage |
| Less than $50,000 | 53 (8.6%) | 0 (0.0%) |
| $50,000 to $99,999 | 123 (20.0%) | 0 (0.0%) |
| $100,000 to $299,999 | 230 (37.3%) | 184 (44.2%) |
| $300,000 to $499,999 | 141 (22.9%) | 224 (53.8%) |
| $500,000 to $749,999 | 7 (1.1%) | 8 (1.9%) |
| $750,000 to $999,999 | 0 (0.0%) | 0 (0.0%) |
| $1,000,000 or more | 62 (10.1%) | 0 (0.0%) |
| Total | 616 (100.0%) | 416 (100.0%) |
Household Income by Mortgage Status in La Grange
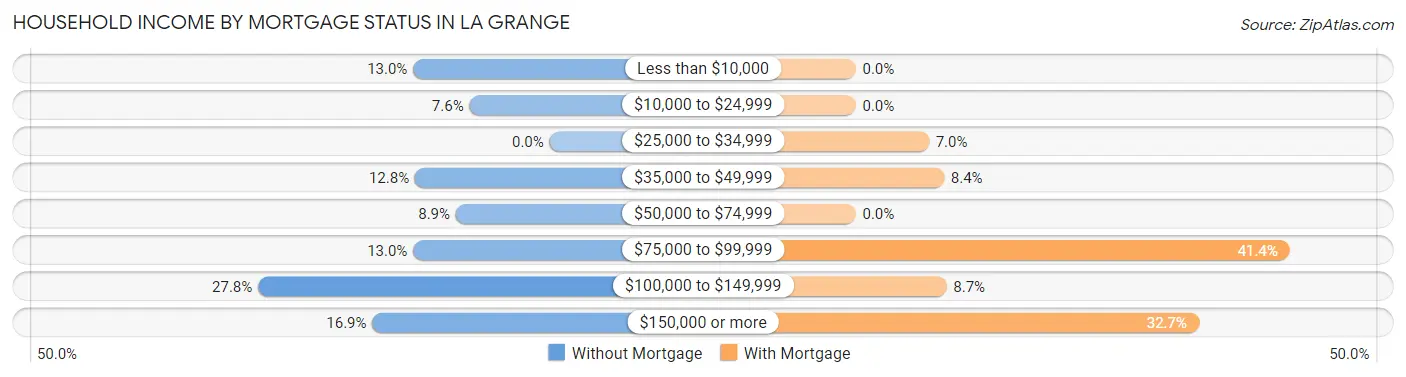
| Household Income | Without Mortgage | With Mortgage |
| Less than $10,000 | 80 (13.0%) | 0 (0.0%) |
| $10,000 to $24,999 | 47 (7.6%) | 0 (0.0%) |
| $25,000 to $34,999 | 0 (0.0%) | 29 (7.0%) |
| $35,000 to $49,999 | 79 (12.8%) | 35 (8.4%) |
| $50,000 to $74,999 | 55 (8.9%) | 0 (0.0%) |
| $75,000 to $99,999 | 80 (13.0%) | 172 (41.3%) |
| $100,000 to $149,999 | 171 (27.8%) | 36 (8.6%) |
| $150,000 or more | 104 (16.9%) | 136 (32.7%) |
| Total | 616 (100.0%) | 416 (100.0%) |
Property Value to Household Income Ratio in La Grange
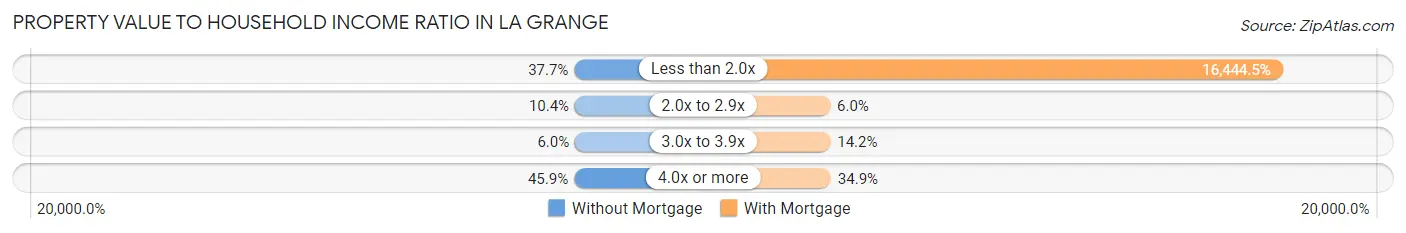
| Value-to-Income Ratio | Without Mortgage | With Mortgage |
| Less than 2.0x | 232 (37.7%) | 68,409 (16,444.5%) |
| 2.0x to 2.9x | 64 (10.4%) | 25 (6.0%) |
| 3.0x to 3.9x | 37 (6.0%) | 59 (14.2%) |
| 4.0x or more | 283 (45.9%) | 145 (34.9%) |
| Total | 616 (100.0%) | 416 (100.0%) |
Real Estate Taxes by Mortgage Status in La Grange
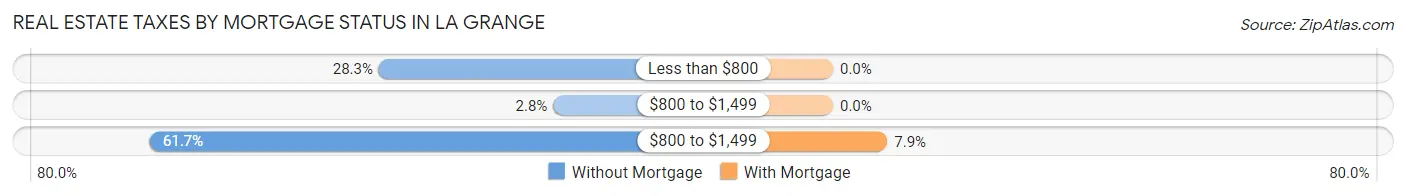
| Property Taxes | Without Mortgage | With Mortgage |
| Less than $800 | 174 (28.2%) | 0 (0.0%) |
| $800 to $1,499 | 17 (2.8%) | 0 (0.0%) |
| $800 to $1,499 | 380 (61.7%) | 33 (7.9%) |
| Total | 616 (100.0%) | 416 (100.0%) |
Health & Disability in La Grange
Health Insurance Coverage by Age in La Grange
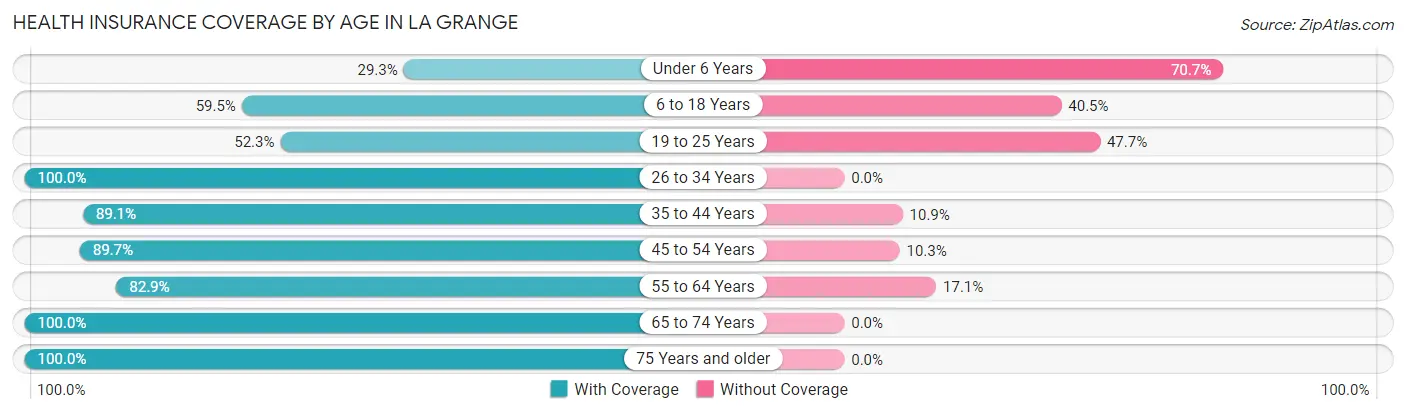
| Age Bracket | With Coverage | Without Coverage |
| Under 6 Years | 76 (29.3%) | 183 (70.7%) |
| 6 to 18 Years | 491 (59.5%) | 334 (40.5%) |
| 19 to 25 Years | 79 (52.3%) | 72 (47.7%) |
| 26 to 34 Years | 446 (100.0%) | 0 (0.0%) |
| 35 to 44 Years | 451 (89.1%) | 55 (10.9%) |
| 45 to 54 Years | 575 (89.7%) | 66 (10.3%) |
| 55 to 64 Years | 547 (82.9%) | 113 (17.1%) |
| 65 to 74 Years | 555 (100.0%) | 0 (0.0%) |
| 75 Years and older | 287 (100.0%) | 0 (0.0%) |
| Total | 3,507 (81.0%) | 823 (19.0%) |
Health Insurance Coverage by Citizenship Status in La Grange
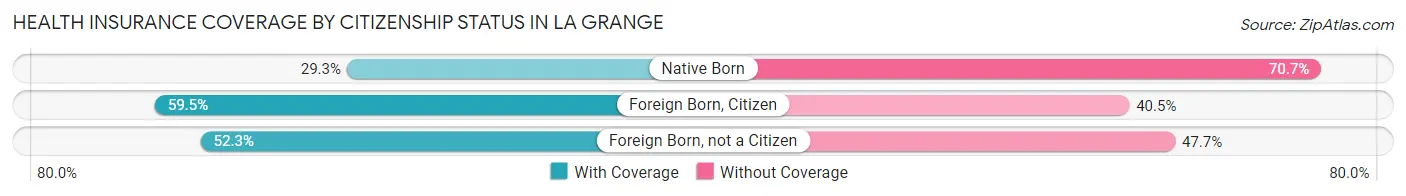
| Citizenship Status | With Coverage | Without Coverage |
| Native Born | 76 (29.3%) | 183 (70.7%) |
| Foreign Born, Citizen | 491 (59.5%) | 334 (40.5%) |
| Foreign Born, not a Citizen | 79 (52.3%) | 72 (47.7%) |
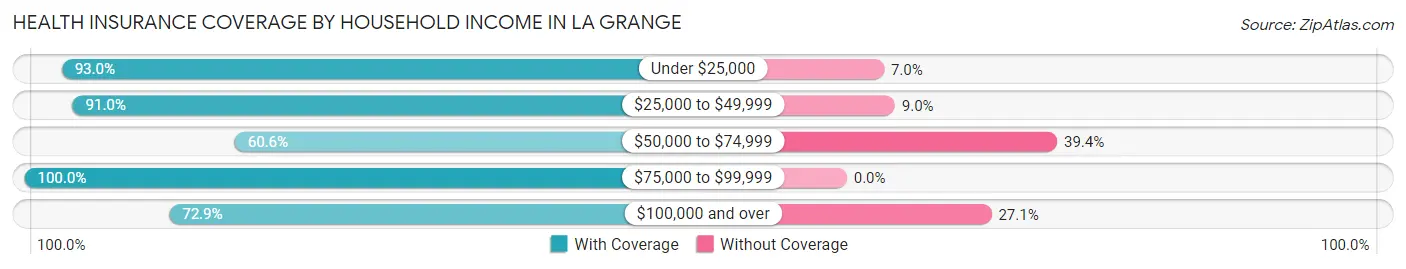
Health Insurance Coverage by Household Income in La Grange
| Household Income | With Coverage | Without Coverage |
| Under $25,000 | 708 (93.0%) | 53 (7.0%) |
| $25,000 to $49,999 | 384 (91.0%) | 38 (9.0%) |
| $50,000 to $74,999 | 440 (60.6%) | 286 (39.4%) |
| $75,000 to $99,999 | 739 (100.0%) | 0 (0.0%) |
| $100,000 and over | 1,199 (72.9%) | 446 (27.1%) |
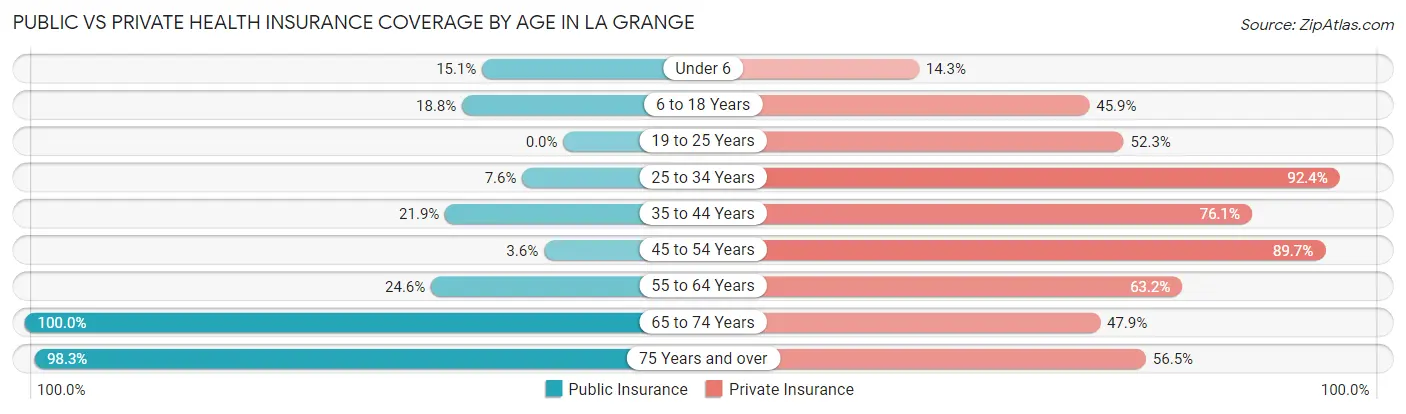
Public vs Private Health Insurance Coverage by Age in La Grange
| Age Bracket | Public Insurance | Private Insurance |
| Under 6 | 39 (15.1%) | 37 (14.3%) |
| 6 to 18 Years | 155 (18.8%) | 379 (45.9%) |
| 19 to 25 Years | 0 (0.0%) | 79 (52.3%) |
| 25 to 34 Years | 34 (7.6%) | 412 (92.4%) |
| 35 to 44 Years | 111 (21.9%) | 385 (76.1%) |
| 45 to 54 Years | 23 (3.6%) | 575 (89.7%) |
| 55 to 64 Years | 162 (24.5%) | 417 (63.2%) |
| 65 to 74 Years | 555 (100.0%) | 266 (47.9%) |
| 75 Years and over | 282 (98.3%) | 162 (56.5%) |
| Total | 1,361 (31.4%) | 2,712 (62.6%) |
Disability Status by Sex by Age in La Grange
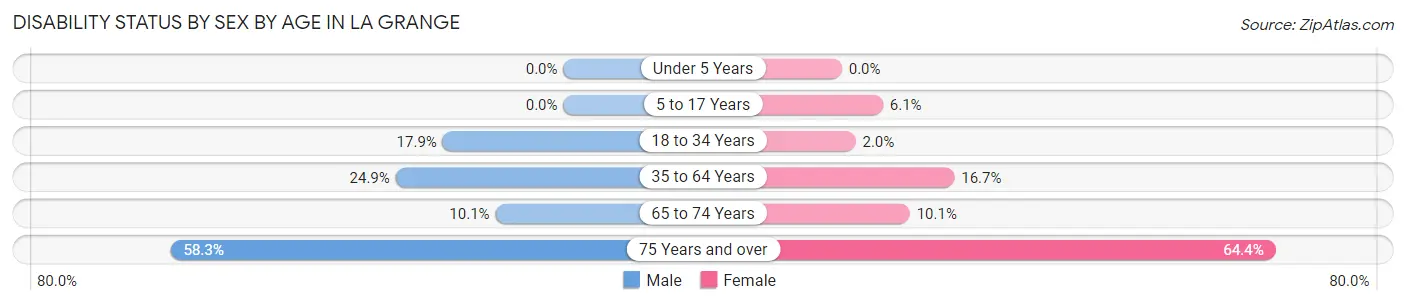
| Age Bracket | Male | Female |
| Under 5 Years | 0 (0.0%) | 0 (0.0%) |
| 5 to 17 Years | 0 (0.0%) | 26 (6.1%) |
| 18 to 34 Years | 43 (17.9%) | 10 (2.0%) |
| 35 to 64 Years | 210 (24.9%) | 161 (16.7%) |
| 65 to 74 Years | 22 (10.1%) | 34 (10.1%) |
| 75 Years and over | 56 (58.3%) | 123 (64.4%) |
Disability Class by Sex by Age in La Grange
Disability Class: Hearing Difficulty
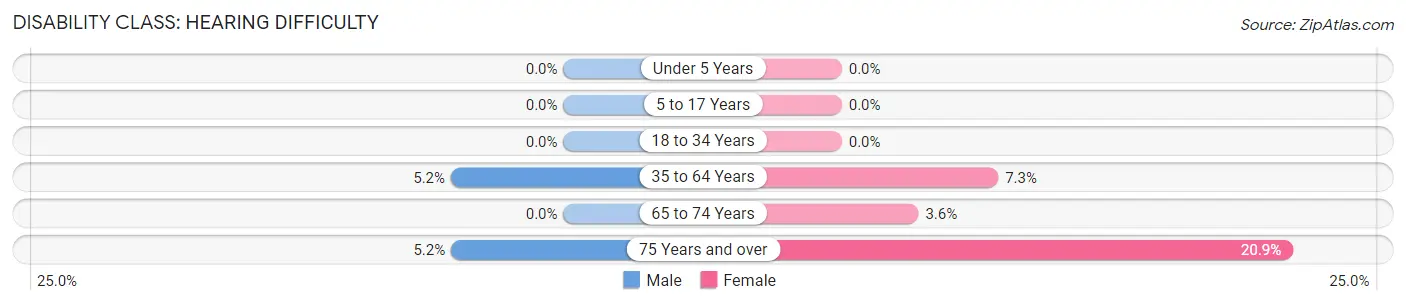
| Age Bracket | Male | Female |
| Under 5 Years | 0 (0.0%) | 0 (0.0%) |
| 5 to 17 Years | 0 (0.0%) | 0 (0.0%) |
| 18 to 34 Years | 0 (0.0%) | 0 (0.0%) |
| 35 to 64 Years | 44 (5.2%) | 70 (7.3%) |
| 65 to 74 Years | 0 (0.0%) | 12 (3.6%) |
| 75 Years and over | 5 (5.2%) | 40 (20.9%) |
Disability Class: Vision Difficulty
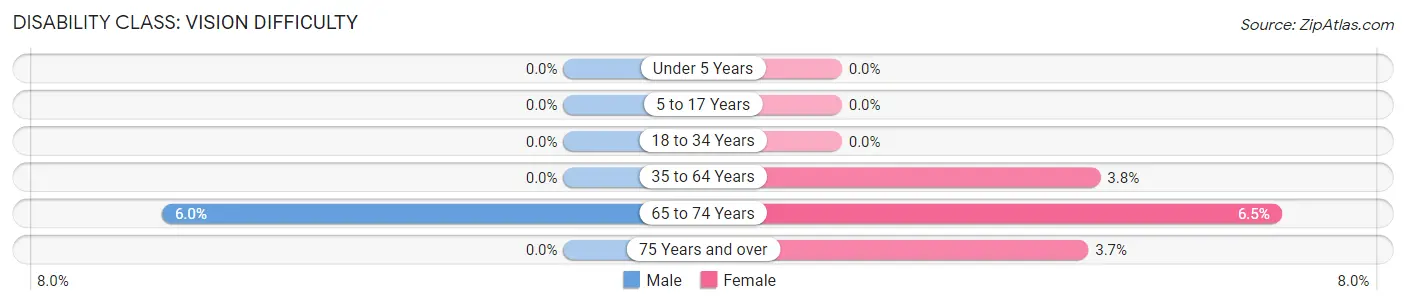
| Age Bracket | Male | Female |
| Under 5 Years | 0 (0.0%) | 0 (0.0%) |
| 5 to 17 Years | 0 (0.0%) | 0 (0.0%) |
| 18 to 34 Years | 0 (0.0%) | 0 (0.0%) |
| 35 to 64 Years | 0 (0.0%) | 37 (3.8%) |
| 65 to 74 Years | 13 (6.0%) | 22 (6.5%) |
| 75 Years and over | 0 (0.0%) | 7 (3.7%) |
Disability Class: Cognitive Difficulty
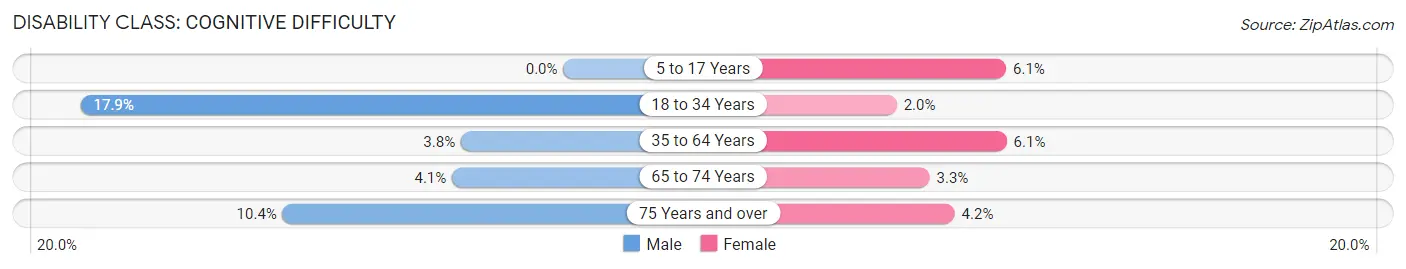
| Age Bracket | Male | Female |
| 5 to 17 Years | 0 (0.0%) | 26 (6.1%) |
| 18 to 34 Years | 43 (17.9%) | 10 (2.0%) |
| 35 to 64 Years | 32 (3.8%) | 59 (6.1%) |
| 65 to 74 Years | 9 (4.1%) | 11 (3.3%) |
| 75 Years and over | 10 (10.4%) | 8 (4.2%) |
Disability Class: Ambulatory Difficulty
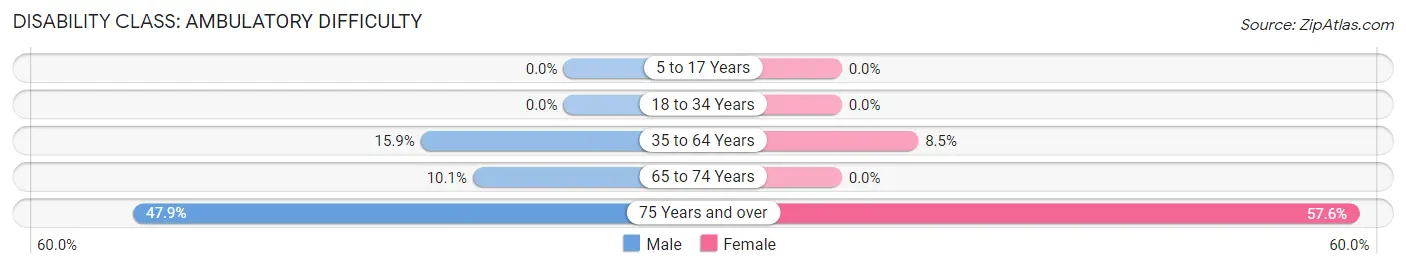
| Age Bracket | Male | Female |
| 5 to 17 Years | 0 (0.0%) | 0 (0.0%) |
| 18 to 34 Years | 0 (0.0%) | 0 (0.0%) |
| 35 to 64 Years | 134 (15.9%) | 82 (8.5%) |
| 65 to 74 Years | 22 (10.1%) | 0 (0.0%) |
| 75 Years and over | 46 (47.9%) | 110 (57.6%) |
Disability Class: Self-Care Difficulty
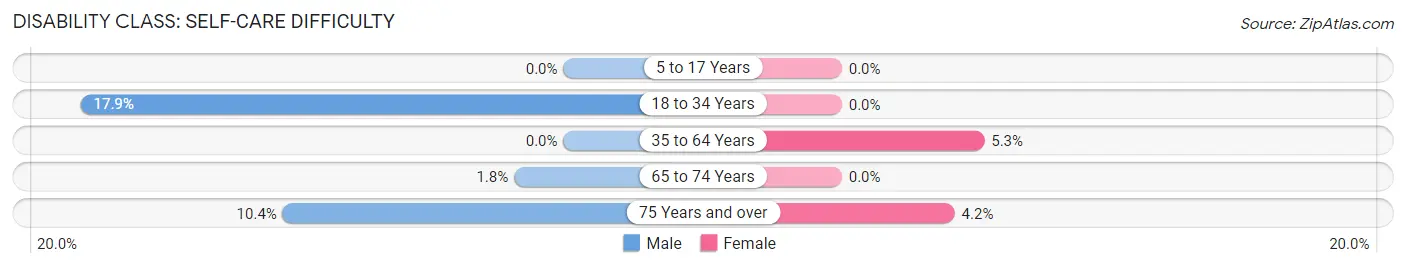
| Age Bracket | Male | Female |
| 5 to 17 Years | 0 (0.0%) | 0 (0.0%) |
| 18 to 34 Years | 43 (17.9%) | 0 (0.0%) |
| 35 to 64 Years | 0 (0.0%) | 51 (5.3%) |
| 65 to 74 Years | 4 (1.8%) | 0 (0.0%) |
| 75 Years and over | 10 (10.4%) | 8 (4.2%) |
Technology Access in La Grange
Computing Device Access in La Grange
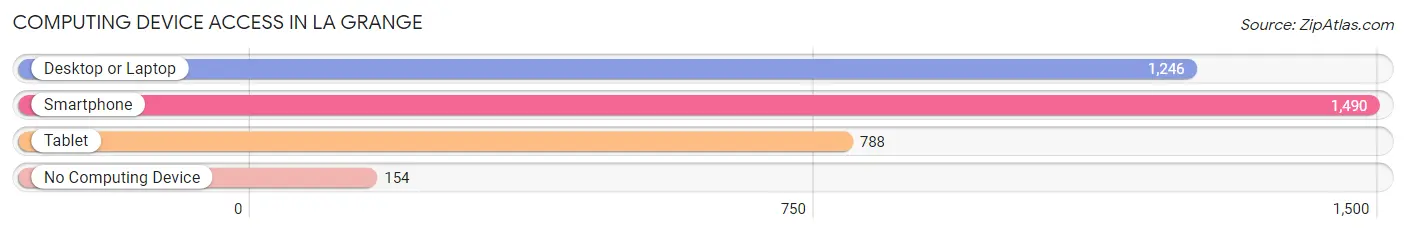
| Device Type | # Households | % Households |
| Desktop or Laptop | 1,246 | 71.6% |
| Smartphone | 1,490 | 85.6% |
| Tablet | 788 | 45.3% |
| No Computing Device | 154 | 8.8% |
| Total | 1,740 | 100.0% |
Internet Access in La Grange
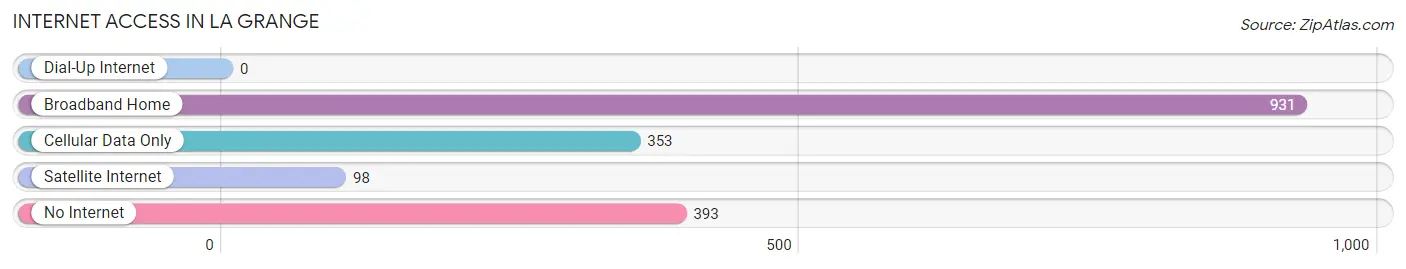
| Internet Type | # Households | % Households |
| Dial-Up Internet | 0 | 0.0% |
| Broadband Home | 931 | 53.5% |
| Cellular Data Only | 353 | 20.3% |
| Satellite Internet | 98 | 5.6% |
| No Internet | 393 | 22.6% |
| Total | 1,740 | 100.0% |
La Grange Summary
La Grange is a city located in Fayette County, Texas, United States. It is the county seat of Fayette County and is located about halfway between Houston and Austin. The population was 4,641 at the 2010 census, up from 3,247 at the 2000 census. La Grange is known for its German heritage, and is home to many historic buildings, including the Fayette County Courthouse, the Fayette County Jail, and the La Grange Opera House.
History
The area around La Grange was first settled in the early 1830s by German and Czech immigrants. The town was founded in 1837 and named after the French estate of the Marquis de Lafayette. The town was incorporated in 1837 and the first post office was established in 1838.
In the late 19th century, La Grange was a major center of German immigration to Texas. The town was home to several German-language newspapers, including the Texas Volksblatt and the La Grange Zeitung. The town was also home to several German-language schools, churches, and businesses.
Geography
La Grange is located in central Fayette County at 29°55′25″N 96°54′17″W (29.923750, -96.904722). It is situated on the Colorado River, which forms the county's northern boundary. U.S. Route 77 passes through the center of town, leading north 25 miles (40 km) to Giddings and south 28 miles (45 km) to Schulenburg. Texas State Highway 71 passes through the east side of La Grange, leading east 28 miles (45 km) to Smithville and west 28 miles (45 km) to Round Top.
Economy
The economy of La Grange is largely based on agriculture and tourism. The town is home to several large farms, including the historic Fayette County Farm, which produces cotton, corn, and hay. The town is also home to several wineries, including the award-winning Becker Vineyards.
Tourism is an important part of the local economy. La Grange is home to several historic sites, including the Fayette County Courthouse, the Fayette County Jail, and the La Grange Opera House. The town is also home to several festivals, including the annual La Grange Music Festival and the La Grange Art Festival.
Demographics
As of the 2010 census, there were 4,641 people, 1,845 households, and 1,179 families residing in the city. The population density was 1,092.3 people per square mile (422.2/km2). There were 2,072 housing units at an average density of 488.3 per square mile (188.7/km2). The racial makeup of the city was 79.2% White, 11.3% African American, 0.4% Native American, 0.4% Asian, 6.2% from other races, and 2.5% from two or more races. Hispanic or Latino of any race were 18.2% of the population.
There were 1,845 households, out of which 28.2% had children under the age of 18 living with them, 44.2% were married couples living together, 14.3% had a female householder with no husband present, and 36.2% were non-families. 32.2% of all households were made up of individuals, and 16.2% had someone living alone who was 65 years of age or older. The average household size was 2.41 and the average family size was 3.04.
In the city, the population was spread out, with 24.7% under the age of 18, 8.2% from 18 to 24, 24.3% from 25 to 44, 22.3% from 45 to 64, and 20.5% who were 65 years of age or older. The median age was 39 years. For every 100 females, there were 87.2 males. For every 100 females age 18 and over, there were 82.3 males.
The median income for a household in the city was $30,938, and the median income for a family was $37,917. Males had a median income of $30,000 versus $20,938 for females. The per capita income for the city was $17,845. About 13.2% of families and 16.2% of the population were below the poverty line, including 22.2% of those under age 18 and 14.2% of those age 65 or over.
Common Questions
What is Per Capita Income in La Grange?
Per Capita income in La Grange is $27,687.
What is the Median Family Income in La Grange?
Median Family Income in La Grange is $81,220.
What is the Median Household income in La Grange?
Median Household Income in La Grange is $53,191.
What is Income or Wage Gap in La Grange?
Income or Wage Gap in La Grange is 27.7%.
Women in La Grange earn 72.3 cents for every dollar earned by a man.
What is Inequality or Gini Index in La Grange?
Inequality or Gini Index in La Grange is 0.46.
What is the Total Population of La Grange?
Total Population of La Grange is 4,416.
What is the Total Male Population of La Grange?
Total Male Population of La Grange is 1,893.
What is the Total Female Population of La Grange?
Total Female Population of La Grange is 2,523.
What is the Ratio of Males per 100 Females in La Grange?
There are 75.03 Males per 100 Females in La Grange.
What is the Ratio of Females per 100 Males in La Grange?
There are 133.28 Females per 100 Males in La Grange.
What is the Median Population Age in La Grange?
Median Population Age in La Grange is 45.1 Years.
What is the Average Family Size in La Grange
Average Family Size in La Grange is 3.6 People.
What is the Average Household Size in La Grange
Average Household Size in La Grange is 2.5 People.
How Large is the Labor Force in La Grange?
There are 2,132 People in the Labor Forcein in La Grange.
What is the Percentage of People in the Labor Force in La Grange?
60.2% of People are in the Labor Force in La Grange.
What is the Unemployment Rate in La Grange?
Unemployment Rate in La Grange is 6.8%.