Ricardo, TX Map & Demographics
Ricardo Map
Ricardo Overview
$22,474
PER CAPITA INCOME
$60,962
AVG FAMILY INCOME
$61,282
AVG HOUSEHOLD INCOME
0.45
INEQUALITY / GINI INDEX
819
TOTAL POPULATION
235
MALE POPULATION
584
FEMALE POPULATION
40.24
MALES / 100 FEMALES
248.51
FEMALES / 100 MALES
38.5
MEDIAN AGE
3.9
AVG FAMILY SIZE
3.4
AVG HOUSEHOLD SIZE
172
LABOR FORCE [ PEOPLE ]
36.8%
PERCENT IN LABOR FORCE
Income in Ricardo
Income Overview in Ricardo
Per Capita Income in Ricardo is $22,474, while median incomes of families and households are $60,962 and $61,282 respectively.
| Characteristic | Number | Measure |
| Per Capita Income | 819 | $22,474 |
| Median Family Income | 200 | $60,962 |
| Mean Family Income | 200 | $77,837 |
| Median Household Income | 244 | $61,282 |
| Mean Household Income | 244 | $77,246 |
| Income Deficit | 200 | $0 |
| Wage / Income Gap (%) | 819 | 0.00% |
| Wage / Income Gap ($) | 819 | 100.00¢ per $1 |
| Gini / Inequality Index | 819 | 0.45 |
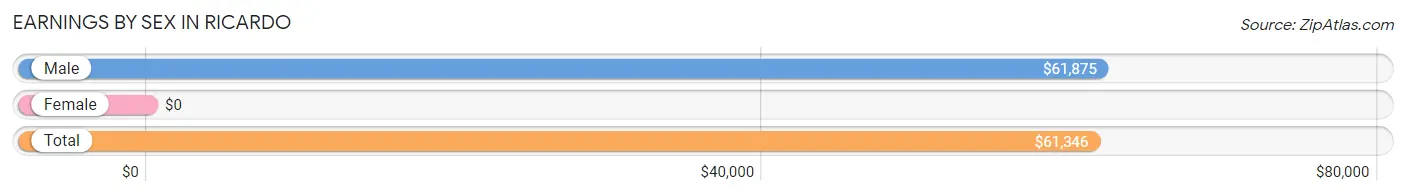
Earnings by Sex in Ricardo
| Sex | Number | Average Earnings |
| Male | 93 (50.0%) | $61,875 |
| Female | 93 (50.0%) | $0 |
| Total | 186 (100.0%) | $61,346 |
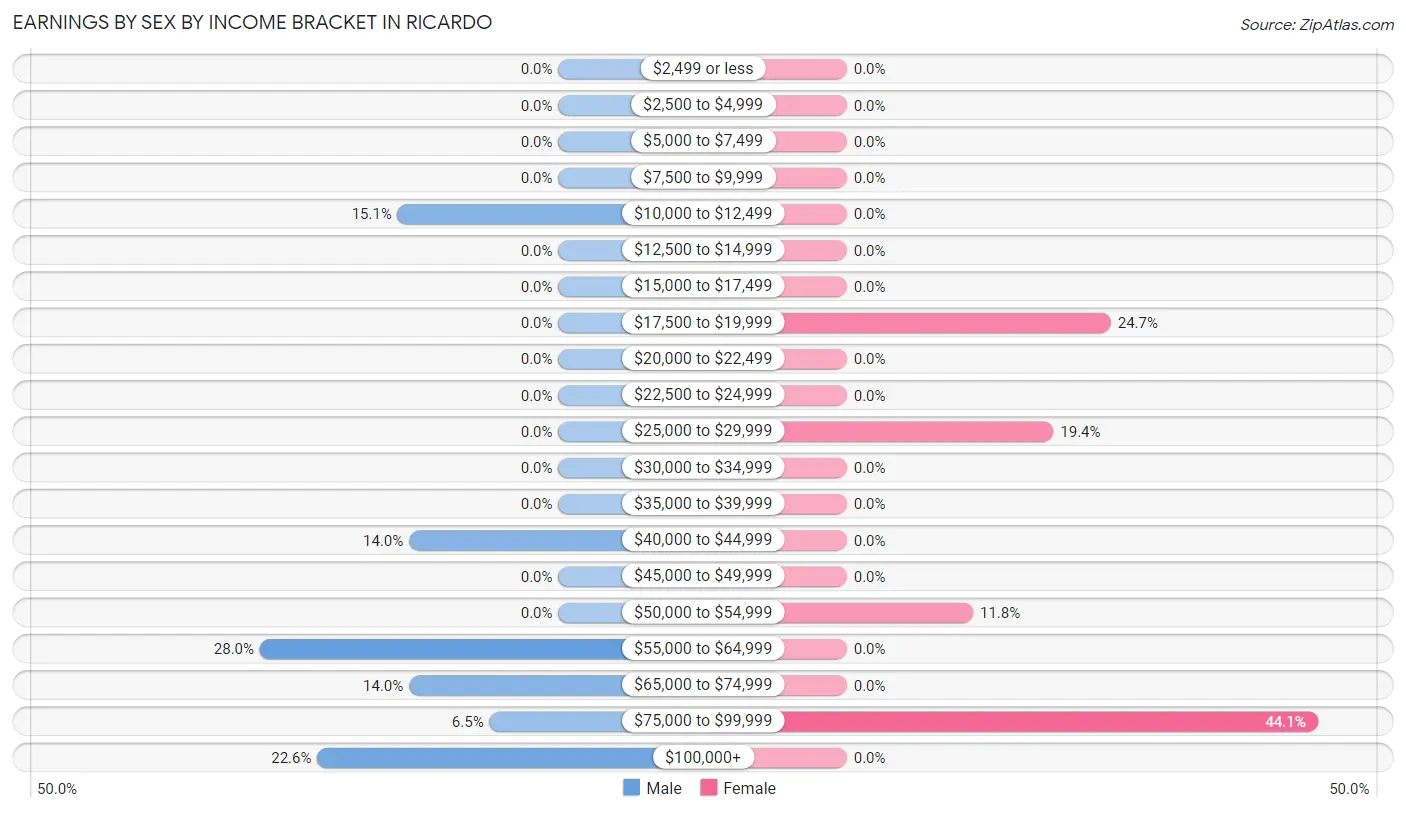
Earnings by Sex by Income Bracket in Ricardo
The most common earnings brackets in Ricardo are $55,000 to $64,999 for men (26 | 28.0%) and $75,000 to $99,999 for women (41 | 44.1%).
| Income | Male | Female |
| $2,499 or less | 0 (0.0%) | 0 (0.0%) |
| $2,500 to $4,999 | 0 (0.0%) | 0 (0.0%) |
| $5,000 to $7,499 | 0 (0.0%) | 0 (0.0%) |
| $7,500 to $9,999 | 0 (0.0%) | 0 (0.0%) |
| $10,000 to $12,499 | 14 (15.0%) | 0 (0.0%) |
| $12,500 to $14,999 | 0 (0.0%) | 0 (0.0%) |
| $15,000 to $17,499 | 0 (0.0%) | 0 (0.0%) |
| $17,500 to $19,999 | 0 (0.0%) | 23 (24.7%) |
| $20,000 to $22,499 | 0 (0.0%) | 0 (0.0%) |
| $22,500 to $24,999 | 0 (0.0%) | 0 (0.0%) |
| $25,000 to $29,999 | 0 (0.0%) | 18 (19.4%) |
| $30,000 to $34,999 | 0 (0.0%) | 0 (0.0%) |
| $35,000 to $39,999 | 0 (0.0%) | 0 (0.0%) |
| $40,000 to $44,999 | 13 (14.0%) | 0 (0.0%) |
| $45,000 to $49,999 | 0 (0.0%) | 0 (0.0%) |
| $50,000 to $54,999 | 0 (0.0%) | 11 (11.8%) |
| $55,000 to $64,999 | 26 (28.0%) | 0 (0.0%) |
| $65,000 to $74,999 | 13 (14.0%) | 0 (0.0%) |
| $75,000 to $99,999 | 6 (6.5%) | 41 (44.1%) |
| $100,000+ | 21 (22.6%) | 0 (0.0%) |
| Total | 93 (100.0%) | 93 (100.0%) |
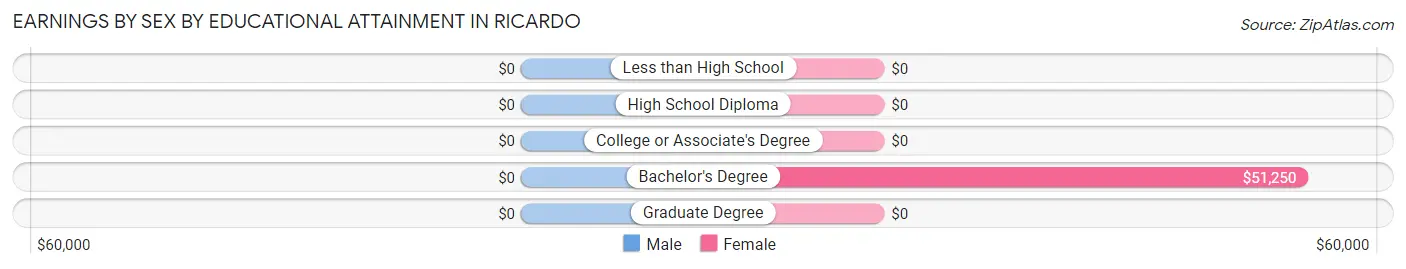
Earnings by Sex by Educational Attainment in Ricardo
| Educational Attainment | Male Income | Female Income |
| Less than High School | - | - |
| High School Diploma | - | - |
| College or Associate's Degree | - | - |
| Bachelor's Degree | - | - |
| Graduate Degree | - | - |
| Total | $61,875 | $0 |
Family Income in Ricardo
Family Income Brackets in Ricardo
According to the Ricardo family income data, there are 53 families falling into the $25,000 to $34,999 income range, which is the most common income bracket and makes up 26.5% of all families.
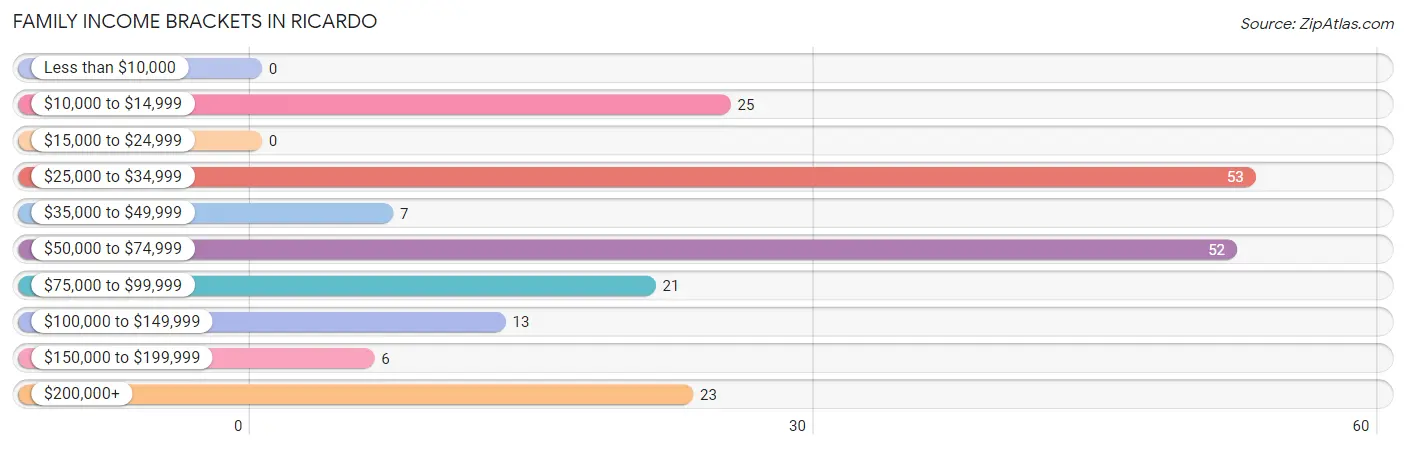
| Income Bracket | # Families | % Families |
| Less than $10,000 | 0 | 0.0% |
| $10,000 to $14,999 | 25 | 12.5% |
| $15,000 to $24,999 | 0 | 0.0% |
| $25,000 to $34,999 | 53 | 26.5% |
| $35,000 to $49,999 | 7 | 3.5% |
| $50,000 to $74,999 | 52 | 26.0% |
| $75,000 to $99,999 | 21 | 10.5% |
| $100,000 to $149,999 | 13 | 6.5% |
| $150,000 to $199,999 | 6 | 3.0% |
| $200,000+ | 23 | 11.5% |
Family Income by Famaliy Size in Ricardo
2-person families (147 | 73.5%) account for the highest median family income in Ricardo with $60,609 per family, while 2-person families (147 | 73.5%) have the highest median income of $30,304 per family member.
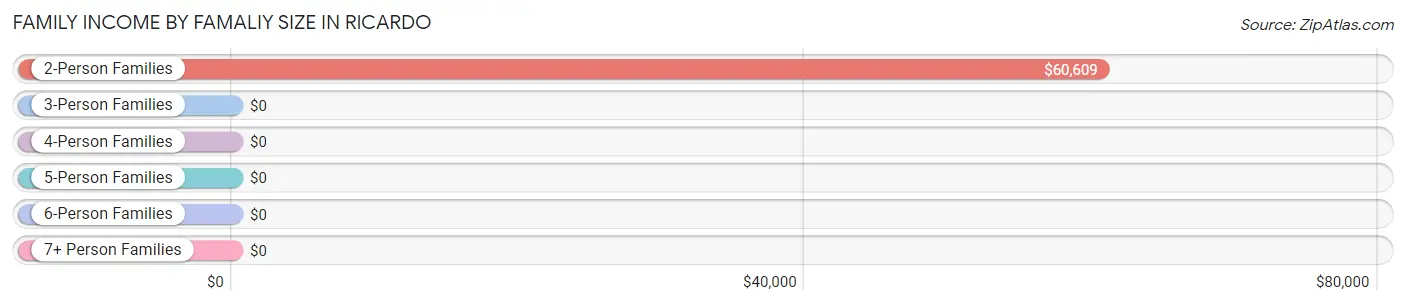
| Income Bracket | # Families | Median Income |
| 2-Person Families | 147 (73.5%) | $60,609 |
| 3-Person Families | 26 (13.0%) | $0 |
| 4-Person Families | 6 (3.0%) | $0 |
| 5-Person Families | 0 (0.0%) | $0 |
| 6-Person Families | 0 (0.0%) | $0 |
| 7+ Person Families | 21 (10.5%) | $0 |
| Total | 200 (100.0%) | $60,962 |
Family Income by Number of Earners in Ricardo
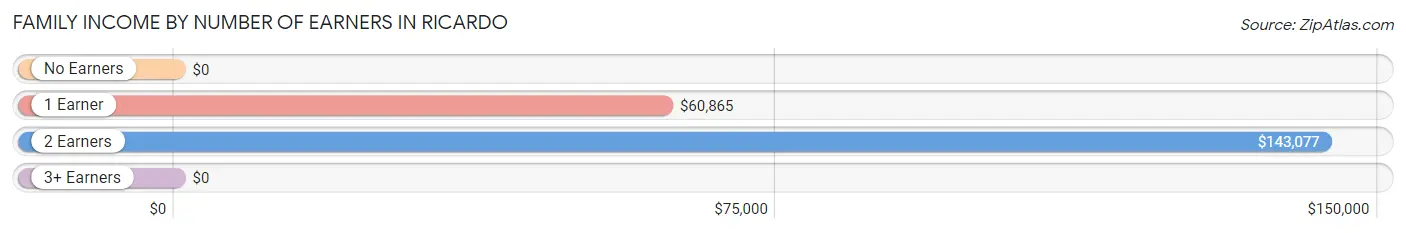
| Number of Earners | # Families | Median Income |
| No Earners | 71 (35.5%) | $0 |
| 1 Earner | 97 (48.5%) | $60,865 |
| 2 Earners | 32 (16.0%) | $143,077 |
| 3+ Earners | 0 (0.0%) | $0 |
| Total | 200 (100.0%) | $60,962 |
Household Income in Ricardo
Household Income Brackets in Ricardo
With 58 households falling in the category, the $50,000 to $74,999 income range is the most frequent in Ricardo, accounting for 23.8% of all households.
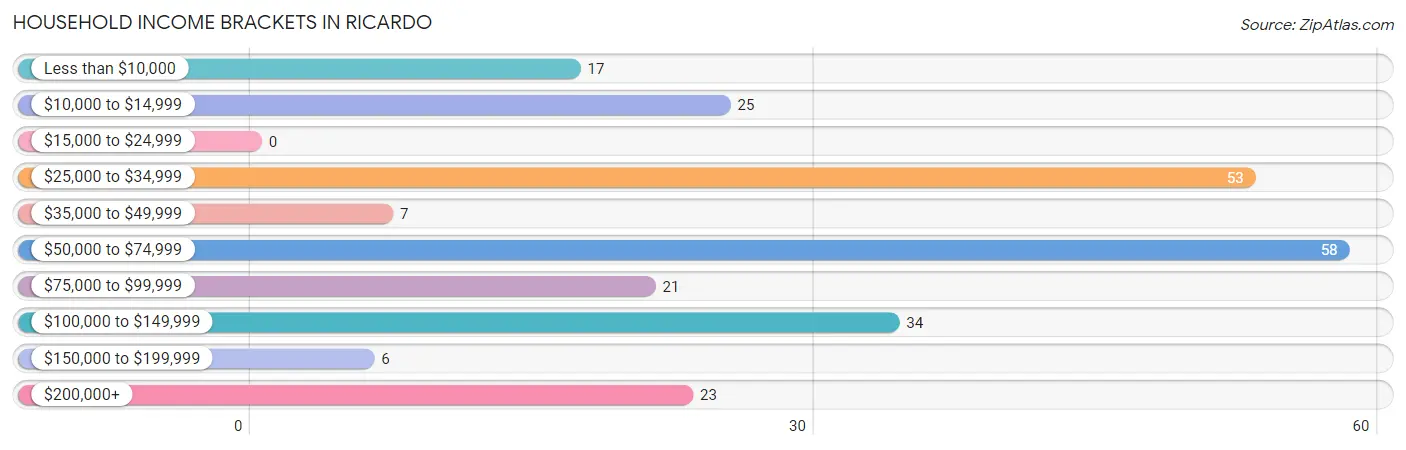
| Income Bracket | # Households | % Households |
| Less than $10,000 | 17 | 7.0% |
| $10,000 to $14,999 | 25 | 10.2% |
| $15,000 to $24,999 | 0 | 0.0% |
| $25,000 to $34,999 | 53 | 21.7% |
| $35,000 to $49,999 | 7 | 2.9% |
| $50,000 to $74,999 | 58 | 23.8% |
| $75,000 to $99,999 | 21 | 8.6% |
| $100,000 to $149,999 | 34 | 13.9% |
| $150,000 to $199,999 | 6 | 2.5% |
| $200,000+ | 23 | 9.4% |
Household Income by Householder Age in Ricardo
The median household income in Ricardo is $61,282, with the highest median household income of $133,750 found in the 25 to 44 years age bracket for the primary householder. A total of 47 households (19.3%) fall into this category.
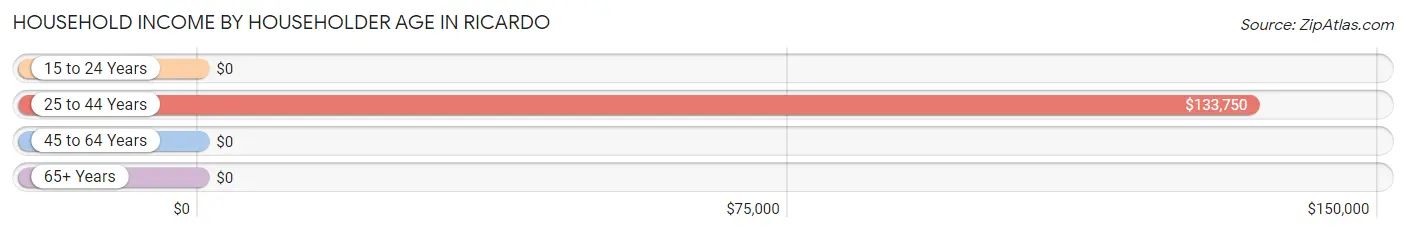
| Income Bracket | # Households | Median Income |
| 15 to 24 Years | 0 (0.0%) | $0 |
| 25 to 44 Years | 47 (19.3%) | $133,750 |
| 45 to 64 Years | 80 (32.8%) | $0 |
| 65+ Years | 117 (47.9%) | $0 |
| Total | 244 (100.0%) | $61,282 |
Poverty in Ricardo
Income Below Poverty by Sex and Age in Ricardo
With 28.5% poverty level for males and 59.4% for females among the residents of Ricardo, 18 to 24 year old males and 5 year old females are the most vulnerable to poverty, with 21 males (100.0%) and 85 females (100.0%) in their respective age groups living below the poverty level.
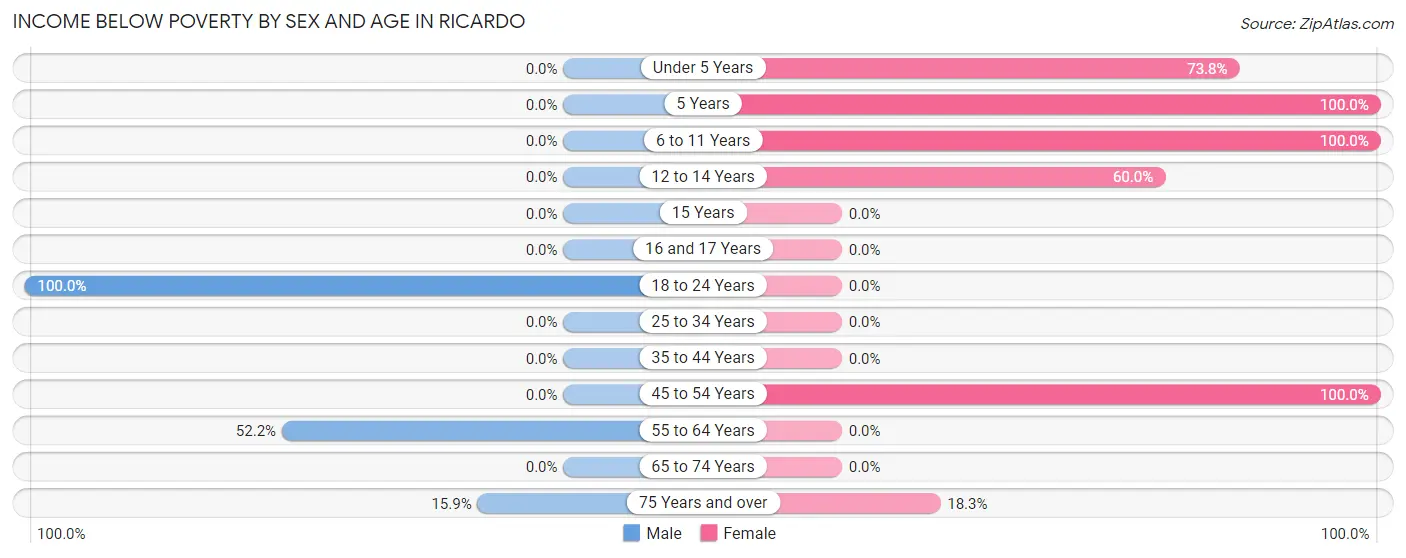
| Age Bracket | Male | Female |
| Under 5 Years | 0 (0.0%) | 45 (73.8%) |
| 5 Years | 0 (0.0%) | 85 (100.0%) |
| 6 to 11 Years | 0 (0.0%) | 129 (100.0%) |
| 12 to 14 Years | 0 (0.0%) | 39 (60.0%) |
| 15 Years | 0 (0.0%) | 0 (0.0%) |
| 16 and 17 Years | 0 (0.0%) | 0 (0.0%) |
| 18 to 24 Years | 21 (100.0%) | 0 (0.0%) |
| 25 to 34 Years | 0 (0.0%) | 0 (0.0%) |
| 35 to 44 Years | 0 (0.0%) | 0 (0.0%) |
| 45 to 54 Years | 0 (0.0%) | 32 (100.0%) |
| 55 to 64 Years | 35 (52.2%) | 0 (0.0%) |
| 65 to 74 Years | 0 (0.0%) | 0 (0.0%) |
| 75 Years and over | 11 (15.9%) | 17 (18.3%) |
| Total | 67 (28.5%) | 347 (59.4%) |
Income Above Poverty by Sex and Age in Ricardo
According to the poverty statistics in Ricardo, males aged 6 to 11 years and females aged 35 to 44 years are the age groups that are most secure financially, with 100.0% of males and 100.0% of females in these age groups living above the poverty line.
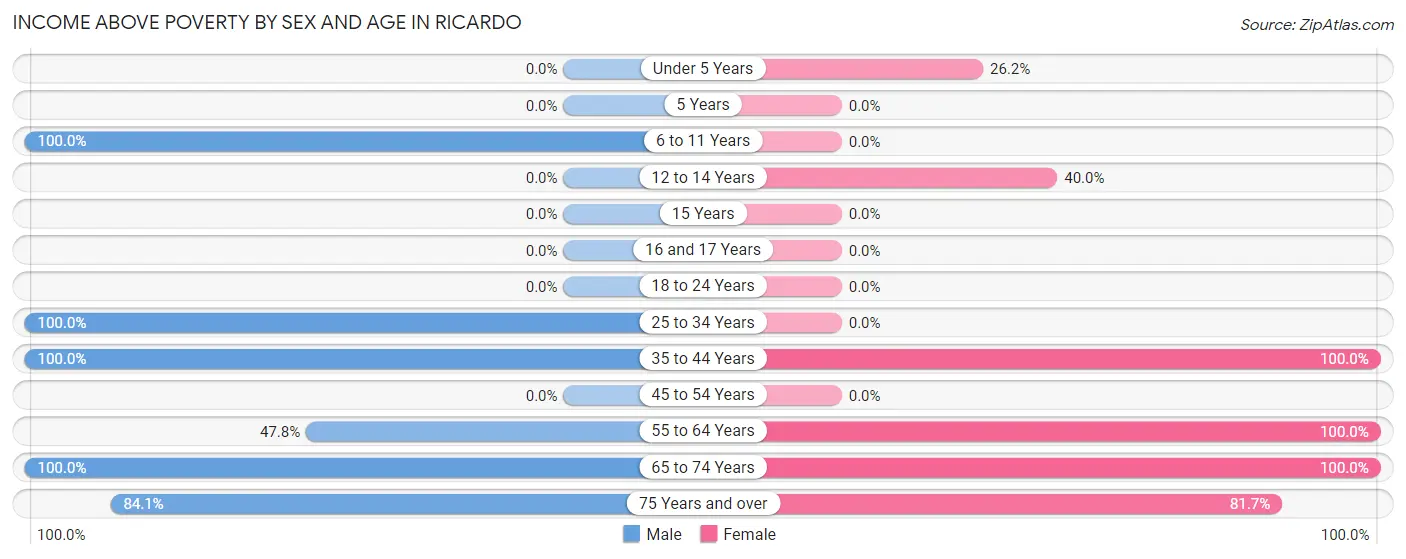
| Age Bracket | Male | Female |
| Under 5 Years | 0 (0.0%) | 16 (26.2%) |
| 5 Years | 0 (0.0%) | 0 (0.0%) |
| 6 to 11 Years | 12 (100.0%) | 0 (0.0%) |
| 12 to 14 Years | 0 (0.0%) | 26 (40.0%) |
| 15 Years | 0 (0.0%) | 0 (0.0%) |
| 16 and 17 Years | 0 (0.0%) | 0 (0.0%) |
| 18 to 24 Years | 0 (0.0%) | 0 (0.0%) |
| 25 to 34 Years | 13 (100.0%) | 0 (0.0%) |
| 35 to 44 Years | 34 (100.0%) | 47 (100.0%) |
| 45 to 54 Years | 0 (0.0%) | 0 (0.0%) |
| 55 to 64 Years | 32 (47.8%) | 39 (100.0%) |
| 65 to 74 Years | 19 (100.0%) | 33 (100.0%) |
| 75 Years and over | 58 (84.1%) | 76 (81.7%) |
| Total | 168 (71.5%) | 237 (40.6%) |
Income Below Poverty Among Married-Couple Families in Ricardo
The poverty statistics for married-couple families in Ricardo show that 12.0% or 21 of the total 175 families live below the poverty line. Families with 5 or more children have the highest poverty rate of 100.0%, comprising of 21 families. On the other hand, families with no children have the lowest poverty rate of 0.0%, which includes 0 families.
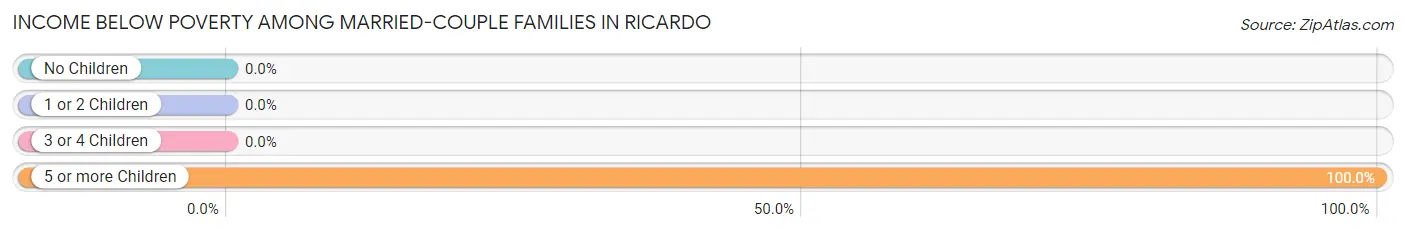
| Children | Above Poverty | Below Poverty |
| No Children | 122 (100.0%) | 0 (0.0%) |
| 1 or 2 Children | 32 (100.0%) | 0 (0.0%) |
| 3 or 4 Children | 0 (0.0%) | 0 (0.0%) |
| 5 or more Children | 0 (0.0%) | 21 (100.0%) |
| Total | 154 (88.0%) | 21 (12.0%) |
Income Below Poverty Among Single-Parent Households in Ricardo
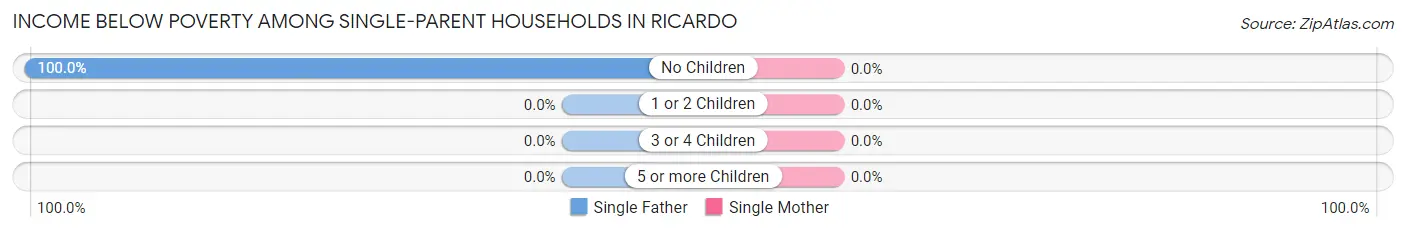
| Children | Single Father | Single Mother |
| No Children | 25 (100.0%) | 0 (0.0%) |
| 1 or 2 Children | 0 (0.0%) | 0 (0.0%) |
| 3 or 4 Children | 0 (0.0%) | 0 (0.0%) |
| 5 or more Children | 0 (0.0%) | 0 (0.0%) |
| Total | 25 (100.0%) | 0 (0.0%) |
Income Below Poverty Among Married-Couple vs Single-Parent Households in Ricardo
The poverty data for Ricardo shows that 21 of the married-couple family households (12.0%) and 25 of the single-parent households (100.0%) are living below the poverty level. Within the married-couple family households, those with 5 or more children have the highest poverty rate, with 21 households (100.0%) falling below the poverty line. Among the single-parent households, those with no children have the highest poverty rate, with 25 household (100.0%) living below poverty.
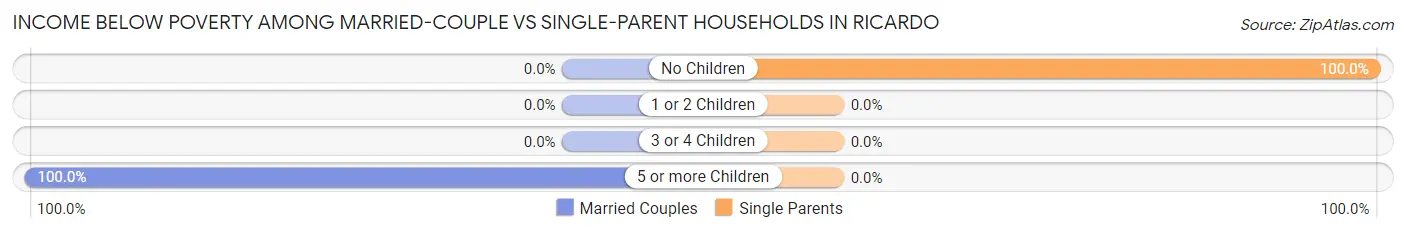
| Children | Married-Couple Families | Single-Parent Households |
| No Children | 0 (0.0%) | 25 (100.0%) |
| 1 or 2 Children | 0 (0.0%) | 0 (0.0%) |
| 3 or 4 Children | 0 (0.0%) | 0 (0.0%) |
| 5 or more Children | 21 (100.0%) | 0 (0.0%) |
| Total | 21 (12.0%) | 25 (100.0%) |
Race in Ricardo
The most populous races in Ricardo are Hispanic or Latino (670 | 81.8%), Two or more Races (451 | 55.1%), and White / Caucasian (329 | 40.2%).
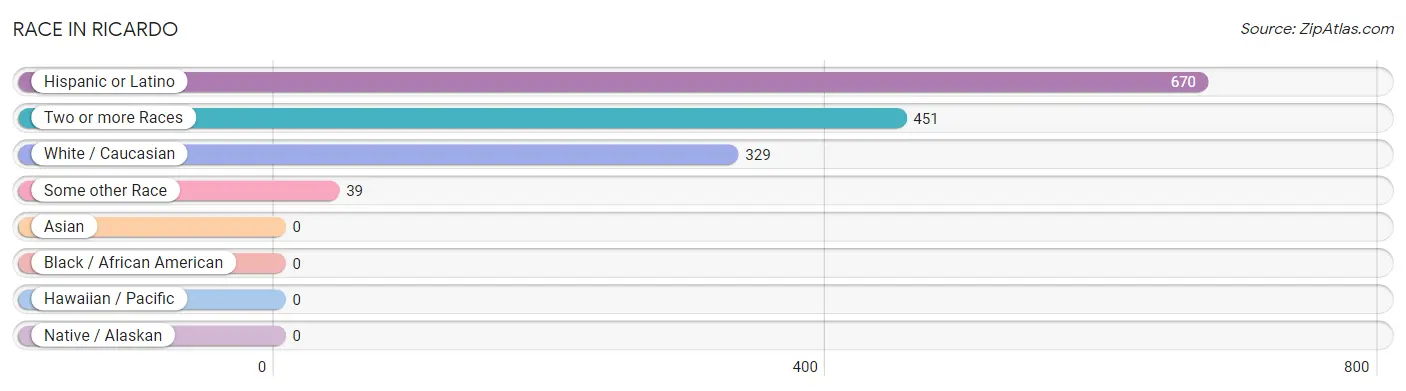
| Race | # Population | % Population |
| Asian | 0 | 0.0% |
| Black / African American | 0 | 0.0% |
| Hawaiian / Pacific | 0 | 0.0% |
| Hispanic or Latino | 670 | 81.8% |
| Native / Alaskan | 0 | 0.0% |
| White / Caucasian | 329 | 40.2% |
| Two or more Races | 451 | 55.1% |
| Some other Race | 39 | 4.8% |
| Total | 819 | 100.0% |
Ancestry in Ricardo
The most populous ancestries reported in Ricardo are Mexican (670 | 81.8%), American (35 | 4.3%), German (30 | 3.7%), Polish (29 | 3.5%), and English (26 | 3.2%), together accounting for 96.4% of all Ricardo residents.
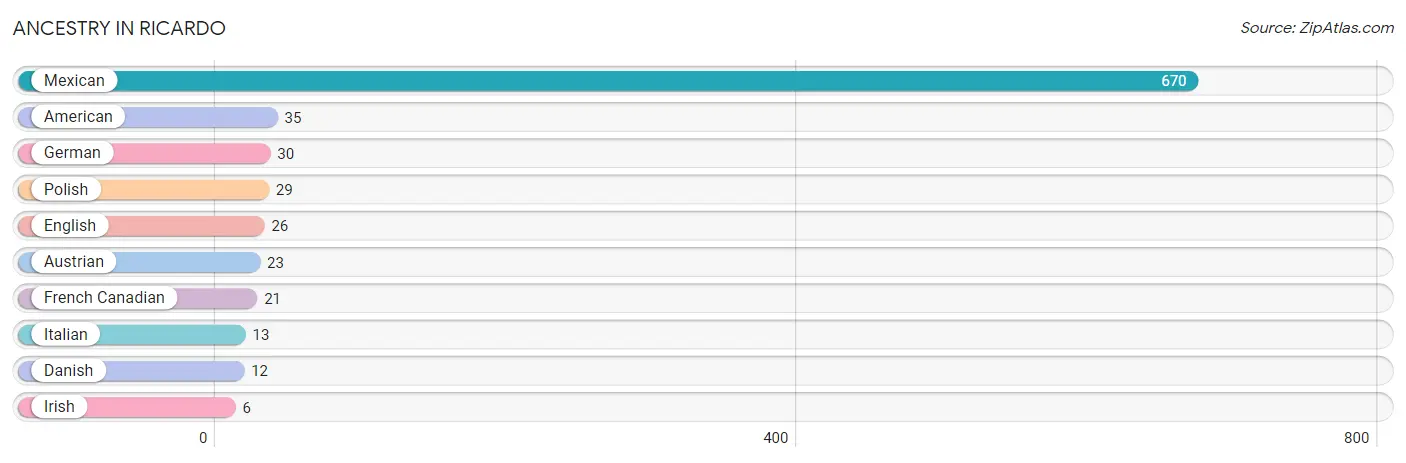
| Ancestry | # Population | % Population |
| American | 35 | 4.3% |
| Austrian | 23 | 2.8% |
| Danish | 12 | 1.5% |
| English | 26 | 3.2% |
| French Canadian | 21 | 2.6% |
| German | 30 | 3.7% |
| Irish | 6 | 0.7% |
| Italian | 13 | 1.6% |
| Mexican | 670 | 81.8% |
| Polish | 29 | 3.5% | View All 10 Rows |
Immigrants in Ricardo
The most numerous immigrant groups reported in Ricardo came from , and Canada (21 | 2.6%), together accounting for 2.6% of all Ricardo residents.

| Immigration Origin | # Population | % Population |
| Canada | 21 | 2.6% | View All 1 Rows |
Sex and Age in Ricardo
Sex and Age in Ricardo
The most populous age groups in Ricardo are 55 to 59 Years (67 | 28.5%) for men and 5 to 9 Years (214 | 36.6%) for women.
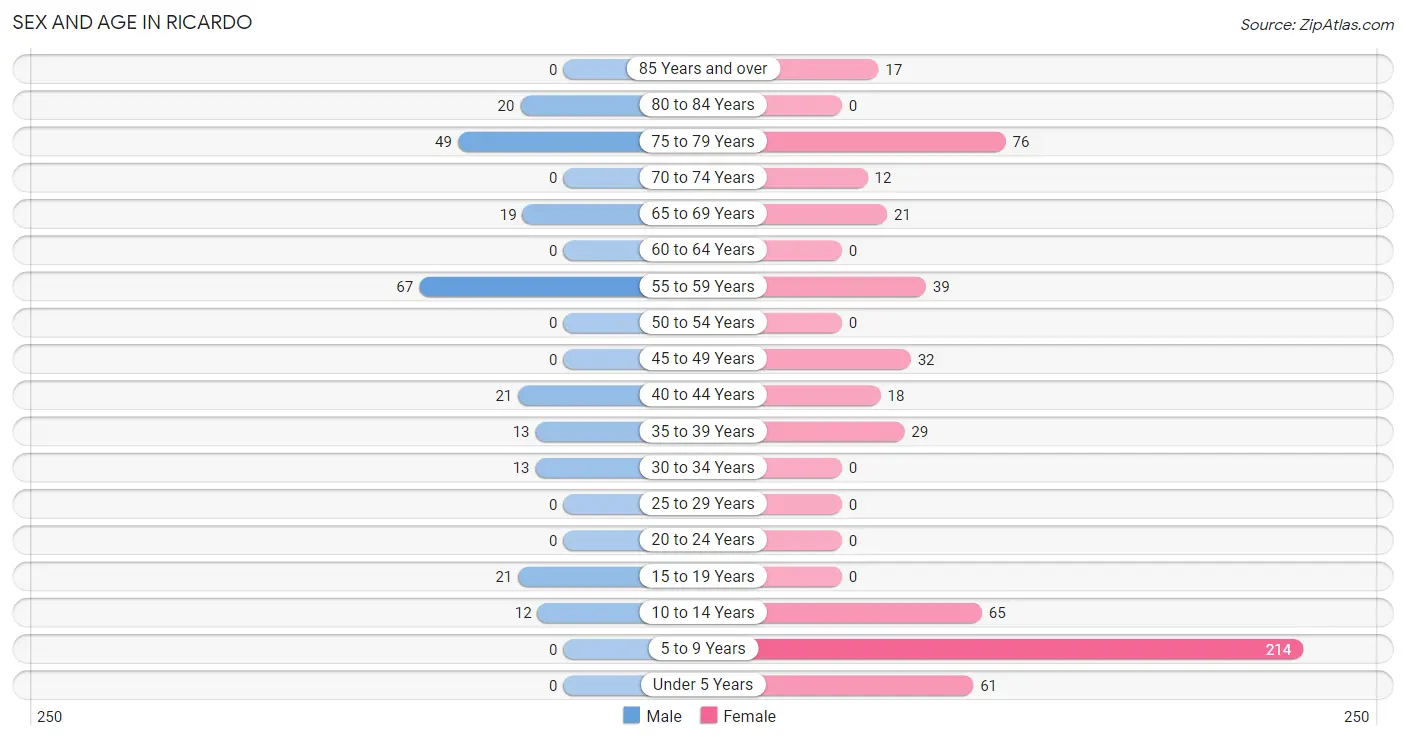
| Age Bracket | Male | Female |
| Under 5 Years | 0 (0.0%) | 61 (10.4%) |
| 5 to 9 Years | 0 (0.0%) | 214 (36.6%) |
| 10 to 14 Years | 12 (5.1%) | 65 (11.1%) |
| 15 to 19 Years | 21 (8.9%) | 0 (0.0%) |
| 20 to 24 Years | 0 (0.0%) | 0 (0.0%) |
| 25 to 29 Years | 0 (0.0%) | 0 (0.0%) |
| 30 to 34 Years | 13 (5.5%) | 0 (0.0%) |
| 35 to 39 Years | 13 (5.5%) | 29 (5.0%) |
| 40 to 44 Years | 21 (8.9%) | 18 (3.1%) |
| 45 to 49 Years | 0 (0.0%) | 32 (5.5%) |
| 50 to 54 Years | 0 (0.0%) | 0 (0.0%) |
| 55 to 59 Years | 67 (28.5%) | 39 (6.7%) |
| 60 to 64 Years | 0 (0.0%) | 0 (0.0%) |
| 65 to 69 Years | 19 (8.1%) | 21 (3.6%) |
| 70 to 74 Years | 0 (0.0%) | 12 (2.1%) |
| 75 to 79 Years | 49 (20.8%) | 76 (13.0%) |
| 80 to 84 Years | 20 (8.5%) | 0 (0.0%) |
| 85 Years and over | 0 (0.0%) | 17 (2.9%) |
| Total | 235 (100.0%) | 584 (100.0%) |
Families and Households in Ricardo
Median Family Size in Ricardo
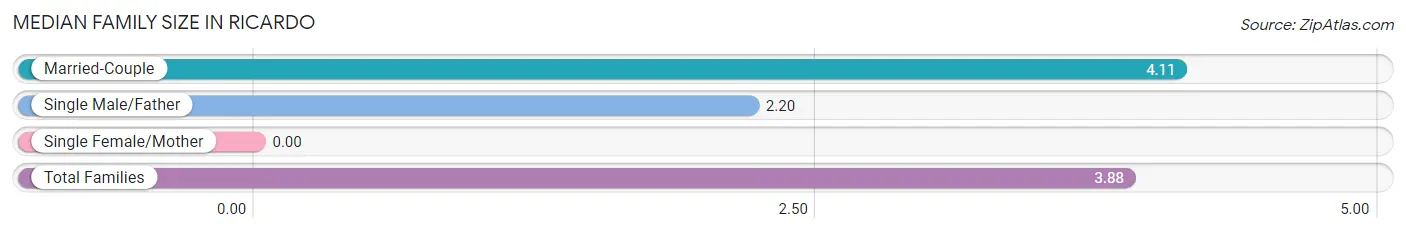
| Family Type | # Families | Family Size |
| Married-Couple | 175 (87.5%) | 4.11 |
| Single Male/Father | 25 (12.5%) | 2.20 |
| Single Female/Mother | 0 (0.0%) | - |
| Total Families | 200 (100.0%) | 3.88 |
Median Household Size in Ricardo
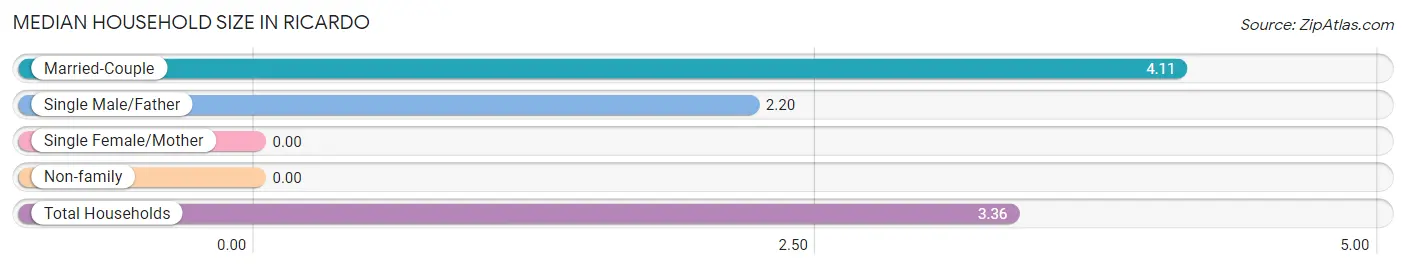
| Household Type | # Households | Household Size |
| Married-Couple | 175 (71.7%) | 4.11 |
| Single Male/Father | 25 (10.2%) | 2.20 |
| Single Female/Mother | 0 (0.0%) | - |
| Non-family | 44 (18.0%) | - |
| Total Households | 244 (100.0%) | 3.36 |
Household Size by Marriage Status in Ricardo
Out of a total of 244 households in Ricardo, 200 (82.0%) are family households, while 44 (18.0%) are nonfamily households. The most numerous type of family households are 2-person households, comprising 147, and the most common type of nonfamily households are 1-person households, comprising 44.
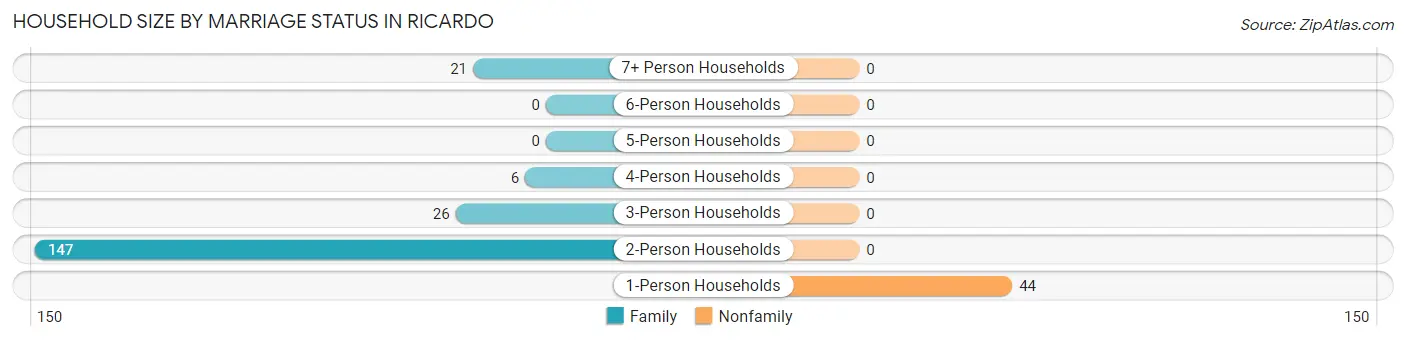
| Household Size | Family Households | Nonfamily Households |
| 1-Person Households | - | 44 (18.0%) |
| 2-Person Households | 147 (60.3%) | 0 (0.0%) |
| 3-Person Households | 26 (10.7%) | 0 (0.0%) |
| 4-Person Households | 6 (2.5%) | 0 (0.0%) |
| 5-Person Households | 0 (0.0%) | 0 (0.0%) |
| 6-Person Households | 0 (0.0%) | 0 (0.0%) |
| 7+ Person Households | 21 (8.6%) | 0 (0.0%) |
| Total | 200 (82.0%) | 44 (18.0%) |
Female Fertility in Ricardo
Fertility by Age in Ricardo
Average fertility rate in Ricardo is 228.0 births per 1,000 women. Women in the age bracket of 35 to 50 years have the highest fertility rate with 228.0 births per 1,000 women. Women in the age bracket of 35 to 50 years acount for 100.0% of all women with births.
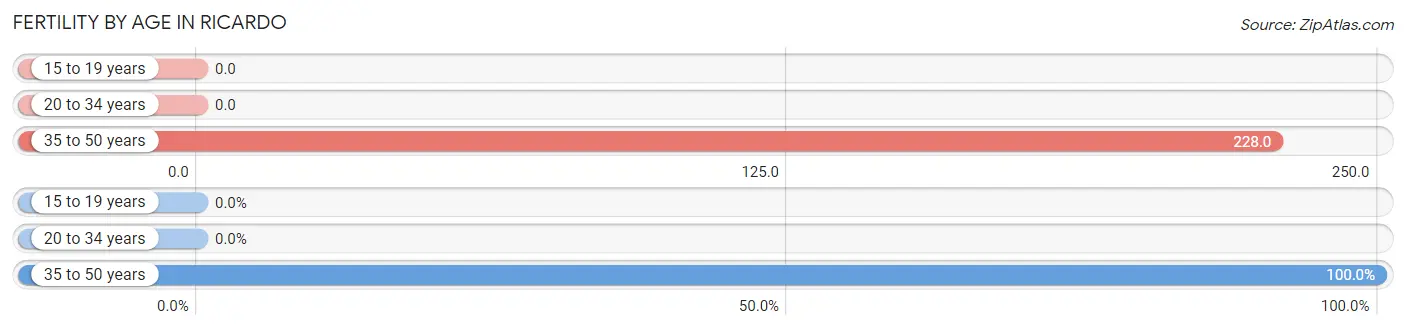
| Age Bracket | Women with Births | Births / 1,000 Women |
| 15 to 19 years | 0 (0.0%) | 0.0 |
| 20 to 34 years | 0 (0.0%) | 0.0 |
| 35 to 50 years | 18 (100.0%) | 228.0 |
| Total | 18 (100.0%) | 228.0 |
Fertility by Age by Marriage Status in Ricardo
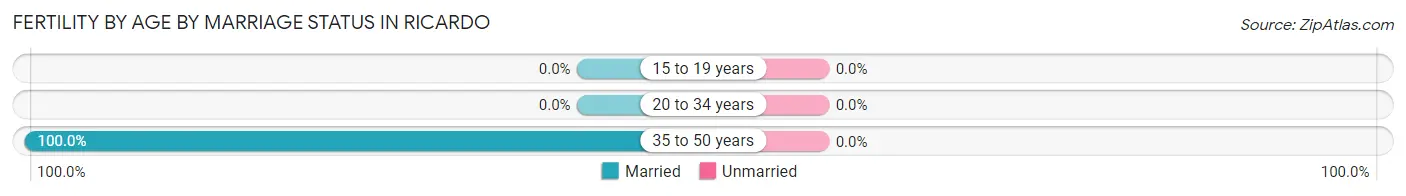
| Age Bracket | Married | Unmarried |
| 15 to 19 years | 0 (0.0%) | 0 (0.0%) |
| 20 to 34 years | 0 (0.0%) | 0 (0.0%) |
| 35 to 50 years | 18 (100.0%) | 0 (0.0%) |
| Total | 18 (100.0%) | 0 (0.0%) |
Fertility by Education in Ricardo
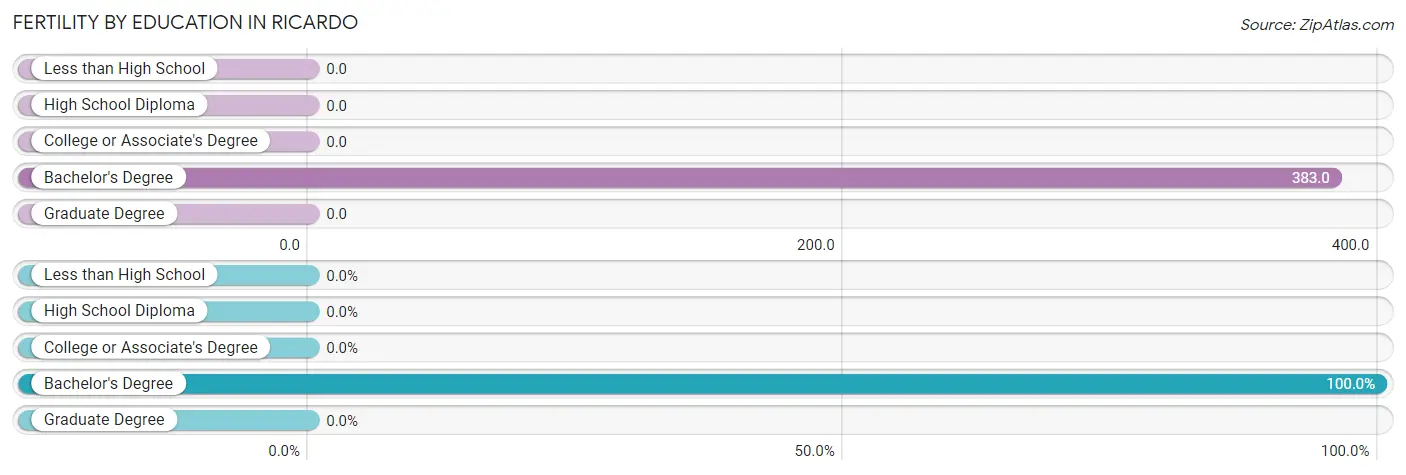
| Educational Attainment | Women with Births | Births / 1,000 Women |
| Less than High School | 0 (0.0%) | 0.0 |
| High School Diploma | 0 (0.0%) | 0.0 |
| College or Associate's Degree | 0 (0.0%) | 0.0 |
| Bachelor's Degree | 18 (100.0%) | 383.0 |
| Graduate Degree | 0 (0.0%) | 0.0 |
| Total | 18 (100.0%) | 228.0 |
Fertility by Education by Marriage Status in Ricardo
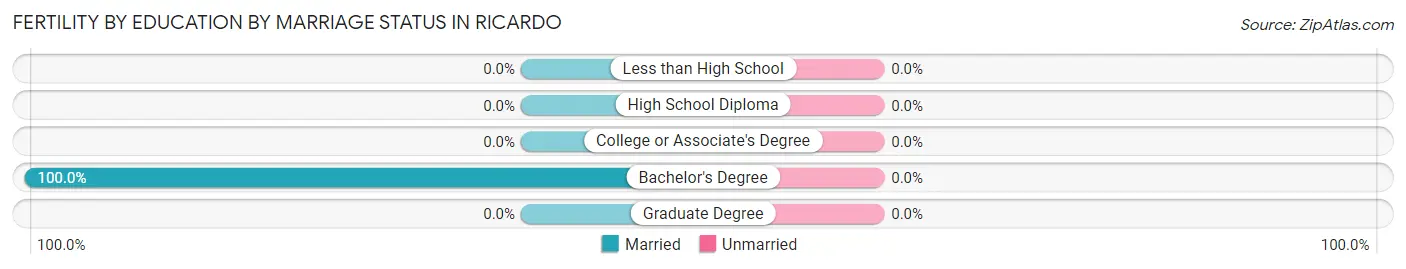
| Educational Attainment | Married | Unmarried |
| Less than High School | 0 (0.0%) | 0 (0.0%) |
| High School Diploma | 0 (0.0%) | 0 (0.0%) |
| College or Associate's Degree | 0 (0.0%) | 0 (0.0%) |
| Bachelor's Degree | 18 (100.0%) | 0 (0.0%) |
| Graduate Degree | 0 (0.0%) | 0 (0.0%) |
| Total | 18 (100.0%) | 0 (0.0%) |
Employment Characteristics in Ricardo
Employment by Class of Employer in Ricardo
Among the 172 employed individuals in Ricardo, private company employees (70 | 40.7%), self-employed (incorporated) (41 | 23.8%), and state government employees (29 | 16.9%) make up the most common classes of employment.
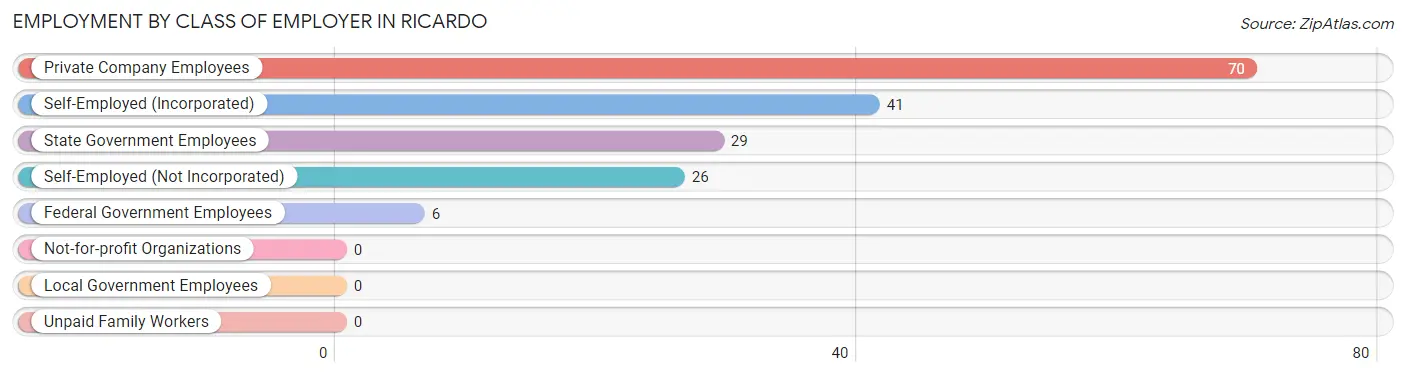
| Employer Class | # Employees | % Employees |
| Private Company Employees | 70 | 40.7% |
| Self-Employed (Incorporated) | 41 | 23.8% |
| Self-Employed (Not Incorporated) | 26 | 15.1% |
| Not-for-profit Organizations | 0 | 0.0% |
| Local Government Employees | 0 | 0.0% |
| State Government Employees | 29 | 16.9% |
| Federal Government Employees | 6 | 3.5% |
| Unpaid Family Workers | 0 | 0.0% |
| Total | 172 | 100.0% |
Employment Status by Age in Ricardo
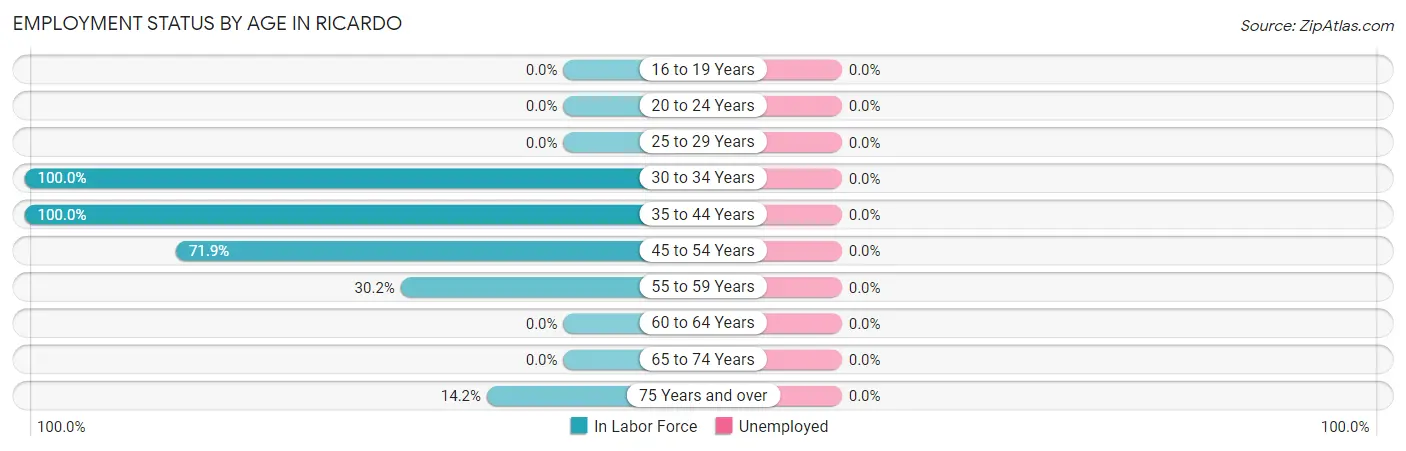
| Age Bracket | In Labor Force | Unemployed |
| 16 to 19 Years | 0 (0.0%) | 0 (0.0%) |
| 20 to 24 Years | 0 (0.0%) | 0 (0.0%) |
| 25 to 29 Years | 0 (0.0%) | 0 (0.0%) |
| 30 to 34 Years | 13 (100.0%) | 0 (0.0%) |
| 35 to 44 Years | 81 (100.0%) | 0 (0.0%) |
| 45 to 54 Years | 23 (71.9%) | 0 (0.0%) |
| 55 to 59 Years | 32 (30.2%) | 0 (0.0%) |
| 60 to 64 Years | 0 (0.0%) | 0 (0.0%) |
| 65 to 74 Years | 0 (0.0%) | 0 (0.0%) |
| 75 Years and over | 23 (14.2%) | 0 (0.0%) |
| Total | 172 (36.8%) | 0 (0.0%) |
Employment Status by Educational Attainment in Ricardo
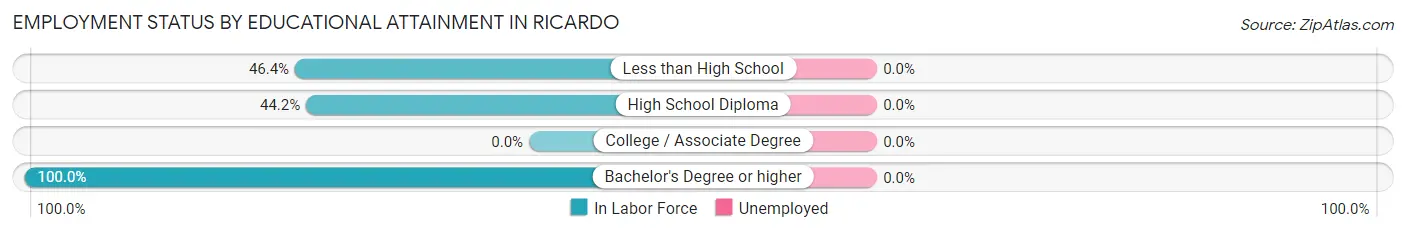
| Educational Attainment | In Labor Force | Unemployed |
| Less than High School | 26 (46.4%) | 0 (0.0%) |
| High School Diploma | 42 (44.2%) | 0 (0.0%) |
| College / Associate Degree | 0 (0.0%) | 0 (0.0%) |
| Bachelor's Degree or higher | 81 (100.0%) | 0 (0.0%) |
| Total | 149 (64.2%) | 0 (0.0%) |
Employment Occupations by Sex in Ricardo
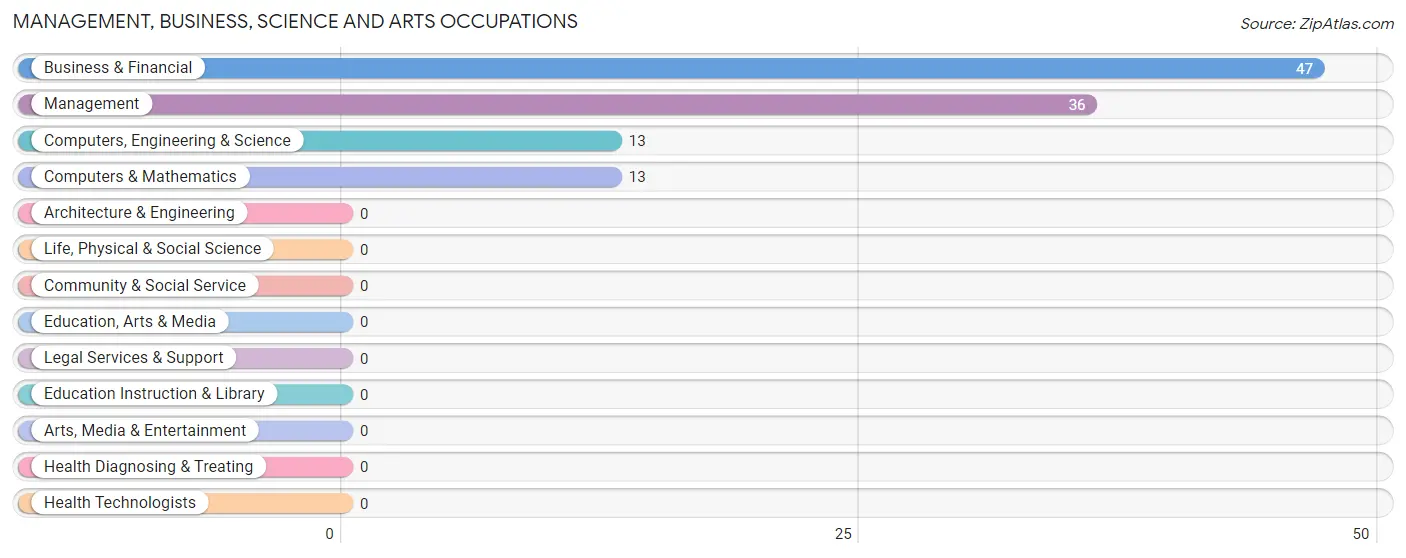
Management, Business, Science and Arts Occupations
The most common Management, Business, Science and Arts occupations in Ricardo are Business & Financial (47 | 27.3%), Management (36 | 20.9%), Computers, Engineering & Science (13 | 7.6%), and Computers & Mathematics (13 | 7.6%).
Management, Business, Science and Arts Occupations by Sex
Within the Management, Business, Science and Arts occupations in Ricardo, the most male-oriented occupations are Computers, Engineering & Science (100.0%), Computers & Mathematics (100.0%), and Business & Financial (27.7%), while the most female-oriented occupations are Management (100.0%), and Business & Financial (72.3%).
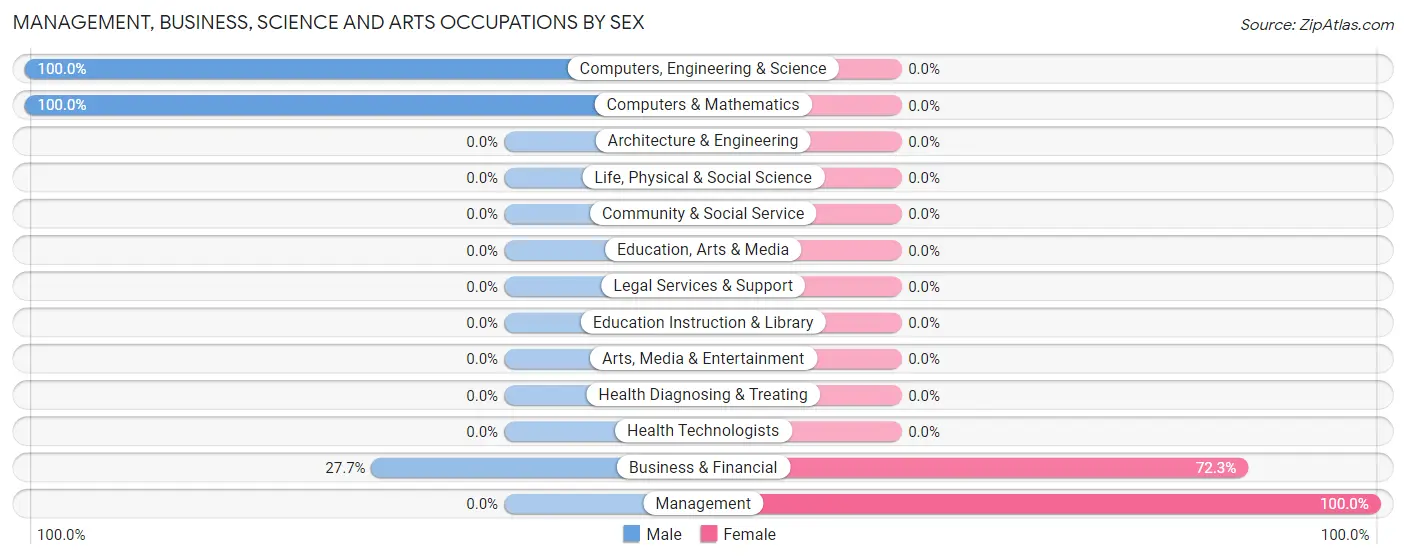
| Occupation | Male | Female |
| Management | 0 (0.0%) | 36 (100.0%) |
| Business & Financial | 13 (27.7%) | 34 (72.3%) |
| Computers, Engineering & Science | 13 (100.0%) | 0 (0.0%) |
| Computers & Mathematics | 13 (100.0%) | 0 (0.0%) |
| Architecture & Engineering | 0 (0.0%) | 0 (0.0%) |
| Life, Physical & Social Science | 0 (0.0%) | 0 (0.0%) |
| Community & Social Service | 0 (0.0%) | 0 (0.0%) |
| Education, Arts & Media | 0 (0.0%) | 0 (0.0%) |
| Legal Services & Support | 0 (0.0%) | 0 (0.0%) |
| Education Instruction & Library | 0 (0.0%) | 0 (0.0%) |
| Arts, Media & Entertainment | 0 (0.0%) | 0 (0.0%) |
| Health Diagnosing & Treating | 0 (0.0%) | 0 (0.0%) |
| Health Technologists | 0 (0.0%) | 0 (0.0%) |
| Total (Category) | 26 (27.1%) | 70 (72.9%) |
| Total (Overall) | 79 (45.9%) | 93 (54.1%) |
Services Occupations
Services Occupations by Sex
| Occupation | Male | Female |
| Healthcare Support | 0 (0.0%) | 0 (0.0%) |
| Security & Protection | 0 (0.0%) | 0 (0.0%) |
| Firefighting & Prevention | 0 (0.0%) | 0 (0.0%) |
| Law Enforcement | 0 (0.0%) | 0 (0.0%) |
| Food Preparation & Serving | 0 (0.0%) | 0 (0.0%) |
| Cleaning & Maintenance | 0 (0.0%) | 0 (0.0%) |
| Personal Care & Service | 0 (0.0%) | 0 (0.0%) |
| Total (Category) | 0 (0.0%) | 0 (0.0%) |
| Total (Overall) | 79 (45.9%) | 93 (54.1%) |
Sales and Office Occupations
Sales and Office Occupations by Sex
| Occupation | Male | Female |
| Sales & Related | 0 (0.0%) | 0 (0.0%) |
| Office & Administration | 0 (0.0%) | 0 (0.0%) |
| Total (Category) | 0 (0.0%) | 0 (0.0%) |
| Total (Overall) | 79 (45.9%) | 93 (54.1%) |
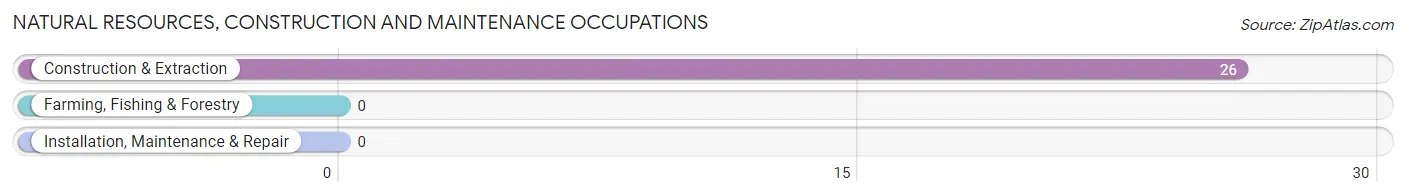
Natural Resources, Construction and Maintenance Occupations
The most common Natural Resources, Construction and Maintenance occupations in Ricardo are , and Construction & Extraction (26 | 15.1%).
Natural Resources, Construction and Maintenance Occupations by Sex
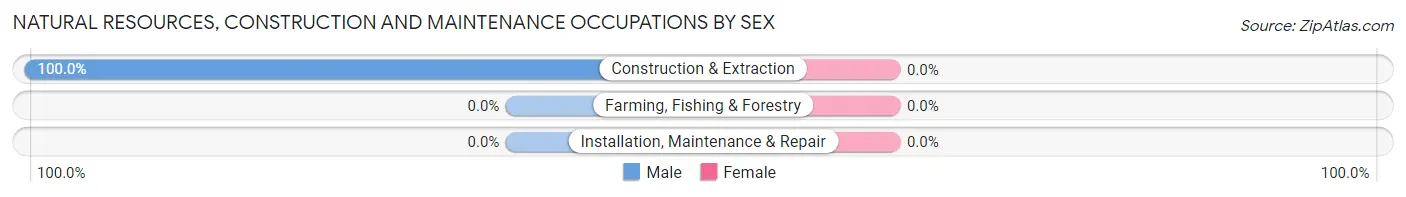
| Occupation | Male | Female |
| Farming, Fishing & Forestry | 0 (0.0%) | 0 (0.0%) |
| Construction & Extraction | 26 (100.0%) | 0 (0.0%) |
| Installation, Maintenance & Repair | 0 (0.0%) | 0 (0.0%) |
| Total (Category) | 26 (100.0%) | 0 (0.0%) |
| Total (Overall) | 79 (45.9%) | 93 (54.1%) |
Production, Transportation and Moving Occupations
The most common Production, Transportation and Moving occupations in Ricardo are Production (27 | 15.7%), and Material Moving (23 | 13.4%).
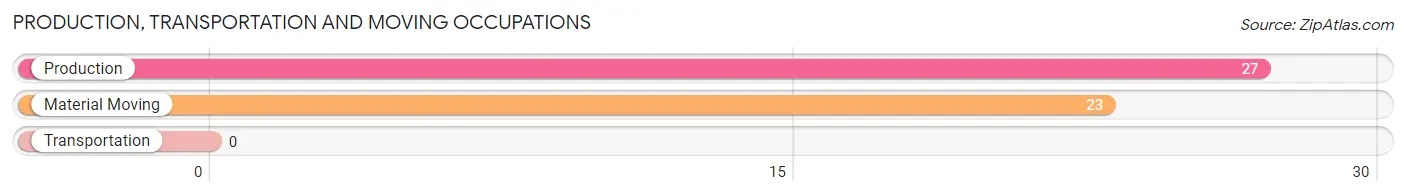
Production, Transportation and Moving Occupations by Sex
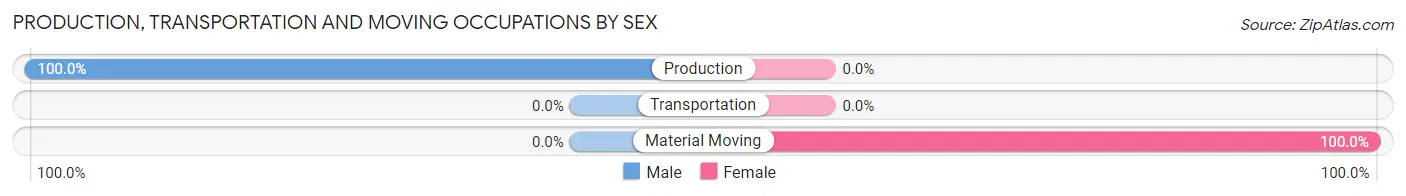
| Occupation | Male | Female |
| Production | 27 (100.0%) | 0 (0.0%) |
| Transportation | 0 (0.0%) | 0 (0.0%) |
| Material Moving | 0 (0.0%) | 23 (100.0%) |
| Total (Category) | 27 (54.0%) | 23 (46.0%) |
| Total (Overall) | 79 (45.9%) | 93 (54.1%) |
Employment Industries by Sex in Ricardo
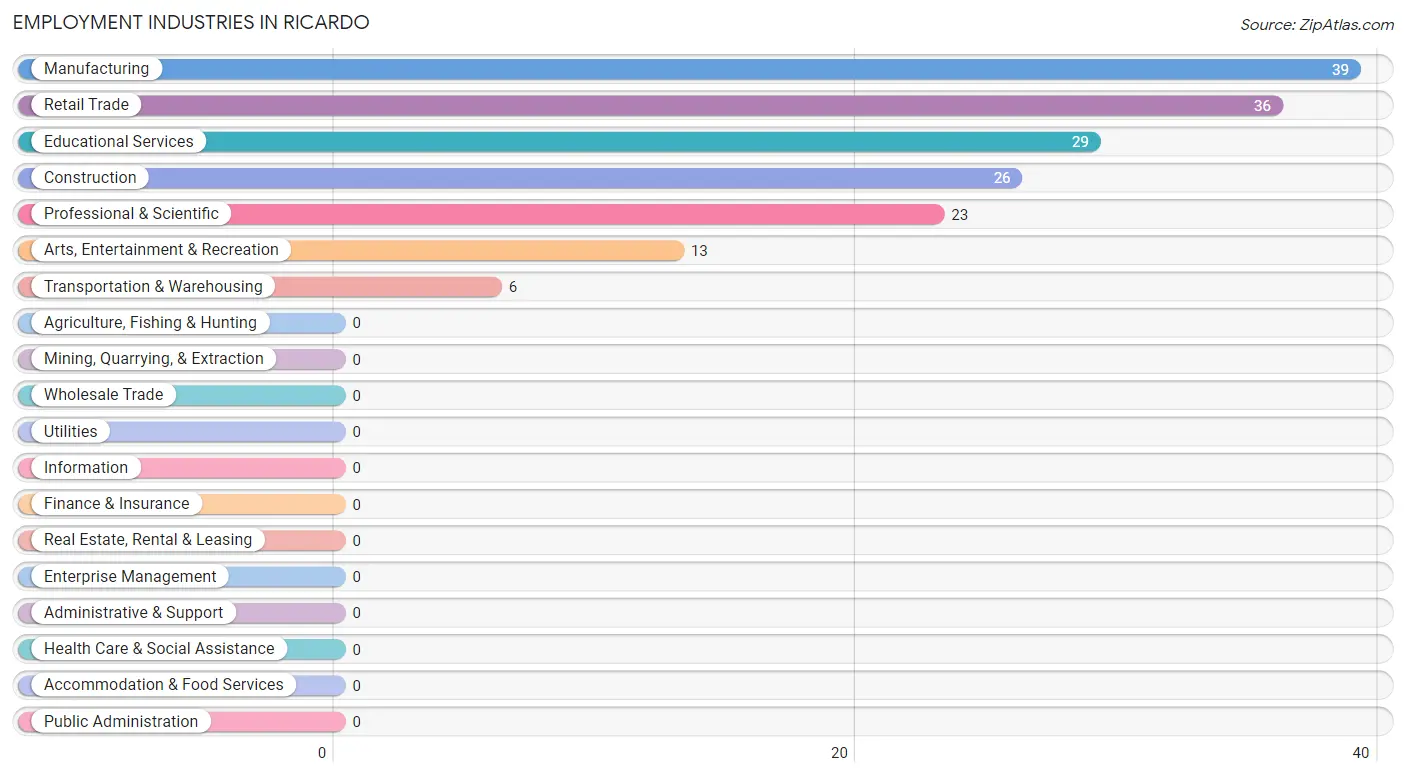
Employment Industries in Ricardo
The major employment industries in Ricardo include Manufacturing (39 | 22.7%), Retail Trade (36 | 20.9%), Educational Services (29 | 16.9%), Construction (26 | 15.1%), and Professional & Scientific (23 | 13.4%).
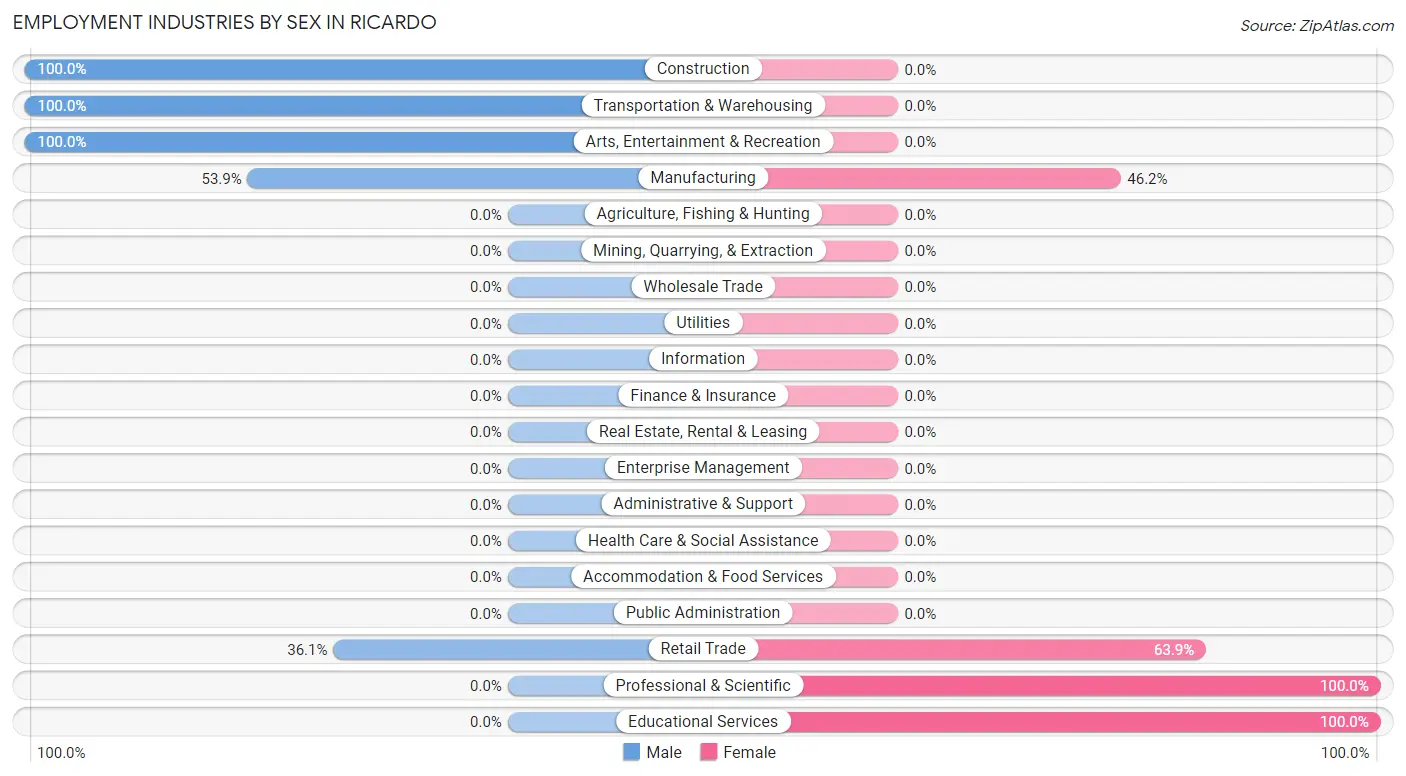
Employment Industries by Sex in Ricardo
The Ricardo industries that see more men than women are Construction (100.0%), Transportation & Warehousing (100.0%), and Arts, Entertainment & Recreation (100.0%), whereas the industries that tend to have a higher number of women are Professional & Scientific (100.0%), Educational Services (100.0%), and Retail Trade (63.9%).
| Industry | Male | Female |
| Agriculture, Fishing & Hunting | 0 (0.0%) | 0 (0.0%) |
| Mining, Quarrying, & Extraction | 0 (0.0%) | 0 (0.0%) |
| Construction | 26 (100.0%) | 0 (0.0%) |
| Manufacturing | 21 (53.8%) | 18 (46.2%) |
| Wholesale Trade | 0 (0.0%) | 0 (0.0%) |
| Retail Trade | 13 (36.1%) | 23 (63.9%) |
| Transportation & Warehousing | 6 (100.0%) | 0 (0.0%) |
| Utilities | 0 (0.0%) | 0 (0.0%) |
| Information | 0 (0.0%) | 0 (0.0%) |
| Finance & Insurance | 0 (0.0%) | 0 (0.0%) |
| Real Estate, Rental & Leasing | 0 (0.0%) | 0 (0.0%) |
| Professional & Scientific | 0 (0.0%) | 23 (100.0%) |
| Enterprise Management | 0 (0.0%) | 0 (0.0%) |
| Administrative & Support | 0 (0.0%) | 0 (0.0%) |
| Educational Services | 0 (0.0%) | 29 (100.0%) |
| Health Care & Social Assistance | 0 (0.0%) | 0 (0.0%) |
| Arts, Entertainment & Recreation | 13 (100.0%) | 0 (0.0%) |
| Accommodation & Food Services | 0 (0.0%) | 0 (0.0%) |
| Public Administration | 0 (0.0%) | 0 (0.0%) |
| Total | 79 (45.9%) | 93 (54.1%) |
Education in Ricardo
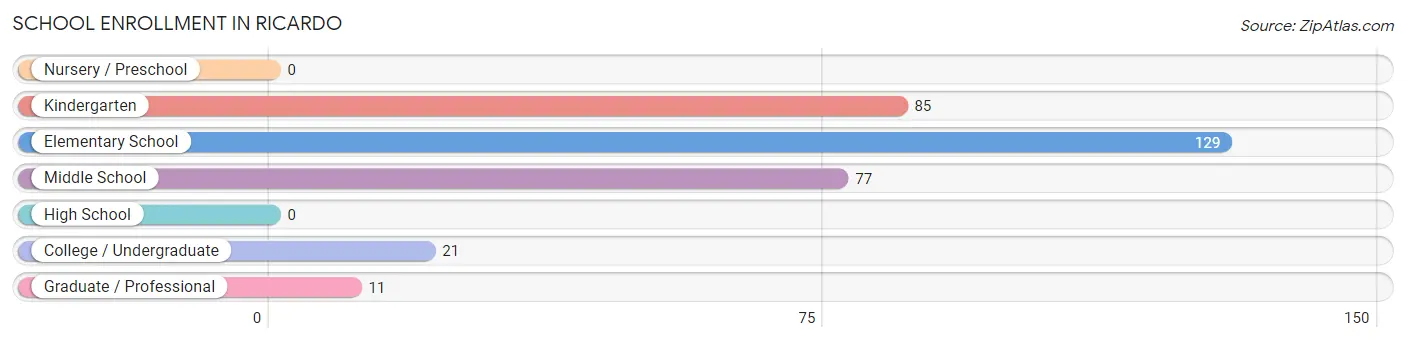
School Enrollment in Ricardo
The most common levels of schooling among the 323 students in Ricardo are elementary school (129 | 39.9%), kindergarten (85 | 26.3%), and middle school (77 | 23.8%).
| School Level | # Students | % Students |
| Nursery / Preschool | 0 | 0.0% |
| Kindergarten | 85 | 26.3% |
| Elementary School | 129 | 39.9% |
| Middle School | 77 | 23.8% |
| High School | 0 | 0.0% |
| College / Undergraduate | 21 | 6.5% |
| Graduate / Professional | 11 | 3.4% |
| Total | 323 | 100.0% |
School Enrollment by Age by Funding Source in Ricardo
Out of a total of 323 students who are enrolled in schools in Ricardo, 21 (6.5%) attend a private institution, while the remaining 302 (93.5%) are enrolled in public schools. The age group of 18 to 19 year olds has the highest likelihood of being enrolled in private schools, with 21 (100.0% in the age bracket) enrolled. Conversely, the age group of 5 to 9 year old has the lowest likelihood of being enrolled in a private school, with 214 (100.0% in the age bracket) attending a public institution.
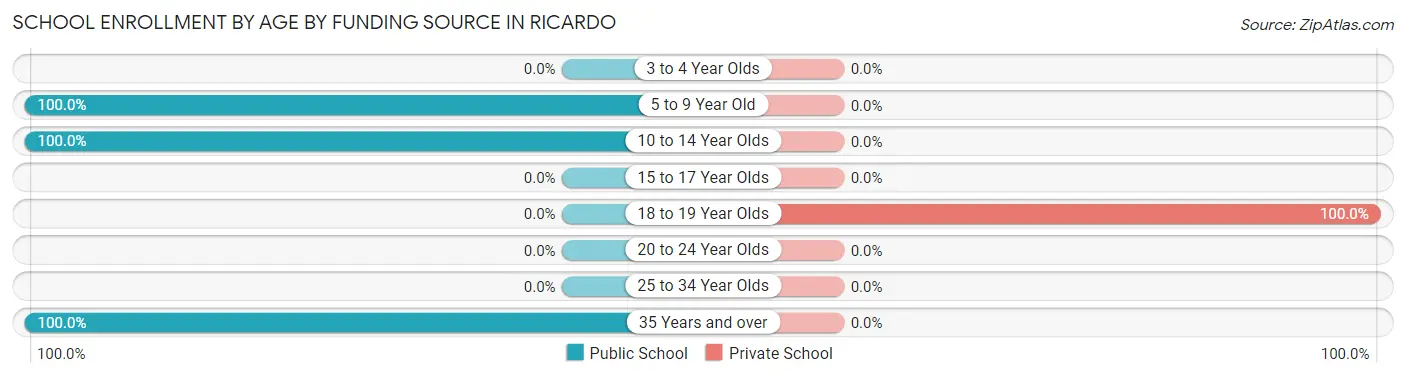
| Age Bracket | Public School | Private School |
| 3 to 4 Year Olds | 0 (0.0%) | 0 (0.0%) |
| 5 to 9 Year Old | 214 (100.0%) | 0 (0.0%) |
| 10 to 14 Year Olds | 77 (100.0%) | 0 (0.0%) |
| 15 to 17 Year Olds | 0 (0.0%) | 0 (0.0%) |
| 18 to 19 Year Olds | 0 (0.0%) | 21 (100.0%) |
| 20 to 24 Year Olds | 0 (0.0%) | 0 (0.0%) |
| 25 to 34 Year Olds | 0 (0.0%) | 0 (0.0%) |
| 35 Years and over | 11 (100.0%) | 0 (0.0%) |
| Total | 302 (93.5%) | 21 (6.5%) |
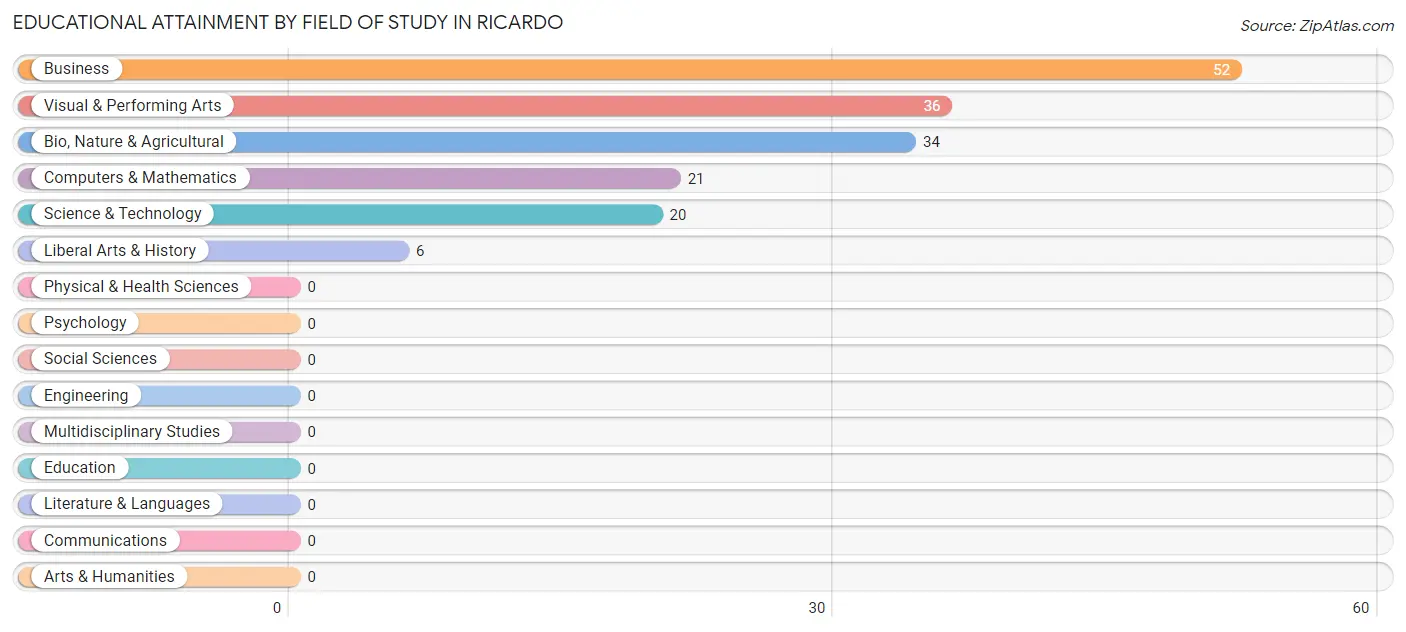
Educational Attainment by Field of Study in Ricardo
Business (52 | 30.8%), visual & performing arts (36 | 21.3%), bio, nature & agricultural (34 | 20.1%), computers & mathematics (21 | 12.4%), and science & technology (20 | 11.8%) are the most common fields of study among 169 individuals in Ricardo who have obtained a bachelor's degree or higher.
| Field of Study | # Graduates | % Graduates |
| Computers & Mathematics | 21 | 12.4% |
| Bio, Nature & Agricultural | 34 | 20.1% |
| Physical & Health Sciences | 0 | 0.0% |
| Psychology | 0 | 0.0% |
| Social Sciences | 0 | 0.0% |
| Engineering | 0 | 0.0% |
| Multidisciplinary Studies | 0 | 0.0% |
| Science & Technology | 20 | 11.8% |
| Business | 52 | 30.8% |
| Education | 0 | 0.0% |
| Literature & Languages | 0 | 0.0% |
| Liberal Arts & History | 6 | 3.5% |
| Visual & Performing Arts | 36 | 21.3% |
| Communications | 0 | 0.0% |
| Arts & Humanities | 0 | 0.0% |
| Total | 169 | 100.0% |
Transportation & Commute in Ricardo
Vehicle Availability by Sex in Ricardo
The most prevalent vehicle ownership categories in Ricardo are males with 2 vehicles (73, accounting for 92.4%) and females with 2 vehicles (36, making up 78.5%).
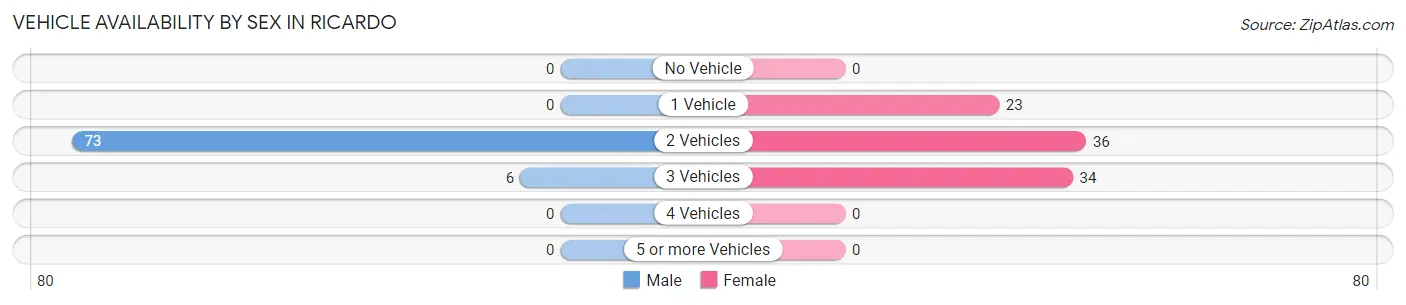
| Vehicles Available | Male | Female |
| No Vehicle | 0 (0.0%) | 0 (0.0%) |
| 1 Vehicle | 0 (0.0%) | 23 (24.7%) |
| 2 Vehicles | 73 (92.4%) | 36 (38.7%) |
| 3 Vehicles | 6 (7.6%) | 34 (36.6%) |
| 4 Vehicles | 0 (0.0%) | 0 (0.0%) |
| 5 or more Vehicles | 0 (0.0%) | 0 (0.0%) |
| Total | 79 (100.0%) | 93 (100.0%) |
Commute Time in Ricardo
The most frequently occuring commute durations in Ricardo are 15 to 19 minutes (85 commuters, 58.2%), 25 to 29 minutes (18 commuters, 12.3%), and 90 or more minutes (17 commuters, 11.6%).
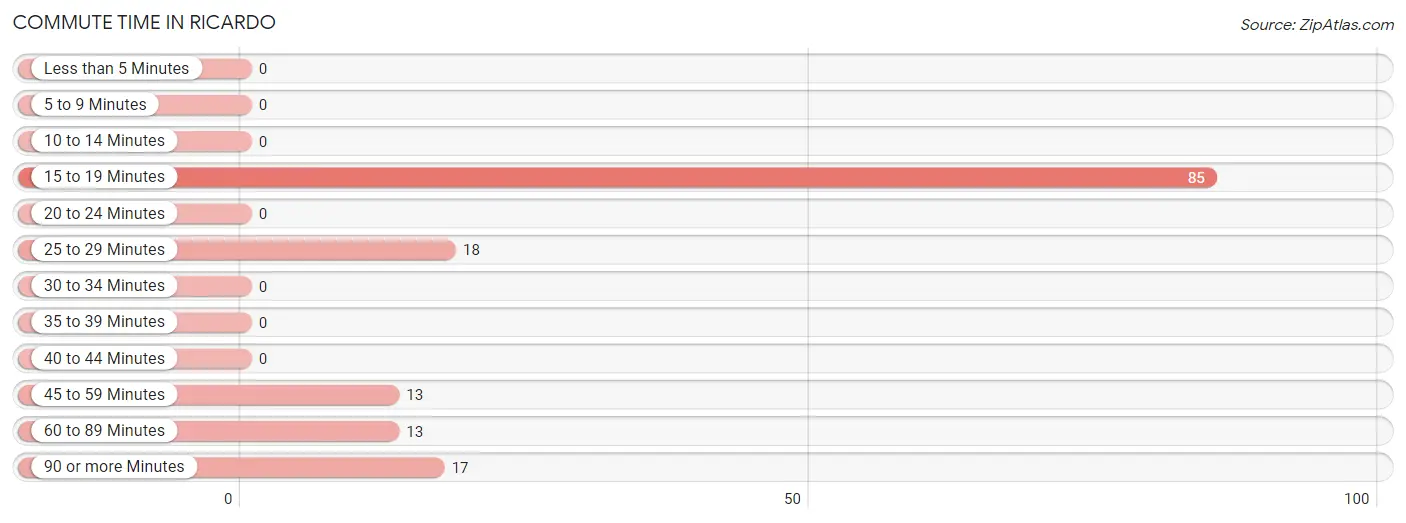
| Commute Time | # Commuters | % Commuters |
| Less than 5 Minutes | 0 | 0.0% |
| 5 to 9 Minutes | 0 | 0.0% |
| 10 to 14 Minutes | 0 | 0.0% |
| 15 to 19 Minutes | 85 | 58.2% |
| 20 to 24 Minutes | 0 | 0.0% |
| 25 to 29 Minutes | 18 | 12.3% |
| 30 to 34 Minutes | 0 | 0.0% |
| 35 to 39 Minutes | 0 | 0.0% |
| 40 to 44 Minutes | 0 | 0.0% |
| 45 to 59 Minutes | 13 | 8.9% |
| 60 to 89 Minutes | 13 | 8.9% |
| 90 or more Minutes | 17 | 11.6% |
Commute Time by Sex in Ricardo
The most common commute times in Ricardo are 15 to 19 minutes (21 commuters, 39.6%) for males and 15 to 19 minutes (64 commuters, 68.8%) for females.
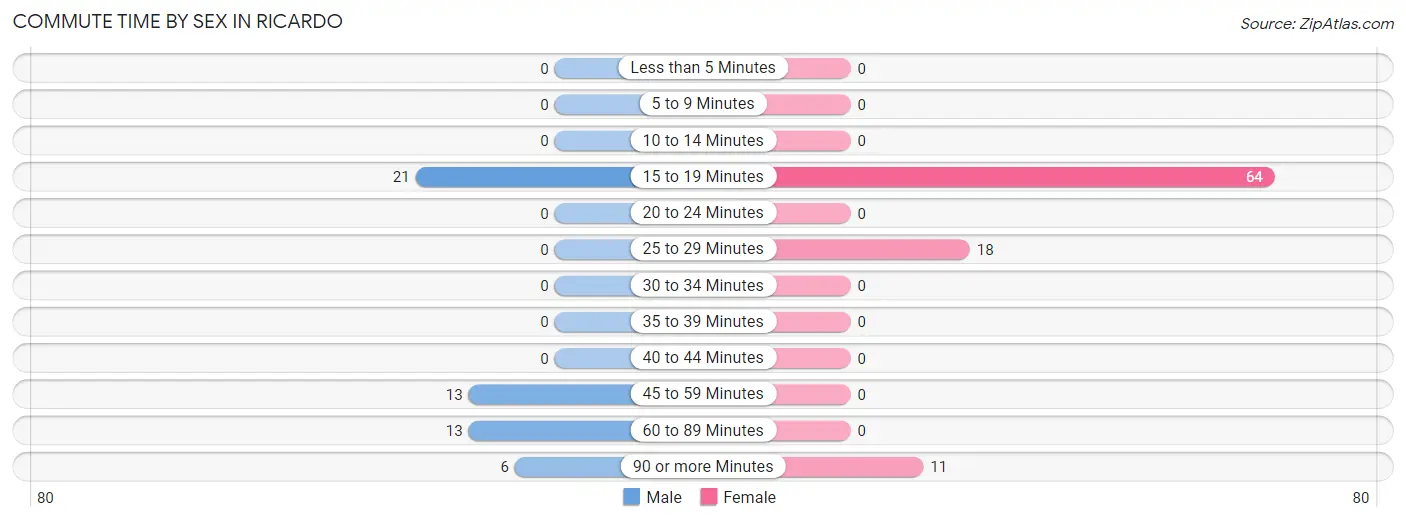
| Commute Time | Male | Female |
| Less than 5 Minutes | 0 (0.0%) | 0 (0.0%) |
| 5 to 9 Minutes | 0 (0.0%) | 0 (0.0%) |
| 10 to 14 Minutes | 0 (0.0%) | 0 (0.0%) |
| 15 to 19 Minutes | 21 (39.6%) | 64 (68.8%) |
| 20 to 24 Minutes | 0 (0.0%) | 0 (0.0%) |
| 25 to 29 Minutes | 0 (0.0%) | 18 (19.4%) |
| 30 to 34 Minutes | 0 (0.0%) | 0 (0.0%) |
| 35 to 39 Minutes | 0 (0.0%) | 0 (0.0%) |
| 40 to 44 Minutes | 0 (0.0%) | 0 (0.0%) |
| 45 to 59 Minutes | 13 (24.5%) | 0 (0.0%) |
| 60 to 89 Minutes | 13 (24.5%) | 0 (0.0%) |
| 90 or more Minutes | 6 (11.3%) | 11 (11.8%) |
Time of Departure to Work by Sex in Ricardo
The most frequent times of departure to work in Ricardo are 12:00 AM to 4:59 AM (34, 64.1%) for males and 7:00 AM to 7:29 AM (29, 31.2%) for females.
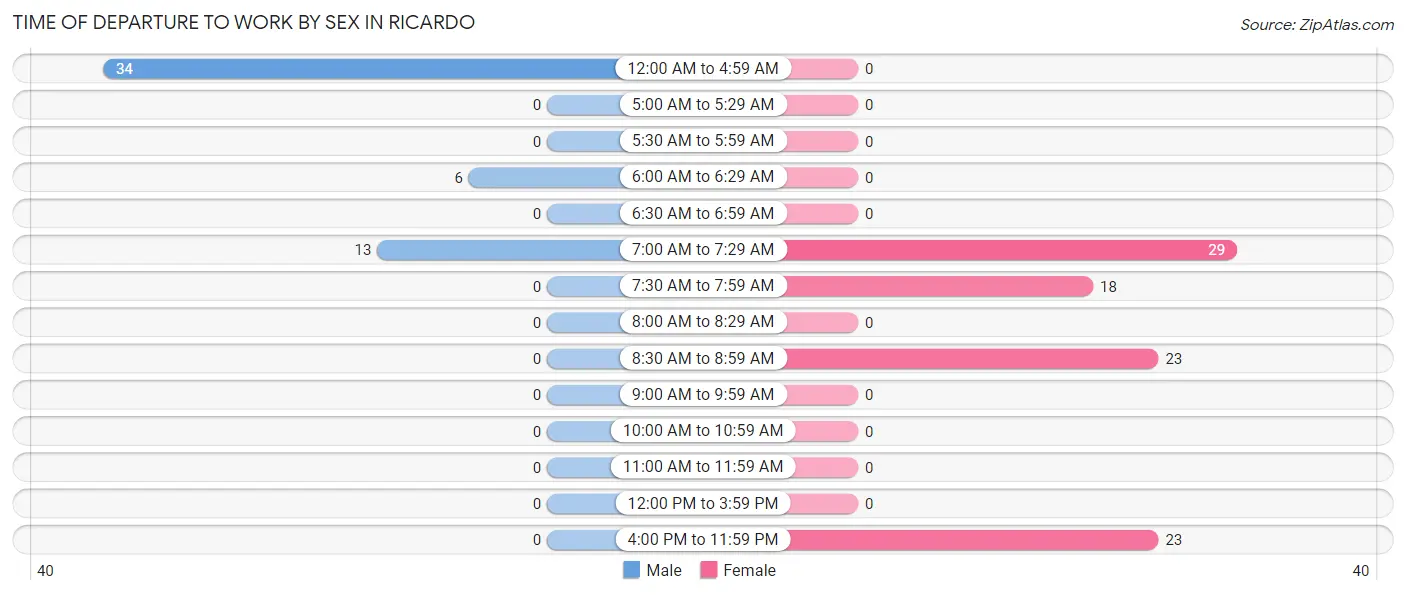
| Time of Departure | Male | Female |
| 12:00 AM to 4:59 AM | 34 (64.1%) | 0 (0.0%) |
| 5:00 AM to 5:29 AM | 0 (0.0%) | 0 (0.0%) |
| 5:30 AM to 5:59 AM | 0 (0.0%) | 0 (0.0%) |
| 6:00 AM to 6:29 AM | 6 (11.3%) | 0 (0.0%) |
| 6:30 AM to 6:59 AM | 0 (0.0%) | 0 (0.0%) |
| 7:00 AM to 7:29 AM | 13 (24.5%) | 29 (31.2%) |
| 7:30 AM to 7:59 AM | 0 (0.0%) | 18 (19.4%) |
| 8:00 AM to 8:29 AM | 0 (0.0%) | 0 (0.0%) |
| 8:30 AM to 8:59 AM | 0 (0.0%) | 23 (24.7%) |
| 9:00 AM to 9:59 AM | 0 (0.0%) | 0 (0.0%) |
| 10:00 AM to 10:59 AM | 0 (0.0%) | 0 (0.0%) |
| 11:00 AM to 11:59 AM | 0 (0.0%) | 0 (0.0%) |
| 12:00 PM to 3:59 PM | 0 (0.0%) | 0 (0.0%) |
| 4:00 PM to 11:59 PM | 0 (0.0%) | 23 (24.7%) |
| Total | 53 (100.0%) | 93 (100.0%) |
Housing Occupancy in Ricardo
Occupancy by Ownership in Ricardo
Of the total 244 dwellings in Ricardo, owner-occupied units account for 227 (93.0%), while renter-occupied units make up 17 (7.0%).
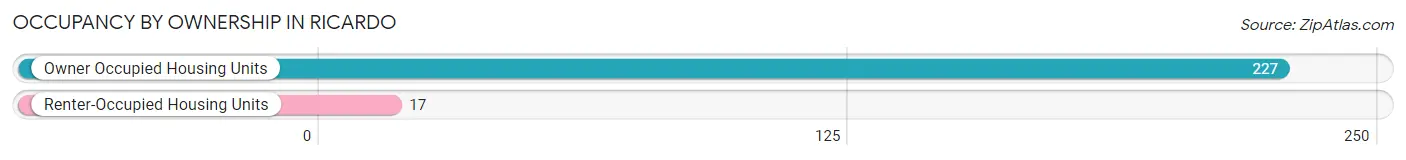
| Occupancy | # Housing Units | % Housing Units |
| Owner Occupied Housing Units | 227 | 93.0% |
| Renter-Occupied Housing Units | 17 | 7.0% |
| Total Occupied Housing Units | 244 | 100.0% |
Occupancy by Household Size in Ricardo
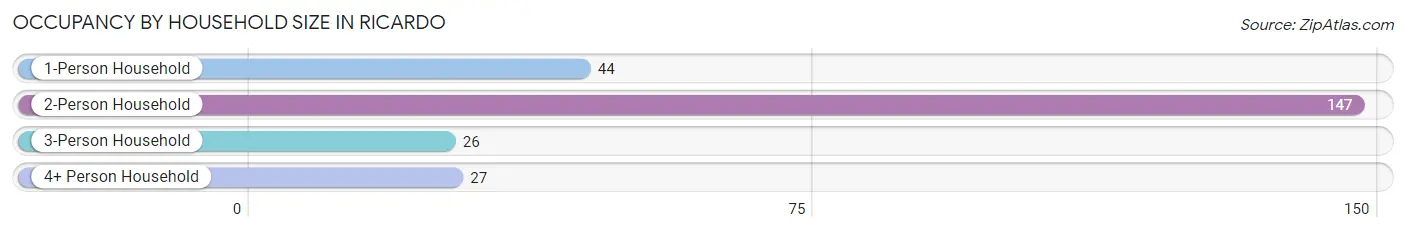
| Household Size | # Housing Units | % Housing Units |
| 1-Person Household | 44 | 18.0% |
| 2-Person Household | 147 | 60.3% |
| 3-Person Household | 26 | 10.7% |
| 4+ Person Household | 27 | 11.1% |
| Total Housing Units | 244 | 100.0% |
Occupancy by Ownership by Household Size in Ricardo
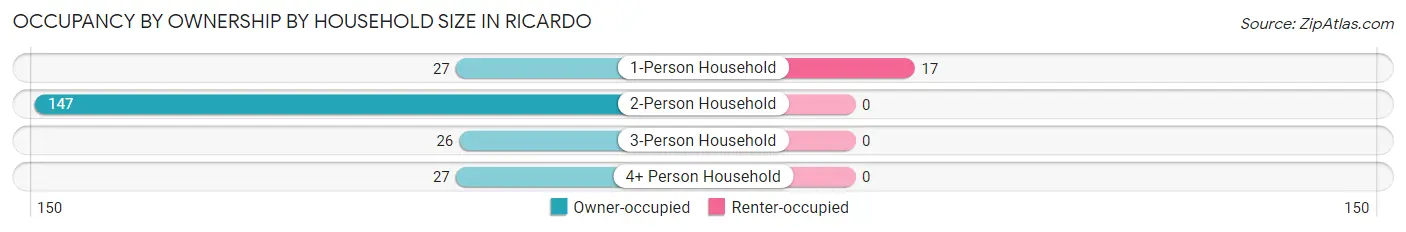
| Household Size | Owner-occupied | Renter-occupied |
| 1-Person Household | 27 (61.4%) | 17 (38.6%) |
| 2-Person Household | 147 (100.0%) | 0 (0.0%) |
| 3-Person Household | 26 (100.0%) | 0 (0.0%) |
| 4+ Person Household | 27 (100.0%) | 0 (0.0%) |
| Total Housing Units | 227 (93.0%) | 17 (7.0%) |
Occupancy by Educational Attainment in Ricardo
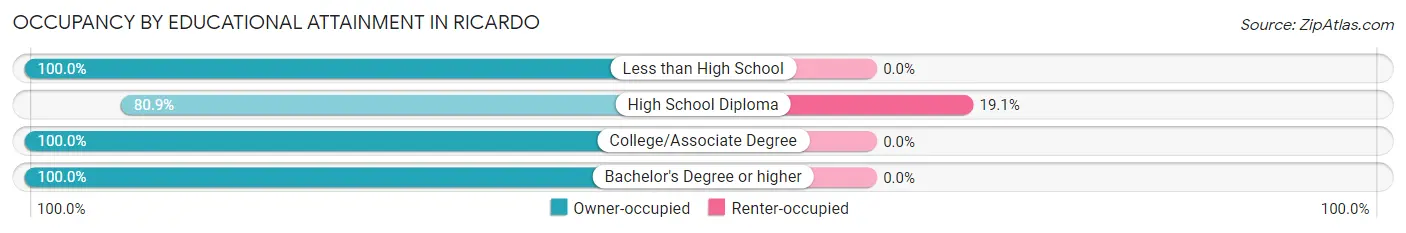
| Household Size | Owner-occupied | Renter-occupied |
| Less than High School | 64 (100.0%) | 0 (0.0%) |
| High School Diploma | 72 (80.9%) | 17 (19.1%) |
| College/Associate Degree | 7 (100.0%) | 0 (0.0%) |
| Bachelor's Degree or higher | 84 (100.0%) | 0 (0.0%) |
Occupancy by Age of Householder in Ricardo
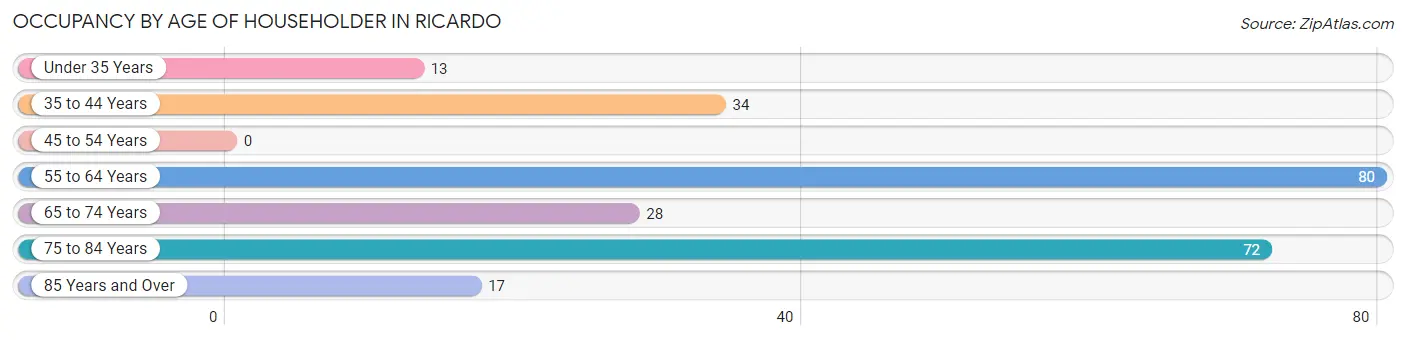
| Age Bracket | # Households | % Households |
| Under 35 Years | 13 | 5.3% |
| 35 to 44 Years | 34 | 13.9% |
| 45 to 54 Years | 0 | 0.0% |
| 55 to 64 Years | 80 | 32.8% |
| 65 to 74 Years | 28 | 11.5% |
| 75 to 84 Years | 72 | 29.5% |
| 85 Years and Over | 17 | 7.0% |
| Total | 244 | 100.0% |
Housing Finances in Ricardo
Median Income by Occupancy in Ricardo
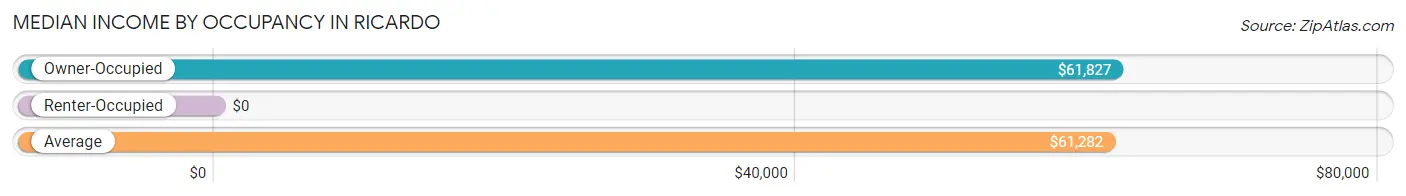
| Occupancy Type | # Households | Median Income |
| Owner-Occupied | 227 (93.0%) | $61,827 |
| Renter-Occupied | 17 (7.0%) | $0 |
| Average | 244 (100.0%) | $61,282 |
Occupancy by Householder Income Bracket in Ricardo
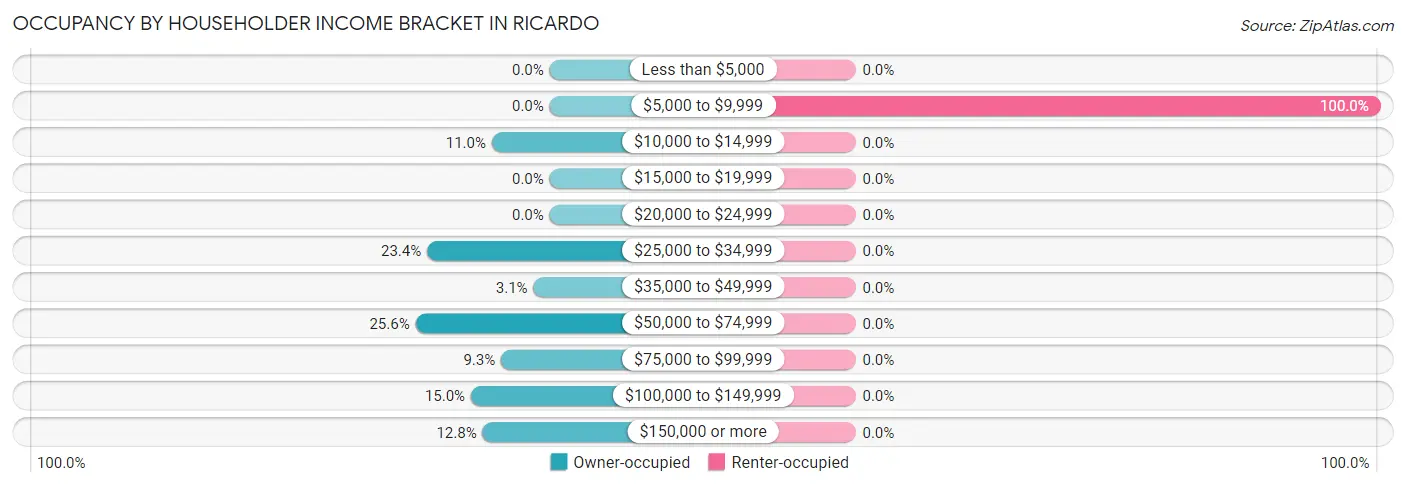
| Income Bracket | Owner-occupied | Renter-occupied |
| Less than $5,000 | 0 (0.0%) | 0 (0.0%) |
| $5,000 to $9,999 | 0 (0.0%) | 17 (100.0%) |
| $10,000 to $14,999 | 25 (11.0%) | 0 (0.0%) |
| $15,000 to $19,999 | 0 (0.0%) | 0 (0.0%) |
| $20,000 to $24,999 | 0 (0.0%) | 0 (0.0%) |
| $25,000 to $34,999 | 53 (23.4%) | 0 (0.0%) |
| $35,000 to $49,999 | 7 (3.1%) | 0 (0.0%) |
| $50,000 to $74,999 | 58 (25.6%) | 0 (0.0%) |
| $75,000 to $99,999 | 21 (9.2%) | 0 (0.0%) |
| $100,000 to $149,999 | 34 (15.0%) | 0 (0.0%) |
| $150,000 or more | 29 (12.8%) | 0 (0.0%) |
| Total | 227 (100.0%) | 17 (100.0%) |
Monthly Housing Cost Tiers in Ricardo
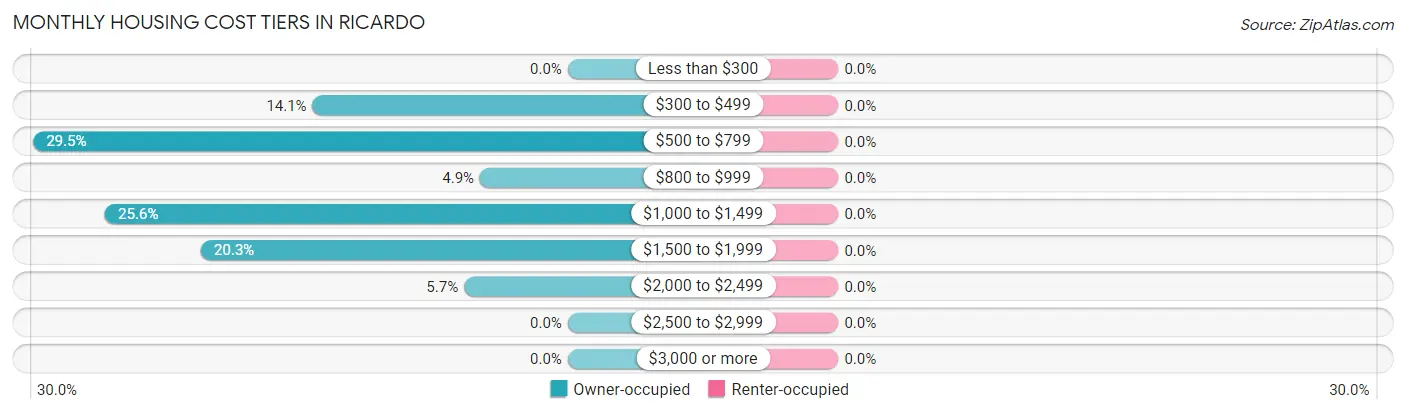
| Monthly Cost | Owner-occupied | Renter-occupied |
| Less than $300 | 0 (0.0%) | 0 (0.0%) |
| $300 to $499 | 32 (14.1%) | 0 (0.0%) |
| $500 to $799 | 67 (29.5%) | 0 (0.0%) |
| $800 to $999 | 11 (4.9%) | 0 (0.0%) |
| $1,000 to $1,499 | 58 (25.6%) | 0 (0.0%) |
| $1,500 to $1,999 | 46 (20.3%) | 0 (0.0%) |
| $2,000 to $2,499 | 13 (5.7%) | 0 (0.0%) |
| $2,500 to $2,999 | 0 (0.0%) | 0 (0.0%) |
| $3,000 or more | 0 (0.0%) | 0 (0.0%) |
| Total | 227 (100.0%) | 17 (100.0%) |
Physical Housing Characteristics in Ricardo
Housing Structures in Ricardo
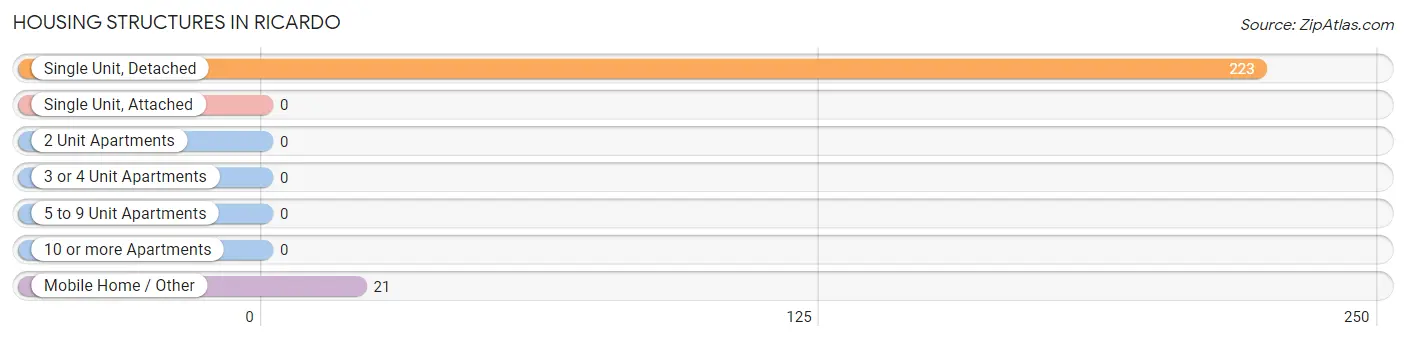
| Structure Type | # Housing Units | % Housing Units |
| Single Unit, Detached | 223 | 91.4% |
| Single Unit, Attached | 0 | 0.0% |
| 2 Unit Apartments | 0 | 0.0% |
| 3 or 4 Unit Apartments | 0 | 0.0% |
| 5 to 9 Unit Apartments | 0 | 0.0% |
| 10 or more Apartments | 0 | 0.0% |
| Mobile Home / Other | 21 | 8.6% |
| Total | 244 | 100.0% |
Housing Structures by Occupancy in Ricardo
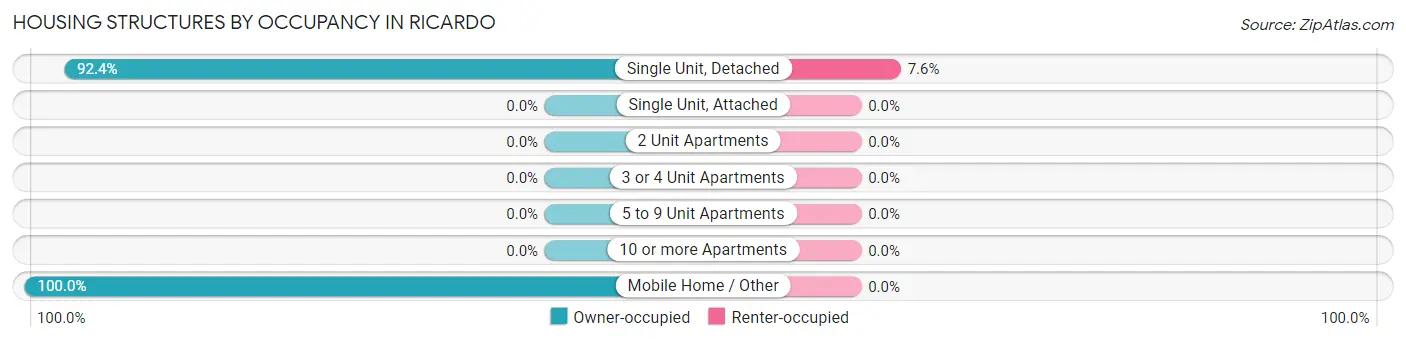
| Structure Type | Owner-occupied | Renter-occupied |
| Single Unit, Detached | 206 (92.4%) | 17 (7.6%) |
| Single Unit, Attached | 0 (0.0%) | 0 (0.0%) |
| 2 Unit Apartments | 0 (0.0%) | 0 (0.0%) |
| 3 or 4 Unit Apartments | 0 (0.0%) | 0 (0.0%) |
| 5 to 9 Unit Apartments | 0 (0.0%) | 0 (0.0%) |
| 10 or more Apartments | 0 (0.0%) | 0 (0.0%) |
| Mobile Home / Other | 21 (100.0%) | 0 (0.0%) |
| Total | 227 (93.0%) | 17 (7.0%) |
Housing Structures by Number of Rooms in Ricardo
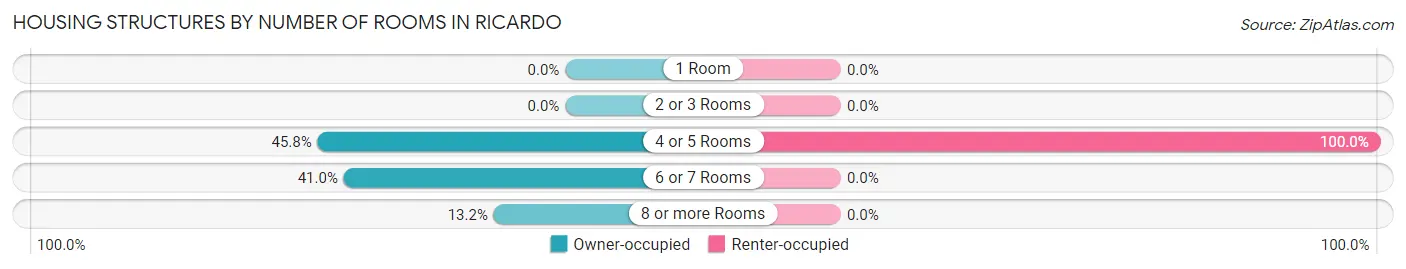
| Number of Rooms | Owner-occupied | Renter-occupied |
| 1 Room | 0 (0.0%) | 0 (0.0%) |
| 2 or 3 Rooms | 0 (0.0%) | 0 (0.0%) |
| 4 or 5 Rooms | 104 (45.8%) | 17 (100.0%) |
| 6 or 7 Rooms | 93 (41.0%) | 0 (0.0%) |
| 8 or more Rooms | 30 (13.2%) | 0 (0.0%) |
| Total | 227 (100.0%) | 17 (100.0%) |
Housing Structure by Heating Type in Ricardo
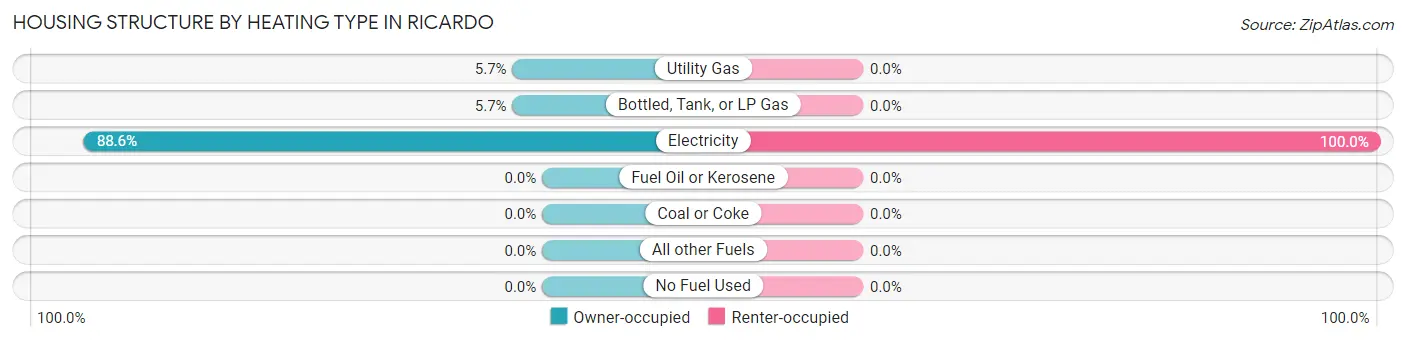
| Heating Type | Owner-occupied | Renter-occupied |
| Utility Gas | 13 (5.7%) | 0 (0.0%) |
| Bottled, Tank, or LP Gas | 13 (5.7%) | 0 (0.0%) |
| Electricity | 201 (88.5%) | 17 (100.0%) |
| Fuel Oil or Kerosene | 0 (0.0%) | 0 (0.0%) |
| Coal or Coke | 0 (0.0%) | 0 (0.0%) |
| All other Fuels | 0 (0.0%) | 0 (0.0%) |
| No Fuel Used | 0 (0.0%) | 0 (0.0%) |
| Total | 227 (100.0%) | 17 (100.0%) |
Household Vehicle Usage in Ricardo
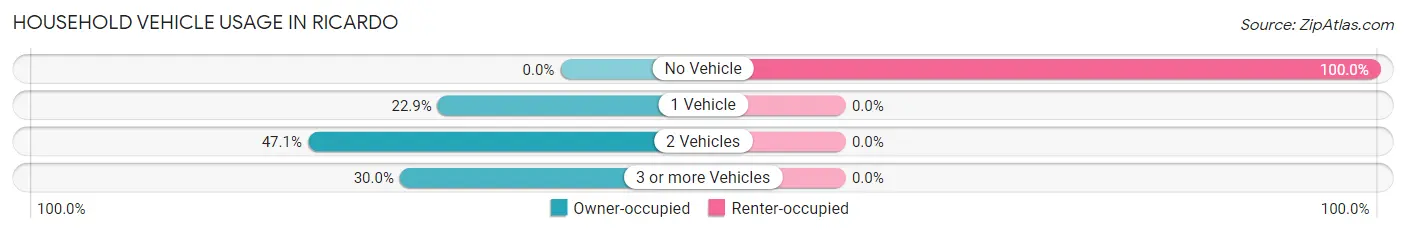
| Vehicles per Household | Owner-occupied | Renter-occupied |
| No Vehicle | 0 (0.0%) | 17 (100.0%) |
| 1 Vehicle | 52 (22.9%) | 0 (0.0%) |
| 2 Vehicles | 107 (47.1%) | 0 (0.0%) |
| 3 or more Vehicles | 68 (30.0%) | 0 (0.0%) |
| Total | 227 (100.0%) | 17 (100.0%) |
Real Estate & Mortgages in Ricardo
Real Estate and Mortgage Overview in Ricardo
| Characteristic | Without Mortgage | With Mortgage |
| Housing Units | 143 | 84 |
| Median Property Value | $161,900 | $314,300 |
| Median Household Income | - | - |
| Monthly Housing Costs | $640 | $0 |
| Real Estate Taxes | - | - |
Property Value by Mortgage Status in Ricardo
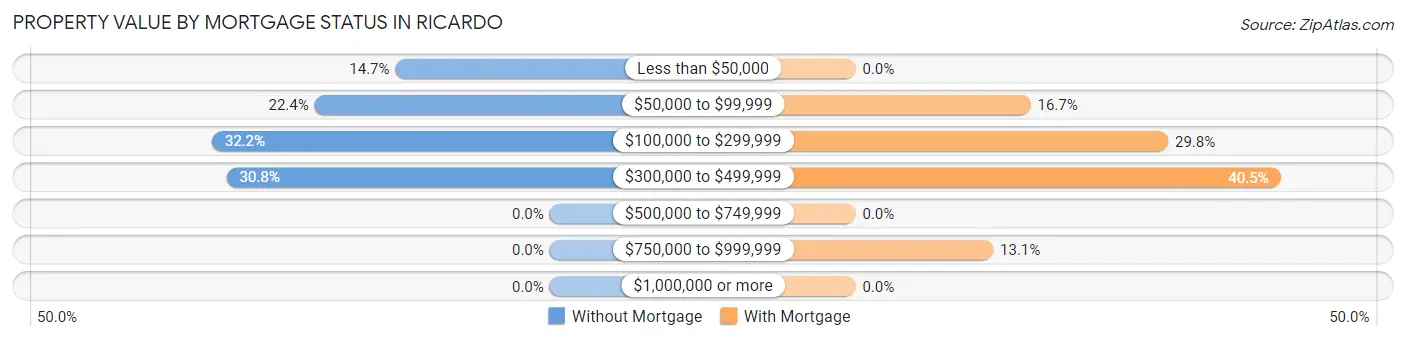
| Property Value | Without Mortgage | With Mortgage |
| Less than $50,000 | 21 (14.7%) | 0 (0.0%) |
| $50,000 to $99,999 | 32 (22.4%) | 14 (16.7%) |
| $100,000 to $299,999 | 46 (32.2%) | 25 (29.8%) |
| $300,000 to $499,999 | 44 (30.8%) | 34 (40.5%) |
| $500,000 to $749,999 | 0 (0.0%) | 0 (0.0%) |
| $750,000 to $999,999 | 0 (0.0%) | 11 (13.1%) |
| $1,000,000 or more | 0 (0.0%) | 0 (0.0%) |
| Total | 143 (100.0%) | 84 (100.0%) |
Household Income by Mortgage Status in Ricardo
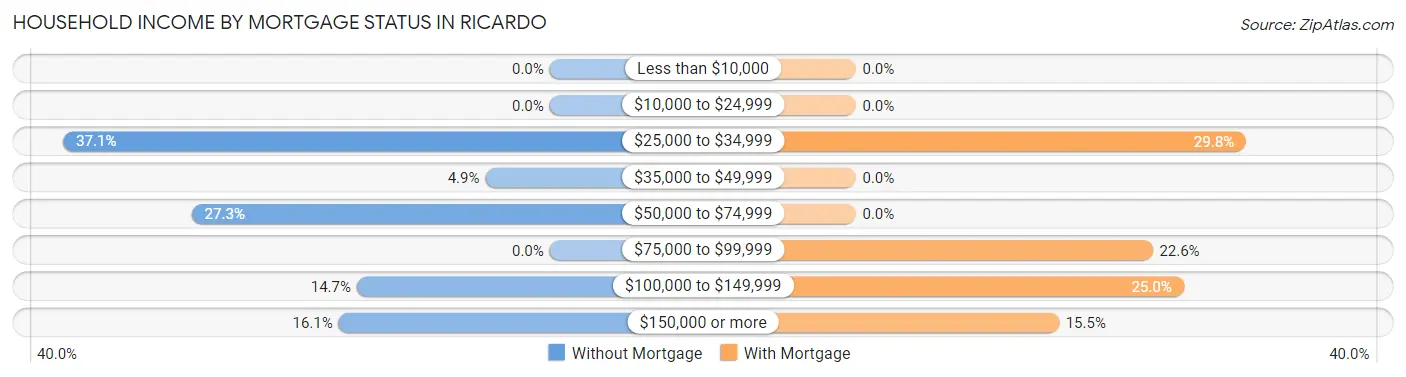
| Household Income | Without Mortgage | With Mortgage |
| Less than $10,000 | 0 (0.0%) | 0 (0.0%) |
| $10,000 to $24,999 | 0 (0.0%) | 0 (0.0%) |
| $25,000 to $34,999 | 53 (37.1%) | 25 (29.8%) |
| $35,000 to $49,999 | 7 (4.9%) | 0 (0.0%) |
| $50,000 to $74,999 | 39 (27.3%) | 0 (0.0%) |
| $75,000 to $99,999 | 0 (0.0%) | 19 (22.6%) |
| $100,000 to $149,999 | 21 (14.7%) | 21 (25.0%) |
| $150,000 or more | 23 (16.1%) | 13 (15.5%) |
| Total | 143 (100.0%) | 84 (100.0%) |
Property Value to Household Income Ratio in Ricardo
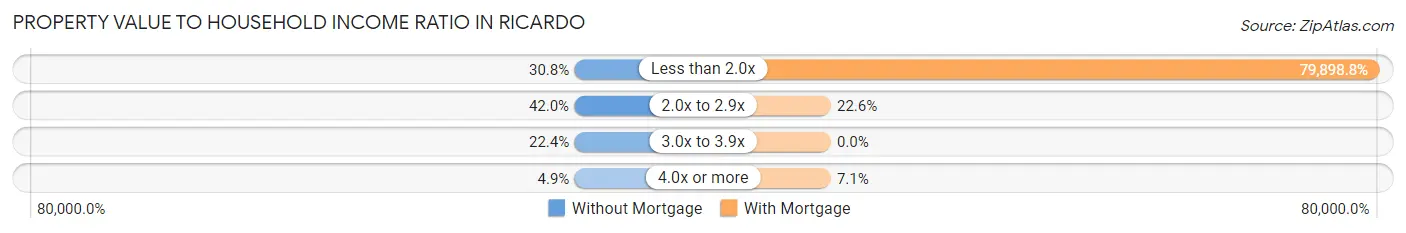
| Value-to-Income Ratio | Without Mortgage | With Mortgage |
| Less than 2.0x | 44 (30.8%) | 67,115 (79,898.8%) |
| 2.0x to 2.9x | 60 (42.0%) | 19 (22.6%) |
| 3.0x to 3.9x | 32 (22.4%) | 0 (0.0%) |
| 4.0x or more | 7 (4.9%) | 6 (7.1%) |
| Total | 143 (100.0%) | 84 (100.0%) |
Real Estate Taxes by Mortgage Status in Ricardo
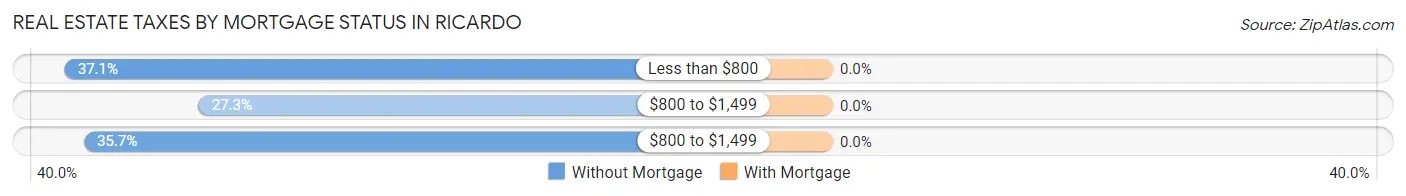
| Property Taxes | Without Mortgage | With Mortgage |
| Less than $800 | 53 (37.1%) | 0 (0.0%) |
| $800 to $1,499 | 39 (27.3%) | 0 (0.0%) |
| $800 to $1,499 | 51 (35.7%) | 0 (0.0%) |
| Total | 143 (100.0%) | 84 (100.0%) |
Health & Disability in Ricardo
Health Insurance Coverage by Age in Ricardo
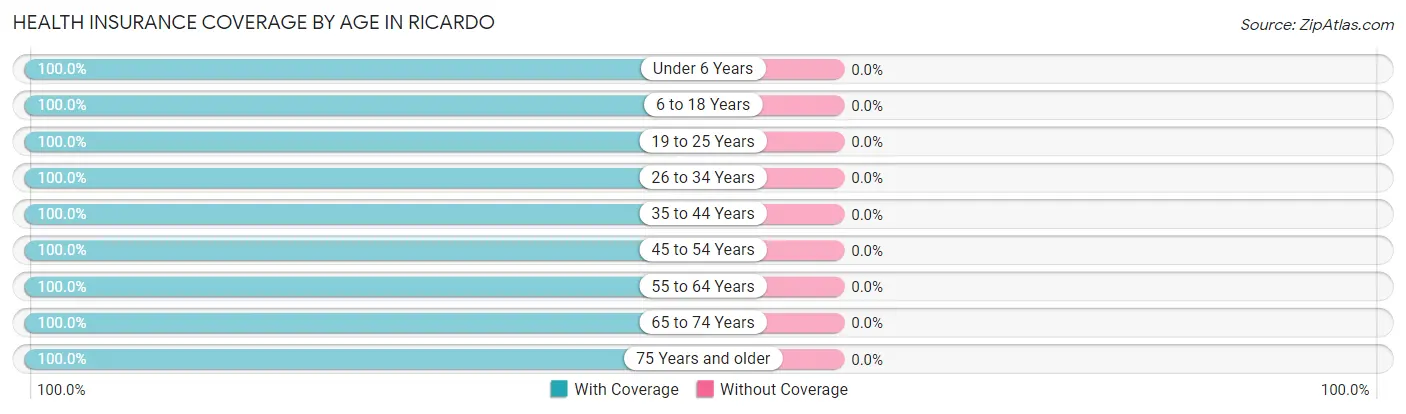
| Age Bracket | With Coverage | Without Coverage |
| Under 6 Years | 146 (100.0%) | 0 (0.0%) |
| 6 to 18 Years | 206 (100.0%) | 0 (0.0%) |
| 19 to 25 Years | 21 (100.0%) | 0 (0.0%) |
| 26 to 34 Years | 13 (100.0%) | 0 (0.0%) |
| 35 to 44 Years | 81 (100.0%) | 0 (0.0%) |
| 45 to 54 Years | 32 (100.0%) | 0 (0.0%) |
| 55 to 64 Years | 106 (100.0%) | 0 (0.0%) |
| 65 to 74 Years | 52 (100.0%) | 0 (0.0%) |
| 75 Years and older | 162 (100.0%) | 0 (0.0%) |
| Total | 819 (100.0%) | 0 (0.0%) |
Health Insurance Coverage by Citizenship Status in Ricardo
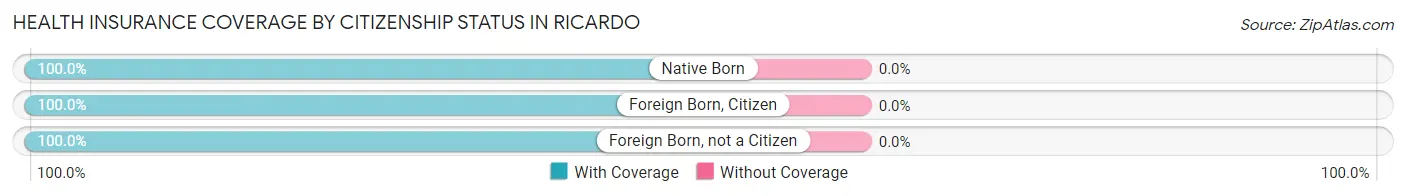
| Citizenship Status | With Coverage | Without Coverage |
| Native Born | 146 (100.0%) | 0 (0.0%) |
| Foreign Born, Citizen | 206 (100.0%) | 0 (0.0%) |
| Foreign Born, not a Citizen | 21 (100.0%) | 0 (0.0%) |
Health Insurance Coverage by Household Income in Ricardo
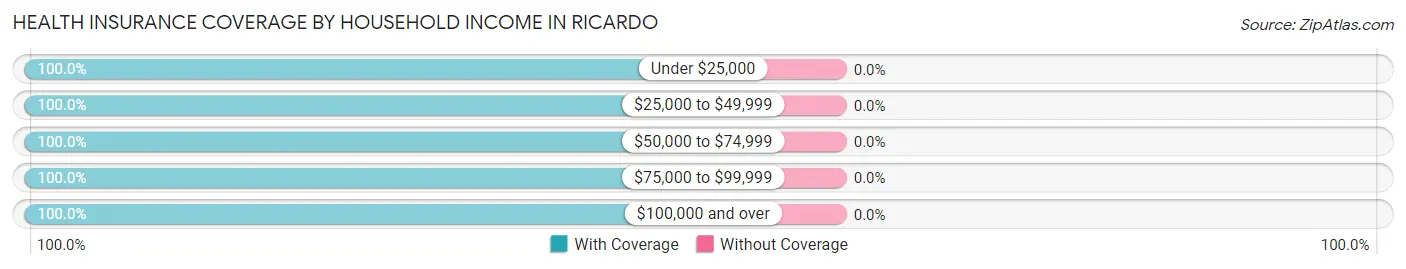
| Household Income | With Coverage | Without Coverage |
| Under $25,000 | 72 (100.0%) | 0 (0.0%) |
| $25,000 to $49,999 | 446 (100.0%) | 0 (0.0%) |
| $50,000 to $74,999 | 118 (100.0%) | 0 (0.0%) |
| $75,000 to $99,999 | 33 (100.0%) | 0 (0.0%) |
| $100,000 and over | 150 (100.0%) | 0 (0.0%) |
Public vs Private Health Insurance Coverage by Age in Ricardo
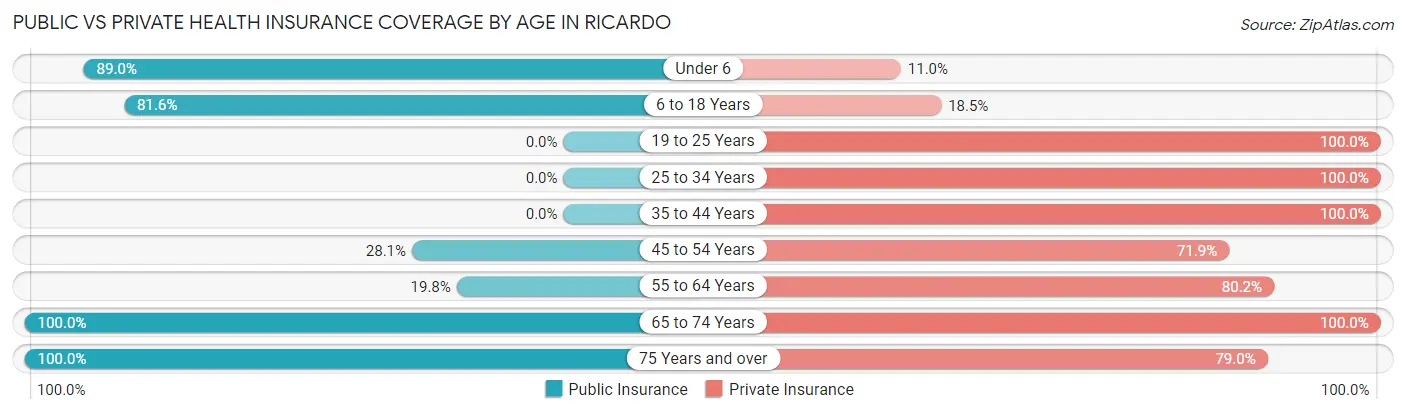
| Age Bracket | Public Insurance | Private Insurance |
| Under 6 | 130 (89.0%) | 16 (11.0%) |
| 6 to 18 Years | 168 (81.6%) | 38 (18.4%) |
| 19 to 25 Years | 0 (0.0%) | 21 (100.0%) |
| 25 to 34 Years | 0 (0.0%) | 13 (100.0%) |
| 35 to 44 Years | 0 (0.0%) | 81 (100.0%) |
| 45 to 54 Years | 9 (28.1%) | 23 (71.9%) |
| 55 to 64 Years | 21 (19.8%) | 85 (80.2%) |
| 65 to 74 Years | 52 (100.0%) | 52 (100.0%) |
| 75 Years and over | 162 (100.0%) | 128 (79.0%) |
| Total | 542 (66.2%) | 457 (55.8%) |
Disability Status by Sex by Age in Ricardo
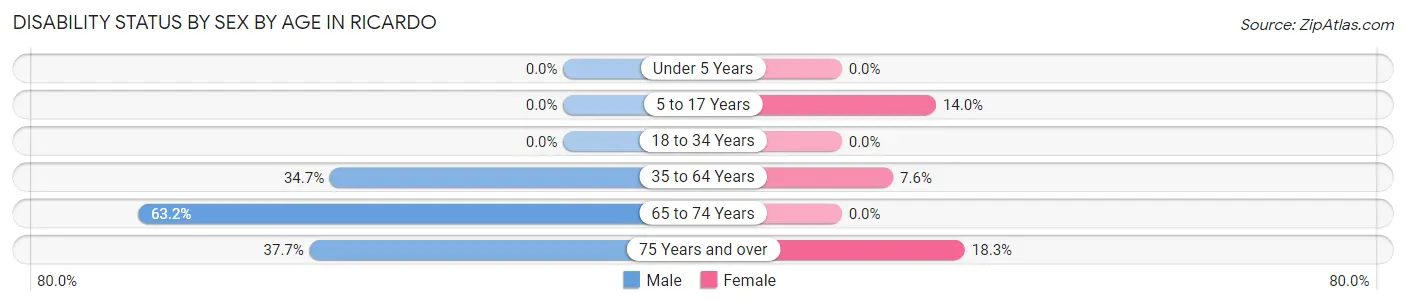
| Age Bracket | Male | Female |
| Under 5 Years | 0 (0.0%) | 0 (0.0%) |
| 5 to 17 Years | 0 (0.0%) | 39 (14.0%) |
| 18 to 34 Years | 0 (0.0%) | 0 (0.0%) |
| 35 to 64 Years | 35 (34.6%) | 9 (7.6%) |
| 65 to 74 Years | 12 (63.2%) | 0 (0.0%) |
| 75 Years and over | 26 (37.7%) | 17 (18.3%) |
Disability Class by Sex by Age in Ricardo
Disability Class: Hearing Difficulty
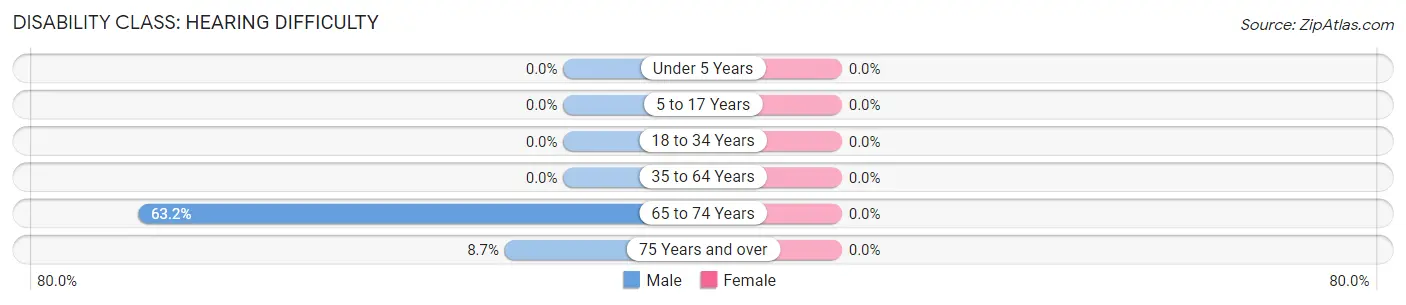
| Age Bracket | Male | Female |
| Under 5 Years | 0 (0.0%) | 0 (0.0%) |
| 5 to 17 Years | 0 (0.0%) | 0 (0.0%) |
| 18 to 34 Years | 0 (0.0%) | 0 (0.0%) |
| 35 to 64 Years | 0 (0.0%) | 0 (0.0%) |
| 65 to 74 Years | 12 (63.2%) | 0 (0.0%) |
| 75 Years and over | 6 (8.7%) | 0 (0.0%) |
Disability Class: Vision Difficulty
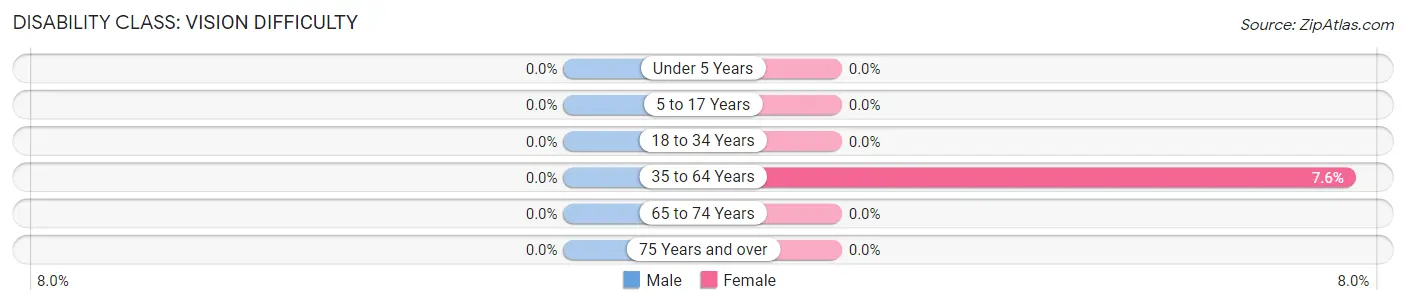
| Age Bracket | Male | Female |
| Under 5 Years | 0 (0.0%) | 0 (0.0%) |
| 5 to 17 Years | 0 (0.0%) | 0 (0.0%) |
| 18 to 34 Years | 0 (0.0%) | 0 (0.0%) |
| 35 to 64 Years | 0 (0.0%) | 9 (7.6%) |
| 65 to 74 Years | 0 (0.0%) | 0 (0.0%) |
| 75 Years and over | 0 (0.0%) | 0 (0.0%) |
Disability Class: Cognitive Difficulty
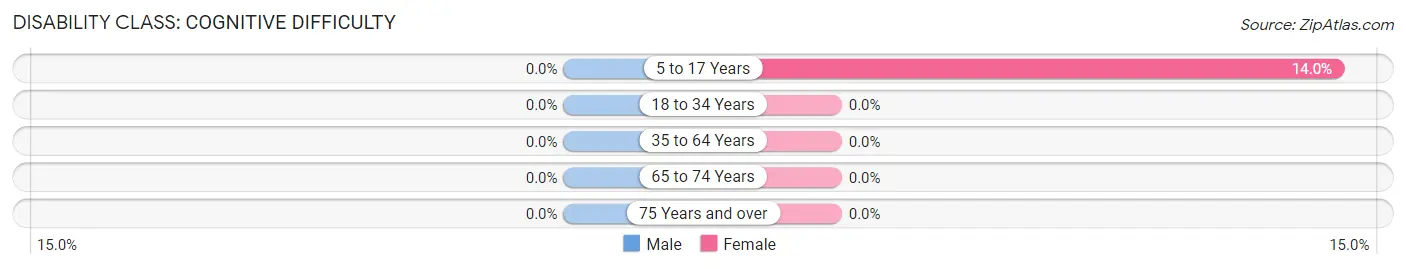
| Age Bracket | Male | Female |
| 5 to 17 Years | 0 (0.0%) | 39 (14.0%) |
| 18 to 34 Years | 0 (0.0%) | 0 (0.0%) |
| 35 to 64 Years | 0 (0.0%) | 0 (0.0%) |
| 65 to 74 Years | 0 (0.0%) | 0 (0.0%) |
| 75 Years and over | 0 (0.0%) | 0 (0.0%) |
Disability Class: Ambulatory Difficulty
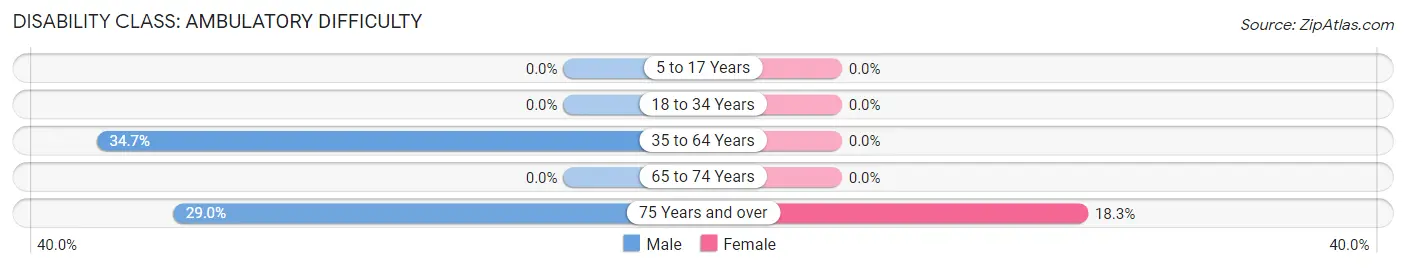
| Age Bracket | Male | Female |
| 5 to 17 Years | 0 (0.0%) | 0 (0.0%) |
| 18 to 34 Years | 0 (0.0%) | 0 (0.0%) |
| 35 to 64 Years | 35 (34.6%) | 0 (0.0%) |
| 65 to 74 Years | 0 (0.0%) | 0 (0.0%) |
| 75 Years and over | 20 (29.0%) | 17 (18.3%) |
Disability Class: Self-Care Difficulty
| Age Bracket | Male | Female |
| 5 to 17 Years | 0 (0.0%) | 0 (0.0%) |
| 18 to 34 Years | 0 (0.0%) | 0 (0.0%) |
| 35 to 64 Years | 0 (0.0%) | 0 (0.0%) |
| 65 to 74 Years | 0 (0.0%) | 0 (0.0%) |
| 75 Years and over | 0 (0.0%) | 0 (0.0%) |
Technology Access in Ricardo
Computing Device Access in Ricardo
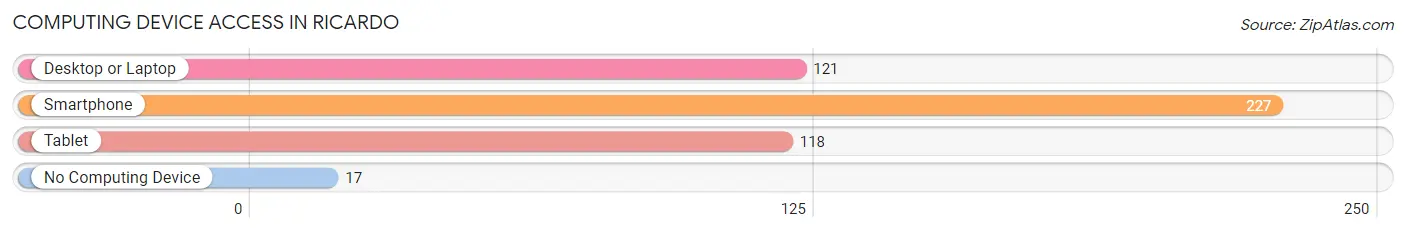
| Device Type | # Households | % Households |
| Desktop or Laptop | 121 | 49.6% |
| Smartphone | 227 | 93.0% |
| Tablet | 118 | 48.4% |
| No Computing Device | 17 | 7.0% |
| Total | 244 | 100.0% |
Internet Access in Ricardo
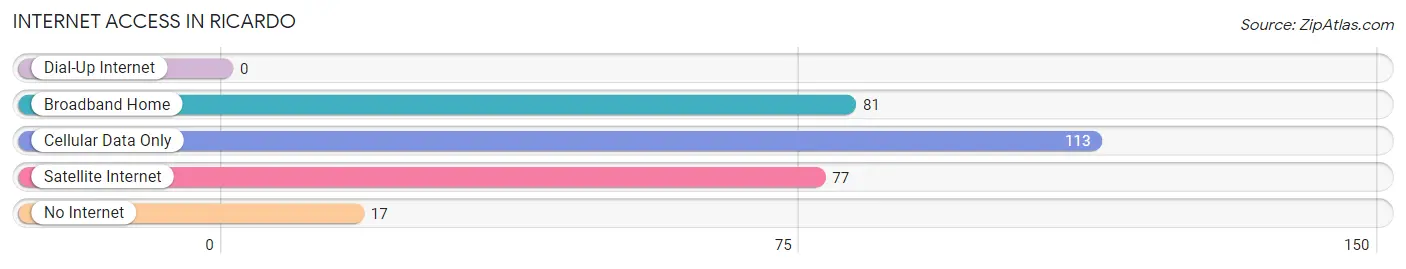
| Internet Type | # Households | % Households |
| Dial-Up Internet | 0 | 0.0% |
| Broadband Home | 81 | 33.2% |
| Cellular Data Only | 113 | 46.3% |
| Satellite Internet | 77 | 31.6% |
| No Internet | 17 | 7.0% |
| Total | 244 | 100.0% |
Ricardo Summary
Ricardo is a small unincorporated community located in Jim Wells County, Texas. It is situated about 10 miles south of Alice, the county seat. The population of Ricardo was estimated to be around 200 people in 2000.
History
Ricardo was founded in the late 19th century by a group of Mexican immigrants. The town was named after a local rancher, Ricardo Lopez. The town was originally a small farming community, but it soon grew to include a post office, a general store, and a school.
In the early 20th century, Ricardo was a thriving community with a population of over 500 people. The town had a cotton gin, a blacksmith shop, and several other businesses. However, the Great Depression caused the population to decline and many of the businesses closed.
Geography
Ricardo is located in the Coastal Plains region of Texas. The terrain is mostly flat with some rolling hills. The climate is subtropical with hot summers and mild winters. The average annual temperature is around 70 degrees Fahrenheit.
The town is situated on the banks of the Nueces River. The river provides a source of irrigation for the local farms and ranches. The area is also home to several species of wildlife, including deer, wild hogs, and various birds.
Economy
Ricardo’s economy is largely based on agriculture. The town is home to several farms and ranches that produce cotton, corn, sorghum, and other crops. The town also has a few small businesses, including a general store and a gas station.
Demographics
Ricardo’s population was estimated to be around 200 people in 2000. The town is predominantly Hispanic, with a large percentage of Mexican-Americans. The median household income is around $25,000. The town has a high poverty rate, with nearly 40% of the population living below the poverty line.
Ricardo is a small, rural community with a rich history and culture. Despite its small size, the town has a vibrant economy and a diverse population. The town is a great place to live and work, and it is a great example of the unique culture of South Texas.
Common Questions
What is Per Capita Income in Ricardo?
Per Capita income in Ricardo is $22,474.
What is the Median Family Income in Ricardo?
Median Family Income in Ricardo is $60,962.
What is the Median Household income in Ricardo?
Median Household Income in Ricardo is $61,282.
What is Inequality or Gini Index in Ricardo?
Inequality or Gini Index in Ricardo is 0.45.
What is the Total Population of Ricardo?
Total Population of Ricardo is 819.
What is the Total Male Population of Ricardo?
Total Male Population of Ricardo is 235.
What is the Total Female Population of Ricardo?
Total Female Population of Ricardo is 584.
What is the Ratio of Males per 100 Females in Ricardo?
There are 40.24 Males per 100 Females in Ricardo.
What is the Ratio of Females per 100 Males in Ricardo?
There are 248.51 Females per 100 Males in Ricardo.
What is the Median Population Age in Ricardo?
Median Population Age in Ricardo is 38.5 Years.
What is the Average Family Size in Ricardo
Average Family Size in Ricardo is 3.9 People.
What is the Average Household Size in Ricardo
Average Household Size in Ricardo is 3.4 People.
How Large is the Labor Force in Ricardo?
There are 172 People in the Labor Forcein in Ricardo.
What is the Percentage of People in the Labor Force in Ricardo?
36.8% of People are in the Labor Force in Ricardo.