Zip Codes with the Highest Percentage of Population Employed in Computer & Mathematics in Leander, TX
RELATED REPORTS & OPTIONS
Computer & Mathematics
Leander
Compare Zip Codes
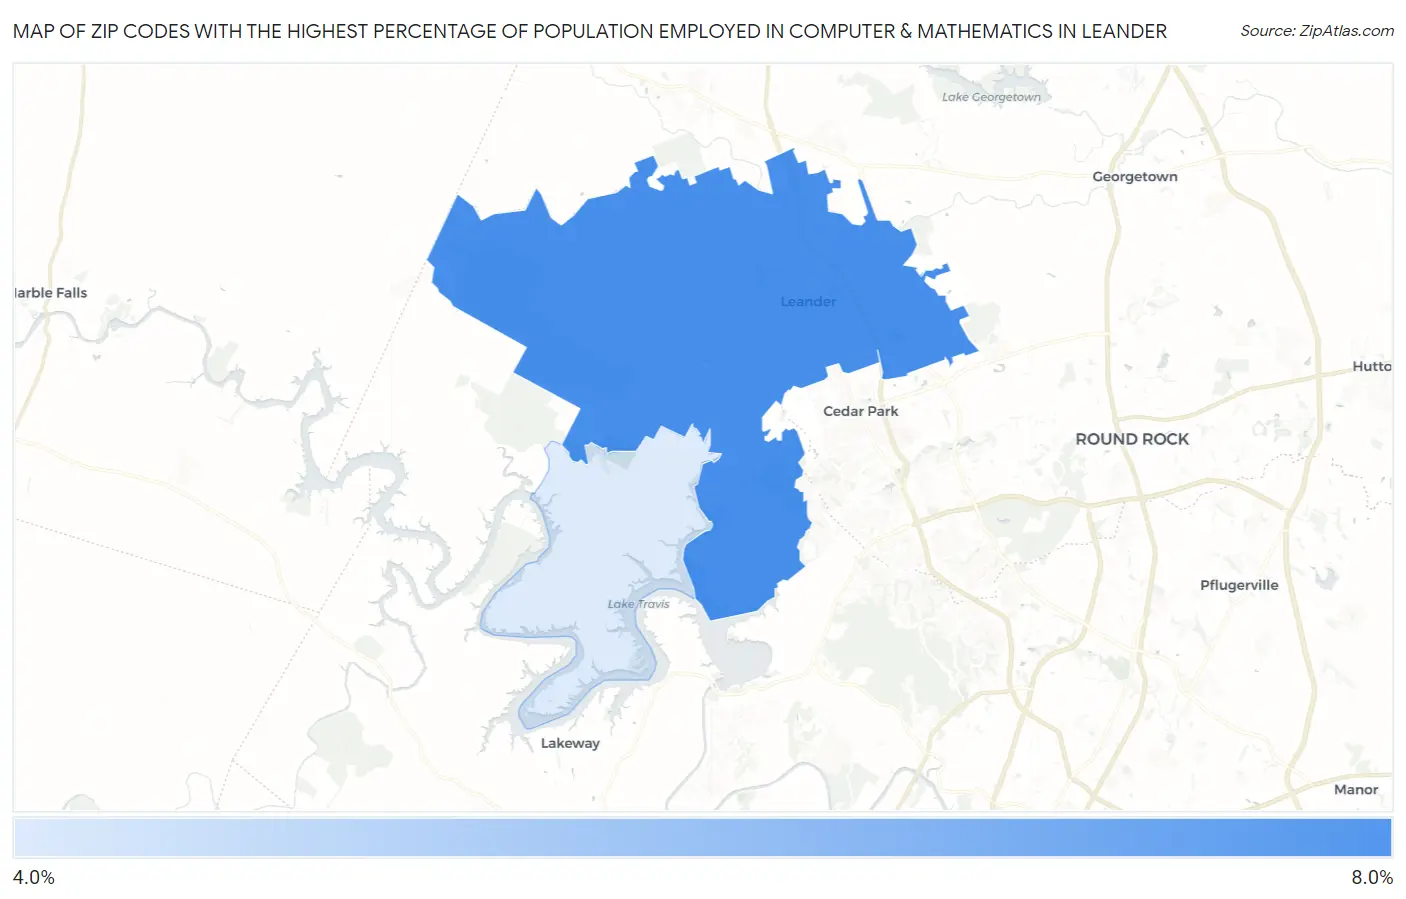
Map of Zip Codes with the Highest Percentage of Population Employed in Computer & Mathematics in Leander
5.0%
7.7%
Zip Codes with the Highest Percentage of Population Employed in Computer & Mathematics in Leander, TX
| Zip Code | % Employed | vs State | vs National | |
| 1. | 78641 | 7.7% | 3.4%(+4.22)#88 | 3.5%(+4.13)#1,330 |
| 2. | 78645 | 5.0% | 3.4%(+1.53)#200 | 3.5%(+1.44)#3,400 |
1
Common Questions
What are the Top Zip Codes with the Highest Percentage of Population Employed in Computer & Mathematics in Leander, TX?
Top Zip Codes with the Highest Percentage of Population Employed in Computer & Mathematics in Leander, TX are:
What zip code has the Highest Percentage of Population Employed in Computer & Mathematics in Leander, TX?
78641 has the Highest Percentage of Population Employed in Computer & Mathematics in Leander, TX with 7.7%.
What is the Percentage of Population Employed in Computer & Mathematics in Leander, TX?
Percentage of Population Employed in Computer & Mathematics in Leander is 7.7%.
What is the Percentage of Population Employed in Computer & Mathematics in Texas?
Percentage of Population Employed in Computer & Mathematics in Texas is 3.4%.
What is the Percentage of Population Employed in Computer & Mathematics in the United States?
Percentage of Population Employed in Computer & Mathematics in the United States is 3.5%.