Zip Codes with the Highest Percentage of Population Employed in Computer & Mathematics in Texas
RELATED REPORTS & OPTIONS
Computer & Mathematics
Texas
Compare Zip Codes
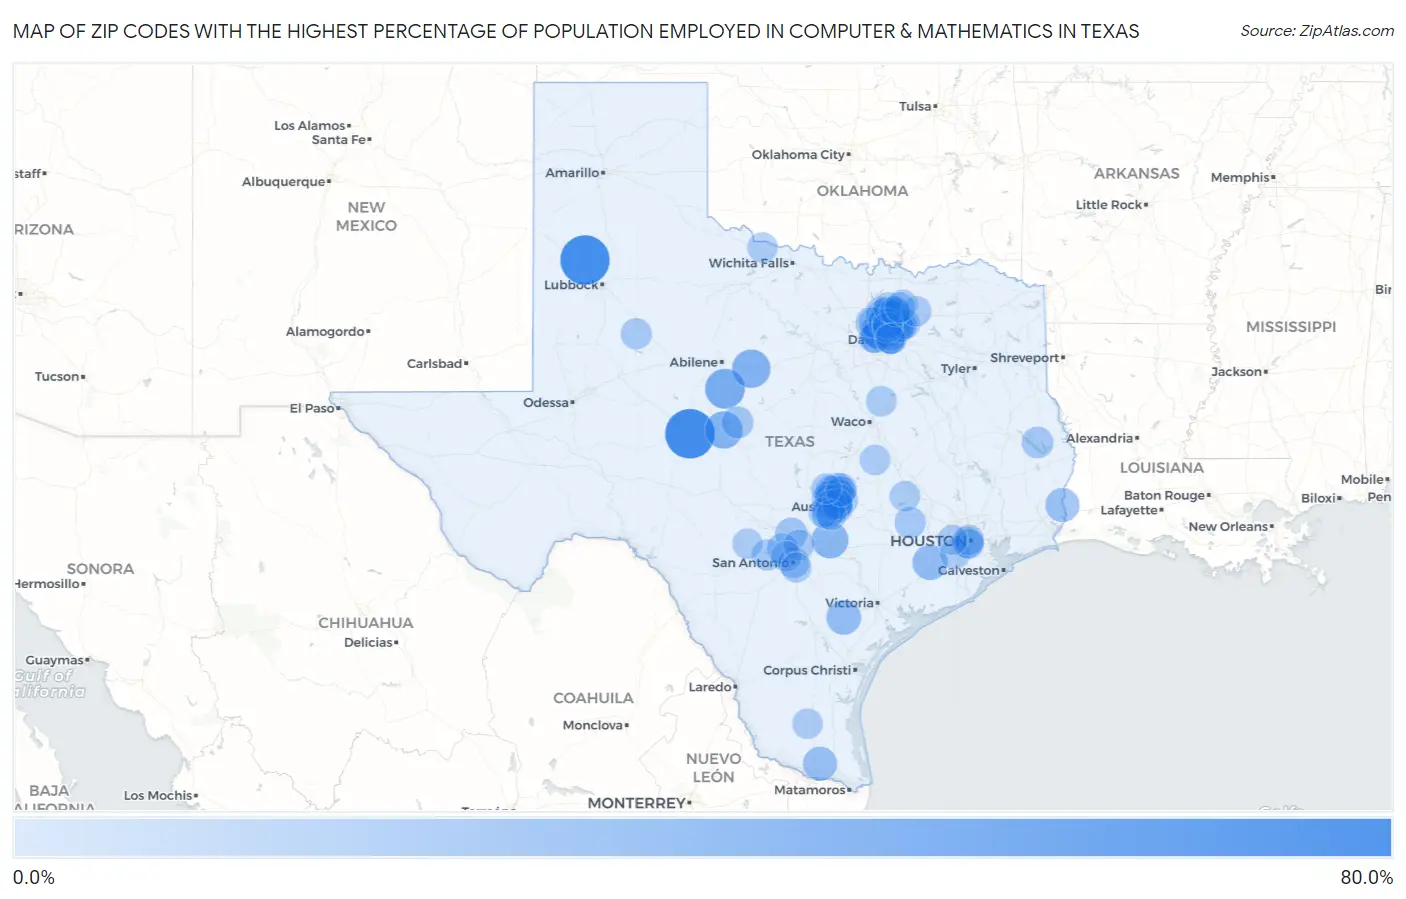
Map of Zip Codes with the Highest Percentage of Population Employed in Computer & Mathematics in Texas
0.0%
80.0%
Zip Codes with the Highest Percentage of Population Employed in Computer & Mathematics in Texas
| Zip Code | % Employed | vs State | vs National | |
| 1. | 76957 | 78.3% | 3.4%(+74.8)#1 | 3.5%(+74.7)#5 |
| 2. | 79369 | 77.4% | 3.4%(+74.0)#2 | 3.5%(+73.9)#6 |
| 3. | 79519 | 41.7% | 3.4%(+38.2)#3 | 3.5%(+38.1)#19 |
| 4. | 76469 | 36.4% | 3.4%(+32.9)#4 | 3.5%(+32.8)#29 |
| 5. | 76862 | 32.6% | 3.4%(+29.1)#5 | 3.5%(+29.0)#39 |
| 6. | 78670 | 30.6% | 3.4%(+27.2)#6 | 3.5%(+27.1)#46 |
| 7. | 75063 | 28.2% | 3.4%(+24.8)#7 | 3.5%(+24.7)#61 |
| 8. | 77448 | 24.5% | 3.4%(+21.1)#8 | 3.5%(+21.0)#82 |
| 9. | 78107 | 22.9% | 3.4%(+19.4)#9 | 3.5%(+19.3)#98 |
| 10. | 75039 | 20.8% | 3.4%(+17.4)#10 | 3.5%(+17.3)#118 |
| 11. | 78558 | 20.6% | 3.4%(+17.1)#11 | 3.5%(+17.0)#122 |
| 12. | 77614 | 20.4% | 3.4%(+17.0)#12 | 3.5%(+16.9)#125 |
| 13. | 78727 | 18.5% | 3.4%(+15.1)#13 | 3.5%(+15.0)#162 |
| 14. | 75024 | 16.8% | 3.4%(+13.3)#14 | 3.5%(+13.2)#192 |
| 15. | 78717 | 16.3% | 3.4%(+12.9)#15 | 3.5%(+12.8)#207 |
| 16. | 75035 | 15.9% | 3.4%(+12.5)#16 | 3.5%(+12.4)#221 |
| 17. | 75025 | 15.6% | 3.4%(+12.1)#17 | 3.5%(+12.0)#230 |
| 18. | 75251 | 15.0% | 3.4%(+11.5)#18 | 3.5%(+11.5)#257 |
| 19. | 78004 | 14.4% | 3.4%(+11.0)#19 | 3.5%(+10.9)#282 |
| 20. | 75038 | 13.5% | 3.4%(+10.1)#20 | 3.5%(+9.99)#333 |
| 21. | 76845 | 13.1% | 3.4%(+9.64)#21 | 3.5%(+9.55)#357 |
| 22. | 78729 | 12.6% | 3.4%(+9.15)#22 | 3.5%(+9.06)#391 |
| 23. | 78681 | 12.3% | 3.4%(+8.85)#23 | 3.5%(+8.76)#414 |
| 24. | 78759 | 12.3% | 3.4%(+8.84)#24 | 3.5%(+8.75)#416 |
| 25. | 75094 | 12.1% | 3.4%(+8.64)#25 | 3.5%(+8.55)#430 |
| 26. | 78750 | 12.0% | 3.4%(+8.56)#26 | 3.5%(+8.47)#443 |
| 27. | 78756 | 12.0% | 3.4%(+8.52)#27 | 3.5%(+8.43)#447 |
| 28. | 78728 | 11.9% | 3.4%(+8.50)#28 | 3.5%(+8.41)#449 |
| 29. | 75929 | 11.8% | 3.4%(+8.39)#29 | 3.5%(+8.31)#458 |
| 30. | 78732 | 11.8% | 3.4%(+8.36)#30 | 3.5%(+8.28)#464 |
| 31. | 78757 | 11.8% | 3.4%(+8.32)#31 | 3.5%(+8.23)#474 |
| 32. | 78613 | 11.6% | 3.4%(+8.21)#32 | 3.5%(+8.12)#477 |
| 33. | 78726 | 11.5% | 3.4%(+8.10)#33 | 3.5%(+8.01)#489 |
| 34. | 75022 | 11.5% | 3.4%(+8.09)#34 | 3.5%(+8.01)#490 |
| 35. | 75019 | 11.4% | 3.4%(+7.99)#35 | 3.5%(+7.90)#505 |
| 36. | 75068 | 11.3% | 3.4%(+7.91)#36 | 3.5%(+7.82)#513 |
| 37. | 75093 | 11.2% | 3.4%(+7.79)#37 | 3.5%(+7.70)#536 |
| 38. | 78056 | 11.2% | 3.4%(+7.76)#38 | 3.5%(+7.67)#538 |
| 39. | 75036 | 11.2% | 3.4%(+7.73)#39 | 3.5%(+7.64)#541 |
| 40. | 78731 | 11.1% | 3.4%(+7.69)#40 | 3.5%(+7.60)#546 |
| 41. | 78931 | 11.1% | 3.4%(+7.68)#41 | 3.5%(+7.59)#550 |
| 42. | 78735 | 10.9% | 3.4%(+7.50)#42 | 3.5%(+7.41)#564 |
| 43. | 78255 | 10.5% | 3.4%(+7.08)#43 | 3.5%(+7.00)#628 |
| 44. | 77046 | 10.3% | 3.4%(+6.85)#44 | 3.5%(+6.76)#663 |
| 45. | 75034 | 10.3% | 3.4%(+6.83)#45 | 3.5%(+6.74)#665 |
| 46. | 78754 | 10.1% | 3.4%(+6.62)#46 | 3.5%(+6.53)#701 |
| 47. | 78205 | 10.0% | 3.4%(+6.57)#47 | 3.5%(+6.49)#711 |
| 48. | 75082 | 9.9% | 3.4%(+6.46)#48 | 3.5%(+6.37)#725 |
| 49. | 79517 | 9.7% | 3.4%(+6.24)#49 | 3.5%(+6.15)#758 |
| 50. | 78749 | 9.7% | 3.4%(+6.23)#50 | 3.5%(+6.14)#761 |
| 51. | 75226 | 9.6% | 3.4%(+6.19)#51 | 3.5%(+6.10)#765 |
| 52. | 78739 | 9.6% | 3.4%(+6.13)#52 | 3.5%(+6.04)#782 |
| 53. | 75013 | 9.5% | 3.4%(+6.07)#53 | 3.5%(+5.98)#794 |
| 54. | 78665 | 9.4% | 3.4%(+5.96)#54 | 3.5%(+5.87)#815 |
| 55. | 78730 | 9.4% | 3.4%(+5.95)#55 | 3.5%(+5.86)#818 |
| 56. | 78722 | 9.4% | 3.4%(+5.94)#56 | 3.5%(+5.85)#820 |
| 57. | 78702 | 9.2% | 3.4%(+5.74)#57 | 3.5%(+5.65)#861 |
| 58. | 75252 | 9.2% | 3.4%(+5.72)#58 | 3.5%(+5.63)#865 |
| 59. | 78758 | 9.1% | 3.4%(+5.68)#59 | 3.5%(+5.59)#878 |
| 60. | 78261 | 9.0% | 3.4%(+5.58)#60 | 3.5%(+5.49)#900 |
| 61. | 75023 | 9.0% | 3.4%(+5.53)#61 | 3.5%(+5.44)#907 |
| 62. | 76005 | 8.9% | 3.4%(+5.43)#62 | 3.5%(+5.34)#938 |
| 63. | 75056 | 8.8% | 3.4%(+5.35)#63 | 3.5%(+5.26)#960 |
| 64. | 76155 | 8.8% | 3.4%(+5.32)#64 | 3.5%(+5.23)#966 |
| 65. | 75454 | 8.8% | 3.4%(+5.31)#65 | 3.5%(+5.23)#967 |
| 66. | 75074 | 8.7% | 3.4%(+5.27)#66 | 3.5%(+5.18)#989 |
| 67. | 75070 | 8.7% | 3.4%(+5.26)#67 | 3.5%(+5.17)#994 |
| 68. | 75033 | 8.6% | 3.4%(+5.18)#68 | 3.5%(+5.09)#1,019 |
| 69. | 78746 | 8.3% | 3.4%(+4.82)#69 | 3.5%(+4.74)#1,130 |
| 70. | 75206 | 8.2% | 3.4%(+4.72)#70 | 3.5%(+4.63)#1,163 |
| 71. | 76676 | 8.1% | 3.4%(+4.65)#71 | 3.5%(+4.56)#1,182 |
| 72. | 78751 | 8.1% | 3.4%(+4.65)#72 | 3.5%(+4.56)#1,186 |
| 73. | 75010 | 8.0% | 3.4%(+4.56)#73 | 3.5%(+4.47)#1,207 |
| 74. | 75028 | 8.0% | 3.4%(+4.54)#74 | 3.5%(+4.45)#1,213 |
| 75. | 78240 | 7.9% | 3.4%(+4.47)#75 | 3.5%(+4.38)#1,233 |
| 76. | 77479 | 7.9% | 3.4%(+4.45)#76 | 3.5%(+4.36)#1,241 |
| 77. | 76519 | 7.9% | 3.4%(+4.45)#77 | 3.5%(+4.36)#1,243 |
| 78. | 75246 | 7.9% | 3.4%(+4.43)#78 | 3.5%(+4.34)#1,248 |
| 79. | 75048 | 7.8% | 3.4%(+4.38)#79 | 3.5%(+4.29)#1,273 |
| 80. | 78883 | 7.8% | 3.4%(+4.38)#80 | 3.5%(+4.29)#1,276 |
| 81. | 75044 | 7.8% | 3.4%(+4.37)#81 | 3.5%(+4.28)#1,284 |
| 82. | 78737 | 7.8% | 3.4%(+4.33)#82 | 3.5%(+4.24)#1,296 |
| 83. | 78748 | 7.7% | 3.4%(+4.30)#83 | 3.5%(+4.21)#1,304 |
| 84. | 77879 | 7.7% | 3.4%(+4.29)#84 | 3.5%(+4.20)#1,311 |
| 85. | 78664 | 7.7% | 3.4%(+4.28)#85 | 3.5%(+4.19)#1,314 |
| 86. | 75098 | 7.7% | 3.4%(+4.27)#86 | 3.5%(+4.18)#1,316 |
| 87. | 78353 | 7.7% | 3.4%(+4.26)#87 | 3.5%(+4.17)#1,320 |
| 88. | 78641 | 7.7% | 3.4%(+4.22)#88 | 3.5%(+4.13)#1,330 |
| 89. | 77007 | 7.7% | 3.4%(+4.22)#89 | 3.5%(+4.13)#1,333 |
| 90. | 78235 | 7.6% | 3.4%(+4.19)#90 | 3.5%(+4.10)#1,344 |
| 91. | 75287 | 7.6% | 3.4%(+4.18)#91 | 3.5%(+4.09)#1,346 |
| 92. | 75078 | 7.6% | 3.4%(+4.14)#92 | 3.5%(+4.05)#1,357 |
| 93. | 75442 | 7.6% | 3.4%(+4.12)#93 | 3.5%(+4.03)#1,371 |
| 94. | 77030 | 7.5% | 3.4%(+4.05)#94 | 3.5%(+3.96)#1,393 |
| 95. | 75001 | 7.4% | 3.4%(+3.99)#95 | 3.5%(+3.90)#1,420 |
| 96. | 76364 | 7.4% | 3.4%(+3.97)#96 | 3.5%(+3.88)#1,425 |
| 97. | 75072 | 7.4% | 3.4%(+3.97)#97 | 3.5%(+3.88)#1,428 |
| 98. | 77094 | 7.3% | 3.4%(+3.91)#98 | 3.5%(+3.82)#1,445 |
| 99. | 75071 | 7.3% | 3.4%(+3.90)#99 | 3.5%(+3.81)#1,446 |
| 100. | 75201 | 7.3% | 3.4%(+3.89)#100 | 3.5%(+3.80)#1,450 |
Common Questions
What are the Top 10 Zip Codes with the Highest Percentage of Population Employed in Computer & Mathematics in Texas?
Top 10 Zip Codes with the Highest Percentage of Population Employed in Computer & Mathematics in Texas are:
What zip code has the Highest Percentage of Population Employed in Computer & Mathematics in Texas?
76957 has the Highest Percentage of Population Employed in Computer & Mathematics in Texas with 78.3%.
What is the Percentage of Population Employed in Computer & Mathematics in the State of Texas?
Percentage of Population Employed in Computer & Mathematics in Texas is 3.4%.
What is the Percentage of Population Employed in Computer & Mathematics in the United States?
Percentage of Population Employed in Computer & Mathematics in the United States is 3.5%.