Bonneau, SC Map & Demographics
Bonneau Map
Bonneau Overview
$29,001
PER CAPITA INCOME
$75,938
AVG FAMILY INCOME
$61,528
AVG HOUSEHOLD INCOME
$15,262
FAMILY INCOME DEFICIT
0.53
INEQUALITY / GINI INDEX
582
TOTAL POPULATION
268
MALE POPULATION
314
FEMALE POPULATION
85.35
MALES / 100 FEMALES
117.16
FEMALES / 100 MALES
37.0
MEDIAN AGE
3.8
AVG FAMILY SIZE
3.3
AVG HOUSEHOLD SIZE
220
LABOR FORCE [ PEOPLE ]
51.3%
PERCENT IN LABOR FORCE
14.5%
UNEMPLOYMENT RATE
Bonneau Zip Codes
Bonneau Area Codes
Income in Bonneau
Income Overview in Bonneau
Per Capita Income in Bonneau is $29,001, while median incomes of families and households are $75,938 and $61,528 respectively.
| Characteristic | Number | Measure |
| Per Capita Income | 582 | $29,001 |
| Median Family Income | 139 | $75,938 |
| Mean Family Income | 139 | $107,572 |
| Median Household Income | 175 | $61,528 |
| Mean Household Income | 175 | $93,396 |
| Income Deficit | 139 | $15,262 |
| Wage / Income Gap (%) | 582 | 0.00% |
| Wage / Income Gap ($) | 582 | 100.00¢ per $1 |
| Gini / Inequality Index | 582 | 0.53 |
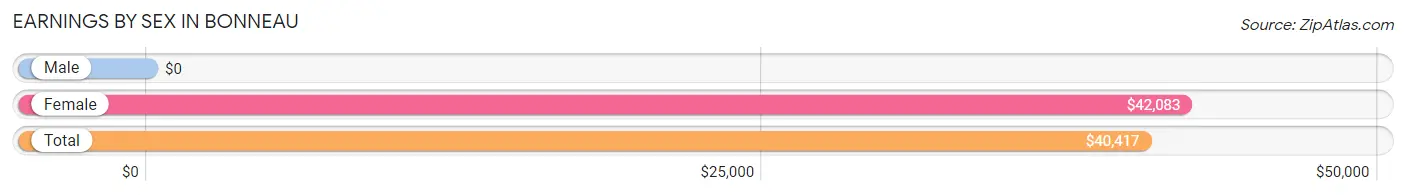
Earnings by Sex in Bonneau
| Sex | Number | Average Earnings |
| Male | 122 (52.8%) | $0 |
| Female | 109 (47.2%) | $42,083 |
| Total | 231 (100.0%) | $40,417 |
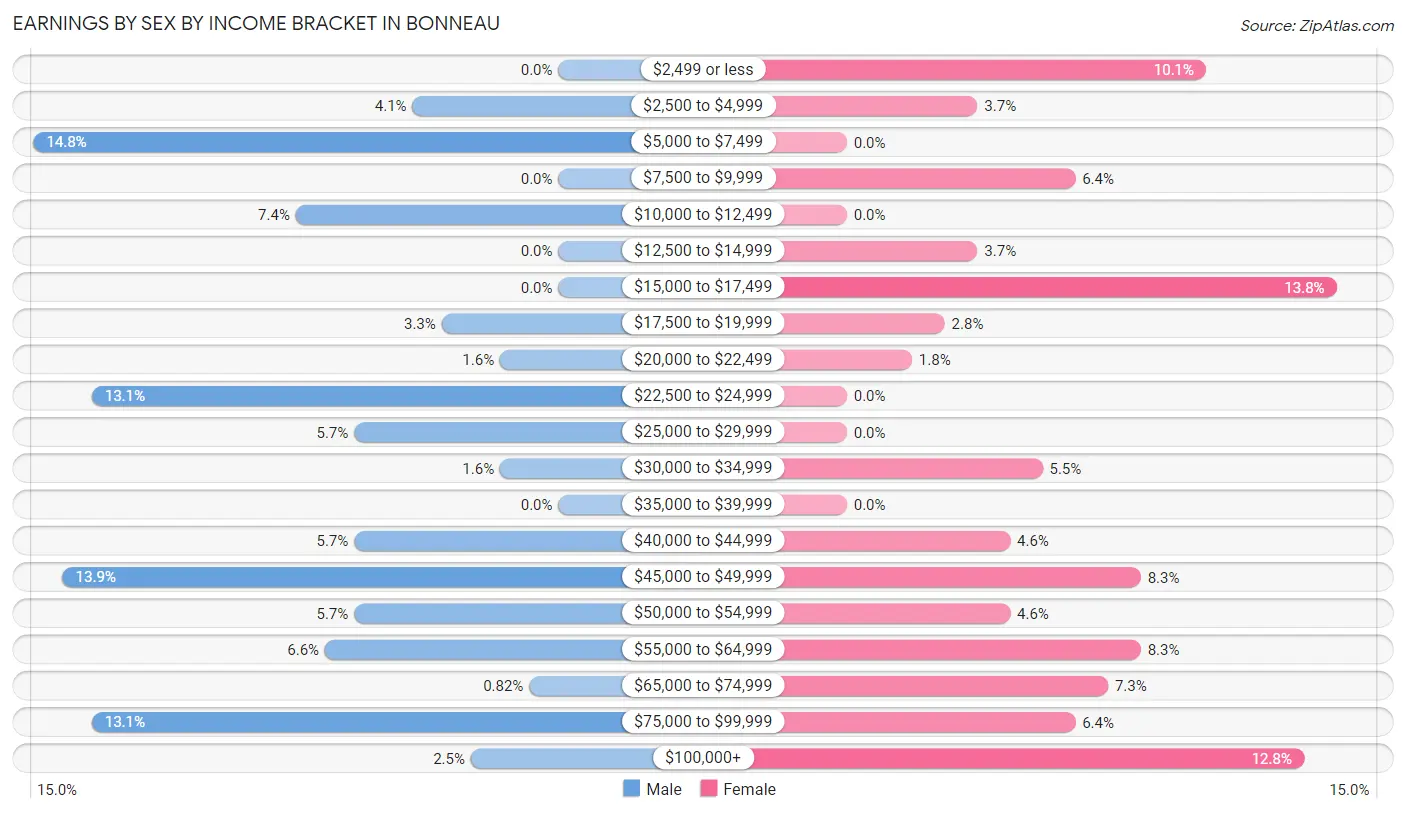
Earnings by Sex by Income Bracket in Bonneau
The most common earnings brackets in Bonneau are $5,000 to $7,499 for men (18 | 14.7%) and $15,000 to $17,499 for women (15 | 13.8%).
| Income | Male | Female |
| $2,499 or less | 0 (0.0%) | 11 (10.1%) |
| $2,500 to $4,999 | 5 (4.1%) | 4 (3.7%) |
| $5,000 to $7,499 | 18 (14.7%) | 0 (0.0%) |
| $7,500 to $9,999 | 0 (0.0%) | 7 (6.4%) |
| $10,000 to $12,499 | 9 (7.4%) | 0 (0.0%) |
| $12,500 to $14,999 | 0 (0.0%) | 4 (3.7%) |
| $15,000 to $17,499 | 0 (0.0%) | 15 (13.8%) |
| $17,500 to $19,999 | 4 (3.3%) | 3 (2.8%) |
| $20,000 to $22,499 | 2 (1.6%) | 2 (1.8%) |
| $22,500 to $24,999 | 16 (13.1%) | 0 (0.0%) |
| $25,000 to $29,999 | 7 (5.7%) | 0 (0.0%) |
| $30,000 to $34,999 | 2 (1.6%) | 6 (5.5%) |
| $35,000 to $39,999 | 0 (0.0%) | 0 (0.0%) |
| $40,000 to $44,999 | 7 (5.7%) | 5 (4.6%) |
| $45,000 to $49,999 | 17 (13.9%) | 9 (8.3%) |
| $50,000 to $54,999 | 7 (5.7%) | 5 (4.6%) |
| $55,000 to $64,999 | 8 (6.6%) | 9 (8.3%) |
| $65,000 to $74,999 | 1 (0.8%) | 8 (7.3%) |
| $75,000 to $99,999 | 16 (13.1%) | 7 (6.4%) |
| $100,000+ | 3 (2.5%) | 14 (12.8%) |
| Total | 122 (100.0%) | 109 (100.0%) |
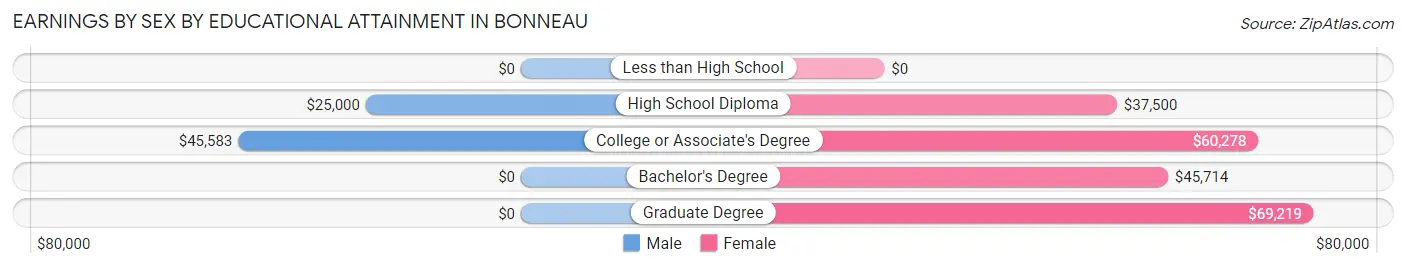
Earnings by Sex by Educational Attainment in Bonneau
Average earnings in Bonneau are $42,857 for men and $45,833 for women, a difference of 6.5%. Men with an educational attainment of college or associate's degree enjoy the highest average annual earnings of $45,583, while those with high school diploma education earn the least with $25,000. Women with an educational attainment of graduate degree earn the most with the average annual earnings of $69,219, while those with high school diploma education have the smallest earnings of $37,500.
| Educational Attainment | Male Income | Female Income |
| Less than High School | - | - |
| High School Diploma | $25,000 | $37,500 |
| College or Associate's Degree | $45,583 | $60,278 |
| Bachelor's Degree | - | - |
| Graduate Degree | - | - |
| Total | $42,857 | $45,833 |
Family Income in Bonneau
Family Income Brackets in Bonneau
According to the Bonneau family income data, there are 21 families falling into the $100,000 to $149,999 income range, which is the most common income bracket and makes up 15.1% of all families. Conversely, the $10,000 to $14,999 income bracket is the least frequent group with only 2 families (1.4%) belonging to this category.
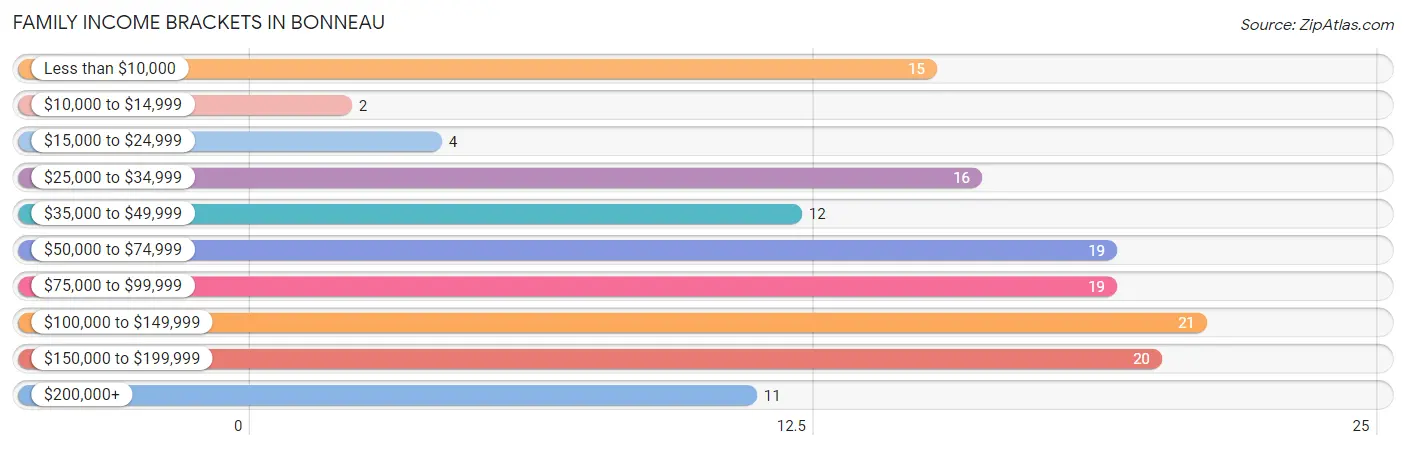
| Income Bracket | # Families | % Families |
| Less than $10,000 | 15 | 10.8% |
| $10,000 to $14,999 | 2 | 1.4% |
| $15,000 to $24,999 | 4 | 2.9% |
| $25,000 to $34,999 | 16 | 11.5% |
| $35,000 to $49,999 | 12 | 8.6% |
| $50,000 to $74,999 | 19 | 13.7% |
| $75,000 to $99,999 | 19 | 13.7% |
| $100,000 to $149,999 | 21 | 15.1% |
| $150,000 to $199,999 | 20 | 14.4% |
| $200,000+ | 11 | 7.9% |
Family Income by Famaliy Size in Bonneau
2-person families (62 | 44.6%) account for the highest median family income in Bonneau with $149,167 per family, while 2-person families (62 | 44.6%) have the highest median income of $74,584 per family member.
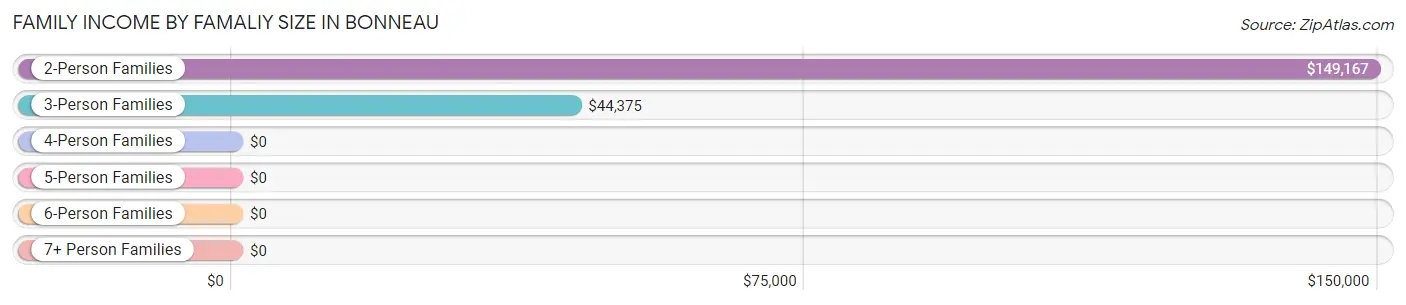
| Income Bracket | # Families | Median Income |
| 2-Person Families | 62 (44.6%) | $149,167 |
| 3-Person Families | 13 (9.3%) | $44,375 |
| 4-Person Families | 35 (25.2%) | $0 |
| 5-Person Families | 23 (16.6%) | $0 |
| 6-Person Families | 6 (4.3%) | $0 |
| 7+ Person Families | 0 (0.0%) | $0 |
| Total | 139 (100.0%) | $75,938 |
Family Income by Number of Earners in Bonneau
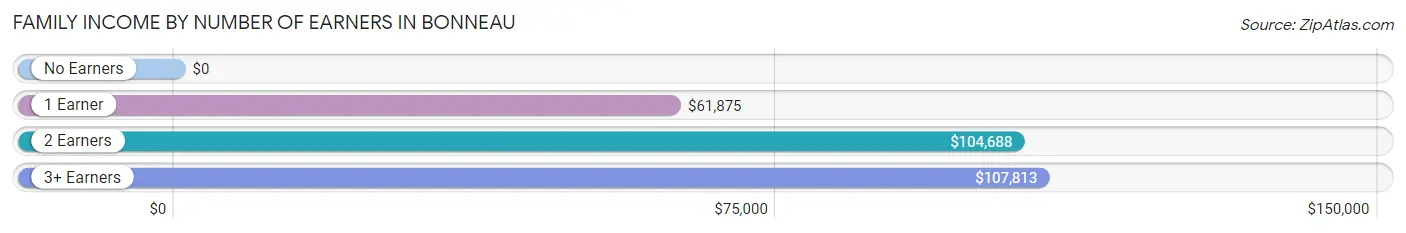
| Number of Earners | # Families | Median Income |
| No Earners | 34 (24.5%) | $0 |
| 1 Earner | 33 (23.7%) | $61,875 |
| 2 Earners | 61 (43.9%) | $104,688 |
| 3+ Earners | 11 (7.9%) | $107,813 |
| Total | 139 (100.0%) | $75,938 |
Household Income in Bonneau
Household Income Brackets in Bonneau
With 26 households falling in the category, the $100,000 to $149,999 income range is the most frequent in Bonneau, accounting for 14.9% of all households. In contrast, only 6 households (3.4%) fall into the $10,000 to $14,999 income bracket, making it the least populous group.
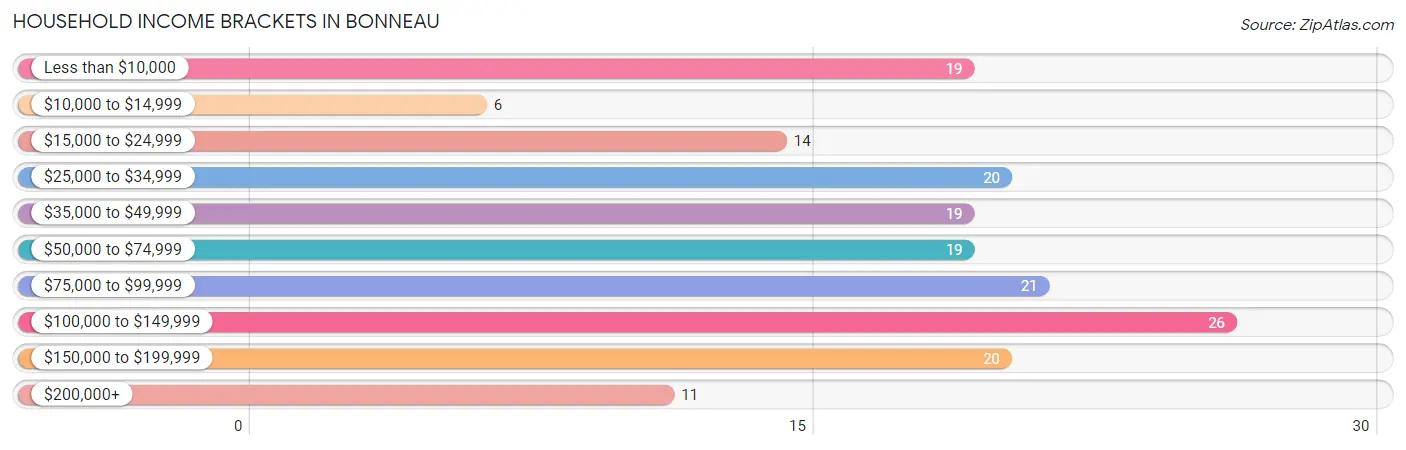
| Income Bracket | # Households | % Households |
| Less than $10,000 | 19 | 10.9% |
| $10,000 to $14,999 | 6 | 3.4% |
| $15,000 to $24,999 | 14 | 8.0% |
| $25,000 to $34,999 | 20 | 11.4% |
| $35,000 to $49,999 | 19 | 10.9% |
| $50,000 to $74,999 | 19 | 10.9% |
| $75,000 to $99,999 | 21 | 12.0% |
| $100,000 to $149,999 | 26 | 14.9% |
| $150,000 to $199,999 | 20 | 11.4% |
| $200,000+ | 11 | 6.3% |
Household Income by Householder Age in Bonneau
The median household income in Bonneau is $61,528, with the highest median household income of $90,313 found in the 25 to 44 years age bracket for the primary householder. A total of 40 households (22.9%) fall into this category. Meanwhile, the 15 to 24 years age bracket for the primary householder has the lowest median household income of $0, with 2 households (1.1%) in this group.
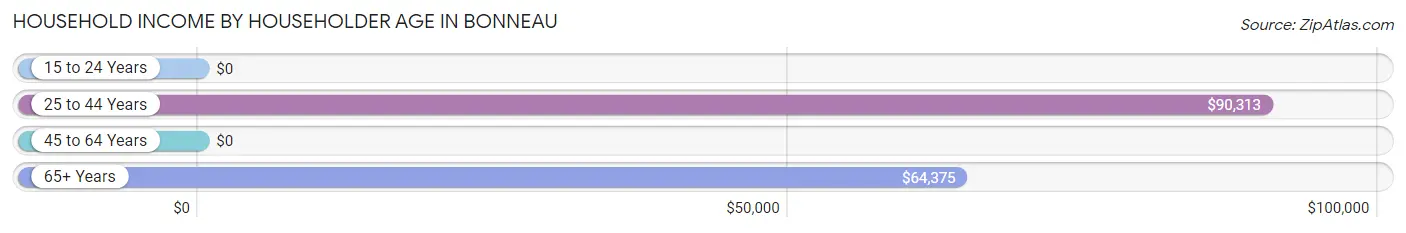
| Income Bracket | # Households | Median Income |
| 15 to 24 Years | 2 (1.1%) | $0 |
| 25 to 44 Years | 40 (22.9%) | $90,313 |
| 45 to 64 Years | 78 (44.6%) | $0 |
| 65+ Years | 55 (31.4%) | $64,375 |
| Total | 175 (100.0%) | $61,528 |
Poverty in Bonneau
Income Below Poverty by Sex and Age in Bonneau
With 39.2% poverty level for males and 37.9% for females among the residents of Bonneau, 5 year old males and 25 to 34 year old females are the most vulnerable to poverty, with 2 males (100.0%) and 15 females (68.2%) in their respective age groups living below the poverty level.
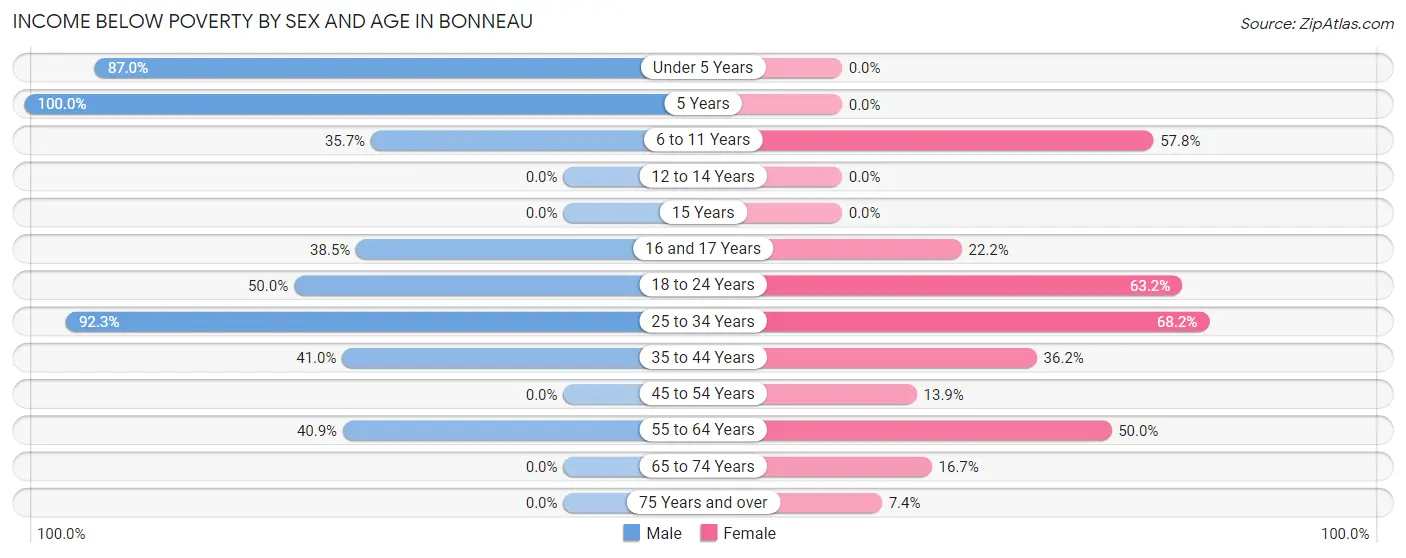
| Age Bracket | Male | Female |
| Under 5 Years | 20 (87.0%) | 0 (0.0%) |
| 5 Years | 2 (100.0%) | 0 (0.0%) |
| 6 to 11 Years | 15 (35.7%) | 37 (57.8%) |
| 12 to 14 Years | 0 (0.0%) | 0 (0.0%) |
| 15 Years | 0 (0.0%) | 0 (0.0%) |
| 16 and 17 Years | 5 (38.5%) | 2 (22.2%) |
| 18 to 24 Years | 2 (50.0%) | 12 (63.2%) |
| 25 to 34 Years | 36 (92.3%) | 15 (68.2%) |
| 35 to 44 Years | 16 (41.0%) | 17 (36.2%) |
| 45 to 54 Years | 0 (0.0%) | 5 (13.9%) |
| 55 to 64 Years | 9 (40.9%) | 25 (50.0%) |
| 65 to 74 Years | 0 (0.0%) | 4 (16.7%) |
| 75 Years and over | 0 (0.0%) | 2 (7.4%) |
| Total | 105 (39.2%) | 119 (37.9%) |
Income Above Poverty by Sex and Age in Bonneau
According to the poverty statistics in Bonneau, males aged 12 to 14 years and females aged under 5 years are the age groups that are most secure financially, with 100.0% of males and 100.0% of females in these age groups living above the poverty line.
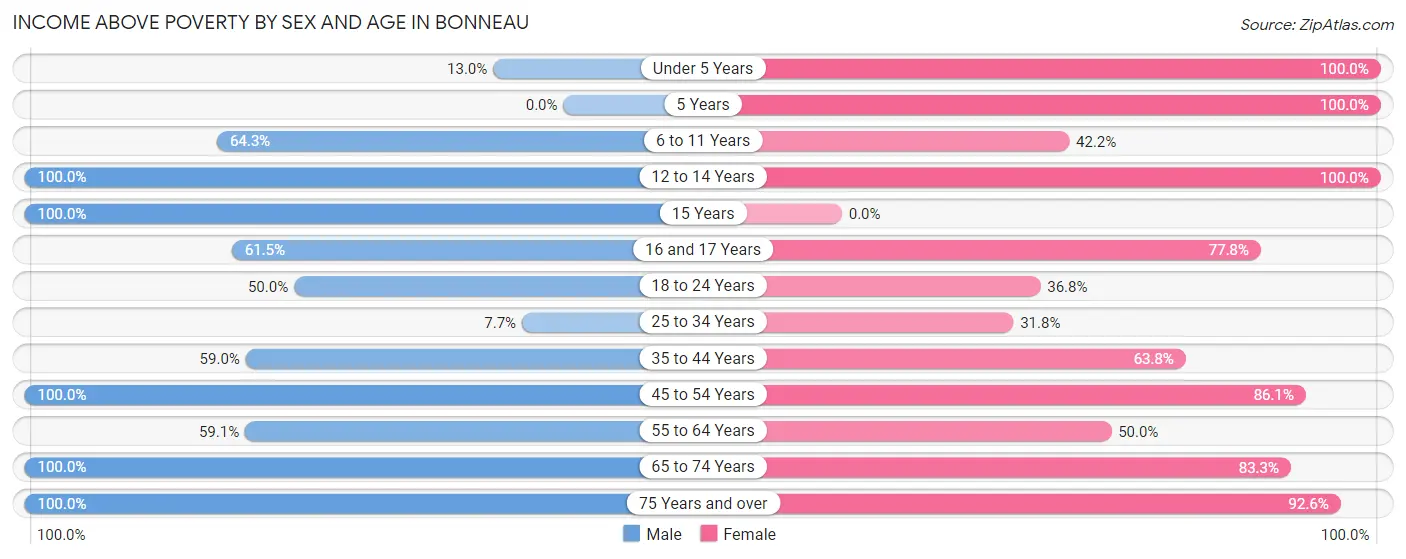
| Age Bracket | Male | Female |
| Under 5 Years | 3 (13.0%) | 5 (100.0%) |
| 5 Years | 0 (0.0%) | 8 (100.0%) |
| 6 to 11 Years | 27 (64.3%) | 27 (42.2%) |
| 12 to 14 Years | 4 (100.0%) | 3 (100.0%) |
| 15 Years | 2 (100.0%) | 0 (0.0%) |
| 16 and 17 Years | 8 (61.5%) | 7 (77.8%) |
| 18 to 24 Years | 2 (50.0%) | 7 (36.8%) |
| 25 to 34 Years | 3 (7.7%) | 7 (31.8%) |
| 35 to 44 Years | 23 (59.0%) | 30 (63.8%) |
| 45 to 54 Years | 35 (100.0%) | 31 (86.1%) |
| 55 to 64 Years | 13 (59.1%) | 25 (50.0%) |
| 65 to 74 Years | 21 (100.0%) | 20 (83.3%) |
| 75 Years and over | 22 (100.0%) | 25 (92.6%) |
| Total | 163 (60.8%) | 195 (62.1%) |
Income Below Poverty Among Married-Couple Families in Bonneau
The poverty statistics for married-couple families in Bonneau show that 16.2% or 18 of the total 111 families live below the poverty line. Families with 3 or 4 children have the highest poverty rate of 36.8%, comprising of 7 families. On the other hand, families with no children have the lowest poverty rate of 0.0%, which includes 0 families.
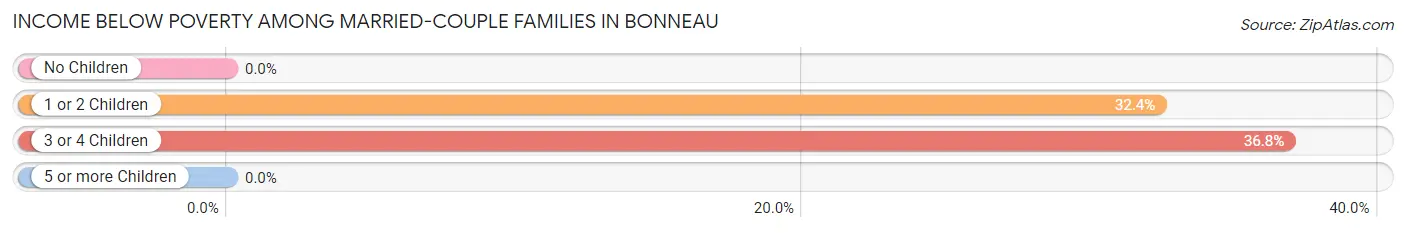
| Children | Above Poverty | Below Poverty |
| No Children | 58 (100.0%) | 0 (0.0%) |
| 1 or 2 Children | 23 (67.6%) | 11 (32.4%) |
| 3 or 4 Children | 12 (63.2%) | 7 (36.8%) |
| 5 or more Children | 0 (0.0%) | 0 (0.0%) |
| Total | 93 (83.8%) | 18 (16.2%) |
Income Below Poverty Among Single-Parent Households in Bonneau
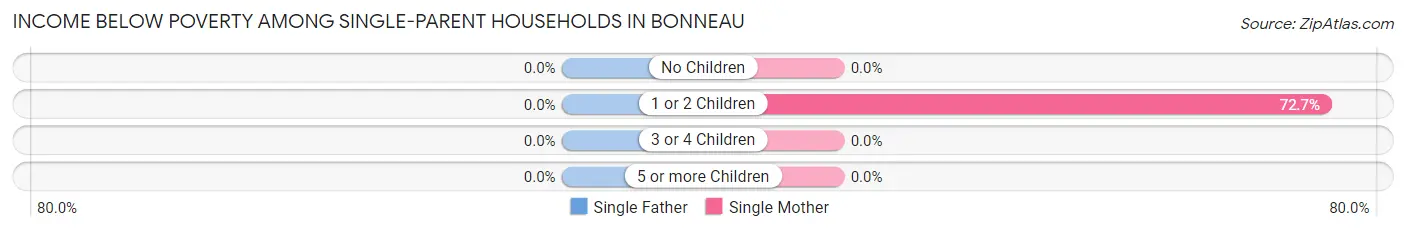
| Children | Single Father | Single Mother |
| No Children | 0 (0.0%) | 0 (0.0%) |
| 1 or 2 Children | 0 (0.0%) | 16 (72.7%) |
| 3 or 4 Children | 0 (0.0%) | 0 (0.0%) |
| 5 or more Children | 0 (0.0%) | 0 (0.0%) |
| Total | 0 (0.0%) | 16 (57.1%) |
Income Below Poverty Among Married-Couple vs Single-Parent Households in Bonneau
The poverty data for Bonneau shows that 18 of the married-couple family households (16.2%) and 16 of the single-parent households (57.1%) are living below the poverty level. Within the married-couple family households, those with 3 or 4 children have the highest poverty rate, with 7 households (36.8%) falling below the poverty line. Among the single-parent households, those with 1 or 2 children have the highest poverty rate, with 16 household (72.7%) living below poverty.
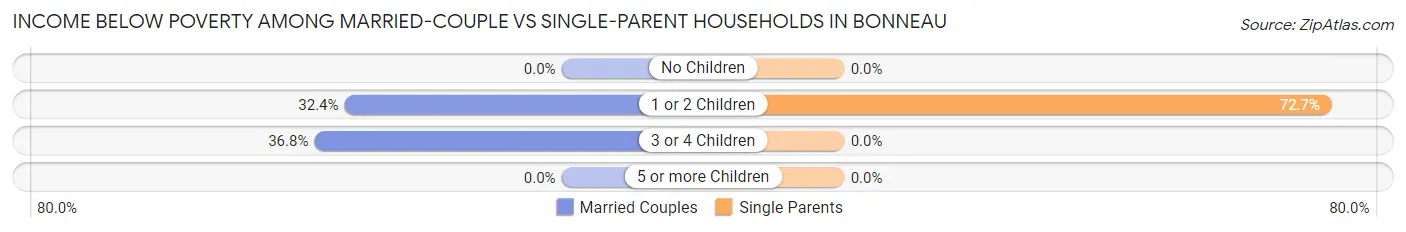
| Children | Married-Couple Families | Single-Parent Households |
| No Children | 0 (0.0%) | 0 (0.0%) |
| 1 or 2 Children | 11 (32.4%) | 16 (72.7%) |
| 3 or 4 Children | 7 (36.8%) | 0 (0.0%) |
| 5 or more Children | 0 (0.0%) | 0 (0.0%) |
| Total | 18 (16.2%) | 16 (57.1%) |
Race in Bonneau
The most populous races in Bonneau are White / Caucasian (456 | 78.3%), Black / African American (97 | 16.7%), and Native / Alaskan (16 | 2.8%).
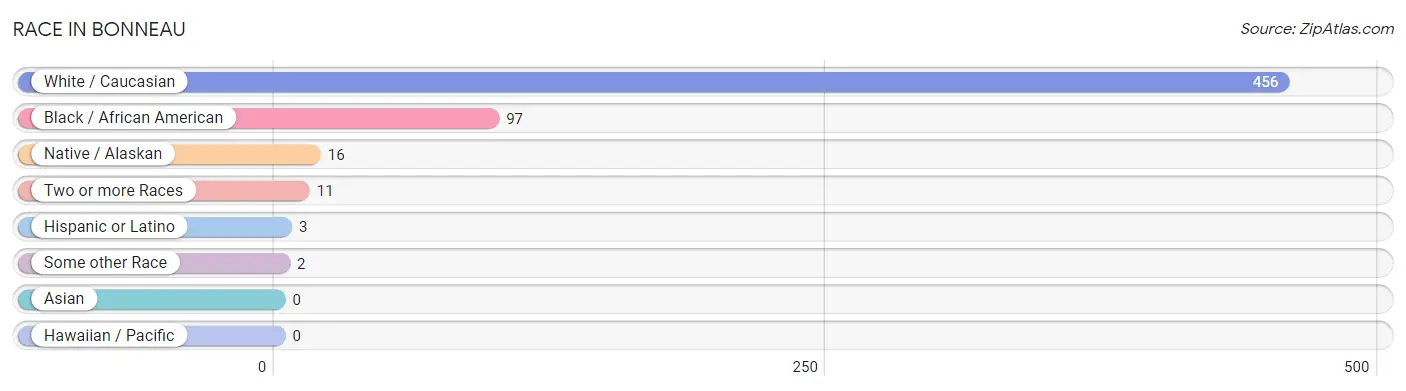
| Race | # Population | % Population |
| Asian | 0 | 0.0% |
| Black / African American | 97 | 16.7% |
| Hawaiian / Pacific | 0 | 0.0% |
| Hispanic or Latino | 3 | 0.5% |
| Native / Alaskan | 16 | 2.8% |
| White / Caucasian | 456 | 78.3% |
| Two or more Races | 11 | 1.9% |
| Some other Race | 2 | 0.3% |
| Total | 582 | 100.0% |
Ancestry in Bonneau
The most populous ancestries reported in Bonneau are Irish (96 | 16.5%), English (93 | 16.0%), French (71 | 12.2%), American (47 | 8.1%), and German (28 | 4.8%), together accounting for 57.6% of all Bonneau residents.
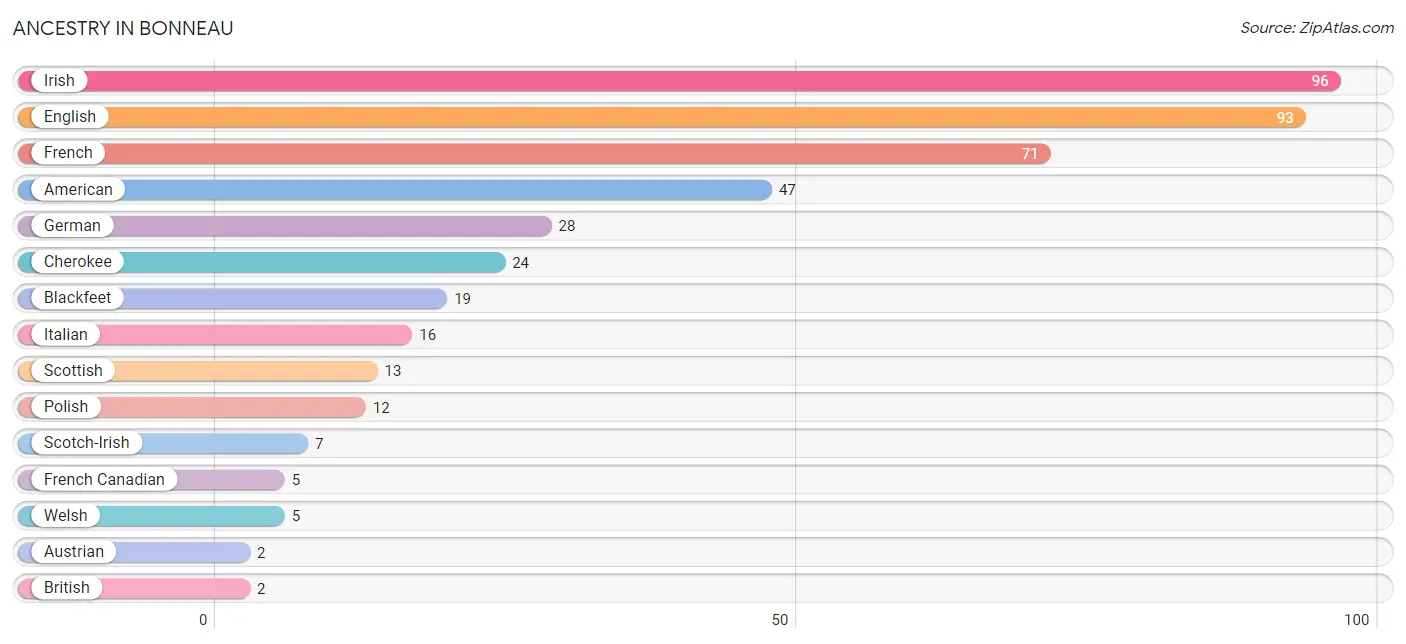
| Ancestry | # Population | % Population |
| American | 47 | 8.1% |
| Austrian | 2 | 0.3% |
| Blackfeet | 19 | 3.3% |
| British | 2 | 0.3% |
| Cherokee | 24 | 4.1% |
| English | 93 | 16.0% |
| Finnish | 1 | 0.2% |
| French | 71 | 12.2% |
| French Canadian | 5 | 0.9% |
| German | 28 | 4.8% |
| Irish | 96 | 16.5% |
| Italian | 16 | 2.8% |
| Mexican | 2 | 0.3% |
| Norwegian | 1 | 0.2% |
| Polish | 12 | 2.1% |
| Scotch-Irish | 7 | 1.2% |
| Scottish | 13 | 2.2% |
| Welsh | 5 | 0.9% | View All 18 Rows |
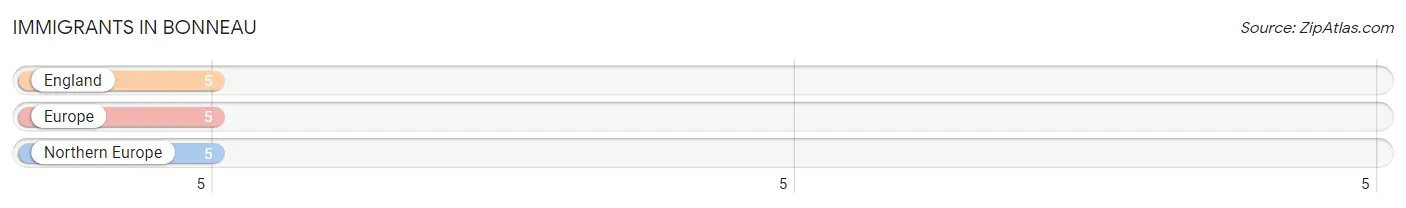
Immigrants in Bonneau
The most numerous immigrant groups reported in Bonneau came from England (5 | 0.9%), Europe (5 | 0.9%), and Northern Europe (5 | 0.9%), together accounting for 2.6% of all Bonneau residents.
| Immigration Origin | # Population | % Population |
| England | 5 | 0.9% |
| Europe | 5 | 0.9% |
| Northern Europe | 5 | 0.9% | View All 3 Rows |
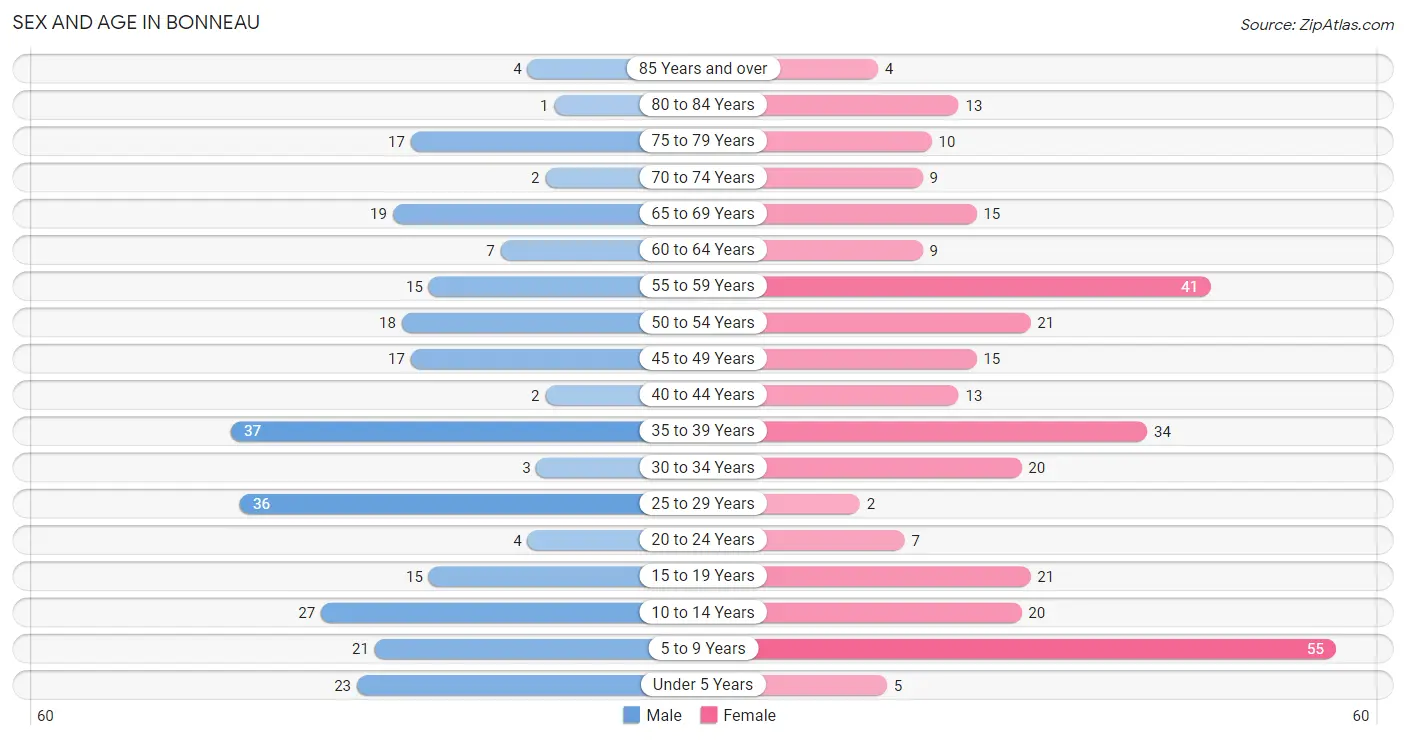
Sex and Age in Bonneau
Sex and Age in Bonneau
The most populous age groups in Bonneau are 35 to 39 Years (37 | 13.8%) for men and 5 to 9 Years (55 | 17.5%) for women.
| Age Bracket | Male | Female |
| Under 5 Years | 23 (8.6%) | 5 (1.6%) |
| 5 to 9 Years | 21 (7.8%) | 55 (17.5%) |
| 10 to 14 Years | 27 (10.1%) | 20 (6.4%) |
| 15 to 19 Years | 15 (5.6%) | 21 (6.7%) |
| 20 to 24 Years | 4 (1.5%) | 7 (2.2%) |
| 25 to 29 Years | 36 (13.4%) | 2 (0.6%) |
| 30 to 34 Years | 3 (1.1%) | 20 (6.4%) |
| 35 to 39 Years | 37 (13.8%) | 34 (10.8%) |
| 40 to 44 Years | 2 (0.7%) | 13 (4.1%) |
| 45 to 49 Years | 17 (6.3%) | 15 (4.8%) |
| 50 to 54 Years | 18 (6.7%) | 21 (6.7%) |
| 55 to 59 Years | 15 (5.6%) | 41 (13.1%) |
| 60 to 64 Years | 7 (2.6%) | 9 (2.9%) |
| 65 to 69 Years | 19 (7.1%) | 15 (4.8%) |
| 70 to 74 Years | 2 (0.7%) | 9 (2.9%) |
| 75 to 79 Years | 17 (6.3%) | 10 (3.2%) |
| 80 to 84 Years | 1 (0.4%) | 13 (4.1%) |
| 85 Years and over | 4 (1.5%) | 4 (1.3%) |
| Total | 268 (100.0%) | 314 (100.0%) |
Families and Households in Bonneau
Median Family Size in Bonneau
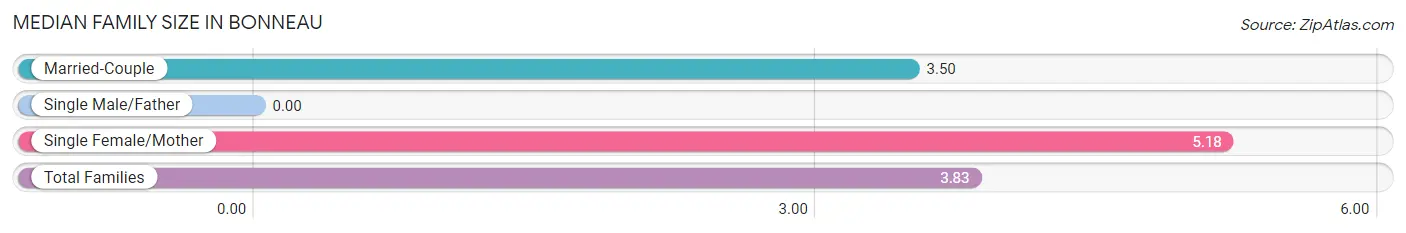
| Family Type | # Families | Family Size |
| Married-Couple | 111 (79.9%) | 3.50 |
| Single Male/Father | 0 (0.0%) | - |
| Single Female/Mother | 28 (20.1%) | 5.18 |
| Total Families | 139 (100.0%) | 3.83 |
Median Household Size in Bonneau
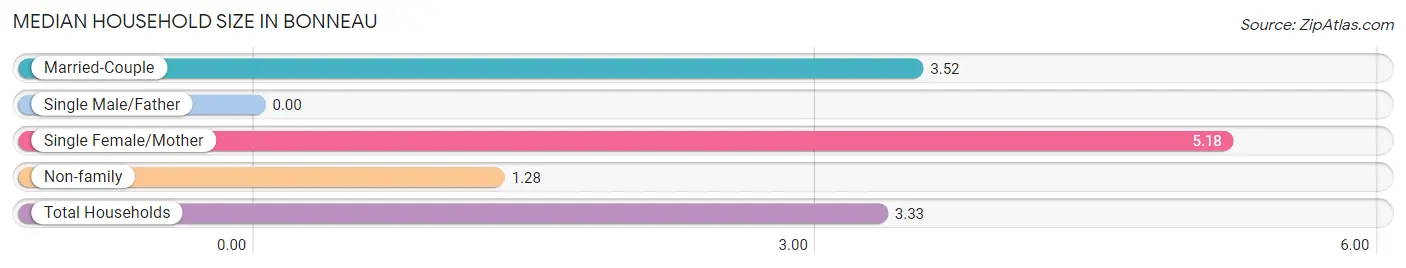
| Household Type | # Households | Household Size |
| Married-Couple | 111 (63.4%) | 3.52 |
| Single Male/Father | 0 (0.0%) | - |
| Single Female/Mother | 28 (16.0%) | 5.18 |
| Non-family | 36 (20.6%) | 1.28 |
| Total Households | 175 (100.0%) | 3.33 |
Household Size by Marriage Status in Bonneau
Out of a total of 175 households in Bonneau, 139 (79.4%) are family households, while 36 (20.6%) are nonfamily households. The most numerous type of family households are 2-person households, comprising 62, and the most common type of nonfamily households are 1-person households, comprising 28.
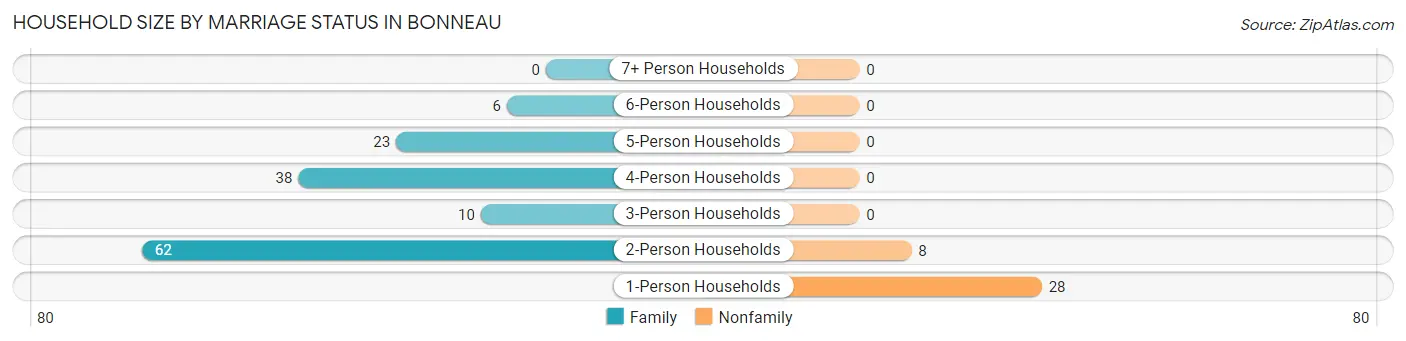
| Household Size | Family Households | Nonfamily Households |
| 1-Person Households | - | 28 (16.0%) |
| 2-Person Households | 62 (35.4%) | 8 (4.6%) |
| 3-Person Households | 10 (5.7%) | 0 (0.0%) |
| 4-Person Households | 38 (21.7%) | 0 (0.0%) |
| 5-Person Households | 23 (13.1%) | 0 (0.0%) |
| 6-Person Households | 6 (3.4%) | 0 (0.0%) |
| 7+ Person Households | 0 (0.0%) | 0 (0.0%) |
| Total | 139 (79.4%) | 36 (20.6%) |
Female Fertility in Bonneau
Fertility by Age in Bonneau
Average fertility rate in Bonneau is 9.0 births per 1,000 women. Women in the age bracket of 20 to 34 years have the highest fertility rate with 34.0 births per 1,000 women. Women in the age bracket of 20 to 34 years acount for 100.0% of all women with births.

| Age Bracket | Women with Births | Births / 1,000 Women |
| 15 to 19 years | 0 (0.0%) | 0.0 |
| 20 to 34 years | 1 (100.0%) | 34.0 |
| 35 to 50 years | 0 (0.0%) | 0.0 |
| Total | 1 (100.0%) | 9.0 |
Fertility by Age by Marriage Status in Bonneau
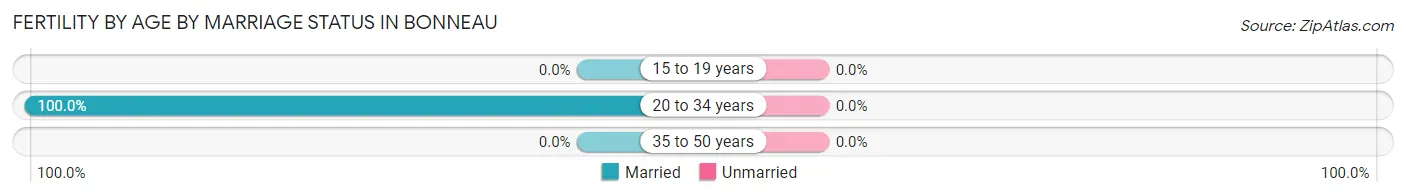
| Age Bracket | Married | Unmarried |
| 15 to 19 years | 0 (0.0%) | 0 (0.0%) |
| 20 to 34 years | 1 (100.0%) | 0 (0.0%) |
| 35 to 50 years | 0 (0.0%) | 0 (0.0%) |
| Total | 1 (100.0%) | 0 (0.0%) |
Fertility by Education in Bonneau
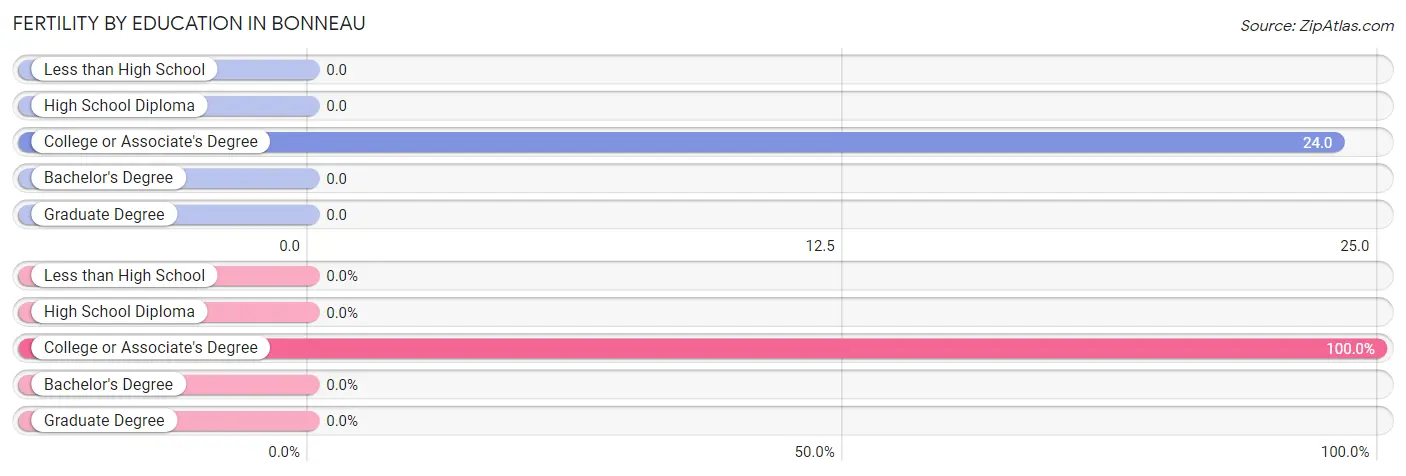
| Educational Attainment | Women with Births | Births / 1,000 Women |
| Less than High School | 0 (0.0%) | 0.0 |
| High School Diploma | 0 (0.0%) | 0.0 |
| College or Associate's Degree | 1 (100.0%) | 24.0 |
| Bachelor's Degree | 0 (0.0%) | 0.0 |
| Graduate Degree | 0 (0.0%) | 0.0 |
| Total | 1 (100.0%) | 9.0 |
Fertility by Education by Marriage Status in Bonneau
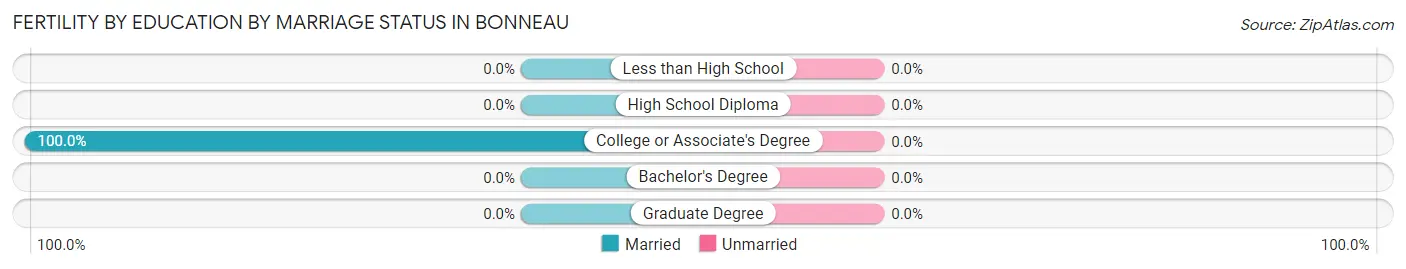
| Educational Attainment | Married | Unmarried |
| Less than High School | 0 (0.0%) | 0 (0.0%) |
| High School Diploma | 0 (0.0%) | 0 (0.0%) |
| College or Associate's Degree | 1 (100.0%) | 0 (0.0%) |
| Bachelor's Degree | 0 (0.0%) | 0 (0.0%) |
| Graduate Degree | 0 (0.0%) | 0 (0.0%) |
| Total | 1 (100.0%) | 0 (0.0%) |
Employment Characteristics in Bonneau
Employment by Class of Employer in Bonneau
Among the 188 employed individuals in Bonneau, private company employees (93 | 49.5%), federal government employees (29 | 15.4%), and local government employees (22 | 11.7%) make up the most common classes of employment.
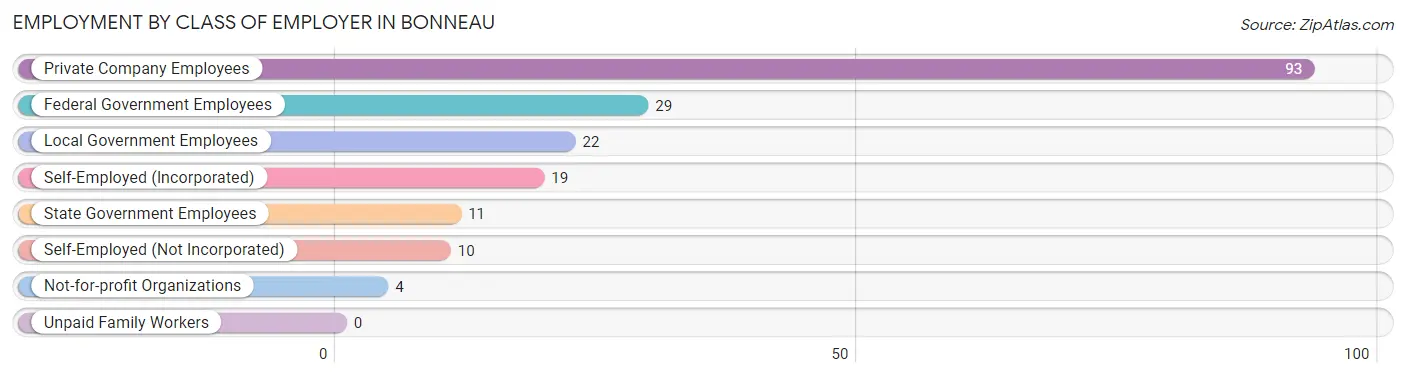
| Employer Class | # Employees | % Employees |
| Private Company Employees | 93 | 49.5% |
| Self-Employed (Incorporated) | 19 | 10.1% |
| Self-Employed (Not Incorporated) | 10 | 5.3% |
| Not-for-profit Organizations | 4 | 2.1% |
| Local Government Employees | 22 | 11.7% |
| State Government Employees | 11 | 5.9% |
| Federal Government Employees | 29 | 15.4% |
| Unpaid Family Workers | 0 | 0.0% |
| Total | 188 | 100.0% |
Employment Status by Age in Bonneau
According to the labor force statistics for Bonneau, out of the total population over 16 years of age (429), 51.3% or 220 individuals are in the labor force, with 14.5% or 32 of them unemployed. The age group with the highest labor force participation rate is 45 to 54 years, with 93.0% or 66 individuals in the labor force. Within the labor force, the 25 to 29 years age range has the highest percentage of unemployed individuals, with 50.0% or 2 of them being unemployed.
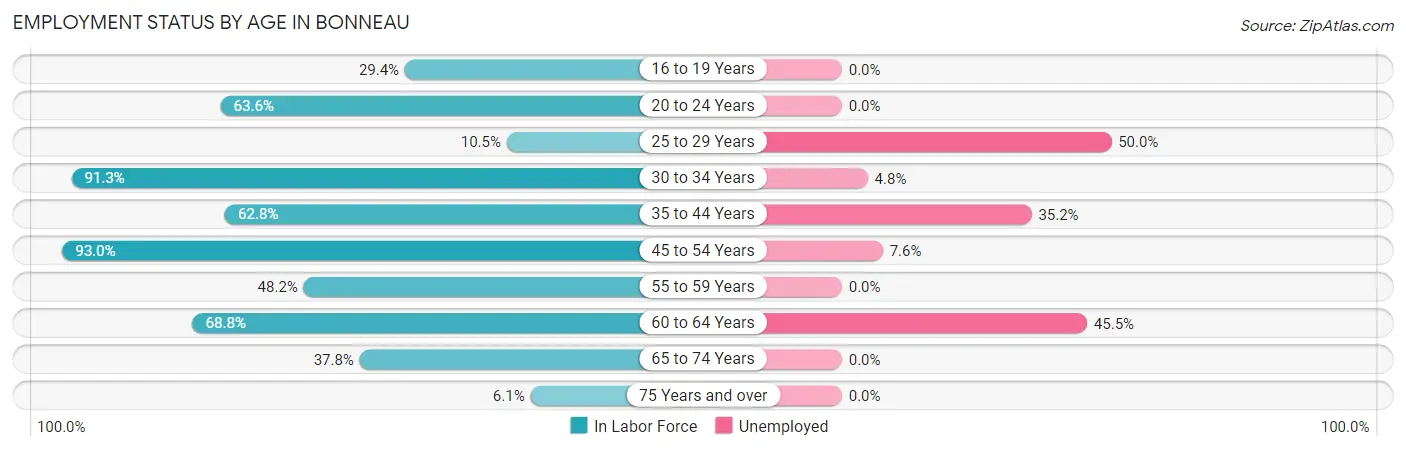
| Age Bracket | In Labor Force | Unemployed |
| 16 to 19 Years | 10 (29.4%) | 0 (0.0%) |
| 20 to 24 Years | 7 (63.6%) | 0 (0.0%) |
| 25 to 29 Years | 4 (10.5%) | 2 (50.0%) |
| 30 to 34 Years | 21 (91.3%) | 1 (4.8%) |
| 35 to 44 Years | 54 (62.8%) | 19 (35.2%) |
| 45 to 54 Years | 66 (93.0%) | 5 (7.6%) |
| 55 to 59 Years | 27 (48.2%) | 0 (0.0%) |
| 60 to 64 Years | 11 (68.8%) | 5 (45.5%) |
| 65 to 74 Years | 17 (37.8%) | 0 (0.0%) |
| 75 Years and over | 3 (6.1%) | 0 (0.0%) |
| Total | 220 (51.3%) | 32 (14.5%) |
Employment Status by Educational Attainment in Bonneau
According to labor force statistics for Bonneau, 63.1% of individuals (183) out of the total population between 25 and 64 years of age (290) are in the labor force, with 17.5% or 32 of them being unemployed. The group with the highest labor force participation rate are those with the educational attainment of bachelor's degree or higher, with 92.5% or 37 individuals in the labor force. Within the labor force, individuals with less than high school education have the highest percentage of unemployment, with 61.9% or 13 of them being unemployed.
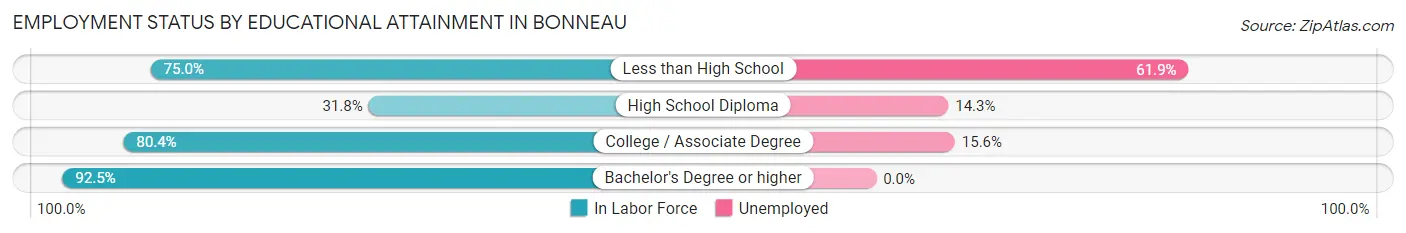
| Educational Attainment | In Labor Force | Unemployed |
| Less than High School | 21 (75.0%) | 17 (61.9%) |
| High School Diploma | 35 (31.8%) | 16 (14.3%) |
| College / Associate Degree | 90 (80.4%) | 17 (15.6%) |
| Bachelor's Degree or higher | 37 (92.5%) | 0 (0.0%) |
| Total | 183 (63.1%) | 51 (17.5%) |
Employment Occupations by Sex in Bonneau
Management, Business, Science and Arts Occupations
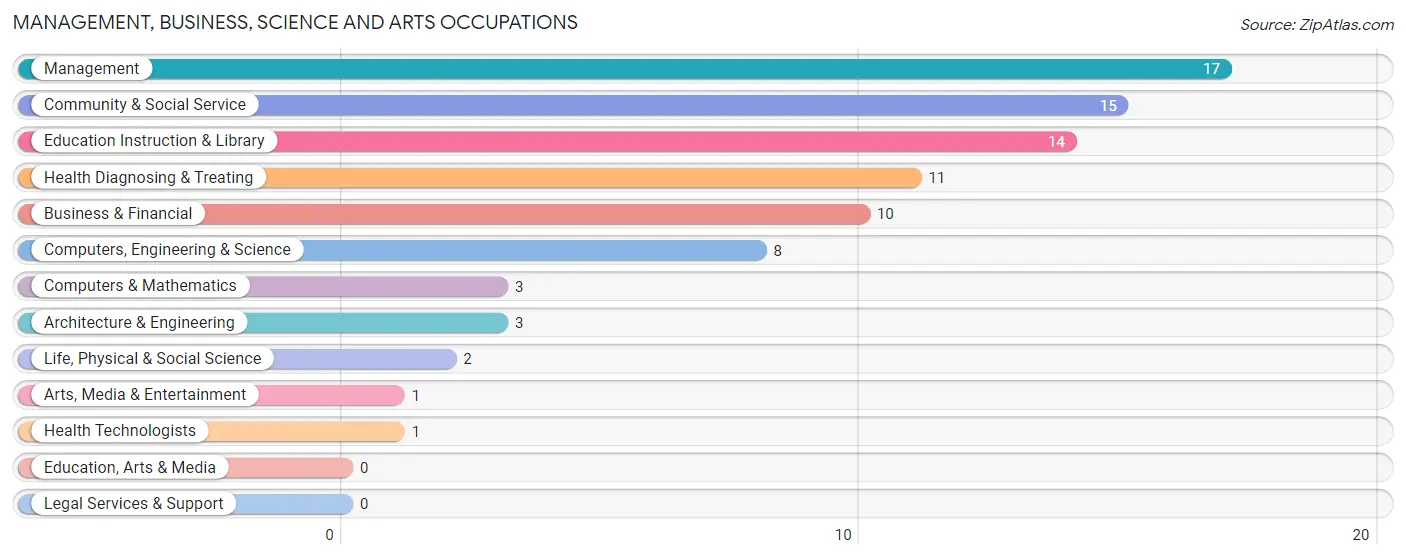
The most common Management, Business, Science and Arts occupations in Bonneau are Management (17 | 9.0%), Community & Social Service (15 | 8.0%), Education Instruction & Library (14 | 7.4%), Health Diagnosing & Treating (11 | 5.9%), and Business & Financial (10 | 5.3%).
Management, Business, Science and Arts Occupations by Sex
Within the Management, Business, Science and Arts occupations in Bonneau, the most male-oriented occupations are Architecture & Engineering (100.0%), Life, Physical & Social Science (100.0%), and Arts, Media & Entertainment (100.0%), while the most female-oriented occupations are Education Instruction & Library (100.0%), Health Diagnosing & Treating (100.0%), and Health Technologists (100.0%).
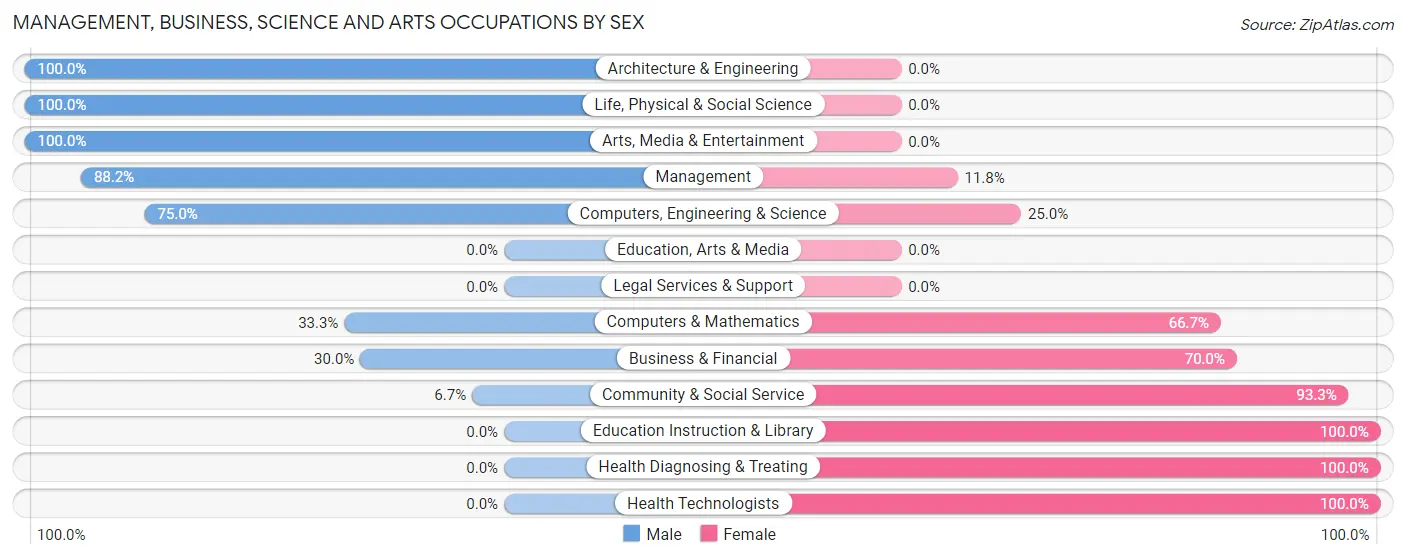
| Occupation | Male | Female |
| Management | 15 (88.2%) | 2 (11.8%) |
| Business & Financial | 3 (30.0%) | 7 (70.0%) |
| Computers, Engineering & Science | 6 (75.0%) | 2 (25.0%) |
| Computers & Mathematics | 1 (33.3%) | 2 (66.7%) |
| Architecture & Engineering | 3 (100.0%) | 0 (0.0%) |
| Life, Physical & Social Science | 2 (100.0%) | 0 (0.0%) |
| Community & Social Service | 1 (6.7%) | 14 (93.3%) |
| Education, Arts & Media | 0 (0.0%) | 0 (0.0%) |
| Legal Services & Support | 0 (0.0%) | 0 (0.0%) |
| Education Instruction & Library | 0 (0.0%) | 14 (100.0%) |
| Arts, Media & Entertainment | 1 (100.0%) | 0 (0.0%) |
| Health Diagnosing & Treating | 0 (0.0%) | 11 (100.0%) |
| Health Technologists | 0 (0.0%) | 1 (100.0%) |
| Total (Category) | 25 (41.0%) | 36 (59.0%) |
| Total (Overall) | 91 (48.4%) | 97 (51.6%) |
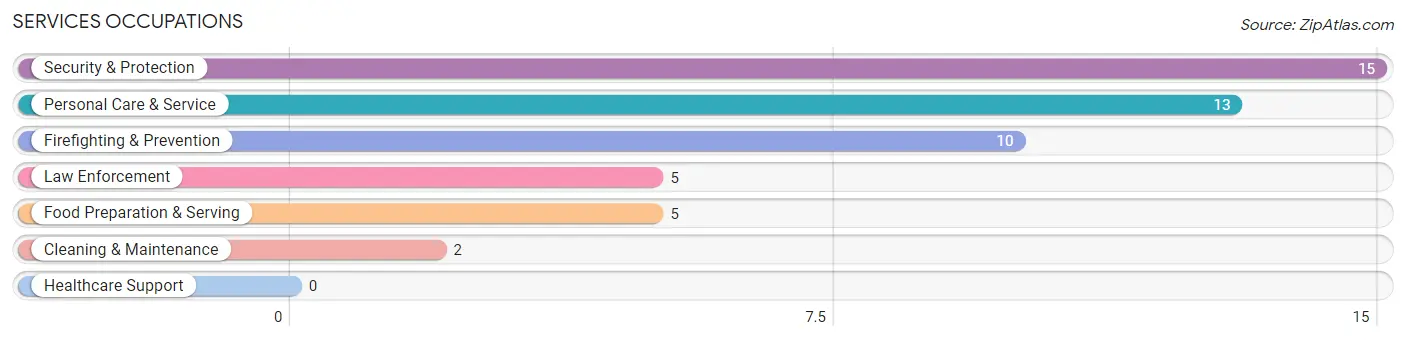
Services Occupations
The most common Services occupations in Bonneau are Security & Protection (15 | 8.0%), Personal Care & Service (13 | 6.9%), Firefighting & Prevention (10 | 5.3%), Law Enforcement (5 | 2.7%), and Food Preparation & Serving (5 | 2.7%).
Services Occupations by Sex
Within the Services occupations in Bonneau, the most male-oriented occupations are Security & Protection (100.0%), Firefighting & Prevention (100.0%), and Law Enforcement (100.0%), while the most female-oriented occupations are Food Preparation & Serving (100.0%), Cleaning & Maintenance (100.0%), and Personal Care & Service (100.0%).
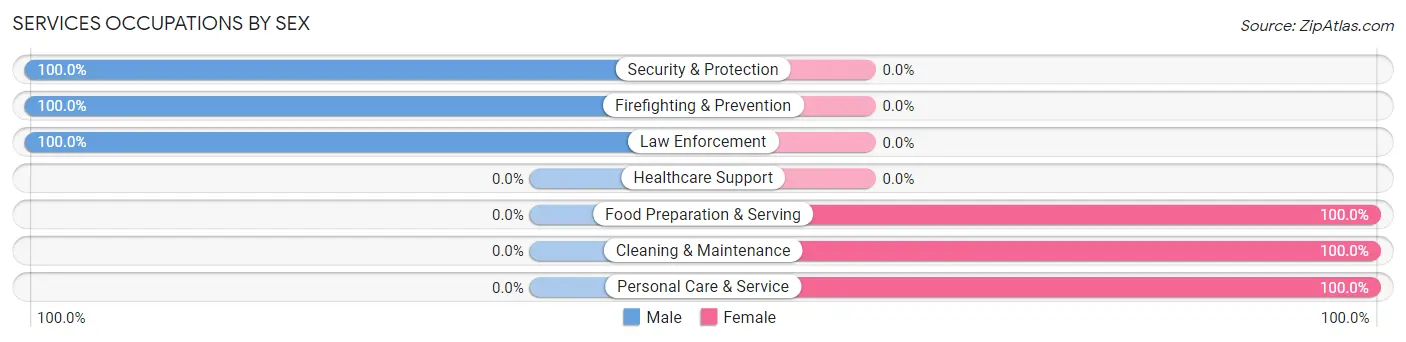
| Occupation | Male | Female |
| Healthcare Support | 0 (0.0%) | 0 (0.0%) |
| Security & Protection | 15 (100.0%) | 0 (0.0%) |
| Firefighting & Prevention | 10 (100.0%) | 0 (0.0%) |
| Law Enforcement | 5 (100.0%) | 0 (0.0%) |
| Food Preparation & Serving | 0 (0.0%) | 5 (100.0%) |
| Cleaning & Maintenance | 0 (0.0%) | 2 (100.0%) |
| Personal Care & Service | 0 (0.0%) | 13 (100.0%) |
| Total (Category) | 15 (42.9%) | 20 (57.1%) |
| Total (Overall) | 91 (48.4%) | 97 (51.6%) |
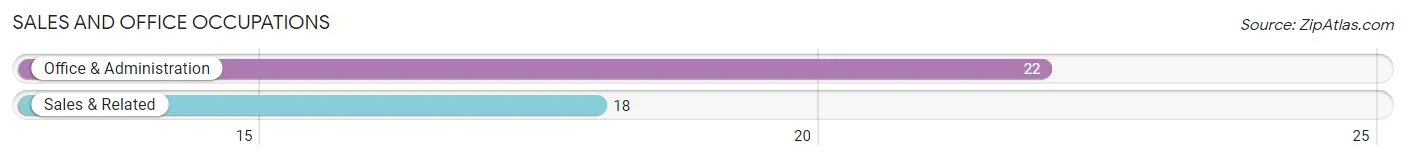
Sales and Office Occupations
The most common Sales and Office occupations in Bonneau are Office & Administration (22 | 11.7%), and Sales & Related (18 | 9.6%).
Sales and Office Occupations by Sex
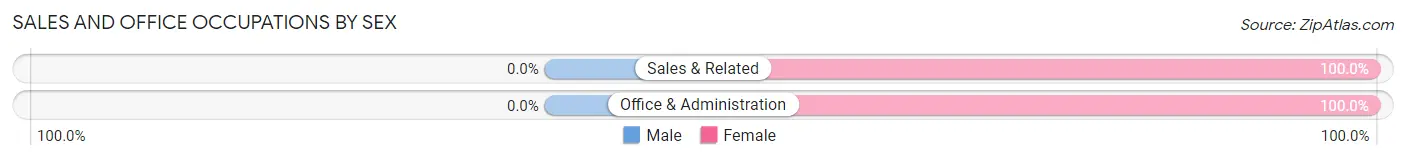
| Occupation | Male | Female |
| Sales & Related | 0 (0.0%) | 18 (100.0%) |
| Office & Administration | 0 (0.0%) | 22 (100.0%) |
| Total (Category) | 0 (0.0%) | 40 (100.0%) |
| Total (Overall) | 91 (48.4%) | 97 (51.6%) |
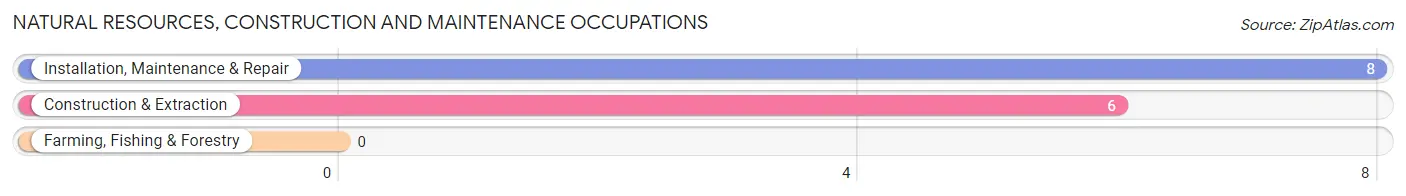
Natural Resources, Construction and Maintenance Occupations
The most common Natural Resources, Construction and Maintenance occupations in Bonneau are Installation, Maintenance & Repair (8 | 4.3%), and Construction & Extraction (6 | 3.2%).
Natural Resources, Construction and Maintenance Occupations by Sex
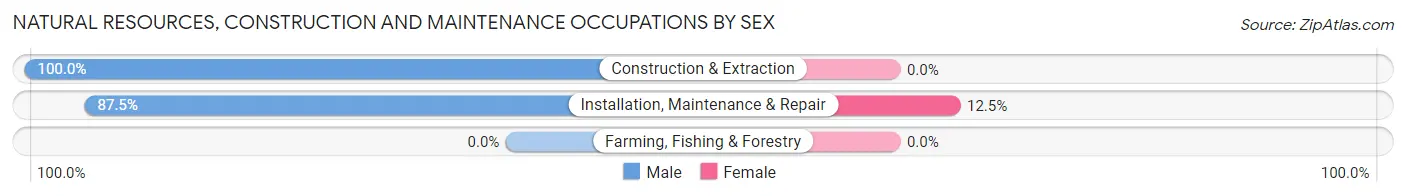
| Occupation | Male | Female |
| Farming, Fishing & Forestry | 0 (0.0%) | 0 (0.0%) |
| Construction & Extraction | 6 (100.0%) | 0 (0.0%) |
| Installation, Maintenance & Repair | 7 (87.5%) | 1 (12.5%) |
| Total (Category) | 13 (92.9%) | 1 (7.1%) |
| Total (Overall) | 91 (48.4%) | 97 (51.6%) |
Production, Transportation and Moving Occupations
The most common Production, Transportation and Moving occupations in Bonneau are Production (22 | 11.7%), Material Moving (9 | 4.8%), and Transportation (7 | 3.7%).
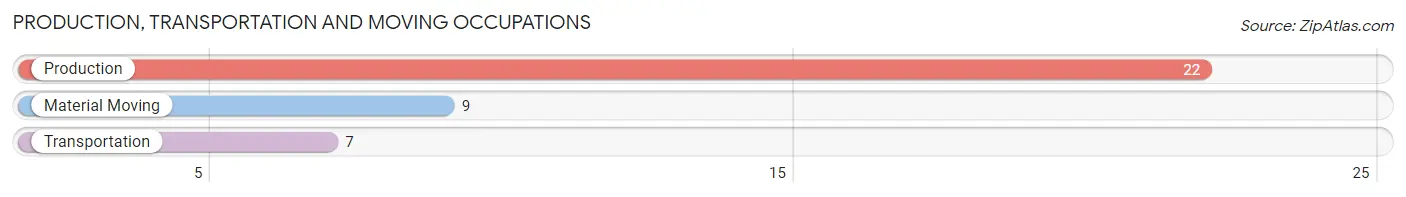
Production, Transportation and Moving Occupations by Sex
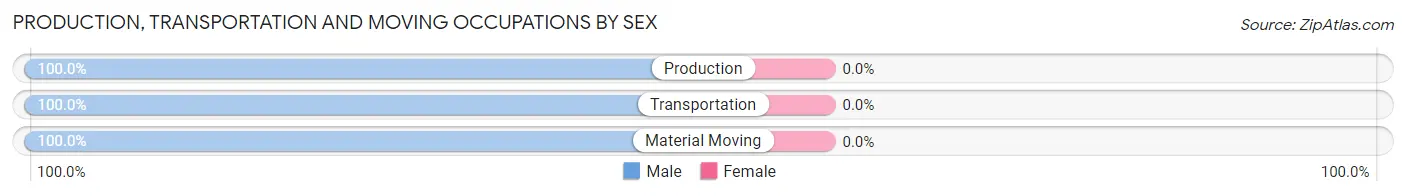
| Occupation | Male | Female |
| Production | 22 (100.0%) | 0 (0.0%) |
| Transportation | 7 (100.0%) | 0 (0.0%) |
| Material Moving | 9 (100.0%) | 0 (0.0%) |
| Total (Category) | 38 (100.0%) | 0 (0.0%) |
| Total (Overall) | 91 (48.4%) | 97 (51.6%) |
Employment Industries by Sex in Bonneau
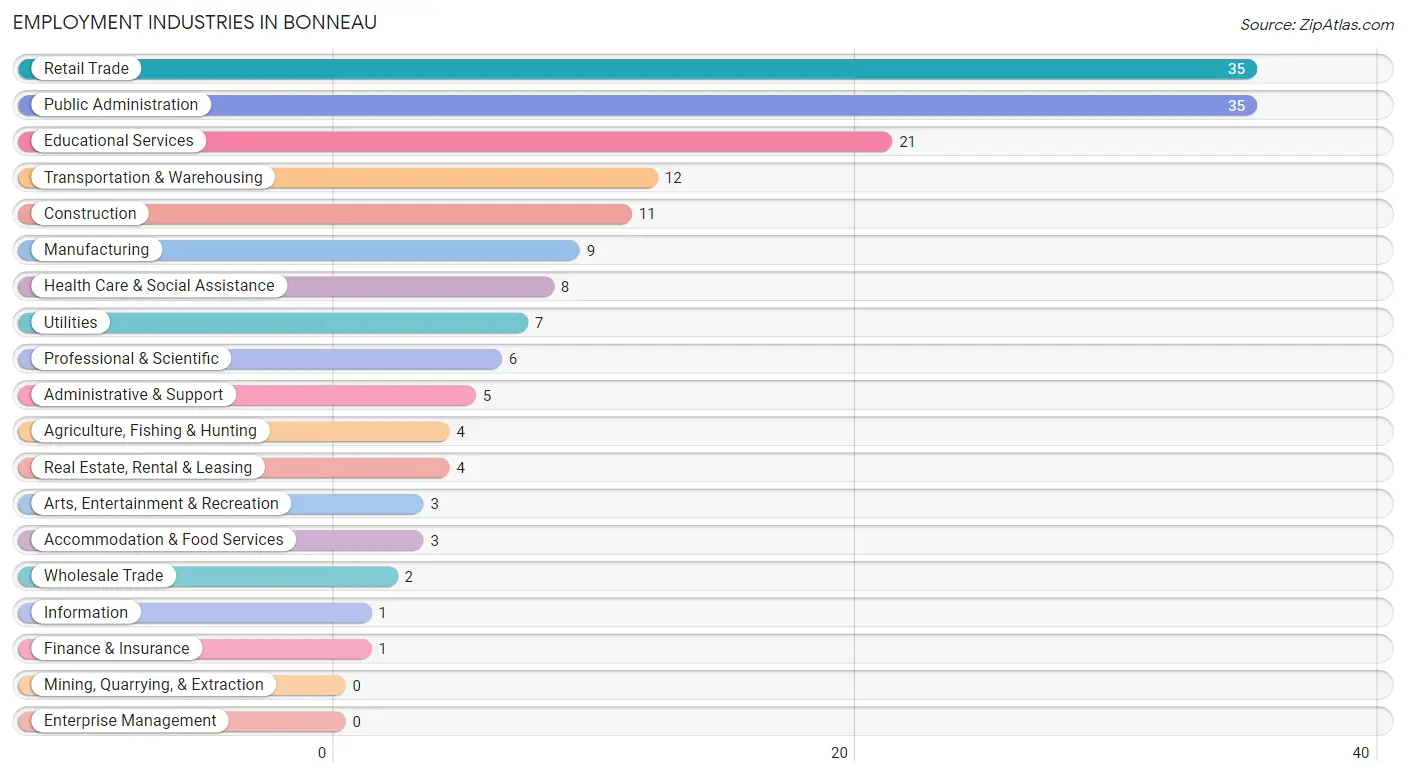
Employment Industries in Bonneau
The major employment industries in Bonneau include Retail Trade (35 | 18.6%), Public Administration (35 | 18.6%), Educational Services (21 | 11.2%), Transportation & Warehousing (12 | 6.4%), and Construction (11 | 5.9%).
Employment Industries by Sex in Bonneau
The Bonneau industries that see more men than women are Agriculture, Fishing & Hunting (100.0%), Construction (100.0%), and Wholesale Trade (100.0%), whereas the industries that tend to have a higher number of women are Finance & Insurance (100.0%), Real Estate, Rental & Leasing (100.0%), and Administrative & Support (100.0%).
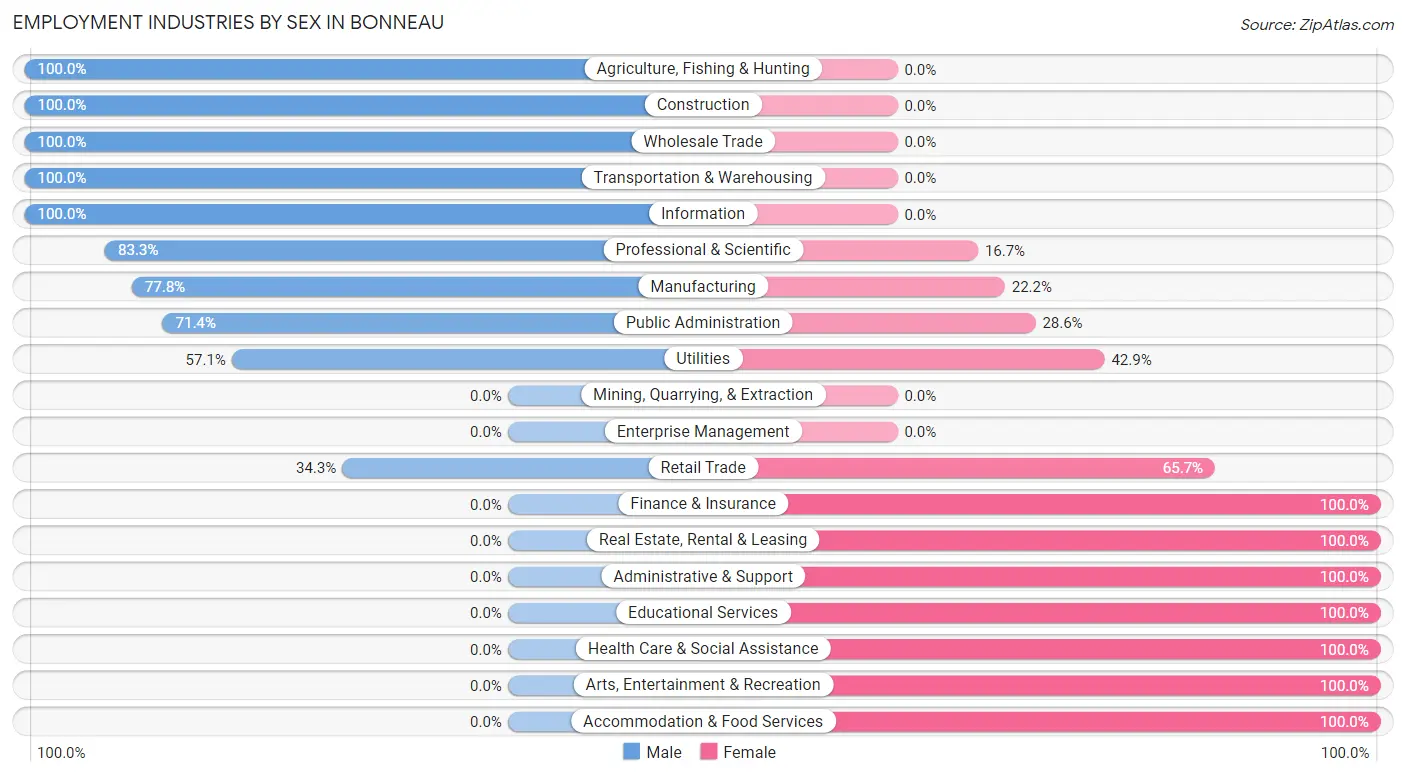
| Industry | Male | Female |
| Agriculture, Fishing & Hunting | 4 (100.0%) | 0 (0.0%) |
| Mining, Quarrying, & Extraction | 0 (0.0%) | 0 (0.0%) |
| Construction | 11 (100.0%) | 0 (0.0%) |
| Manufacturing | 7 (77.8%) | 2 (22.2%) |
| Wholesale Trade | 2 (100.0%) | 0 (0.0%) |
| Retail Trade | 12 (34.3%) | 23 (65.7%) |
| Transportation & Warehousing | 12 (100.0%) | 0 (0.0%) |
| Utilities | 4 (57.1%) | 3 (42.9%) |
| Information | 1 (100.0%) | 0 (0.0%) |
| Finance & Insurance | 0 (0.0%) | 1 (100.0%) |
| Real Estate, Rental & Leasing | 0 (0.0%) | 4 (100.0%) |
| Professional & Scientific | 5 (83.3%) | 1 (16.7%) |
| Enterprise Management | 0 (0.0%) | 0 (0.0%) |
| Administrative & Support | 0 (0.0%) | 5 (100.0%) |
| Educational Services | 0 (0.0%) | 21 (100.0%) |
| Health Care & Social Assistance | 0 (0.0%) | 8 (100.0%) |
| Arts, Entertainment & Recreation | 0 (0.0%) | 3 (100.0%) |
| Accommodation & Food Services | 0 (0.0%) | 3 (100.0%) |
| Public Administration | 25 (71.4%) | 10 (28.6%) |
| Total | 91 (48.4%) | 97 (51.6%) |
Education in Bonneau
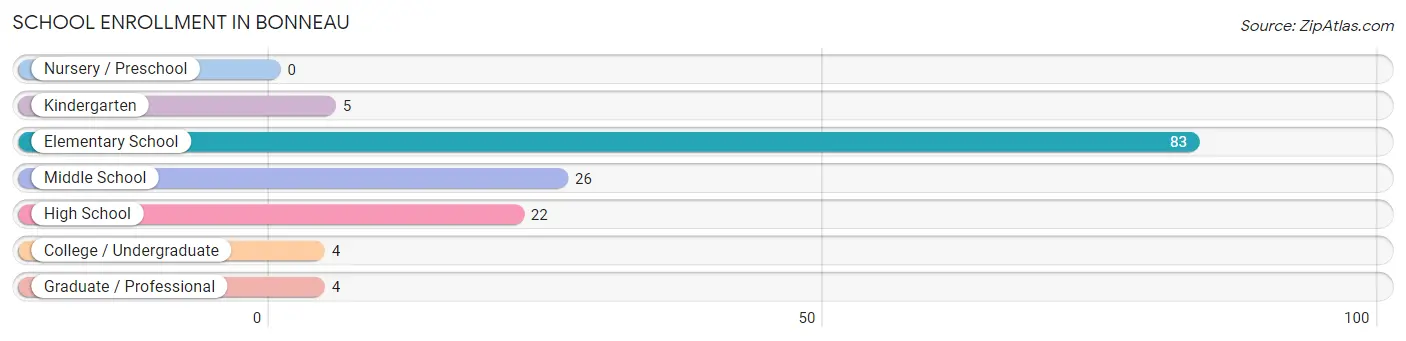
School Enrollment in Bonneau
The most common levels of schooling among the 144 students in Bonneau are elementary school (83 | 57.6%), middle school (26 | 18.1%), and high school (22 | 15.3%).
| School Level | # Students | % Students |
| Nursery / Preschool | 0 | 0.0% |
| Kindergarten | 5 | 3.5% |
| Elementary School | 83 | 57.6% |
| Middle School | 26 | 18.1% |
| High School | 22 | 15.3% |
| College / Undergraduate | 4 | 2.8% |
| Graduate / Professional | 4 | 2.8% |
| Total | 144 | 100.0% |
School Enrollment by Age by Funding Source in Bonneau
Out of a total of 144 students who are enrolled in schools in Bonneau, 23 (16.0%) attend a private institution, while the remaining 121 (84.0%) are enrolled in public schools. The age group of 3 to 4 year olds has the highest likelihood of being enrolled in private schools, with 1 (100.0% in the age bracket) enrolled. Conversely, the age group of 18 to 19 year olds has the lowest likelihood of being enrolled in a private school, with 2 (100.0% in the age bracket) attending a public institution.
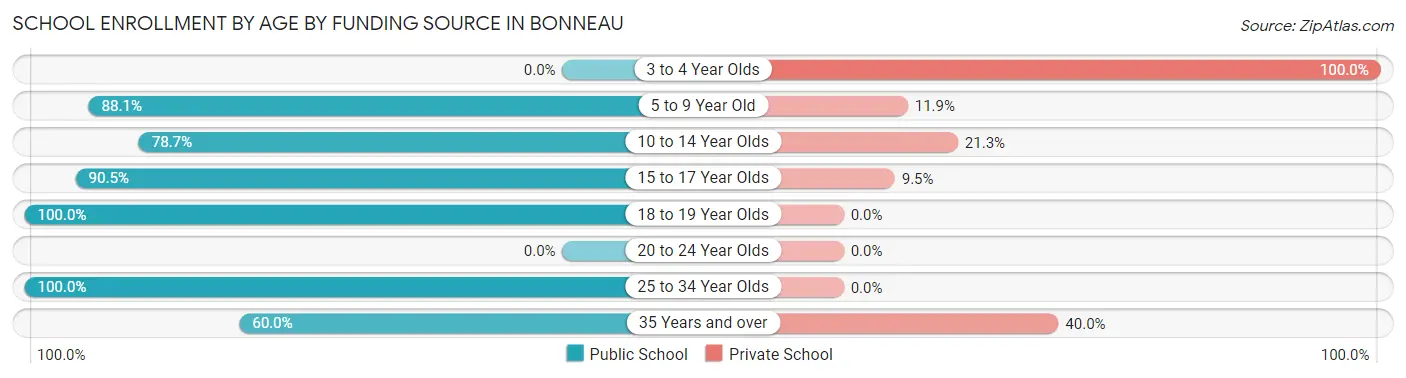
| Age Bracket | Public School | Private School |
| 3 to 4 Year Olds | 0 (0.0%) | 1 (100.0%) |
| 5 to 9 Year Old | 59 (88.1%) | 8 (11.9%) |
| 10 to 14 Year Olds | 37 (78.7%) | 10 (21.3%) |
| 15 to 17 Year Olds | 19 (90.5%) | 2 (9.5%) |
| 18 to 19 Year Olds | 2 (100.0%) | 0 (0.0%) |
| 20 to 24 Year Olds | 0 (0.0%) | 0 (0.0%) |
| 25 to 34 Year Olds | 1 (100.0%) | 0 (0.0%) |
| 35 Years and over | 3 (60.0%) | 2 (40.0%) |
| Total | 121 (84.0%) | 23 (16.0%) |
Educational Attainment by Field of Study in Bonneau
Business (24 | 40.0%), literature & languages (10 | 16.7%), computers & mathematics (7 | 11.7%), bio, nature & agricultural (7 | 11.7%), and visual & performing arts (5 | 8.3%) are the most common fields of study among 60 individuals in Bonneau who have obtained a bachelor's degree or higher.
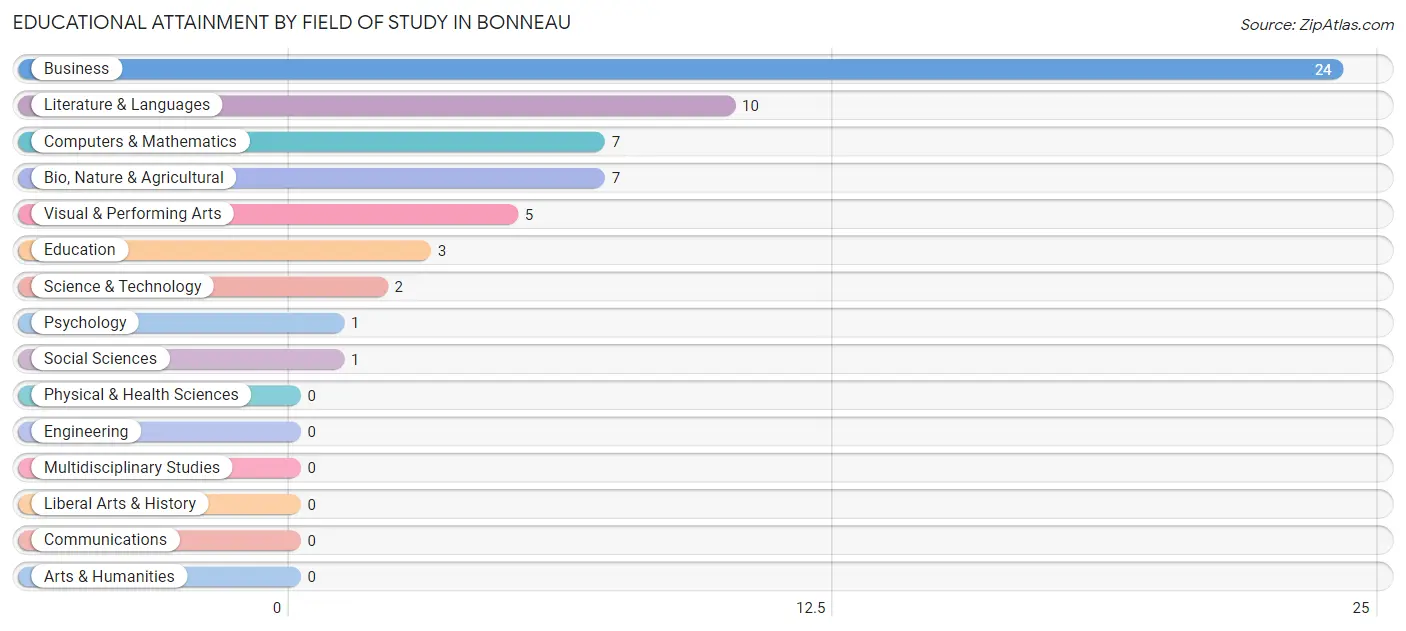
| Field of Study | # Graduates | % Graduates |
| Computers & Mathematics | 7 | 11.7% |
| Bio, Nature & Agricultural | 7 | 11.7% |
| Physical & Health Sciences | 0 | 0.0% |
| Psychology | 1 | 1.7% |
| Social Sciences | 1 | 1.7% |
| Engineering | 0 | 0.0% |
| Multidisciplinary Studies | 0 | 0.0% |
| Science & Technology | 2 | 3.3% |
| Business | 24 | 40.0% |
| Education | 3 | 5.0% |
| Literature & Languages | 10 | 16.7% |
| Liberal Arts & History | 0 | 0.0% |
| Visual & Performing Arts | 5 | 8.3% |
| Communications | 0 | 0.0% |
| Arts & Humanities | 0 | 0.0% |
| Total | 60 | 100.0% |
Transportation & Commute in Bonneau
Vehicle Availability by Sex in Bonneau
The most prevalent vehicle ownership categories in Bonneau are males with 2 vehicles (43, accounting for 47.2%) and females with 2 vehicles (50, making up 44.3%).
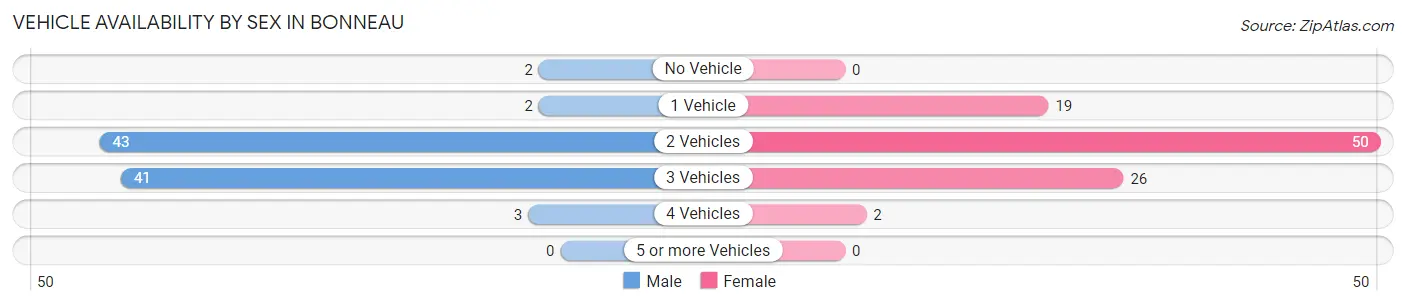
| Vehicles Available | Male | Female |
| No Vehicle | 2 (2.2%) | 0 (0.0%) |
| 1 Vehicle | 2 (2.2%) | 19 (19.6%) |
| 2 Vehicles | 43 (47.2%) | 50 (51.5%) |
| 3 Vehicles | 41 (45.1%) | 26 (26.8%) |
| 4 Vehicles | 3 (3.3%) | 2 (2.1%) |
| 5 or more Vehicles | 0 (0.0%) | 0 (0.0%) |
| Total | 91 (100.0%) | 97 (100.0%) |
Commute Time in Bonneau
The most frequently occuring commute durations in Bonneau are 60 to 89 minutes (42 commuters, 25.3%), 45 to 59 minutes (39 commuters, 23.5%), and 15 to 19 minutes (30 commuters, 18.1%).
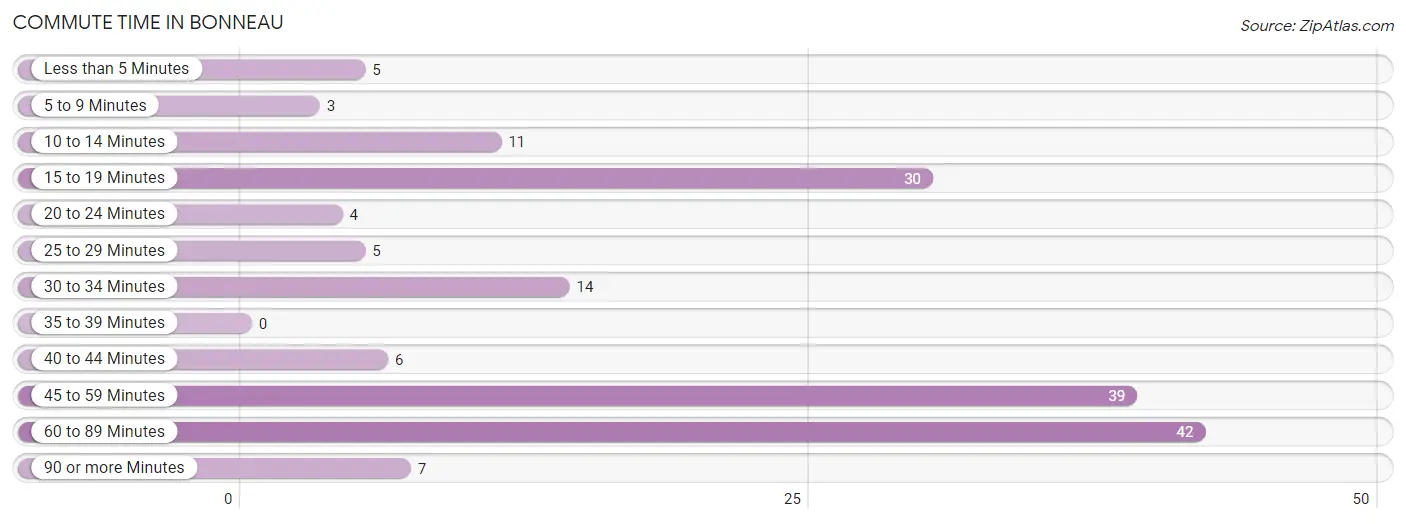
| Commute Time | # Commuters | % Commuters |
| Less than 5 Minutes | 5 | 3.0% |
| 5 to 9 Minutes | 3 | 1.8% |
| 10 to 14 Minutes | 11 | 6.6% |
| 15 to 19 Minutes | 30 | 18.1% |
| 20 to 24 Minutes | 4 | 2.4% |
| 25 to 29 Minutes | 5 | 3.0% |
| 30 to 34 Minutes | 14 | 8.4% |
| 35 to 39 Minutes | 0 | 0.0% |
| 40 to 44 Minutes | 6 | 3.6% |
| 45 to 59 Minutes | 39 | 23.5% |
| 60 to 89 Minutes | 42 | 25.3% |
| 90 or more Minutes | 7 | 4.2% |
Commute Time by Sex in Bonneau
The most common commute times in Bonneau are 45 to 59 minutes (18 commuters, 22.2%) for males and 60 to 89 minutes (24 commuters, 28.2%) for females.
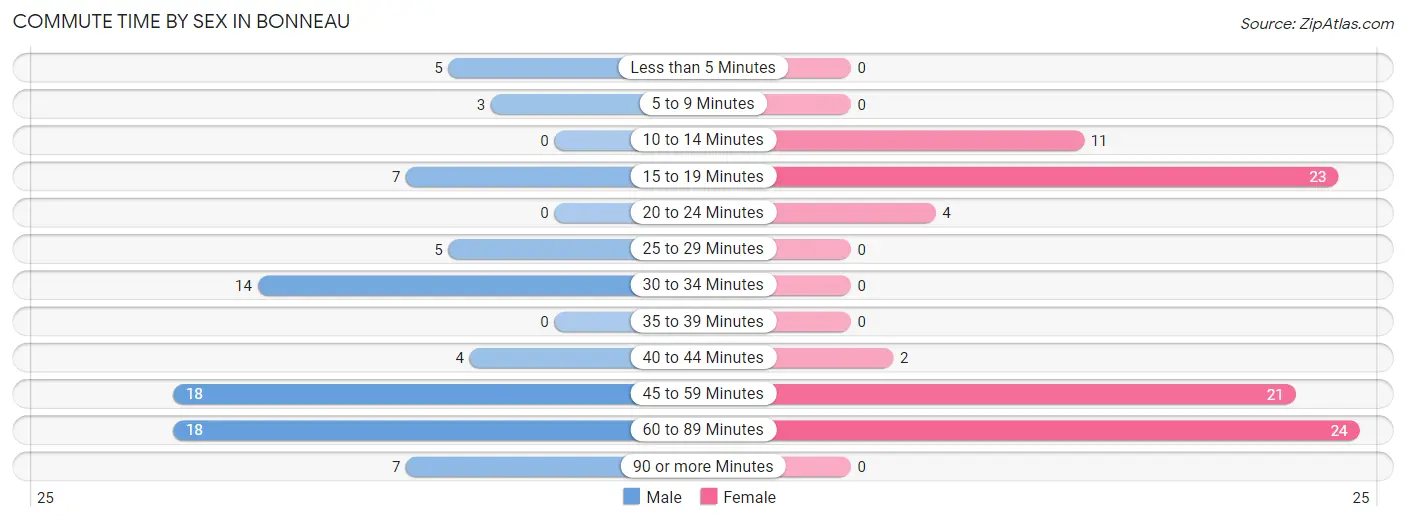
| Commute Time | Male | Female |
| Less than 5 Minutes | 5 (6.2%) | 0 (0.0%) |
| 5 to 9 Minutes | 3 (3.7%) | 0 (0.0%) |
| 10 to 14 Minutes | 0 (0.0%) | 11 (12.9%) |
| 15 to 19 Minutes | 7 (8.6%) | 23 (27.1%) |
| 20 to 24 Minutes | 0 (0.0%) | 4 (4.7%) |
| 25 to 29 Minutes | 5 (6.2%) | 0 (0.0%) |
| 30 to 34 Minutes | 14 (17.3%) | 0 (0.0%) |
| 35 to 39 Minutes | 0 (0.0%) | 0 (0.0%) |
| 40 to 44 Minutes | 4 (4.9%) | 2 (2.4%) |
| 45 to 59 Minutes | 18 (22.2%) | 21 (24.7%) |
| 60 to 89 Minutes | 18 (22.2%) | 24 (28.2%) |
| 90 or more Minutes | 7 (8.6%) | 0 (0.0%) |
Time of Departure to Work by Sex in Bonneau
The most frequent times of departure to work in Bonneau are 5:00 AM to 5:29 AM (17, 21.0%) for males and 5:00 AM to 5:29 AM (14, 16.5%) for females.
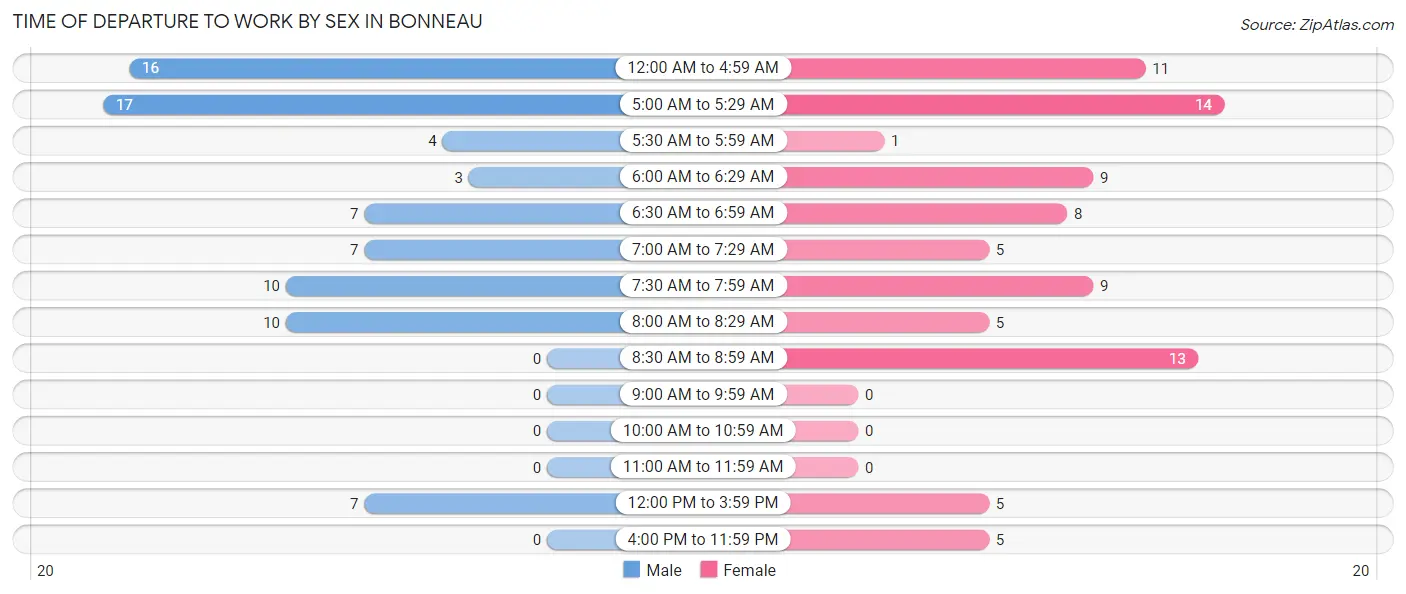
| Time of Departure | Male | Female |
| 12:00 AM to 4:59 AM | 16 (19.8%) | 11 (12.9%) |
| 5:00 AM to 5:29 AM | 17 (21.0%) | 14 (16.5%) |
| 5:30 AM to 5:59 AM | 4 (4.9%) | 1 (1.2%) |
| 6:00 AM to 6:29 AM | 3 (3.7%) | 9 (10.6%) |
| 6:30 AM to 6:59 AM | 7 (8.6%) | 8 (9.4%) |
| 7:00 AM to 7:29 AM | 7 (8.6%) | 5 (5.9%) |
| 7:30 AM to 7:59 AM | 10 (12.3%) | 9 (10.6%) |
| 8:00 AM to 8:29 AM | 10 (12.3%) | 5 (5.9%) |
| 8:30 AM to 8:59 AM | 0 (0.0%) | 13 (15.3%) |
| 9:00 AM to 9:59 AM | 0 (0.0%) | 0 (0.0%) |
| 10:00 AM to 10:59 AM | 0 (0.0%) | 0 (0.0%) |
| 11:00 AM to 11:59 AM | 0 (0.0%) | 0 (0.0%) |
| 12:00 PM to 3:59 PM | 7 (8.6%) | 5 (5.9%) |
| 4:00 PM to 11:59 PM | 0 (0.0%) | 5 (5.9%) |
| Total | 81 (100.0%) | 85 (100.0%) |
Housing Occupancy in Bonneau
Occupancy by Ownership in Bonneau
Of the total 175 dwellings in Bonneau, owner-occupied units account for 142 (81.1%), while renter-occupied units make up 33 (18.9%).
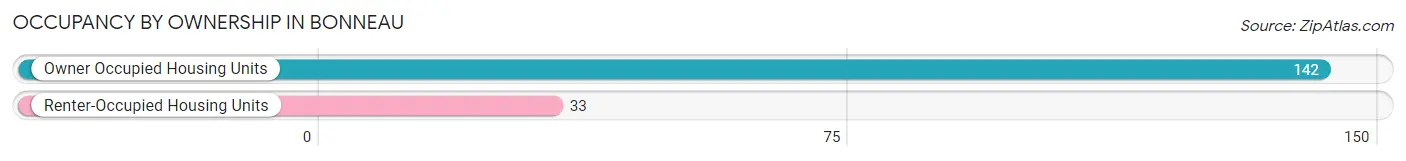
| Occupancy | # Housing Units | % Housing Units |
| Owner Occupied Housing Units | 142 | 81.1% |
| Renter-Occupied Housing Units | 33 | 18.9% |
| Total Occupied Housing Units | 175 | 100.0% |
Occupancy by Household Size in Bonneau
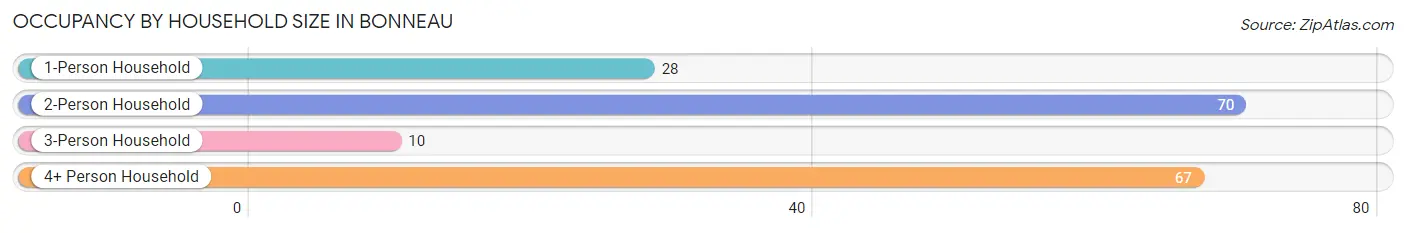
| Household Size | # Housing Units | % Housing Units |
| 1-Person Household | 28 | 16.0% |
| 2-Person Household | 70 | 40.0% |
| 3-Person Household | 10 | 5.7% |
| 4+ Person Household | 67 | 38.3% |
| Total Housing Units | 175 | 100.0% |
Occupancy by Ownership by Household Size in Bonneau
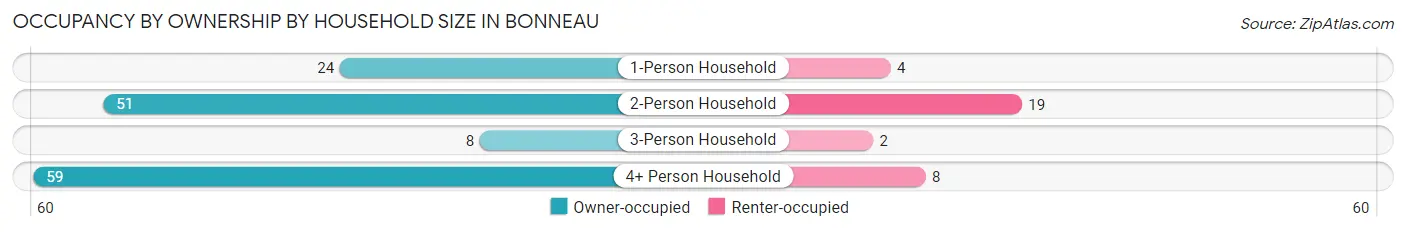
| Household Size | Owner-occupied | Renter-occupied |
| 1-Person Household | 24 (85.7%) | 4 (14.3%) |
| 2-Person Household | 51 (72.9%) | 19 (27.1%) |
| 3-Person Household | 8 (80.0%) | 2 (20.0%) |
| 4+ Person Household | 59 (88.1%) | 8 (11.9%) |
| Total Housing Units | 142 (81.1%) | 33 (18.9%) |
Occupancy by Educational Attainment in Bonneau
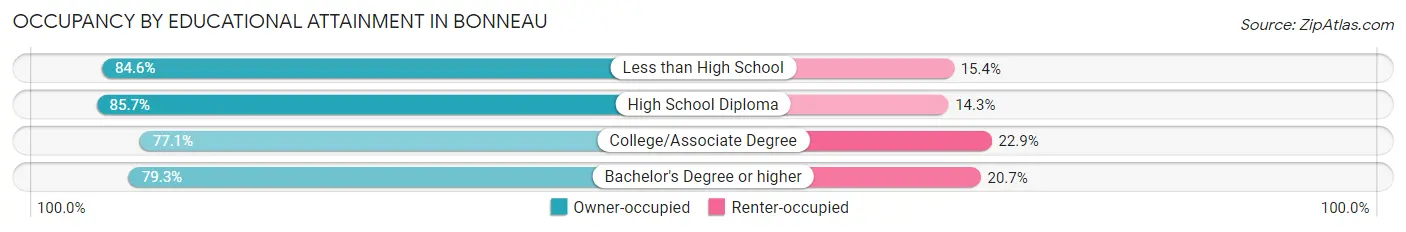
| Household Size | Owner-occupied | Renter-occupied |
| Less than High School | 11 (84.6%) | 2 (15.4%) |
| High School Diploma | 54 (85.7%) | 9 (14.3%) |
| College/Associate Degree | 54 (77.1%) | 16 (22.9%) |
| Bachelor's Degree or higher | 23 (79.3%) | 6 (20.7%) |
Occupancy by Age of Householder in Bonneau
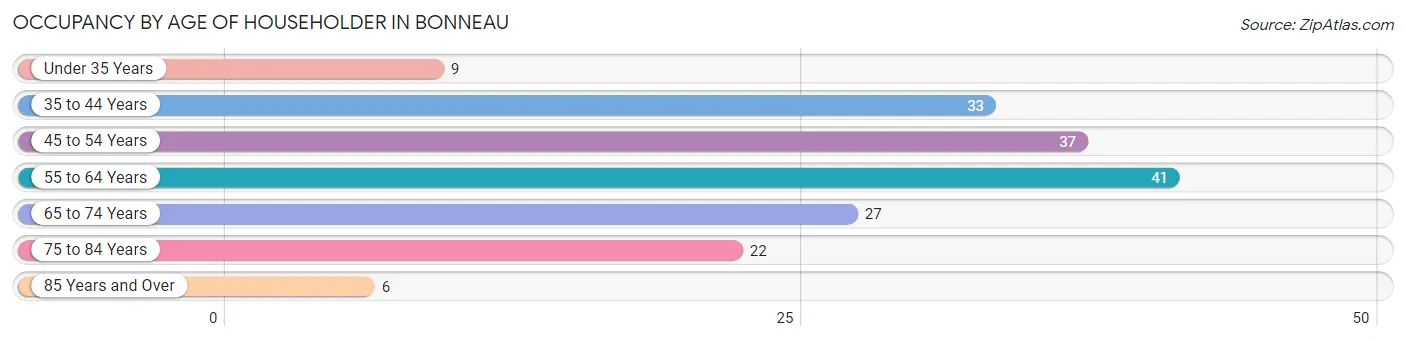
| Age Bracket | # Households | % Households |
| Under 35 Years | 9 | 5.1% |
| 35 to 44 Years | 33 | 18.9% |
| 45 to 54 Years | 37 | 21.1% |
| 55 to 64 Years | 41 | 23.4% |
| 65 to 74 Years | 27 | 15.4% |
| 75 to 84 Years | 22 | 12.6% |
| 85 Years and Over | 6 | 3.4% |
| Total | 175 | 100.0% |
Housing Finances in Bonneau
Median Income by Occupancy in Bonneau
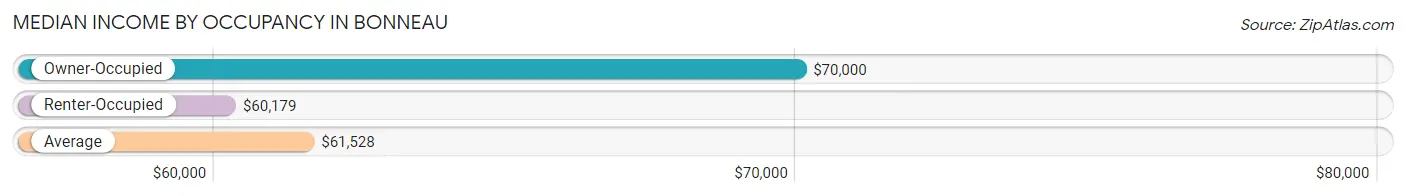
| Occupancy Type | # Households | Median Income |
| Owner-Occupied | 142 (81.1%) | $70,000 |
| Renter-Occupied | 33 (18.9%) | $60,179 |
| Average | 175 (100.0%) | $61,528 |
Occupancy by Householder Income Bracket in Bonneau
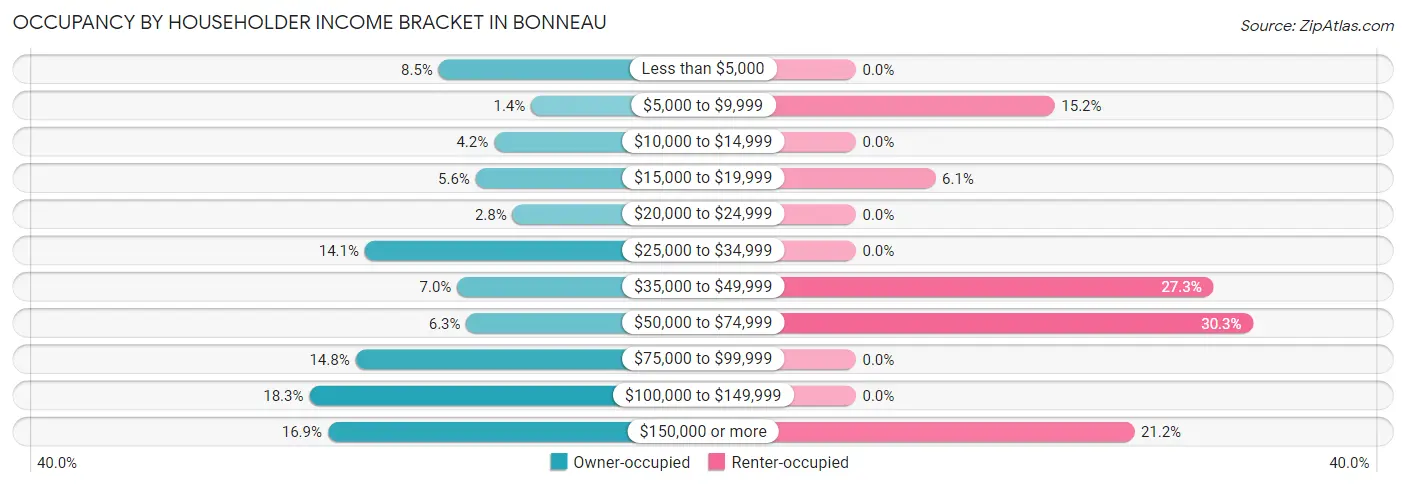
| Income Bracket | Owner-occupied | Renter-occupied |
| Less than $5,000 | 12 (8.5%) | 0 (0.0%) |
| $5,000 to $9,999 | 2 (1.4%) | 5 (15.1%) |
| $10,000 to $14,999 | 6 (4.2%) | 0 (0.0%) |
| $15,000 to $19,999 | 8 (5.6%) | 2 (6.1%) |
| $20,000 to $24,999 | 4 (2.8%) | 0 (0.0%) |
| $25,000 to $34,999 | 20 (14.1%) | 0 (0.0%) |
| $35,000 to $49,999 | 10 (7.0%) | 9 (27.3%) |
| $50,000 to $74,999 | 9 (6.3%) | 10 (30.3%) |
| $75,000 to $99,999 | 21 (14.8%) | 0 (0.0%) |
| $100,000 to $149,999 | 26 (18.3%) | 0 (0.0%) |
| $150,000 or more | 24 (16.9%) | 7 (21.2%) |
| Total | 142 (100.0%) | 33 (100.0%) |
Monthly Housing Cost Tiers in Bonneau
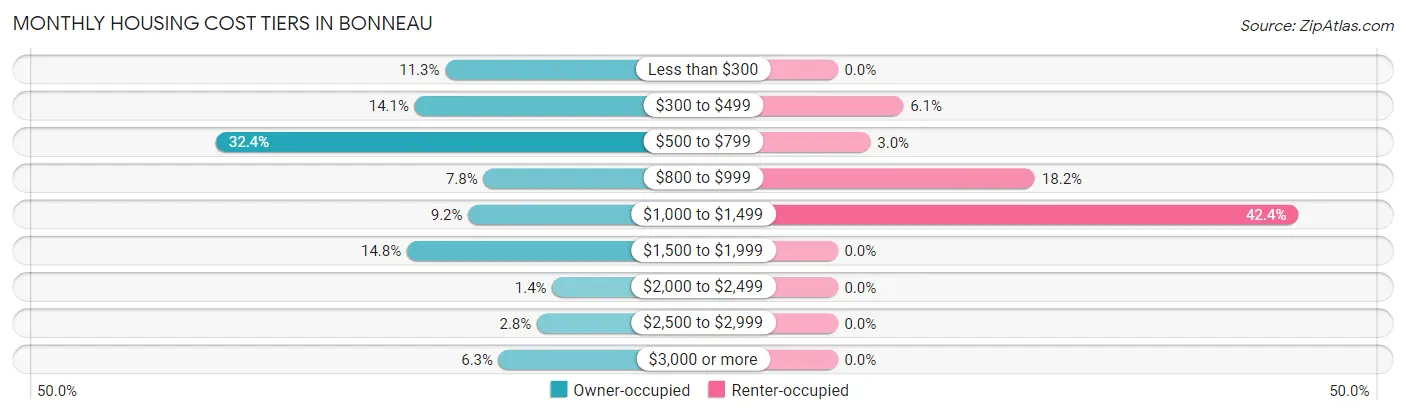
| Monthly Cost | Owner-occupied | Renter-occupied |
| Less than $300 | 16 (11.3%) | 0 (0.0%) |
| $300 to $499 | 20 (14.1%) | 2 (6.1%) |
| $500 to $799 | 46 (32.4%) | 1 (3.0%) |
| $800 to $999 | 11 (7.7%) | 6 (18.2%) |
| $1,000 to $1,499 | 13 (9.1%) | 14 (42.4%) |
| $1,500 to $1,999 | 21 (14.8%) | 0 (0.0%) |
| $2,000 to $2,499 | 2 (1.4%) | 0 (0.0%) |
| $2,500 to $2,999 | 4 (2.8%) | 0 (0.0%) |
| $3,000 or more | 9 (6.3%) | 0 (0.0%) |
| Total | 142 (100.0%) | 33 (100.0%) |
Physical Housing Characteristics in Bonneau
Housing Structures in Bonneau
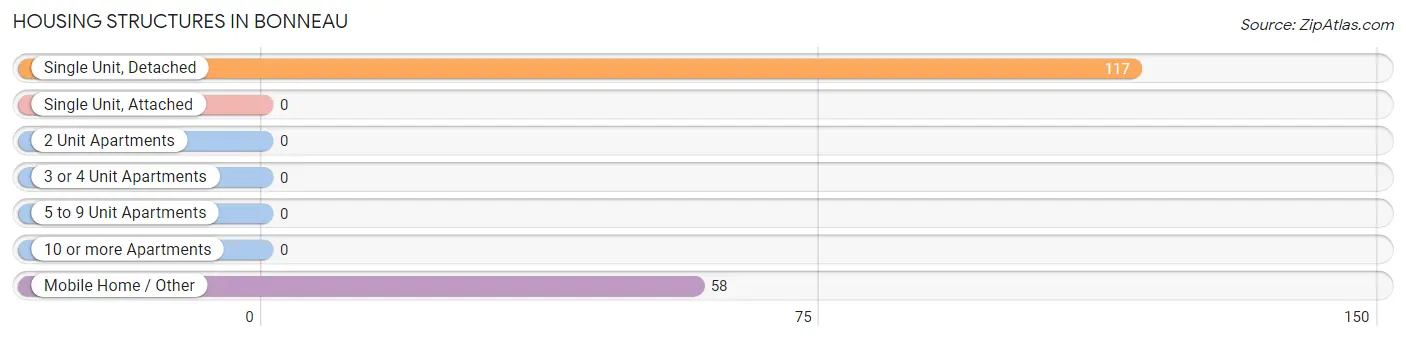
| Structure Type | # Housing Units | % Housing Units |
| Single Unit, Detached | 117 | 66.9% |
| Single Unit, Attached | 0 | 0.0% |
| 2 Unit Apartments | 0 | 0.0% |
| 3 or 4 Unit Apartments | 0 | 0.0% |
| 5 to 9 Unit Apartments | 0 | 0.0% |
| 10 or more Apartments | 0 | 0.0% |
| Mobile Home / Other | 58 | 33.1% |
| Total | 175 | 100.0% |
Housing Structures by Occupancy in Bonneau
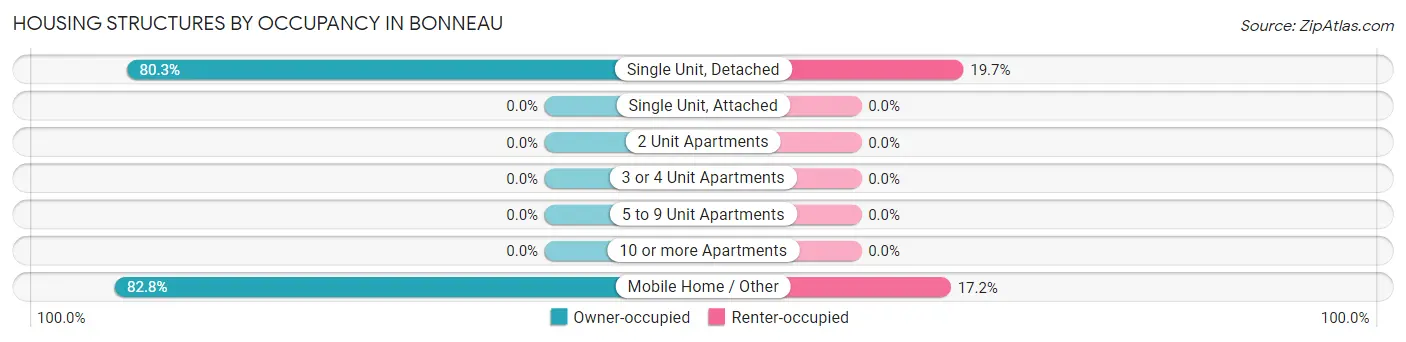
| Structure Type | Owner-occupied | Renter-occupied |
| Single Unit, Detached | 94 (80.3%) | 23 (19.7%) |
| Single Unit, Attached | 0 (0.0%) | 0 (0.0%) |
| 2 Unit Apartments | 0 (0.0%) | 0 (0.0%) |
| 3 or 4 Unit Apartments | 0 (0.0%) | 0 (0.0%) |
| 5 to 9 Unit Apartments | 0 (0.0%) | 0 (0.0%) |
| 10 or more Apartments | 0 (0.0%) | 0 (0.0%) |
| Mobile Home / Other | 48 (82.8%) | 10 (17.2%) |
| Total | 142 (81.1%) | 33 (18.9%) |
Housing Structures by Number of Rooms in Bonneau
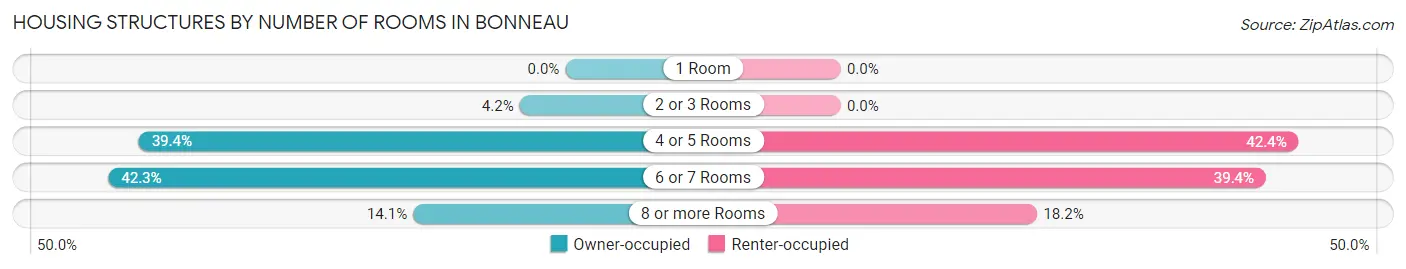
| Number of Rooms | Owner-occupied | Renter-occupied |
| 1 Room | 0 (0.0%) | 0 (0.0%) |
| 2 or 3 Rooms | 6 (4.2%) | 0 (0.0%) |
| 4 or 5 Rooms | 56 (39.4%) | 14 (42.4%) |
| 6 or 7 Rooms | 60 (42.2%) | 13 (39.4%) |
| 8 or more Rooms | 20 (14.1%) | 6 (18.2%) |
| Total | 142 (100.0%) | 33 (100.0%) |
Housing Structure by Heating Type in Bonneau
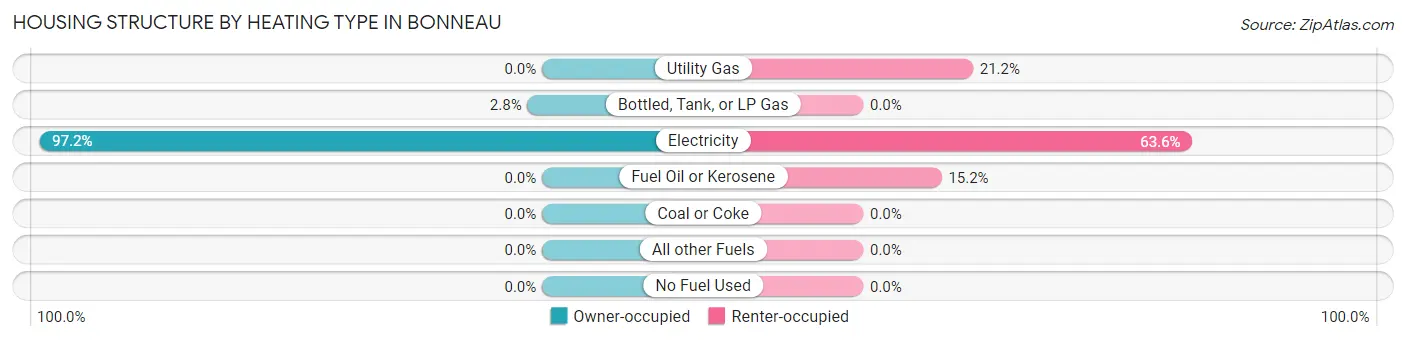
| Heating Type | Owner-occupied | Renter-occupied |
| Utility Gas | 0 (0.0%) | 7 (21.2%) |
| Bottled, Tank, or LP Gas | 4 (2.8%) | 0 (0.0%) |
| Electricity | 138 (97.2%) | 21 (63.6%) |
| Fuel Oil or Kerosene | 0 (0.0%) | 5 (15.1%) |
| Coal or Coke | 0 (0.0%) | 0 (0.0%) |
| All other Fuels | 0 (0.0%) | 0 (0.0%) |
| No Fuel Used | 0 (0.0%) | 0 (0.0%) |
| Total | 142 (100.0%) | 33 (100.0%) |
Household Vehicle Usage in Bonneau
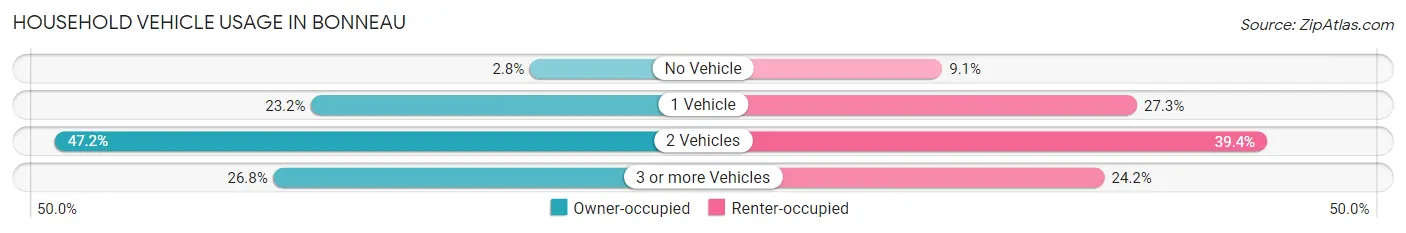
| Vehicles per Household | Owner-occupied | Renter-occupied |
| No Vehicle | 4 (2.8%) | 3 (9.1%) |
| 1 Vehicle | 33 (23.2%) | 9 (27.3%) |
| 2 Vehicles | 67 (47.2%) | 13 (39.4%) |
| 3 or more Vehicles | 38 (26.8%) | 8 (24.2%) |
| Total | 142 (100.0%) | 33 (100.0%) |
Real Estate & Mortgages in Bonneau
Real Estate and Mortgage Overview in Bonneau
| Characteristic | Without Mortgage | With Mortgage |
| Housing Units | 70 | 72 |
| Median Property Value | $245,800 | $204,500 |
| Median Household Income | $61,250 | $15 |
| Monthly Housing Costs | $509 | $9 |
| Real Estate Taxes | $548 | $4 |
Property Value by Mortgage Status in Bonneau
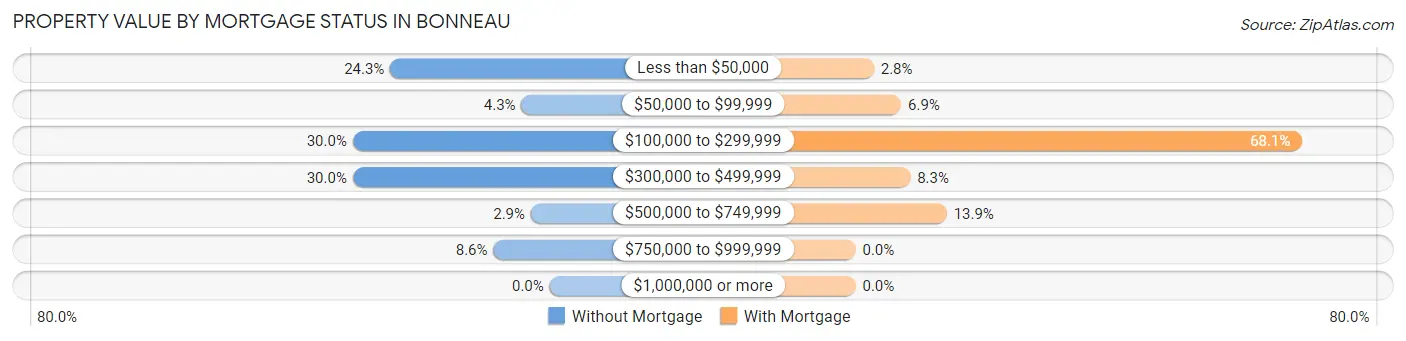
| Property Value | Without Mortgage | With Mortgage |
| Less than $50,000 | 17 (24.3%) | 2 (2.8%) |
| $50,000 to $99,999 | 3 (4.3%) | 5 (6.9%) |
| $100,000 to $299,999 | 21 (30.0%) | 49 (68.1%) |
| $300,000 to $499,999 | 21 (30.0%) | 6 (8.3%) |
| $500,000 to $749,999 | 2 (2.9%) | 10 (13.9%) |
| $750,000 to $999,999 | 6 (8.6%) | 0 (0.0%) |
| $1,000,000 or more | 0 (0.0%) | 0 (0.0%) |
| Total | 70 (100.0%) | 72 (100.0%) |
Household Income by Mortgage Status in Bonneau
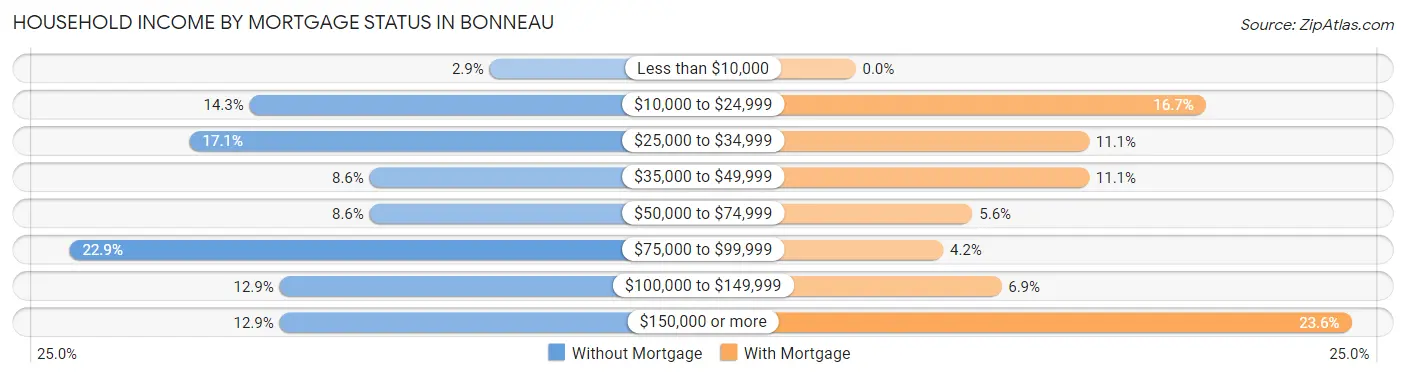
| Household Income | Without Mortgage | With Mortgage |
| Less than $10,000 | 2 (2.9%) | 0 (0.0%) |
| $10,000 to $24,999 | 10 (14.3%) | 12 (16.7%) |
| $25,000 to $34,999 | 12 (17.1%) | 8 (11.1%) |
| $35,000 to $49,999 | 6 (8.6%) | 8 (11.1%) |
| $50,000 to $74,999 | 6 (8.6%) | 4 (5.6%) |
| $75,000 to $99,999 | 16 (22.9%) | 3 (4.2%) |
| $100,000 to $149,999 | 9 (12.9%) | 5 (6.9%) |
| $150,000 or more | 9 (12.9%) | 17 (23.6%) |
| Total | 70 (100.0%) | 72 (100.0%) |
Property Value to Household Income Ratio in Bonneau
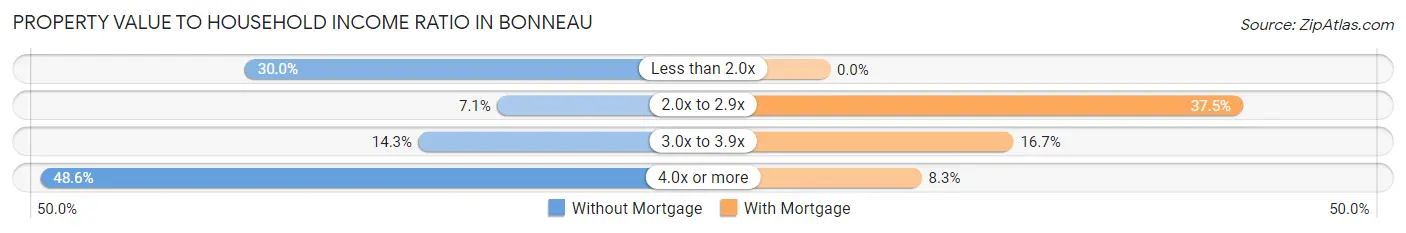
| Value-to-Income Ratio | Without Mortgage | With Mortgage |
| Less than 2.0x | 21 (30.0%) | 0 (0.0%) |
| 2.0x to 2.9x | 5 (7.1%) | 27 (37.5%) |
| 3.0x to 3.9x | 10 (14.3%) | 12 (16.7%) |
| 4.0x or more | 34 (48.6%) | 6 (8.3%) |
| Total | 70 (100.0%) | 72 (100.0%) |
Real Estate Taxes by Mortgage Status in Bonneau
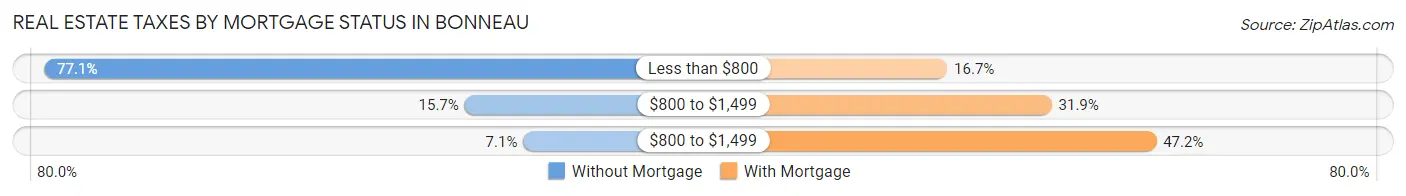
| Property Taxes | Without Mortgage | With Mortgage |
| Less than $800 | 54 (77.1%) | 12 (16.7%) |
| $800 to $1,499 | 11 (15.7%) | 23 (31.9%) |
| $800 to $1,499 | 5 (7.1%) | 34 (47.2%) |
| Total | 70 (100.0%) | 72 (100.0%) |
Health & Disability in Bonneau
Health Insurance Coverage by Age in Bonneau
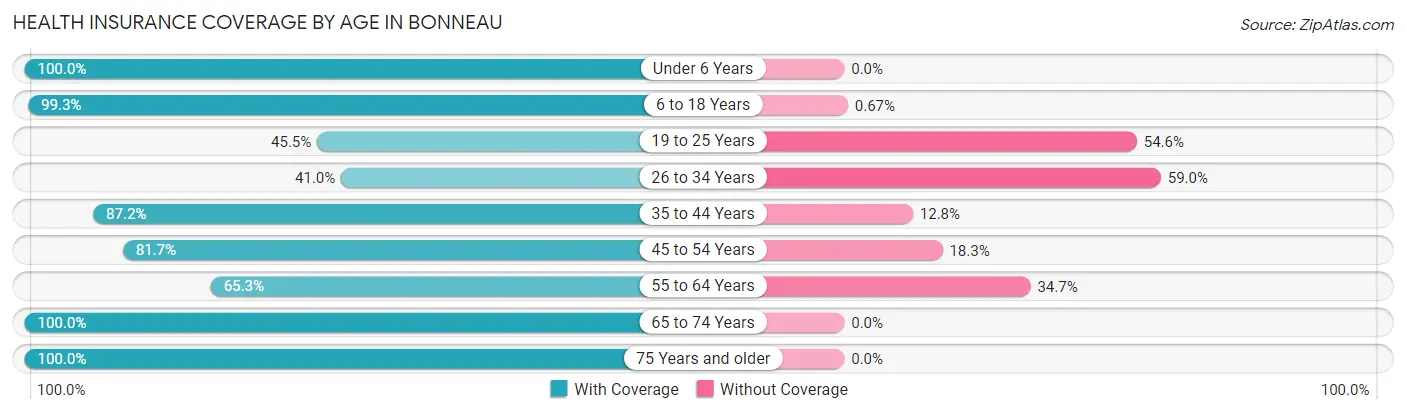
| Age Bracket | With Coverage | Without Coverage |
| Under 6 Years | 38 (100.0%) | 0 (0.0%) |
| 6 to 18 Years | 148 (99.3%) | 1 (0.7%) |
| 19 to 25 Years | 5 (45.5%) | 6 (54.5%) |
| 26 to 34 Years | 25 (41.0%) | 36 (59.0%) |
| 35 to 44 Years | 75 (87.2%) | 11 (12.8%) |
| 45 to 54 Years | 58 (81.7%) | 13 (18.3%) |
| 55 to 64 Years | 47 (65.3%) | 25 (34.7%) |
| 65 to 74 Years | 45 (100.0%) | 0 (0.0%) |
| 75 Years and older | 49 (100.0%) | 0 (0.0%) |
| Total | 490 (84.2%) | 92 (15.8%) |
Health Insurance Coverage by Citizenship Status in Bonneau
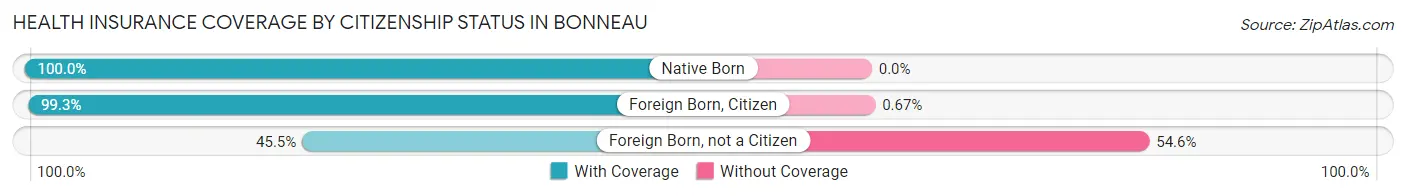
| Citizenship Status | With Coverage | Without Coverage |
| Native Born | 38 (100.0%) | 0 (0.0%) |
| Foreign Born, Citizen | 148 (99.3%) | 1 (0.7%) |
| Foreign Born, not a Citizen | 5 (45.5%) | 6 (54.5%) |
Health Insurance Coverage by Household Income in Bonneau
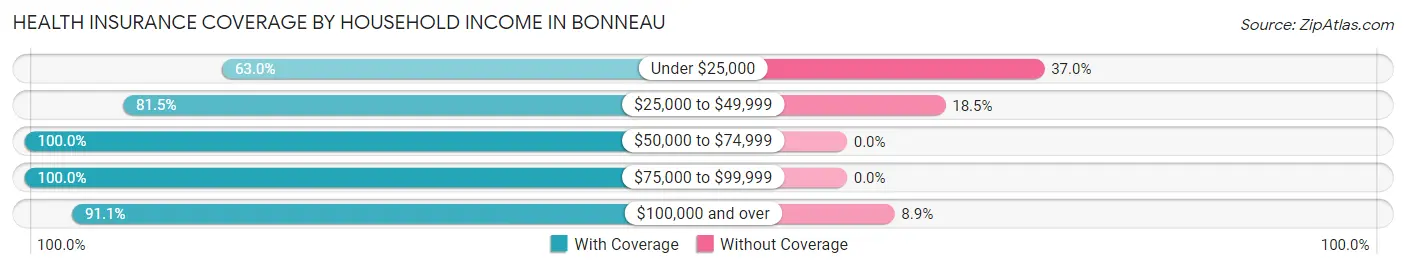
| Household Income | With Coverage | Without Coverage |
| Under $25,000 | 92 (63.0%) | 54 (37.0%) |
| $25,000 to $49,999 | 106 (81.5%) | 24 (18.5%) |
| $50,000 to $74,999 | 61 (100.0%) | 0 (0.0%) |
| $75,000 to $99,999 | 88 (100.0%) | 0 (0.0%) |
| $100,000 and over | 143 (91.1%) | 14 (8.9%) |
Public vs Private Health Insurance Coverage by Age in Bonneau
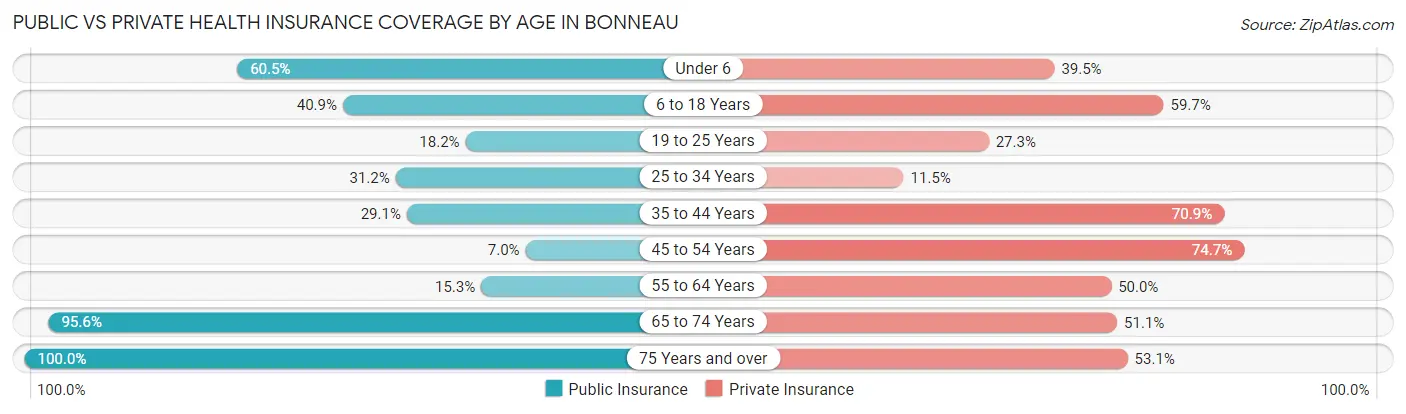
| Age Bracket | Public Insurance | Private Insurance |
| Under 6 | 23 (60.5%) | 15 (39.5%) |
| 6 to 18 Years | 61 (40.9%) | 89 (59.7%) |
| 19 to 25 Years | 2 (18.2%) | 3 (27.3%) |
| 25 to 34 Years | 19 (31.1%) | 7 (11.5%) |
| 35 to 44 Years | 25 (29.1%) | 61 (70.9%) |
| 45 to 54 Years | 5 (7.0%) | 53 (74.7%) |
| 55 to 64 Years | 11 (15.3%) | 36 (50.0%) |
| 65 to 74 Years | 43 (95.6%) | 23 (51.1%) |
| 75 Years and over | 49 (100.0%) | 26 (53.1%) |
| Total | 238 (40.9%) | 313 (53.8%) |
Disability Status by Sex by Age in Bonneau
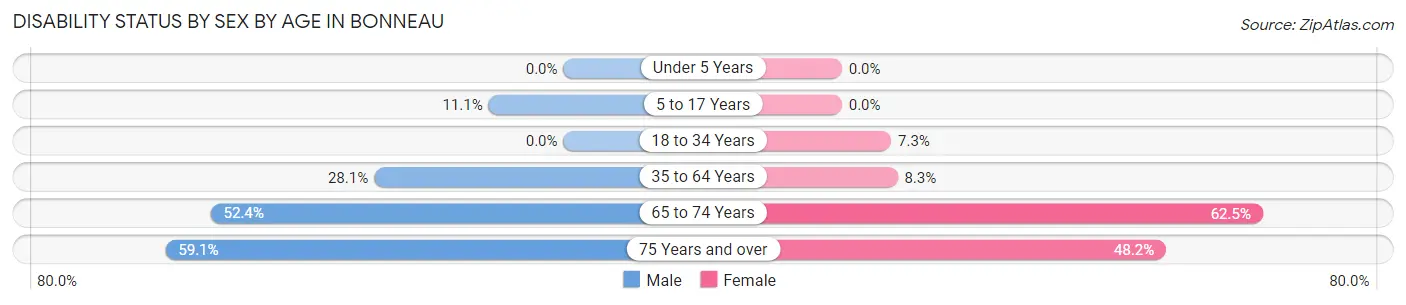
| Age Bracket | Male | Female |
| Under 5 Years | 0 (0.0%) | 0 (0.0%) |
| 5 to 17 Years | 7 (11.1%) | 0 (0.0%) |
| 18 to 34 Years | 0 (0.0%) | 3 (7.3%) |
| 35 to 64 Years | 27 (28.1%) | 11 (8.3%) |
| 65 to 74 Years | 11 (52.4%) | 15 (62.5%) |
| 75 Years and over | 13 (59.1%) | 13 (48.1%) |
Disability Class by Sex by Age in Bonneau
Disability Class: Hearing Difficulty
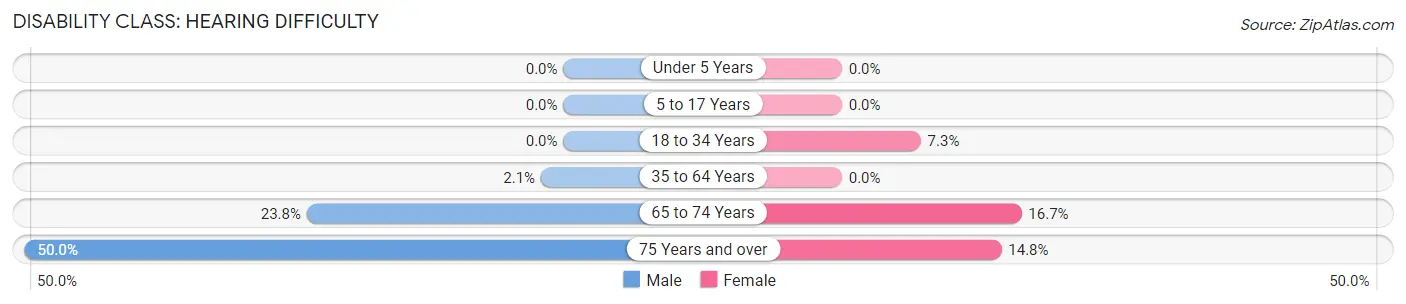
| Age Bracket | Male | Female |
| Under 5 Years | 0 (0.0%) | 0 (0.0%) |
| 5 to 17 Years | 0 (0.0%) | 0 (0.0%) |
| 18 to 34 Years | 0 (0.0%) | 3 (7.3%) |
| 35 to 64 Years | 2 (2.1%) | 0 (0.0%) |
| 65 to 74 Years | 5 (23.8%) | 4 (16.7%) |
| 75 Years and over | 11 (50.0%) | 4 (14.8%) |
Disability Class: Vision Difficulty
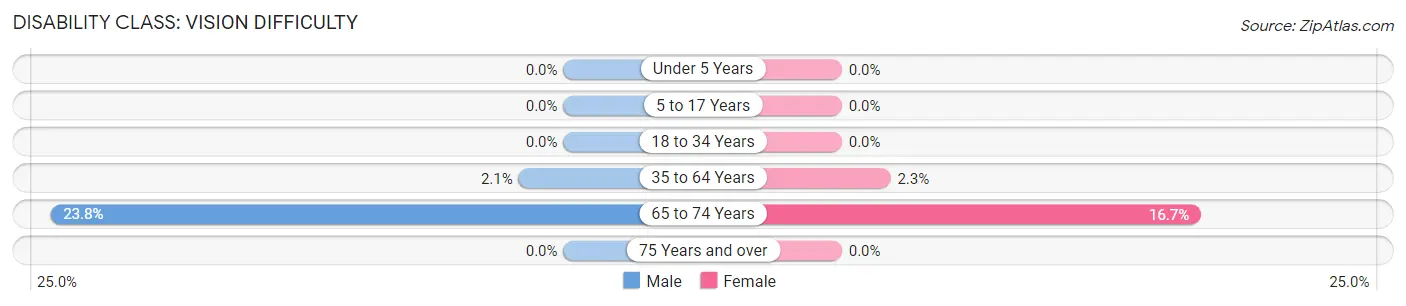
| Age Bracket | Male | Female |
| Under 5 Years | 0 (0.0%) | 0 (0.0%) |
| 5 to 17 Years | 0 (0.0%) | 0 (0.0%) |
| 18 to 34 Years | 0 (0.0%) | 0 (0.0%) |
| 35 to 64 Years | 2 (2.1%) | 3 (2.3%) |
| 65 to 74 Years | 5 (23.8%) | 4 (16.7%) |
| 75 Years and over | 0 (0.0%) | 0 (0.0%) |
Disability Class: Cognitive Difficulty
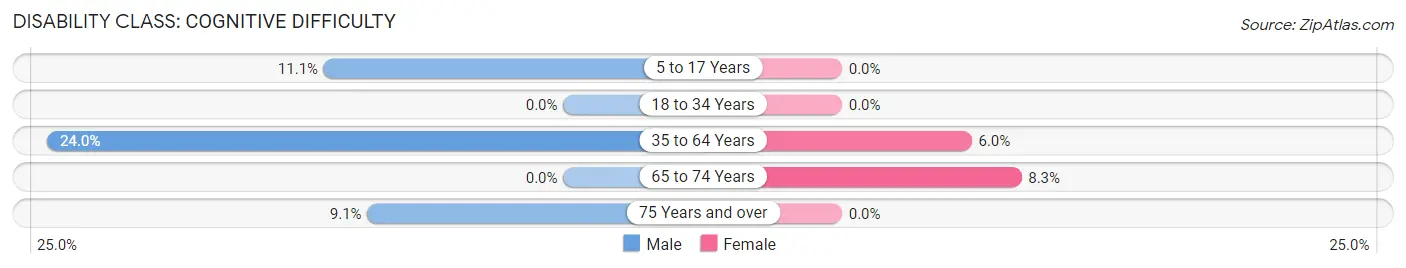
| Age Bracket | Male | Female |
| 5 to 17 Years | 7 (11.1%) | 0 (0.0%) |
| 18 to 34 Years | 0 (0.0%) | 0 (0.0%) |
| 35 to 64 Years | 23 (24.0%) | 8 (6.0%) |
| 65 to 74 Years | 0 (0.0%) | 2 (8.3%) |
| 75 Years and over | 2 (9.1%) | 0 (0.0%) |
Disability Class: Ambulatory Difficulty
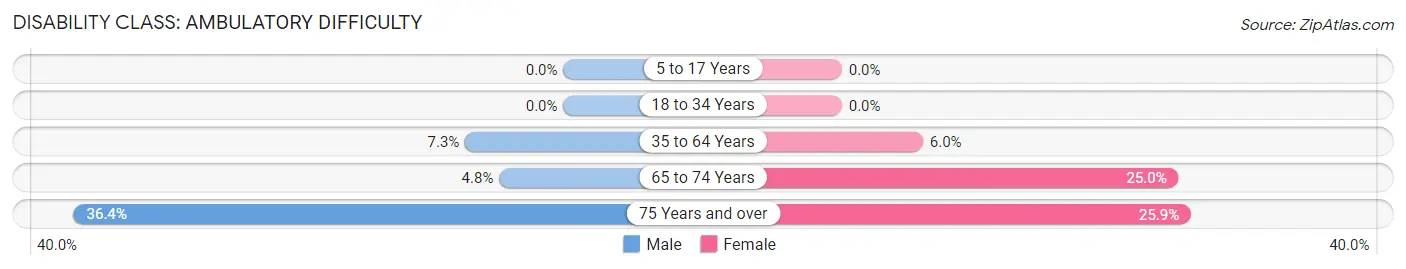
| Age Bracket | Male | Female |
| 5 to 17 Years | 0 (0.0%) | 0 (0.0%) |
| 18 to 34 Years | 0 (0.0%) | 0 (0.0%) |
| 35 to 64 Years | 7 (7.3%) | 8 (6.0%) |
| 65 to 74 Years | 1 (4.8%) | 6 (25.0%) |
| 75 Years and over | 8 (36.4%) | 7 (25.9%) |
Disability Class: Self-Care Difficulty
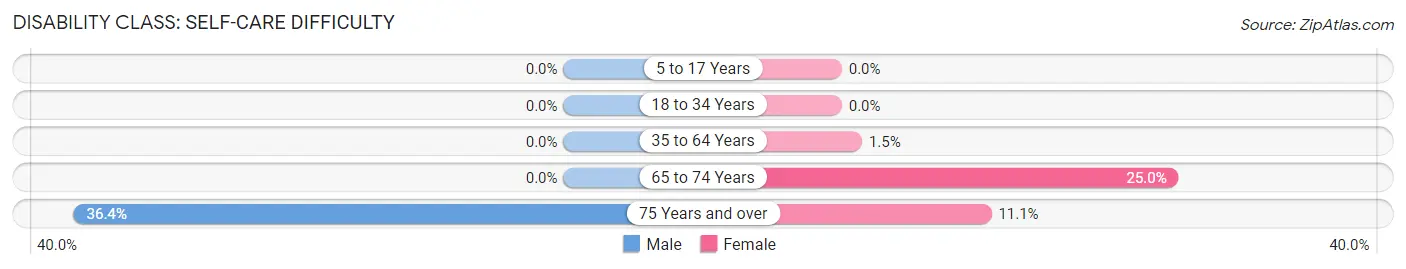
| Age Bracket | Male | Female |
| 5 to 17 Years | 0 (0.0%) | 0 (0.0%) |
| 18 to 34 Years | 0 (0.0%) | 0 (0.0%) |
| 35 to 64 Years | 0 (0.0%) | 2 (1.5%) |
| 65 to 74 Years | 0 (0.0%) | 6 (25.0%) |
| 75 Years and over | 8 (36.4%) | 3 (11.1%) |
Technology Access in Bonneau
Computing Device Access in Bonneau
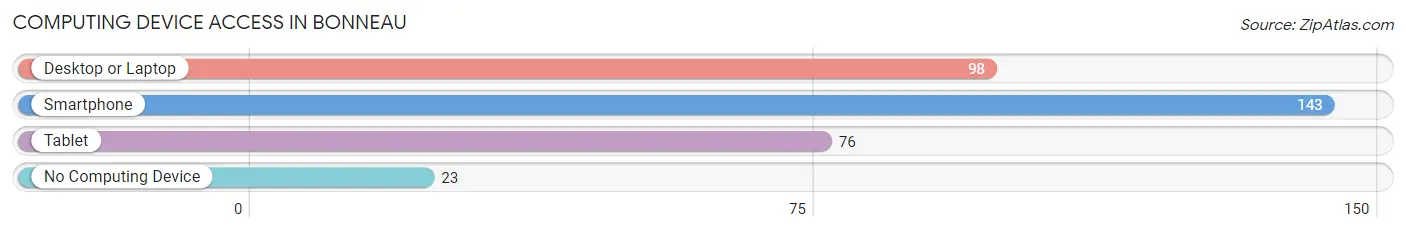
| Device Type | # Households | % Households |
| Desktop or Laptop | 98 | 56.0% |
| Smartphone | 143 | 81.7% |
| Tablet | 76 | 43.4% |
| No Computing Device | 23 | 13.1% |
| Total | 175 | 100.0% |
Internet Access in Bonneau
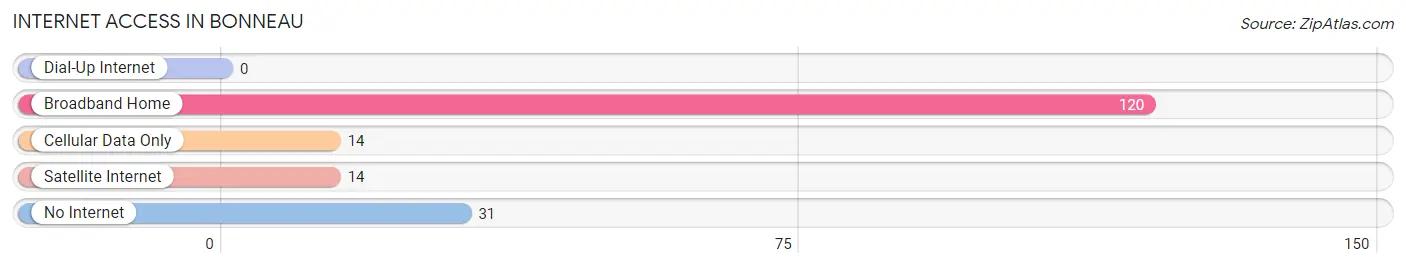
| Internet Type | # Households | % Households |
| Dial-Up Internet | 0 | 0.0% |
| Broadband Home | 120 | 68.6% |
| Cellular Data Only | 14 | 8.0% |
| Satellite Internet | 14 | 8.0% |
| No Internet | 31 | 17.7% |
| Total | 175 | 100.0% |
Bonneau Summary
Bonneau is a small town located in Berkeley County, South Carolina. It is situated along the banks of the Cooper River, approximately 25 miles northwest of Charleston. The town has a population of approximately 1,000 people and is part of the Charleston-North Charleston-Summerville Metropolitan Statistical Area.
History
Bonneau was founded in 1891 by the Reverend J.W. Bonneau, a Methodist minister from Charleston. He purchased the land from the local Native Americans and named the town after himself. The town was incorporated in 1895 and was originally a farming community. In the early 1900s, the town began to grow and develop as a commercial center. The first bank was established in 1906 and the first post office opened in 1907.
In the 1920s, the town experienced a period of growth and prosperity. The population increased from 500 to 1,000 and several businesses opened, including a cotton mill, a lumber mill, and a brick factory. The town also had a movie theater, a hotel, and a variety of stores.
In the 1950s, the town began to decline as the cotton mill and other businesses closed. The population decreased to 500 and the town became a quiet, rural community.
Geography
Bonneau is located in Berkeley County, South Carolina. It is situated along the banks of the Cooper River, approximately 25 miles northwest of Charleston. The town has a total area of 1.2 square miles, all of which is land. The terrain is mostly flat and the town is surrounded by forests and wetlands.
Economy
The economy of Bonneau is largely based on agriculture. The town is home to several farms, which produce a variety of crops, including corn, soybeans, and cotton. The town also has a few small businesses, including a gas station, a convenience store, and a restaurant.
Demographics
As of the 2010 census, Bonneau had a population of 1,000 people. The racial makeup of the town was 79.2% White, 17.2% African American, 0.7% Native American, 0.7% Asian, 0.3% from other races, and 2.1% from two or more races. The median household income was $37,500 and the median family income was $45,000. The per capita income was $18,000.
Conclusion
Bonneau is a small town located in Berkeley County, South Carolina. It is situated along the banks of the Cooper River, approximately 25 miles northwest of Charleston. The town has a population of approximately 1,000 people and is part of the Charleston-North Charleston-Summerville Metropolitan Statistical Area. The economy of Bonneau is largely based on agriculture and the town is home to several farms, which produce a variety of crops. The racial makeup of the town is 79.2% White, 17.2% African American, 0.7% Native American, 0.7% Asian, 0.3% from other races, and 2.1% from two or more races. The median household income was $37,500 and the median family income was $45,000. The per capita income was $18,000.
Common Questions
What is Per Capita Income in Bonneau?
Per Capita income in Bonneau is $29,001.
What is the Median Family Income in Bonneau?
Median Family Income in Bonneau is $75,938.
What is the Median Household income in Bonneau?
Median Household Income in Bonneau is $61,528.
What is Family Income Deficit in Bonneau?
Family Income Deficit in Bonneau is $15,262.
Families that are below poverty line in Bonneau earn $15,262 less on average than the poverty threshold level.
What is Inequality or Gini Index in Bonneau?
Inequality or Gini Index in Bonneau is 0.53.
What is the Total Population of Bonneau?
Total Population of Bonneau is 582.
What is the Total Male Population of Bonneau?
Total Male Population of Bonneau is 268.
What is the Total Female Population of Bonneau?
Total Female Population of Bonneau is 314.
What is the Ratio of Males per 100 Females in Bonneau?
There are 85.35 Males per 100 Females in Bonneau.
What is the Ratio of Females per 100 Males in Bonneau?
There are 117.16 Females per 100 Males in Bonneau.
What is the Median Population Age in Bonneau?
Median Population Age in Bonneau is 37.0 Years.
What is the Average Family Size in Bonneau
Average Family Size in Bonneau is 3.8 People.
What is the Average Household Size in Bonneau
Average Household Size in Bonneau is 3.3 People.
How Large is the Labor Force in Bonneau?
There are 220 People in the Labor Forcein in Bonneau.
What is the Percentage of People in the Labor Force in Bonneau?
51.3% of People are in the Labor Force in Bonneau.
What is the Unemployment Rate in Bonneau?
Unemployment Rate in Bonneau is 14.5%.