Snelling, SC Map & Demographics
Snelling Map
Snelling Overview
$32,324
PER CAPITA INCOME
$78,333
AVG FAMILY INCOME
$56,607
AVG HOUSEHOLD INCOME
21.0%
WAGE / INCOME GAP [ % ]
79.0¢/ $1
WAGE / INCOME GAP [ $ ]
0.38
INEQUALITY / GINI INDEX
262
TOTAL POPULATION
137
MALE POPULATION
125
FEMALE POPULATION
109.60
MALES / 100 FEMALES
91.24
FEMALES / 100 MALES
43.3
MEDIAN AGE
2.9
AVG FAMILY SIZE
2.6
AVG HOUSEHOLD SIZE
135
LABOR FORCE [ PEOPLE ]
59.0%
PERCENT IN LABOR FORCE
1.5%
UNEMPLOYMENT RATE
Income in Snelling
Income Overview in Snelling
Per Capita Income in Snelling is $32,324, while median incomes of families and households are $78,333 and $56,607 respectively.
| Characteristic | Number | Measure |
| Per Capita Income | 262 | $32,324 |
| Median Family Income | 80 | $78,333 |
| Mean Family Income | 80 | $92,918 |
| Median Household Income | 101 | $56,607 |
| Mean Household Income | 101 | $81,938 |
| Income Deficit | 80 | $0 |
| Wage / Income Gap (%) | 262 | 20.96% |
| Wage / Income Gap ($) | 262 | 79.04¢ per $1 |
| Gini / Inequality Index | 262 | 0.38 |
Earnings by Sex in Snelling
Average Earnings in Snelling are $34,653, $37,250 for men and $29,444 for women, a difference of 21.0%.
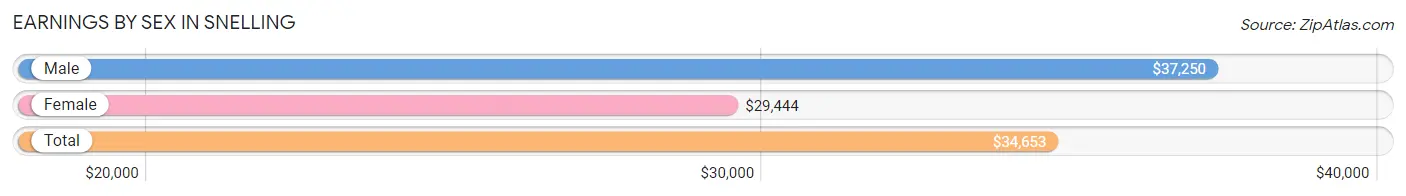
| Sex | Number | Average Earnings |
| Male | 81 (56.6%) | $37,250 |
| Female | 62 (43.4%) | $29,444 |
| Total | 143 (100.0%) | $34,653 |
Earnings by Sex by Income Bracket in Snelling
The most common earnings brackets in Snelling are $30,000 to $34,999 for men (17 | 21.0%) and $25,000 to $29,999 for women (14 | 22.6%).
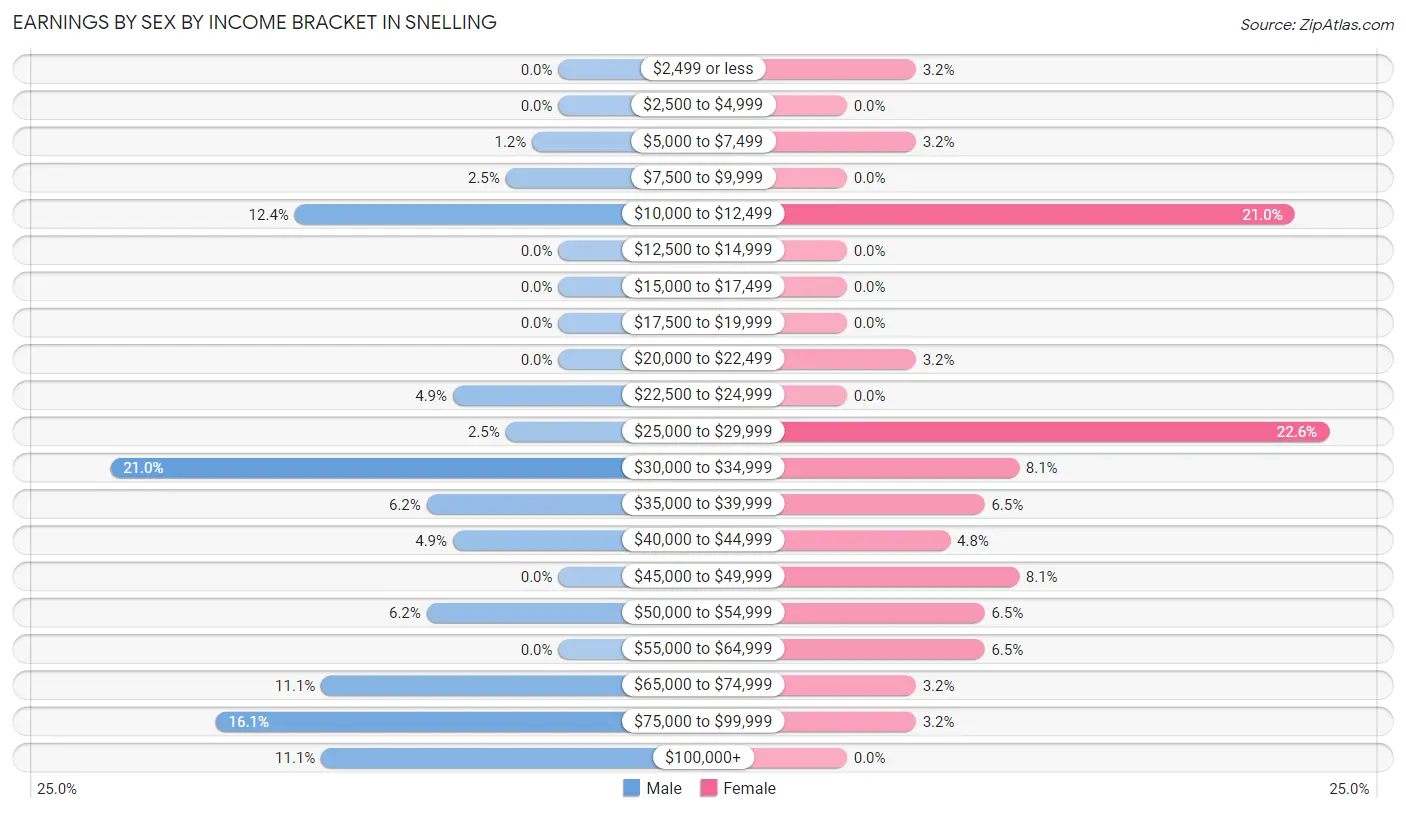
| Income | Male | Female |
| $2,499 or less | 0 (0.0%) | 2 (3.2%) |
| $2,500 to $4,999 | 0 (0.0%) | 0 (0.0%) |
| $5,000 to $7,499 | 1 (1.2%) | 2 (3.2%) |
| $7,500 to $9,999 | 2 (2.5%) | 0 (0.0%) |
| $10,000 to $12,499 | 10 (12.3%) | 13 (21.0%) |
| $12,500 to $14,999 | 0 (0.0%) | 0 (0.0%) |
| $15,000 to $17,499 | 0 (0.0%) | 0 (0.0%) |
| $17,500 to $19,999 | 0 (0.0%) | 0 (0.0%) |
| $20,000 to $22,499 | 0 (0.0%) | 2 (3.2%) |
| $22,500 to $24,999 | 4 (4.9%) | 0 (0.0%) |
| $25,000 to $29,999 | 2 (2.5%) | 14 (22.6%) |
| $30,000 to $34,999 | 17 (21.0%) | 5 (8.1%) |
| $35,000 to $39,999 | 5 (6.2%) | 4 (6.5%) |
| $40,000 to $44,999 | 4 (4.9%) | 3 (4.8%) |
| $45,000 to $49,999 | 0 (0.0%) | 5 (8.1%) |
| $50,000 to $54,999 | 5 (6.2%) | 4 (6.5%) |
| $55,000 to $64,999 | 0 (0.0%) | 4 (6.5%) |
| $65,000 to $74,999 | 9 (11.1%) | 2 (3.2%) |
| $75,000 to $99,999 | 13 (16.1%) | 2 (3.2%) |
| $100,000+ | 9 (11.1%) | 0 (0.0%) |
| Total | 81 (100.0%) | 62 (100.0%) |
Earnings by Sex by Educational Attainment in Snelling
Average earnings in Snelling are $52,000 for men and $31,875 for women, a difference of 38.7%. Men with an educational attainment of high school diploma enjoy the highest average annual earnings of $78,250, while those with high school diploma education earn the least with $78,250. Women with an educational attainment of college or associate's degree earn the most with the average annual earnings of $29,722, while those with college or associate's degree education have the smallest earnings of $29,722.
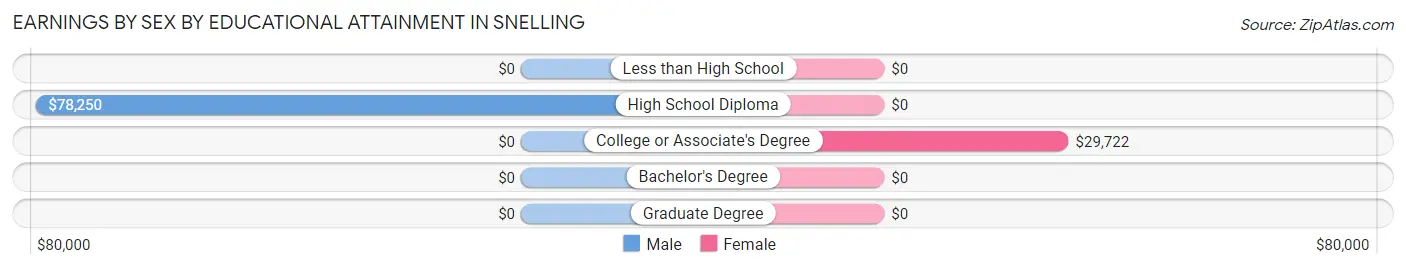
| Educational Attainment | Male Income | Female Income |
| Less than High School | - | - |
| High School Diploma | $78,250 | $0 |
| College or Associate's Degree | - | - |
| Bachelor's Degree | - | - |
| Graduate Degree | - | - |
| Total | $52,000 | $31,875 |
Family Income in Snelling
Family Income Brackets in Snelling
According to the Snelling family income data, there are 22 families falling into the $100,000 to $149,999 income range, which is the most common income bracket and makes up 27.5% of all families.
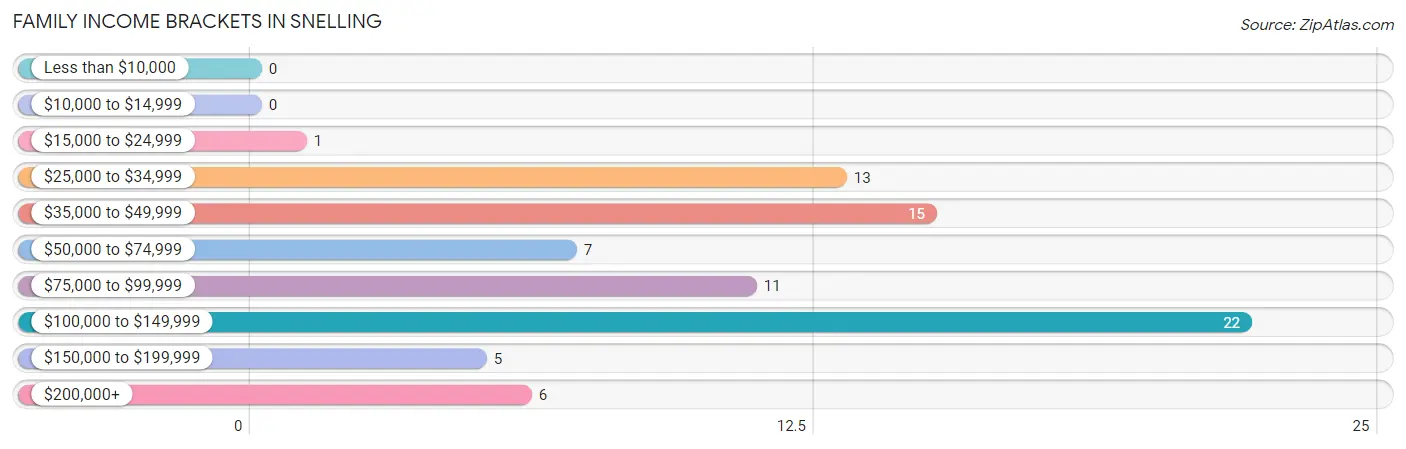
| Income Bracket | # Families | % Families |
| Less than $10,000 | 0 | 0.0% |
| $10,000 to $14,999 | 0 | 0.0% |
| $15,000 to $24,999 | 1 | 1.3% |
| $25,000 to $34,999 | 13 | 16.3% |
| $35,000 to $49,999 | 15 | 18.8% |
| $50,000 to $74,999 | 7 | 8.8% |
| $75,000 to $99,999 | 11 | 13.8% |
| $100,000 to $149,999 | 22 | 27.5% |
| $150,000 to $199,999 | 5 | 6.3% |
| $200,000+ | 6 | 7.5% |
Family Income by Famaliy Size in Snelling
3-person families (10 | 12.5%) account for the highest median family income in Snelling with $145,417 per family, while 3-person families (10 | 12.5%) have the highest median income of $48,472 per family member.
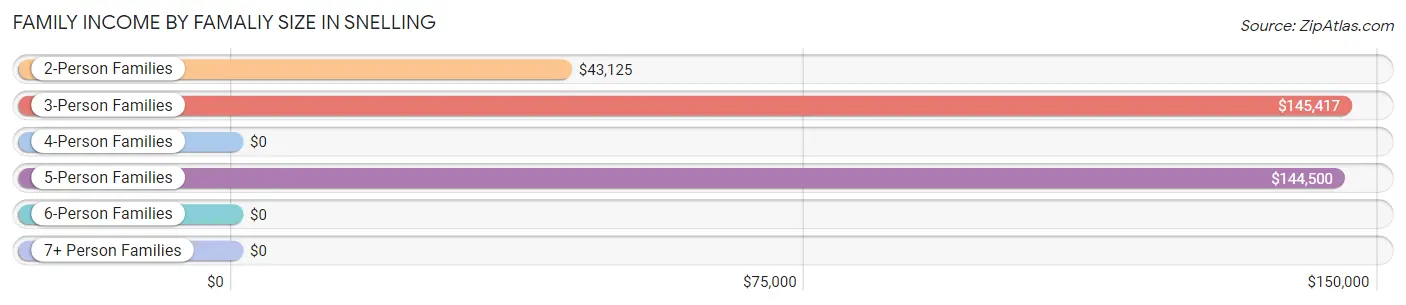
| Income Bracket | # Families | Median Income |
| 2-Person Families | 47 (58.8%) | $43,125 |
| 3-Person Families | 10 (12.5%) | $145,417 |
| 4-Person Families | 7 (8.7%) | $0 |
| 5-Person Families | 16 (20.0%) | $144,500 |
| 6-Person Families | 0 (0.0%) | $0 |
| 7+ Person Families | 0 (0.0%) | $0 |
| Total | 80 (100.0%) | $78,333 |
Family Income by Number of Earners in Snelling
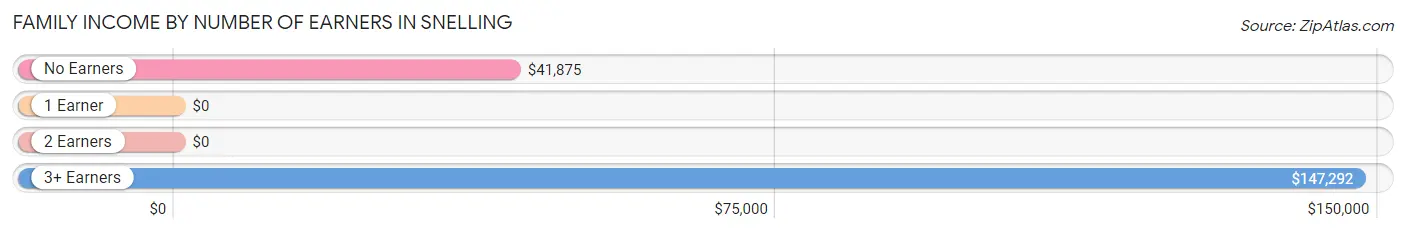
| Number of Earners | # Families | Median Income |
| No Earners | 27 (33.8%) | $41,875 |
| 1 Earner | 17 (21.2%) | $0 |
| 2 Earners | 15 (18.8%) | $0 |
| 3+ Earners | 21 (26.3%) | $147,292 |
| Total | 80 (100.0%) | $78,333 |
Household Income in Snelling
Household Income Brackets in Snelling
With 23 households falling in the category, the $25,000 to $34,999 income range is the most frequent in Snelling, accounting for 22.8% of all households.
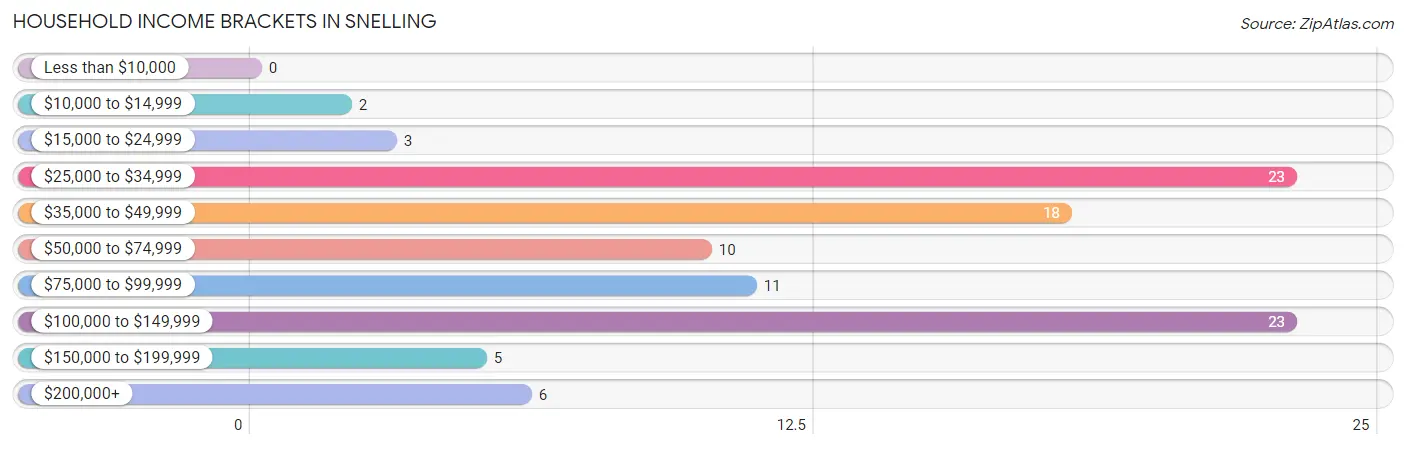
| Income Bracket | # Households | % Households |
| Less than $10,000 | 0 | 0.0% |
| $10,000 to $14,999 | 2 | 2.0% |
| $15,000 to $24,999 | 3 | 3.0% |
| $25,000 to $34,999 | 23 | 22.8% |
| $35,000 to $49,999 | 18 | 17.8% |
| $50,000 to $74,999 | 10 | 9.9% |
| $75,000 to $99,999 | 11 | 10.9% |
| $100,000 to $149,999 | 23 | 22.8% |
| $150,000 to $199,999 | 5 | 5.0% |
| $200,000+ | 6 | 5.9% |
Household Income by Householder Age in Snelling
The median household income in Snelling is $56,607, with the highest median household income of $57,143 found in the 65+ years age bracket for the primary householder. A total of 16 households (15.8%) fall into this category. Meanwhile, the 15 to 24 years age bracket for the primary householder has the lowest median household income of $0, with 2 households (2.0%) in this group.
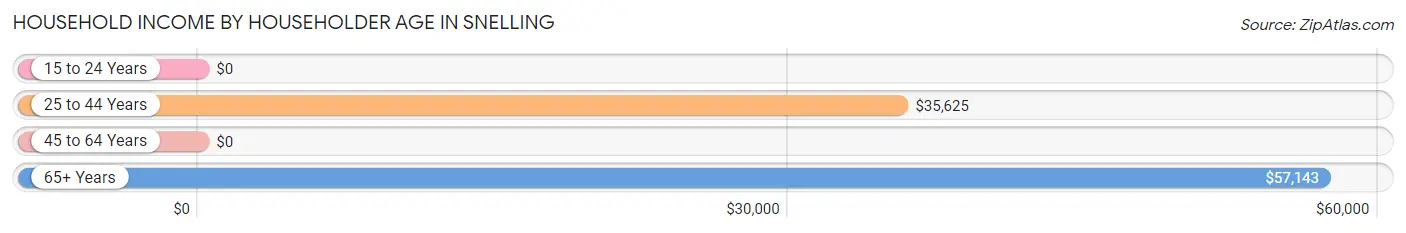
| Income Bracket | # Households | Median Income |
| 15 to 24 Years | 2 (2.0%) | $0 |
| 25 to 44 Years | 22 (21.8%) | $35,625 |
| 45 to 64 Years | 61 (60.4%) | $0 |
| 65+ Years | 16 (15.8%) | $57,143 |
| Total | 101 (100.0%) | $56,607 |
Poverty in Snelling
Income Below Poverty by Sex and Age in Snelling
With 7.5% poverty level for males and 9.6% for females among the residents of Snelling, 12 to 14 year old males and 6 to 11 year old females are the most vulnerable to poverty, with 1 males (100.0%) and 5 females (55.6%) in their respective age groups living below the poverty level.
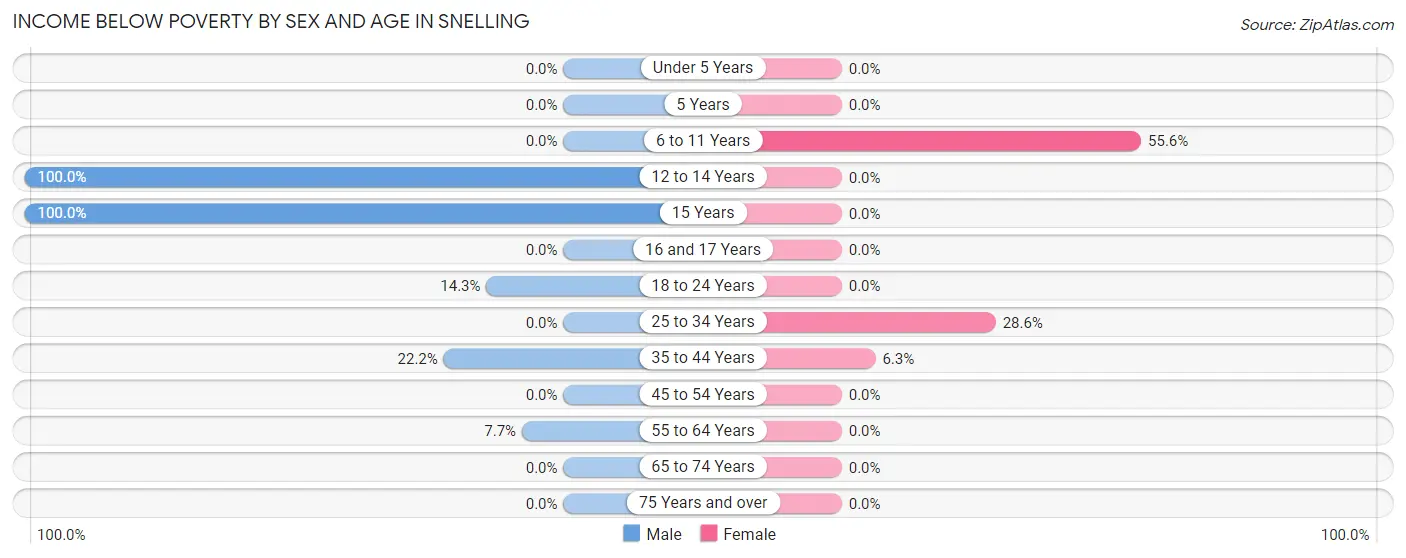
| Age Bracket | Male | Female |
| Under 5 Years | 0 (0.0%) | 0 (0.0%) |
| 5 Years | 0 (0.0%) | 0 (0.0%) |
| 6 to 11 Years | 0 (0.0%) | 5 (55.6%) |
| 12 to 14 Years | 1 (100.0%) | 0 (0.0%) |
| 15 Years | 2 (100.0%) | 0 (0.0%) |
| 16 and 17 Years | 0 (0.0%) | 0 (0.0%) |
| 18 to 24 Years | 2 (14.3%) | 0 (0.0%) |
| 25 to 34 Years | 0 (0.0%) | 6 (28.6%) |
| 35 to 44 Years | 2 (22.2%) | 1 (6.2%) |
| 45 to 54 Years | 0 (0.0%) | 0 (0.0%) |
| 55 to 64 Years | 3 (7.7%) | 0 (0.0%) |
| 65 to 74 Years | 0 (0.0%) | 0 (0.0%) |
| 75 Years and over | 0 (0.0%) | 0 (0.0%) |
| Total | 10 (7.5%) | 12 (9.6%) |
Income Above Poverty by Sex and Age in Snelling
According to the poverty statistics in Snelling, males aged under 5 years and females aged 12 to 14 years are the age groups that are most secure financially, with 100.0% of males and 100.0% of females in these age groups living above the poverty line.
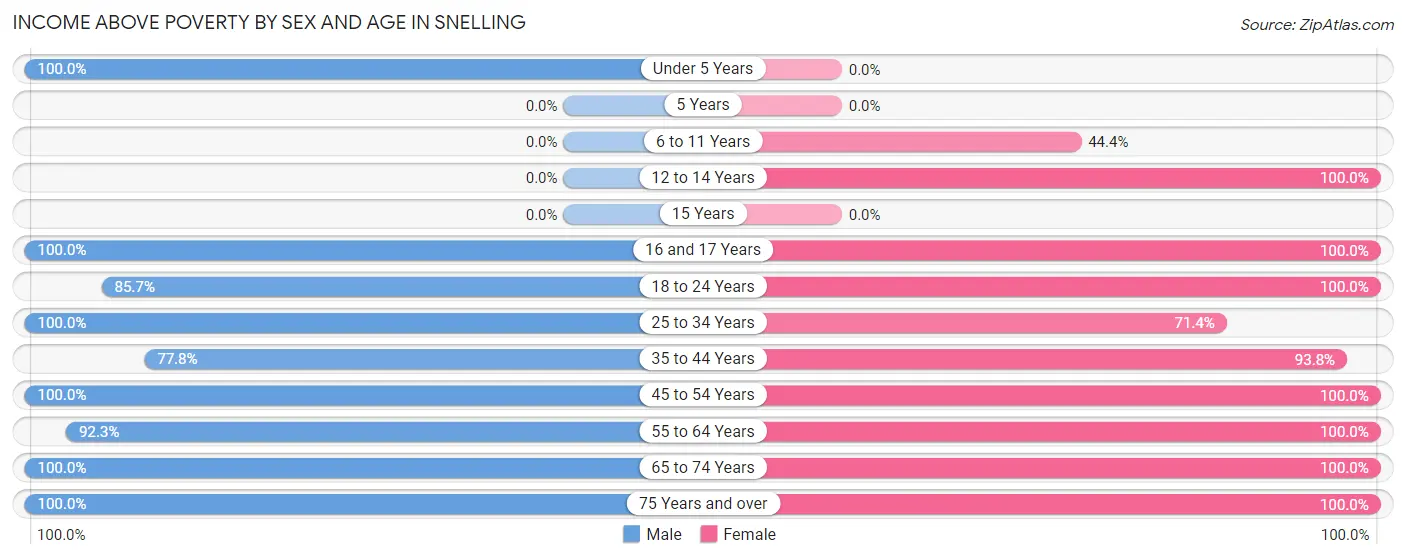
| Age Bracket | Male | Female |
| Under 5 Years | 12 (100.0%) | 0 (0.0%) |
| 5 Years | 0 (0.0%) | 0 (0.0%) |
| 6 to 11 Years | 0 (0.0%) | 4 (44.4%) |
| 12 to 14 Years | 0 (0.0%) | 6 (100.0%) |
| 15 Years | 0 (0.0%) | 0 (0.0%) |
| 16 and 17 Years | 10 (100.0%) | 4 (100.0%) |
| 18 to 24 Years | 12 (85.7%) | 10 (100.0%) |
| 25 to 34 Years | 19 (100.0%) | 15 (71.4%) |
| 35 to 44 Years | 7 (77.8%) | 15 (93.8%) |
| 45 to 54 Years | 6 (100.0%) | 3 (100.0%) |
| 55 to 64 Years | 36 (92.3%) | 42 (100.0%) |
| 65 to 74 Years | 15 (100.0%) | 6 (100.0%) |
| 75 Years and over | 7 (100.0%) | 8 (100.0%) |
| Total | 124 (92.5%) | 113 (90.4%) |
Income Below Poverty Among Married-Couple Families in Snelling
The poverty statistics for married-couple families in Snelling show that 6.0% or 4 of the total 67 families live below the poverty line. Families with 3 or 4 children have the highest poverty rate of 75.0%, comprising of 3 families. On the other hand, families with no children have the lowest poverty rate of 0.0%, which includes 0 families.
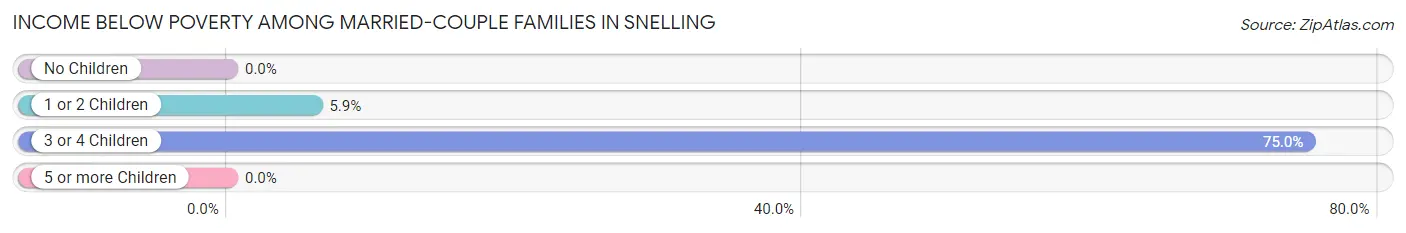
| Children | Above Poverty | Below Poverty |
| No Children | 46 (100.0%) | 0 (0.0%) |
| 1 or 2 Children | 16 (94.1%) | 1 (5.9%) |
| 3 or 4 Children | 1 (25.0%) | 3 (75.0%) |
| 5 or more Children | 0 (0.0%) | 0 (0.0%) |
| Total | 63 (94.0%) | 4 (6.0%) |
Income Below Poverty Among Single-Parent Households in Snelling
| Children | Single Father | Single Mother |
| No Children | 0 (0.0%) | 0 (0.0%) |
| 1 or 2 Children | 0 (0.0%) | 0 (0.0%) |
| 3 or 4 Children | 0 (0.0%) | 0 (0.0%) |
| 5 or more Children | 0 (0.0%) | 0 (0.0%) |
| Total | 0 (0.0%) | 0 (0.0%) |
Income Below Poverty Among Married-Couple vs Single-Parent Households in Snelling
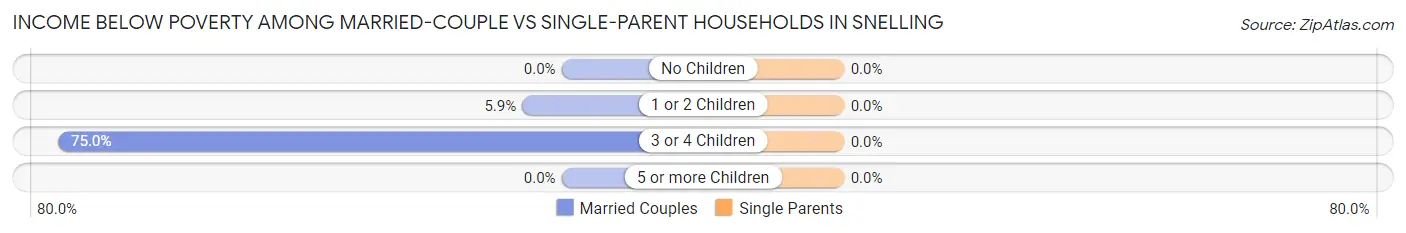
| Children | Married-Couple Families | Single-Parent Households |
| No Children | 0 (0.0%) | 0 (0.0%) |
| 1 or 2 Children | 1 (5.9%) | 0 (0.0%) |
| 3 or 4 Children | 3 (75.0%) | 0 (0.0%) |
| 5 or more Children | 0 (0.0%) | 0 (0.0%) |
| Total | 4 (6.0%) | 0 (0.0%) |
Race in Snelling
The most populous races in Snelling are White / Caucasian (239 | 91.2%), Hispanic or Latino (12 | 4.6%), and Black / African American (10 | 3.8%).
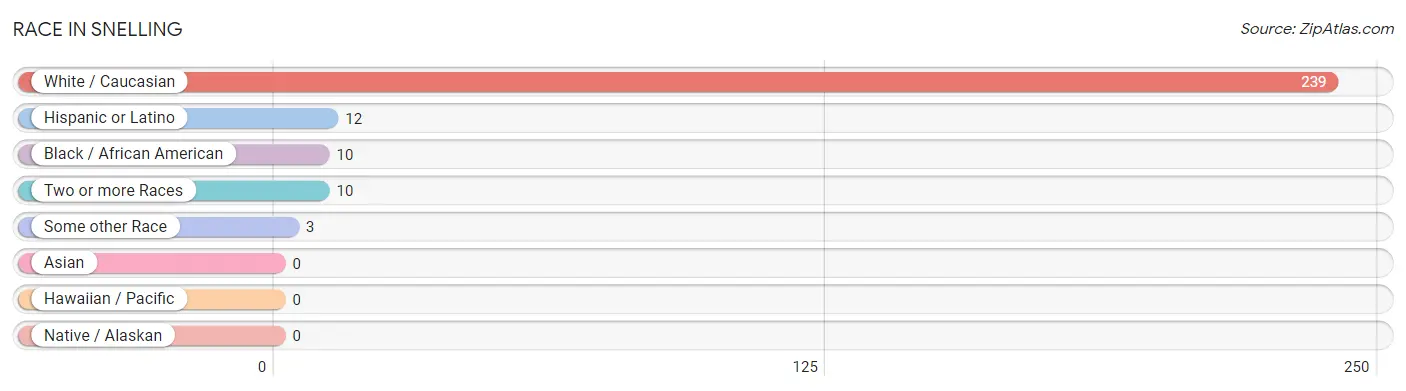
| Race | # Population | % Population |
| Asian | 0 | 0.0% |
| Black / African American | 10 | 3.8% |
| Hawaiian / Pacific | 0 | 0.0% |
| Hispanic or Latino | 12 | 4.6% |
| Native / Alaskan | 0 | 0.0% |
| White / Caucasian | 239 | 91.2% |
| Two or more Races | 10 | 3.8% |
| Some other Race | 3 | 1.1% |
| Total | 262 | 100.0% |
Ancestry in Snelling
The most populous ancestries reported in Snelling are American (109 | 41.6%), German (15 | 5.7%), Irish (14 | 5.3%), English (13 | 5.0%), and Mexican (12 | 4.6%), together accounting for 62.2% of all Snelling residents.
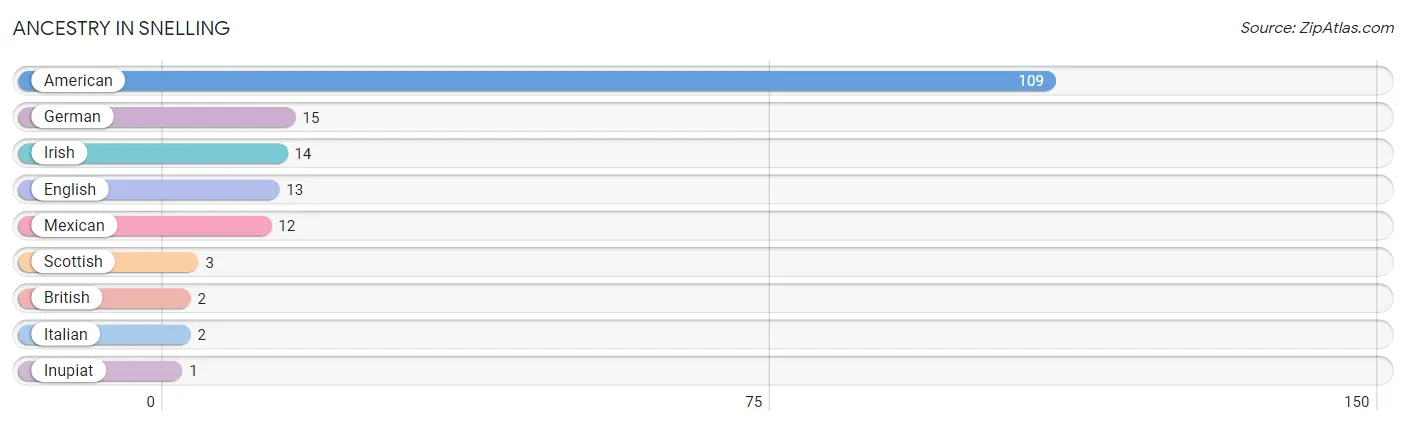
| Ancestry | # Population | % Population |
| American | 109 | 41.6% |
| British | 2 | 0.8% |
| English | 13 | 5.0% |
| German | 15 | 5.7% |
| Inupiat | 1 | 0.4% |
| Irish | 14 | 5.3% |
| Italian | 2 | 0.8% |
| Mexican | 12 | 4.6% |
| Scottish | 3 | 1.1% | View All 9 Rows |
Immigrants in Snelling
The most numerous immigrant groups reported in Snelling came from Central America (3 | 1.1%), Latin America (3 | 1.1%), and Mexico (3 | 1.1%), together accounting for 3.5% of all Snelling residents.
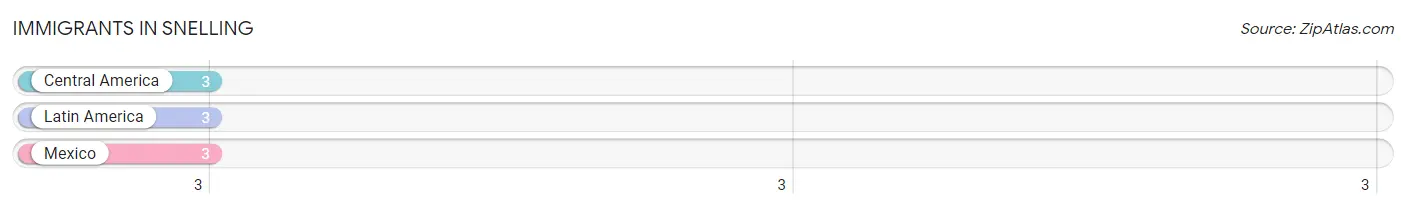
| Immigration Origin | # Population | % Population |
| Central America | 3 | 1.1% |
| Latin America | 3 | 1.1% |
| Mexico | 3 | 1.1% | View All 3 Rows |
Sex and Age in Snelling
Sex and Age in Snelling
The most populous age groups in Snelling are 55 to 59 Years (20 | 14.6%) for men and 60 to 64 Years (28 | 22.4%) for women.
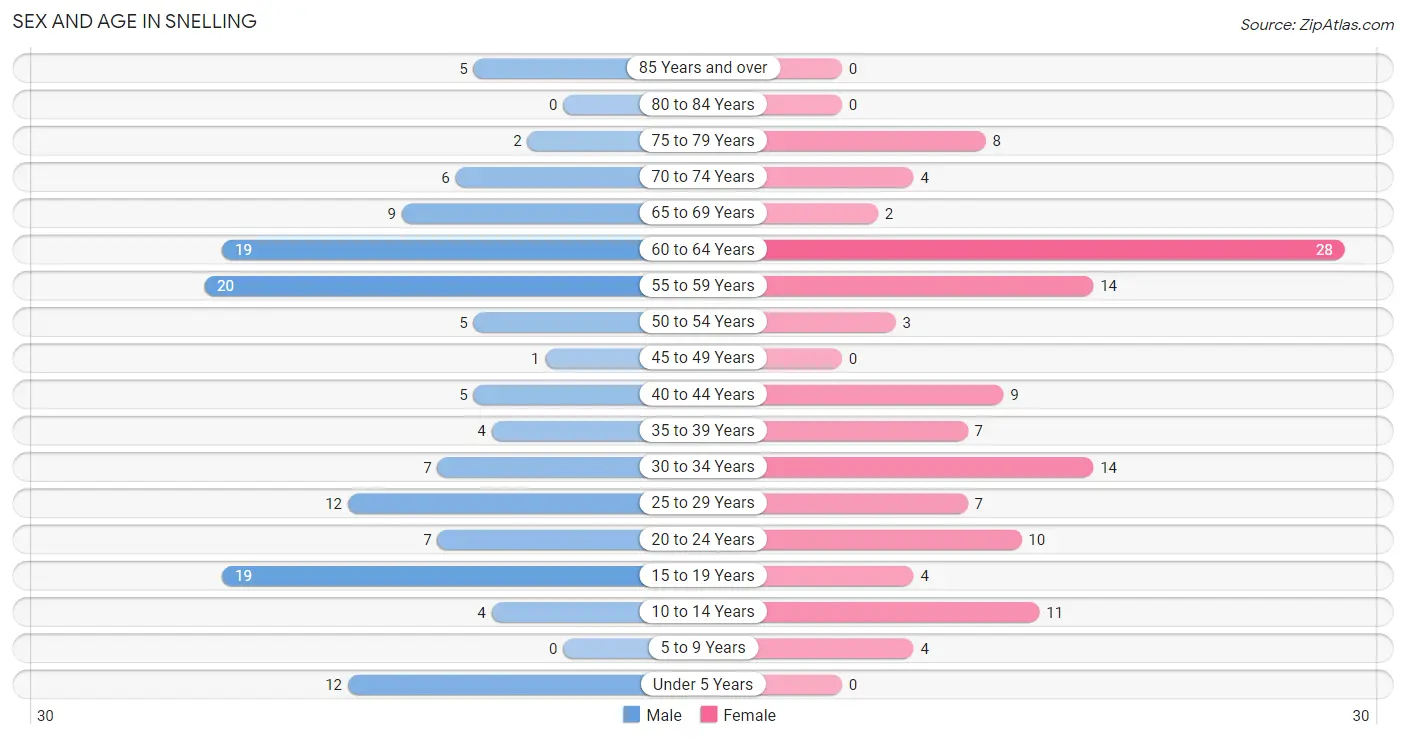
| Age Bracket | Male | Female |
| Under 5 Years | 12 (8.8%) | 0 (0.0%) |
| 5 to 9 Years | 0 (0.0%) | 4 (3.2%) |
| 10 to 14 Years | 4 (2.9%) | 11 (8.8%) |
| 15 to 19 Years | 19 (13.9%) | 4 (3.2%) |
| 20 to 24 Years | 7 (5.1%) | 10 (8.0%) |
| 25 to 29 Years | 12 (8.8%) | 7 (5.6%) |
| 30 to 34 Years | 7 (5.1%) | 14 (11.2%) |
| 35 to 39 Years | 4 (2.9%) | 7 (5.6%) |
| 40 to 44 Years | 5 (3.6%) | 9 (7.2%) |
| 45 to 49 Years | 1 (0.7%) | 0 (0.0%) |
| 50 to 54 Years | 5 (3.6%) | 3 (2.4%) |
| 55 to 59 Years | 20 (14.6%) | 14 (11.2%) |
| 60 to 64 Years | 19 (13.9%) | 28 (22.4%) |
| 65 to 69 Years | 9 (6.6%) | 2 (1.6%) |
| 70 to 74 Years | 6 (4.4%) | 4 (3.2%) |
| 75 to 79 Years | 2 (1.5%) | 8 (6.4%) |
| 80 to 84 Years | 0 (0.0%) | 0 (0.0%) |
| 85 Years and over | 5 (3.6%) | 0 (0.0%) |
| Total | 137 (100.0%) | 125 (100.0%) |
Families and Households in Snelling
Median Family Size in Snelling
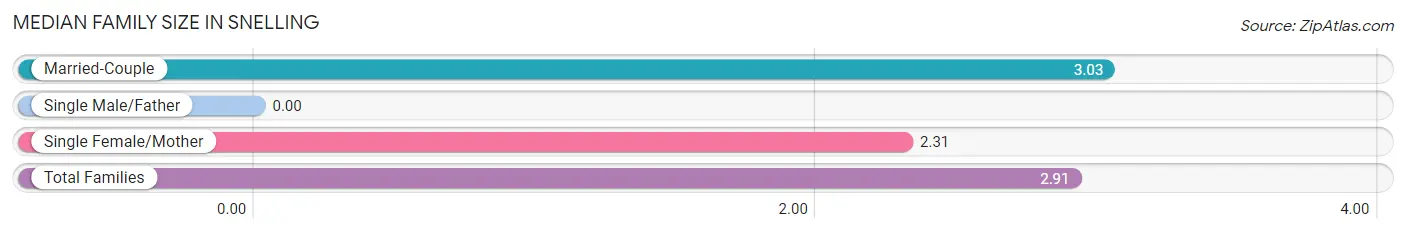
| Family Type | # Families | Family Size |
| Married-Couple | 67 (83.8%) | 3.03 |
| Single Male/Father | 0 (0.0%) | - |
| Single Female/Mother | 13 (16.3%) | 2.31 |
| Total Families | 80 (100.0%) | 2.91 |
Median Household Size in Snelling
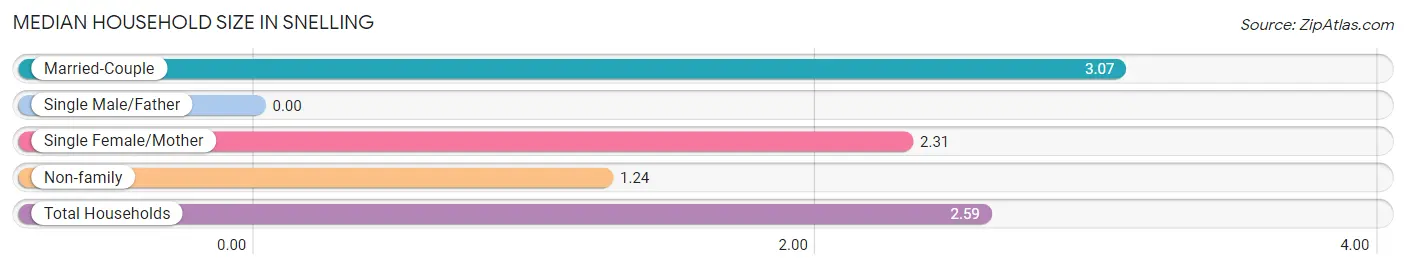
| Household Type | # Households | Household Size |
| Married-Couple | 67 (66.3%) | 3.07 |
| Single Male/Father | 0 (0.0%) | - |
| Single Female/Mother | 13 (12.9%) | 2.31 |
| Non-family | 21 (20.8%) | 1.24 |
| Total Households | 101 (100.0%) | 2.59 |
Household Size by Marriage Status in Snelling
Out of a total of 101 households in Snelling, 80 (79.2%) are family households, while 21 (20.8%) are nonfamily households. The most numerous type of family households are 2-person households, comprising 47, and the most common type of nonfamily households are 1-person households, comprising 16.
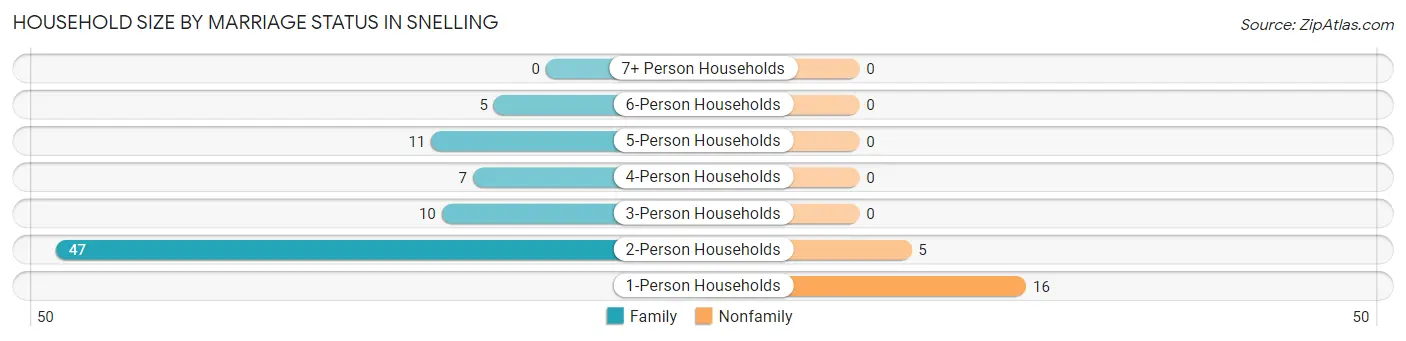
| Household Size | Family Households | Nonfamily Households |
| 1-Person Households | - | 16 (15.8%) |
| 2-Person Households | 47 (46.5%) | 5 (5.0%) |
| 3-Person Households | 10 (9.9%) | 0 (0.0%) |
| 4-Person Households | 7 (6.9%) | 0 (0.0%) |
| 5-Person Households | 11 (10.9%) | 0 (0.0%) |
| 6-Person Households | 5 (5.0%) | 0 (0.0%) |
| 7+ Person Households | 0 (0.0%) | 0 (0.0%) |
| Total | 80 (79.2%) | 21 (20.8%) |
Female Fertility in Snelling
Fertility by Age in Snelling
| Age Bracket | Women with Births | Births / 1,000 Women |
| 15 to 19 years | 0 (0.0%) | 0.0 |
| 20 to 34 years | 0 (0.0%) | 0.0 |
| 35 to 50 years | 0 (0.0%) | 0.0 |
| Total | 0 (0.0%) | 0.0 |
Fertility by Age by Marriage Status in Snelling
| Age Bracket | Married | Unmarried |
| 15 to 19 years | 0 (0.0%) | 0 (0.0%) |
| 20 to 34 years | 0 (0.0%) | 0 (0.0%) |
| 35 to 50 years | 0 (0.0%) | 0 (0.0%) |
| Total | 0 (0.0%) | 0 (0.0%) |
Fertility by Education in Snelling
| Educational Attainment | Women with Births | Births / 1,000 Women |
| Less than High School | 0 (0.0%) | 0.0 |
| High School Diploma | 0 (0.0%) | 0.0 |
| College or Associate's Degree | 0 (0.0%) | 0.0 |
| Bachelor's Degree | 0 (0.0%) | 0.0 |
| Graduate Degree | 0 (0.0%) | 0.0 |
| Total | 0 (0.0%) | 0.0 |
Fertility by Education by Marriage Status in Snelling
| Educational Attainment | Married | Unmarried |
| Less than High School | 0 (0.0%) | 0 (0.0%) |
| High School Diploma | 0 (0.0%) | 0 (0.0%) |
| College or Associate's Degree | 0 (0.0%) | 0 (0.0%) |
| Bachelor's Degree | 0 (0.0%) | 0 (0.0%) |
| Graduate Degree | 0 (0.0%) | 0 (0.0%) |
| Total | 0 (0.0%) | 0 (0.0%) |
Employment Characteristics in Snelling
Employment by Class of Employer in Snelling
Among the 133 employed individuals in Snelling, private company employees (70 | 52.6%), federal government employees (20 | 15.0%), and local government employees (18 | 13.5%) make up the most common classes of employment.
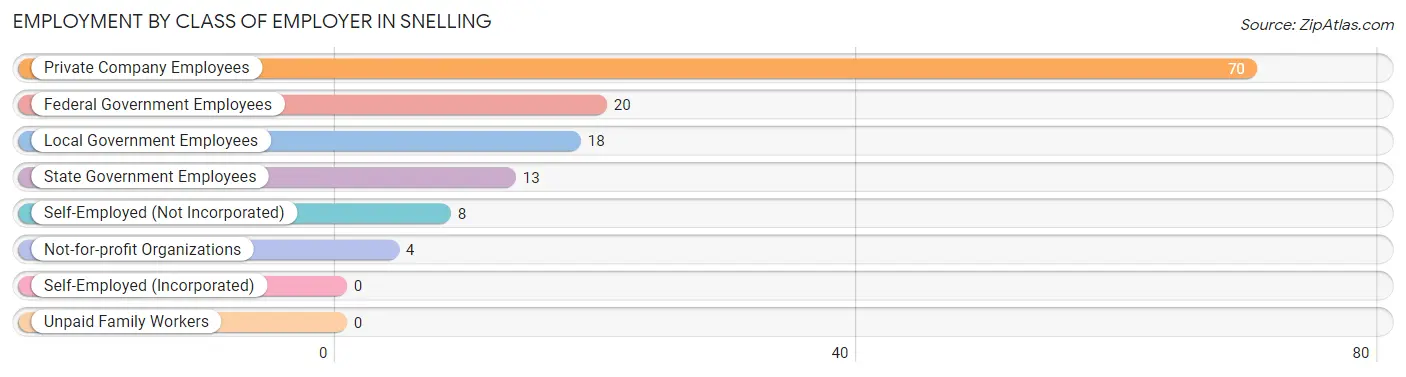
| Employer Class | # Employees | % Employees |
| Private Company Employees | 70 | 52.6% |
| Self-Employed (Incorporated) | 0 | 0.0% |
| Self-Employed (Not Incorporated) | 8 | 6.0% |
| Not-for-profit Organizations | 4 | 3.0% |
| Local Government Employees | 18 | 13.5% |
| State Government Employees | 13 | 9.8% |
| Federal Government Employees | 20 | 15.0% |
| Unpaid Family Workers | 0 | 0.0% |
| Total | 133 | 100.0% |
Employment Status by Age in Snelling
According to the labor force statistics for Snelling, out of the total population over 16 years of age (229), 59.0% or 135 individuals are in the labor force, with 1.5% or 2 of them unemployed. The age group with the highest labor force participation rate is 45 to 54 years, with 100.0% or 9 individuals in the labor force. Within the labor force, the 35 to 44 years age range has the highest percentage of unemployed individuals, with 9.1% or 2 of them being unemployed.
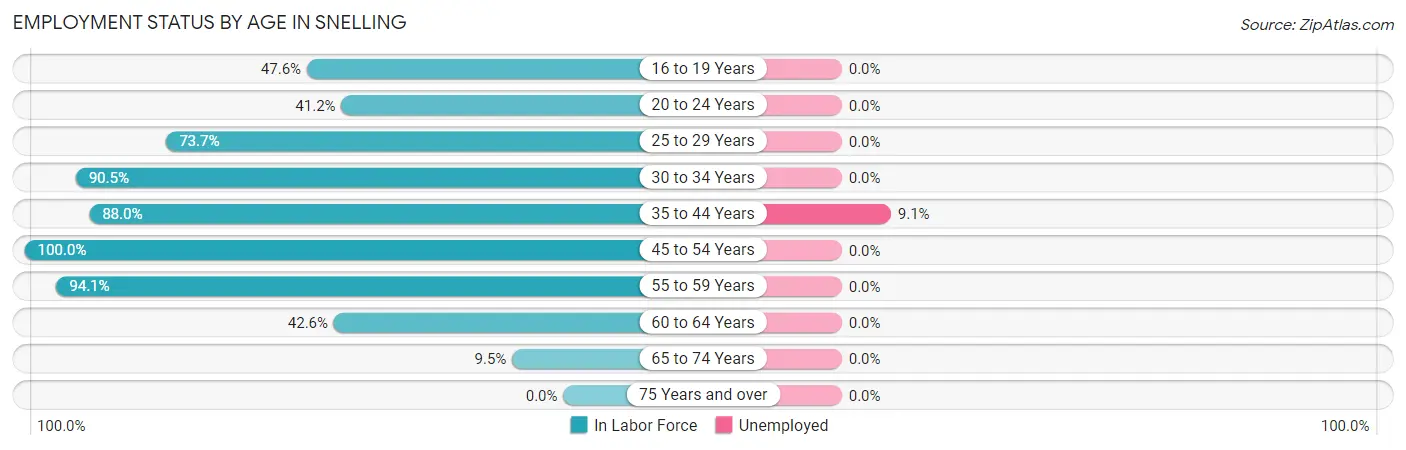
| Age Bracket | In Labor Force | Unemployed |
| 16 to 19 Years | 10 (47.6%) | 0 (0.0%) |
| 20 to 24 Years | 7 (41.2%) | 0 (0.0%) |
| 25 to 29 Years | 14 (73.7%) | 0 (0.0%) |
| 30 to 34 Years | 19 (90.5%) | 0 (0.0%) |
| 35 to 44 Years | 22 (88.0%) | 2 (9.1%) |
| 45 to 54 Years | 9 (100.0%) | 0 (0.0%) |
| 55 to 59 Years | 32 (94.1%) | 0 (0.0%) |
| 60 to 64 Years | 20 (42.6%) | 0 (0.0%) |
| 65 to 74 Years | 2 (9.5%) | 0 (0.0%) |
| 75 Years and over | 0 (0.0%) | 0 (0.0%) |
| Total | 135 (59.0%) | 2 (1.5%) |
Employment Status by Educational Attainment in Snelling
According to labor force statistics for Snelling, 74.8% of individuals (116) out of the total population between 25 and 64 years of age (155) are in the labor force, with 1.7% or 2 of them being unemployed. The group with the highest labor force participation rate are those with the educational attainment of high school diploma, with 91.8% or 56 individuals in the labor force. Within the labor force, individuals with college / associate degree education have the highest percentage of unemployment, with 5.7% or 2 of them being unemployed.
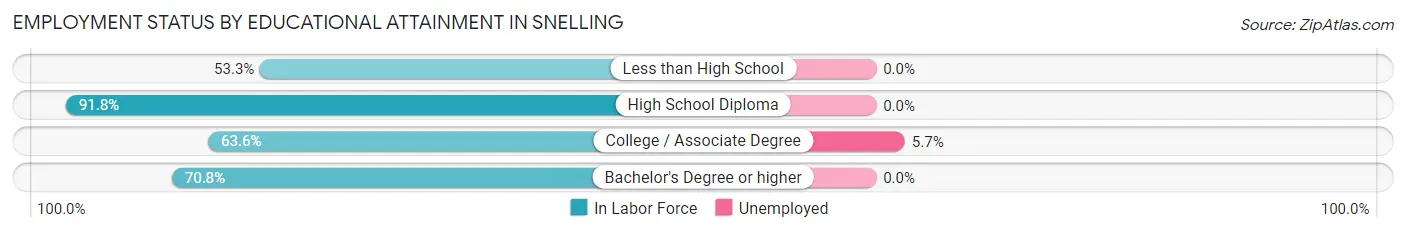
| Educational Attainment | In Labor Force | Unemployed |
| Less than High School | 8 (53.3%) | 0 (0.0%) |
| High School Diploma | 56 (91.8%) | 0 (0.0%) |
| College / Associate Degree | 35 (63.6%) | 3 (5.7%) |
| Bachelor's Degree or higher | 17 (70.8%) | 0 (0.0%) |
| Total | 116 (74.8%) | 3 (1.7%) |
Employment Occupations by Sex in Snelling
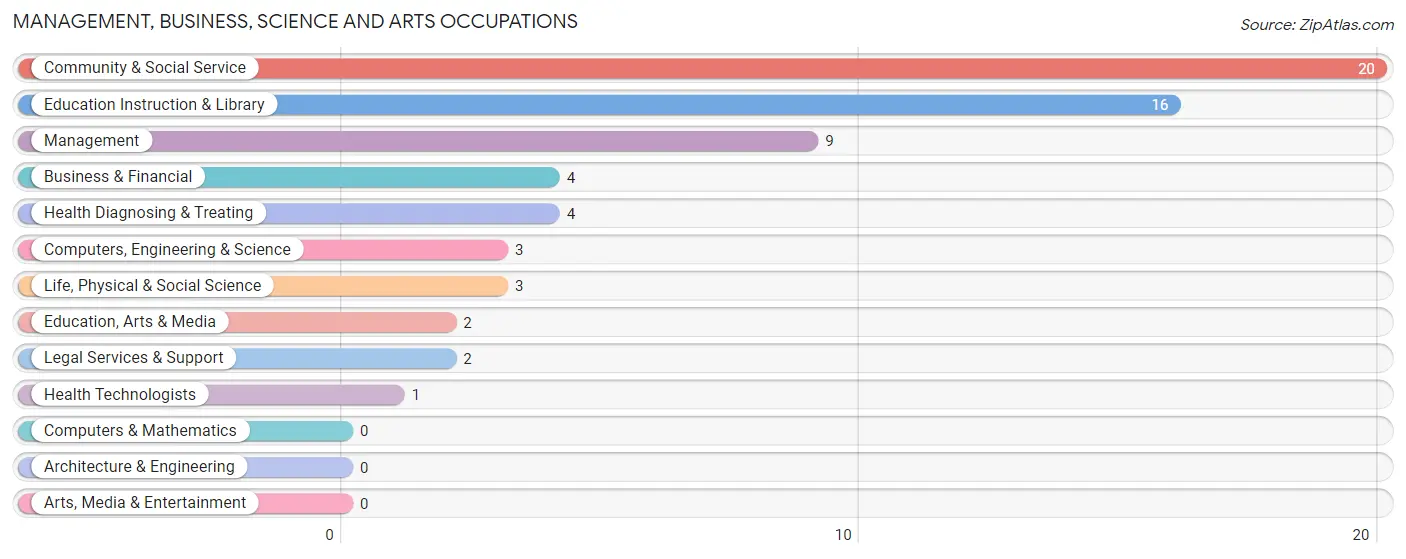
Management, Business, Science and Arts Occupations
The most common Management, Business, Science and Arts occupations in Snelling are Community & Social Service (20 | 15.0%), Education Instruction & Library (16 | 12.0%), Management (9 | 6.8%), Business & Financial (4 | 3.0%), and Health Diagnosing & Treating (4 | 3.0%).
Management, Business, Science and Arts Occupations by Sex
Within the Management, Business, Science and Arts occupations in Snelling, the most male-oriented occupations are Computers, Engineering & Science (100.0%), Life, Physical & Social Science (100.0%), and Education, Arts & Media (100.0%), while the most female-oriented occupations are Business & Financial (100.0%), Legal Services & Support (100.0%), and Education Instruction & Library (100.0%).
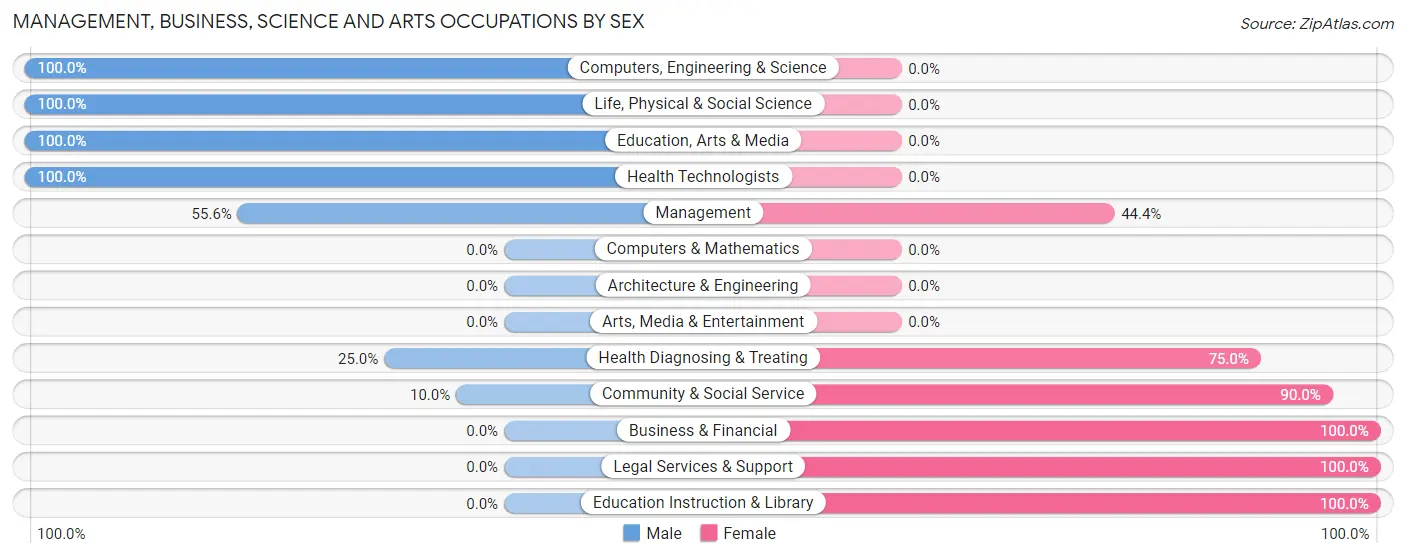
| Occupation | Male | Female |
| Management | 5 (55.6%) | 4 (44.4%) |
| Business & Financial | 0 (0.0%) | 4 (100.0%) |
| Computers, Engineering & Science | 3 (100.0%) | 0 (0.0%) |
| Computers & Mathematics | 0 (0.0%) | 0 (0.0%) |
| Architecture & Engineering | 0 (0.0%) | 0 (0.0%) |
| Life, Physical & Social Science | 3 (100.0%) | 0 (0.0%) |
| Community & Social Service | 2 (10.0%) | 18 (90.0%) |
| Education, Arts & Media | 2 (100.0%) | 0 (0.0%) |
| Legal Services & Support | 0 (0.0%) | 2 (100.0%) |
| Education Instruction & Library | 0 (0.0%) | 16 (100.0%) |
| Arts, Media & Entertainment | 0 (0.0%) | 0 (0.0%) |
| Health Diagnosing & Treating | 1 (25.0%) | 3 (75.0%) |
| Health Technologists | 1 (100.0%) | 0 (0.0%) |
| Total (Category) | 11 (27.5%) | 29 (72.5%) |
| Total (Overall) | 81 (60.9%) | 52 (39.1%) |
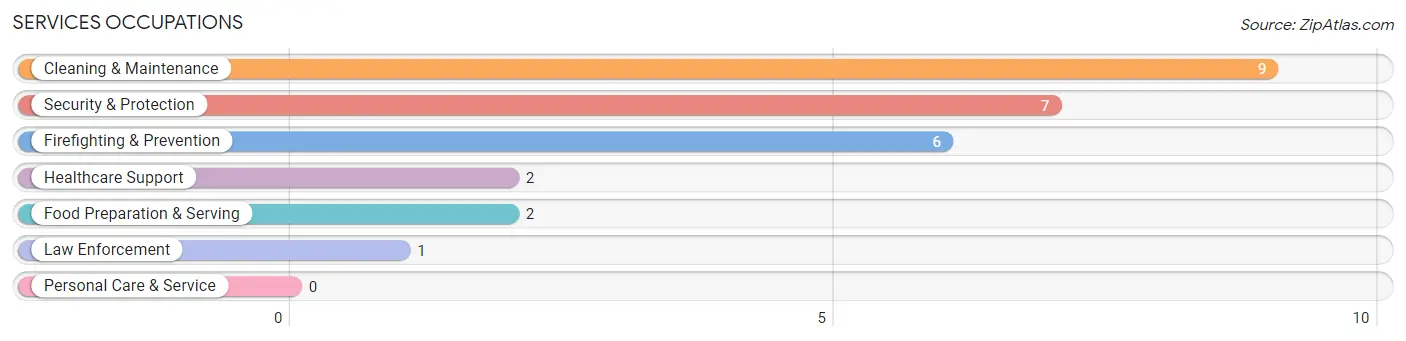
Services Occupations
The most common Services occupations in Snelling are Cleaning & Maintenance (9 | 6.8%), Security & Protection (7 | 5.3%), Firefighting & Prevention (6 | 4.5%), Healthcare Support (2 | 1.5%), and Food Preparation & Serving (2 | 1.5%).
Services Occupations by Sex
Within the Services occupations in Snelling, the most male-oriented occupations are Security & Protection (100.0%), Firefighting & Prevention (100.0%), and Law Enforcement (100.0%), while the most female-oriented occupations are Healthcare Support (100.0%), and Cleaning & Maintenance (55.6%).
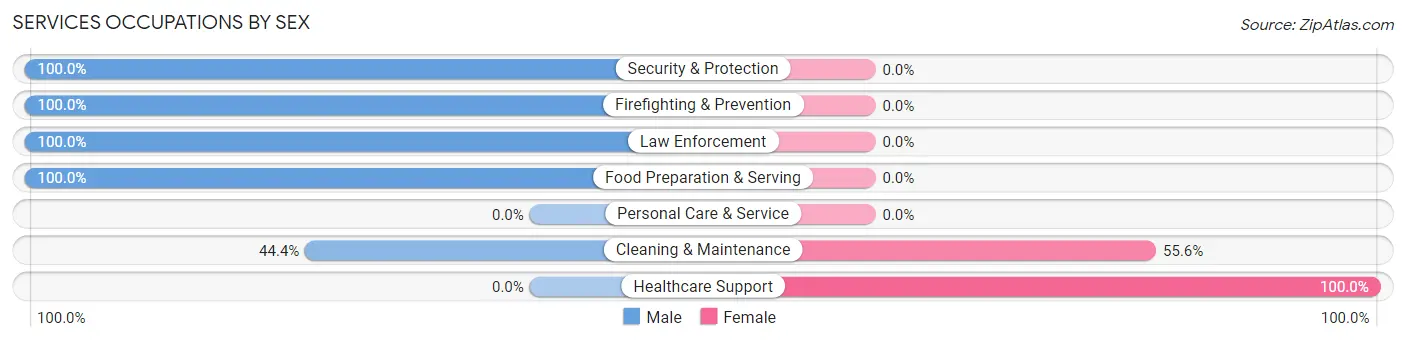
| Occupation | Male | Female |
| Healthcare Support | 0 (0.0%) | 2 (100.0%) |
| Security & Protection | 7 (100.0%) | 0 (0.0%) |
| Firefighting & Prevention | 6 (100.0%) | 0 (0.0%) |
| Law Enforcement | 1 (100.0%) | 0 (0.0%) |
| Food Preparation & Serving | 2 (100.0%) | 0 (0.0%) |
| Cleaning & Maintenance | 4 (44.4%) | 5 (55.6%) |
| Personal Care & Service | 0 (0.0%) | 0 (0.0%) |
| Total (Category) | 13 (65.0%) | 7 (35.0%) |
| Total (Overall) | 81 (60.9%) | 52 (39.1%) |
Sales and Office Occupations
The most common Sales and Office occupations in Snelling are , and Office & Administration (19 | 14.3%).
Sales and Office Occupations by Sex
| Occupation | Male | Female |
| Sales & Related | 0 (0.0%) | 0 (0.0%) |
| Office & Administration | 7 (36.8%) | 12 (63.2%) |
| Total (Category) | 7 (36.8%) | 12 (63.2%) |
| Total (Overall) | 81 (60.9%) | 52 (39.1%) |
Natural Resources, Construction and Maintenance Occupations
The most common Natural Resources, Construction and Maintenance occupations in Snelling are Construction & Extraction (18 | 13.5%), and Installation, Maintenance & Repair (6 | 4.5%).
Natural Resources, Construction and Maintenance Occupations by Sex
| Occupation | Male | Female |
| Farming, Fishing & Forestry | 0 (0.0%) | 0 (0.0%) |
| Construction & Extraction | 18 (100.0%) | 0 (0.0%) |
| Installation, Maintenance & Repair | 6 (100.0%) | 0 (0.0%) |
| Total (Category) | 24 (100.0%) | 0 (0.0%) |
| Total (Overall) | 81 (60.9%) | 52 (39.1%) |
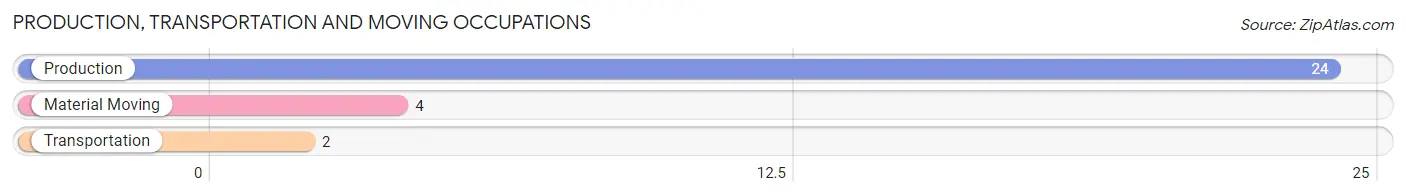
Production, Transportation and Moving Occupations
The most common Production, Transportation and Moving occupations in Snelling are Production (24 | 18.0%), Material Moving (4 | 3.0%), and Transportation (2 | 1.5%).
Production, Transportation and Moving Occupations by Sex
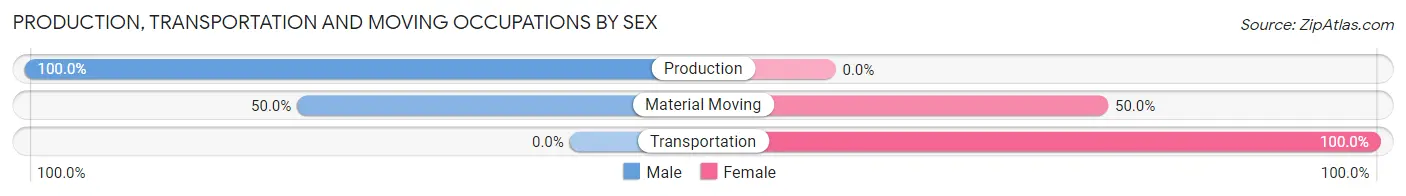
| Occupation | Male | Female |
| Production | 24 (100.0%) | 0 (0.0%) |
| Transportation | 0 (0.0%) | 2 (100.0%) |
| Material Moving | 2 (50.0%) | 2 (50.0%) |
| Total (Category) | 26 (86.7%) | 4 (13.3%) |
| Total (Overall) | 81 (60.9%) | 52 (39.1%) |
Employment Industries by Sex in Snelling
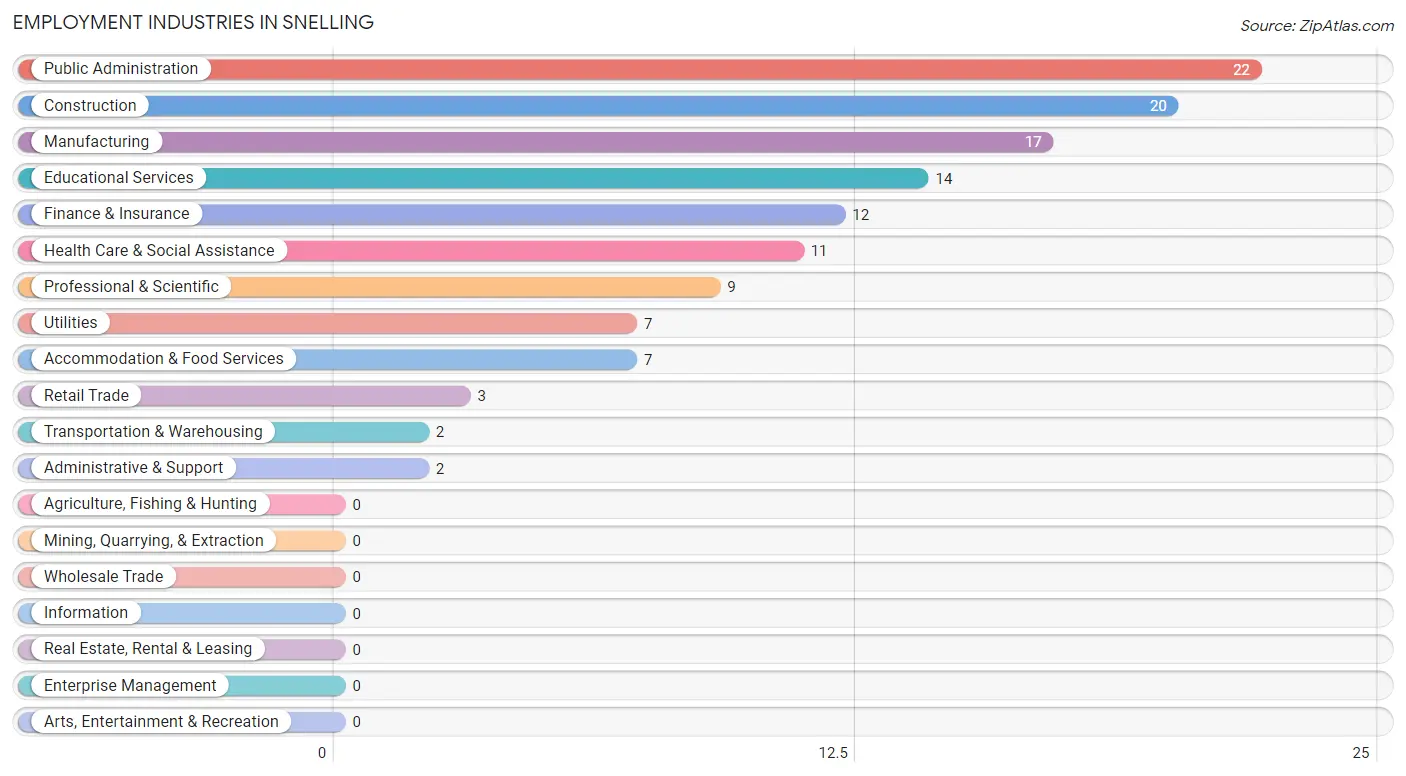
Employment Industries in Snelling
The major employment industries in Snelling include Public Administration (22 | 16.5%), Construction (20 | 15.0%), Manufacturing (17 | 12.8%), Educational Services (14 | 10.5%), and Finance & Insurance (12 | 9.0%).
Employment Industries by Sex in Snelling
The Snelling industries that see more men than women are Transportation & Warehousing (100.0%), Utilities (100.0%), and Professional & Scientific (100.0%), whereas the industries that tend to have a higher number of women are Finance & Insurance (100.0%), Educational Services (100.0%), and Health Care & Social Assistance (100.0%).
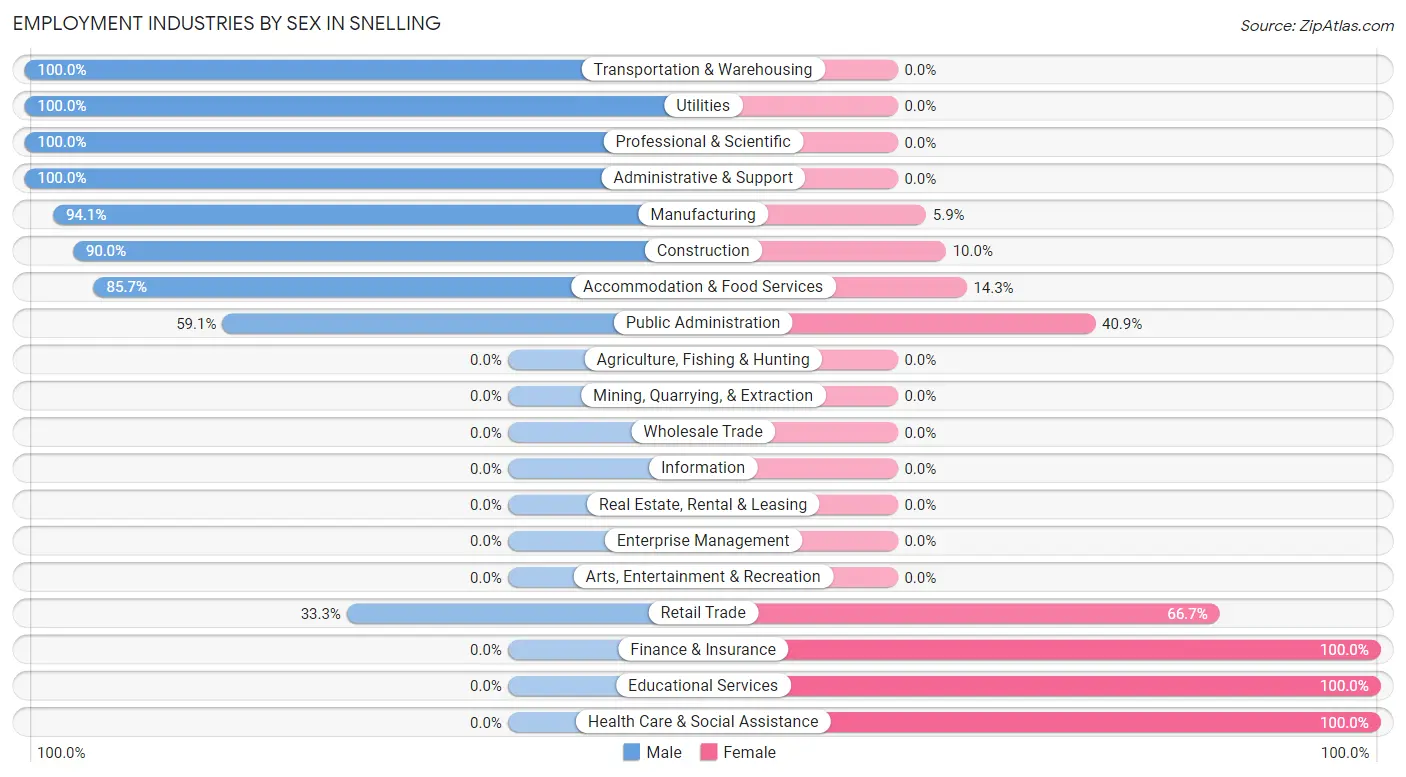
| Industry | Male | Female |
| Agriculture, Fishing & Hunting | 0 (0.0%) | 0 (0.0%) |
| Mining, Quarrying, & Extraction | 0 (0.0%) | 0 (0.0%) |
| Construction | 18 (90.0%) | 2 (10.0%) |
| Manufacturing | 16 (94.1%) | 1 (5.9%) |
| Wholesale Trade | 0 (0.0%) | 0 (0.0%) |
| Retail Trade | 1 (33.3%) | 2 (66.7%) |
| Transportation & Warehousing | 2 (100.0%) | 0 (0.0%) |
| Utilities | 7 (100.0%) | 0 (0.0%) |
| Information | 0 (0.0%) | 0 (0.0%) |
| Finance & Insurance | 0 (0.0%) | 12 (100.0%) |
| Real Estate, Rental & Leasing | 0 (0.0%) | 0 (0.0%) |
| Professional & Scientific | 9 (100.0%) | 0 (0.0%) |
| Enterprise Management | 0 (0.0%) | 0 (0.0%) |
| Administrative & Support | 2 (100.0%) | 0 (0.0%) |
| Educational Services | 0 (0.0%) | 14 (100.0%) |
| Health Care & Social Assistance | 0 (0.0%) | 11 (100.0%) |
| Arts, Entertainment & Recreation | 0 (0.0%) | 0 (0.0%) |
| Accommodation & Food Services | 6 (85.7%) | 1 (14.3%) |
| Public Administration | 13 (59.1%) | 9 (40.9%) |
| Total | 81 (60.9%) | 52 (39.1%) |
Education in Snelling
School Enrollment in Snelling
The most common levels of schooling among the 55 students in Snelling are high school (13 | 23.6%), college / undergraduate (13 | 23.6%), and nursery / preschool (12 | 21.8%).
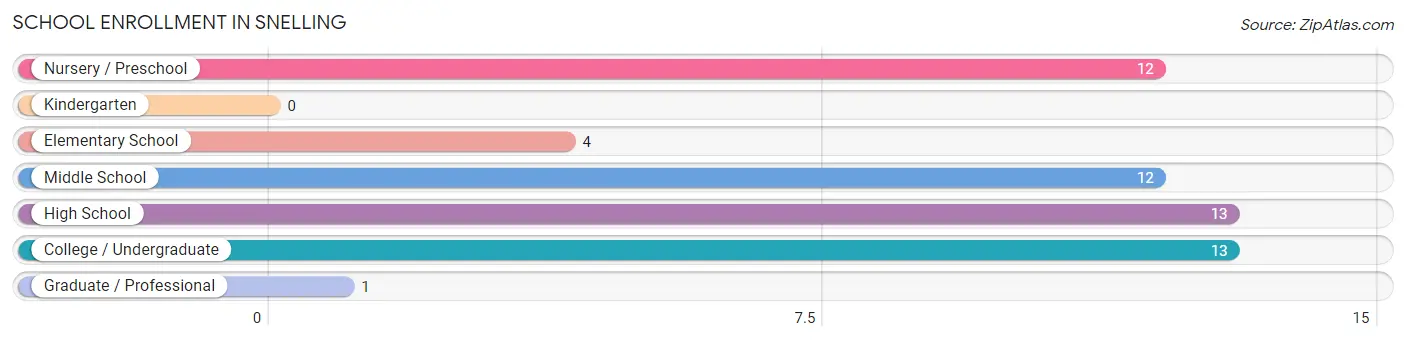
| School Level | # Students | % Students |
| Nursery / Preschool | 12 | 21.8% |
| Kindergarten | 0 | 0.0% |
| Elementary School | 4 | 7.3% |
| Middle School | 12 | 21.8% |
| High School | 13 | 23.6% |
| College / Undergraduate | 13 | 23.6% |
| Graduate / Professional | 1 | 1.8% |
| Total | 55 | 100.0% |
School Enrollment by Age by Funding Source in Snelling
Out of a total of 55 students who are enrolled in schools in Snelling, 13 (23.6%) attend a private institution, while the remaining 42 (76.4%) are enrolled in public schools. The age group of 3 to 4 year olds has the highest likelihood of being enrolled in private schools, with 9 (75.0% in the age bracket) enrolled. Conversely, the age group of 10 to 14 year olds has the lowest likelihood of being enrolled in a private school, with 12 (100.0% in the age bracket) attending a public institution.
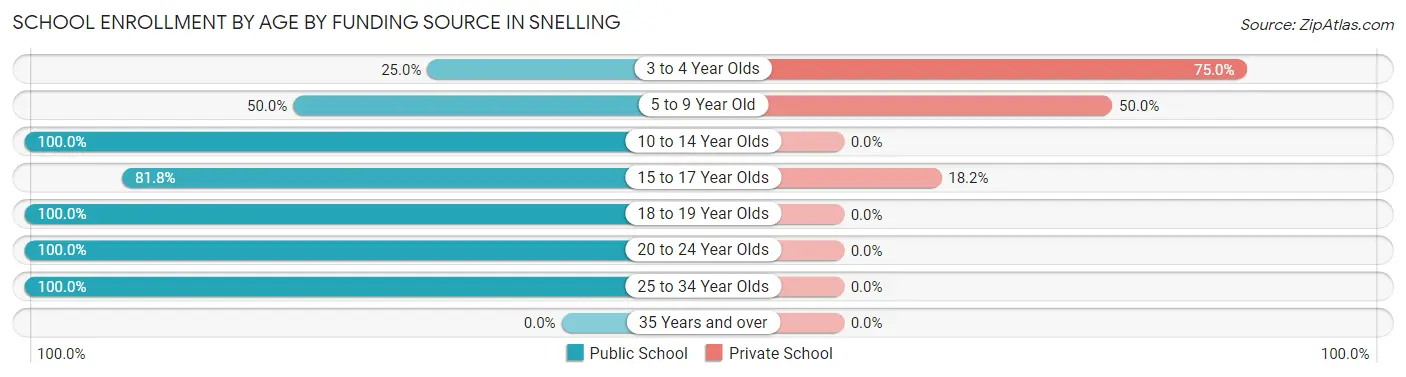
| Age Bracket | Public School | Private School |
| 3 to 4 Year Olds | 3 (25.0%) | 9 (75.0%) |
| 5 to 9 Year Old | 2 (50.0%) | 2 (50.0%) |
| 10 to 14 Year Olds | 12 (100.0%) | 0 (0.0%) |
| 15 to 17 Year Olds | 9 (81.8%) | 2 (18.2%) |
| 18 to 19 Year Olds | 5 (100.0%) | 0 (0.0%) |
| 20 to 24 Year Olds | 10 (100.0%) | 0 (0.0%) |
| 25 to 34 Year Olds | 1 (100.0%) | 0 (0.0%) |
| 35 Years and over | 0 (0.0%) | 0 (0.0%) |
| Total | 42 (76.4%) | 13 (23.6%) |
Educational Attainment by Field of Study in Snelling
Arts & humanities (9 | 32.1%), business (8 | 28.6%), education (5 | 17.9%), psychology (2 | 7.1%), and communications (2 | 7.1%) are the most common fields of study among 28 individuals in Snelling who have obtained a bachelor's degree or higher.
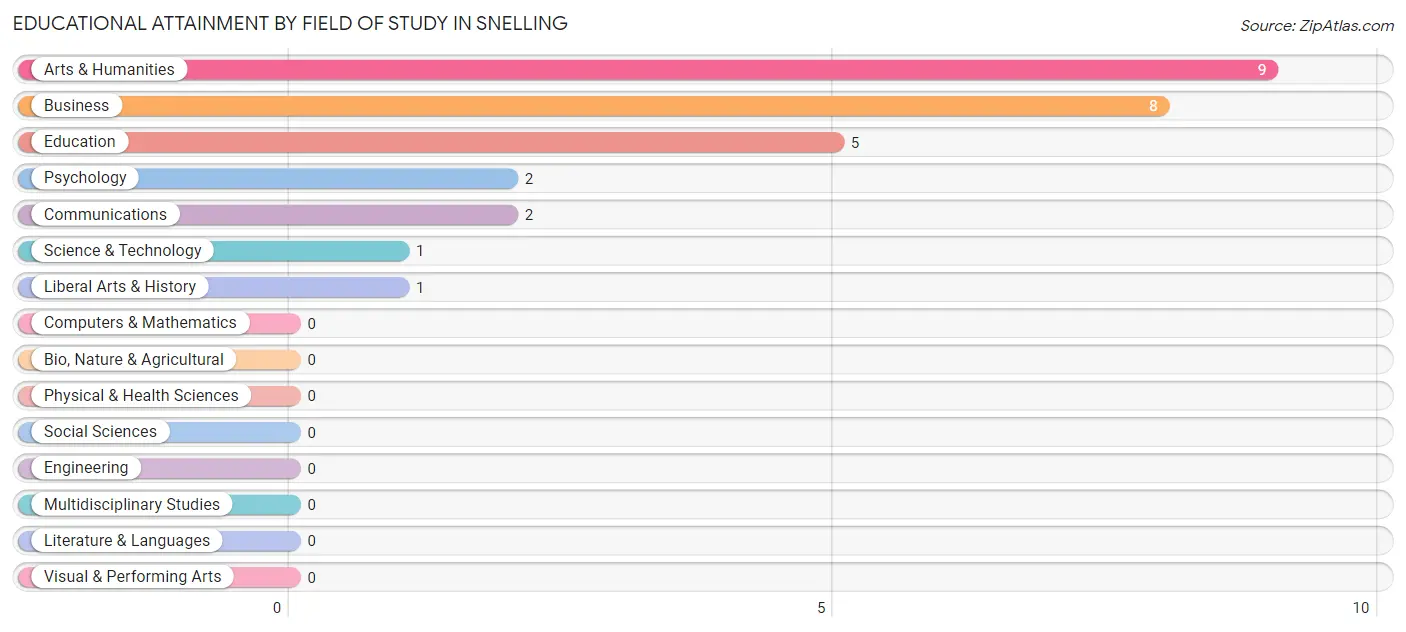
| Field of Study | # Graduates | % Graduates |
| Computers & Mathematics | 0 | 0.0% |
| Bio, Nature & Agricultural | 0 | 0.0% |
| Physical & Health Sciences | 0 | 0.0% |
| Psychology | 2 | 7.1% |
| Social Sciences | 0 | 0.0% |
| Engineering | 0 | 0.0% |
| Multidisciplinary Studies | 0 | 0.0% |
| Science & Technology | 1 | 3.6% |
| Business | 8 | 28.6% |
| Education | 5 | 17.9% |
| Literature & Languages | 0 | 0.0% |
| Liberal Arts & History | 1 | 3.6% |
| Visual & Performing Arts | 0 | 0.0% |
| Communications | 2 | 7.1% |
| Arts & Humanities | 9 | 32.1% |
| Total | 28 | 100.0% |
Transportation & Commute in Snelling
Vehicle Availability by Sex in Snelling
The most prevalent vehicle ownership categories in Snelling are males with 5 or more vehicles (38, accounting for 46.9%) and females with 5 or more vehicles (16, making up 73.1%).
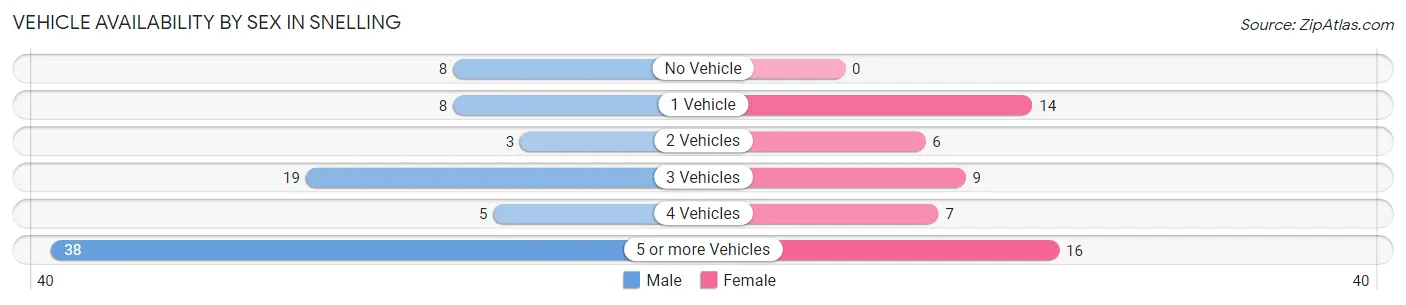
| Vehicles Available | Male | Female |
| No Vehicle | 8 (9.9%) | 0 (0.0%) |
| 1 Vehicle | 8 (9.9%) | 14 (26.9%) |
| 2 Vehicles | 3 (3.7%) | 6 (11.5%) |
| 3 Vehicles | 19 (23.5%) | 9 (17.3%) |
| 4 Vehicles | 5 (6.2%) | 7 (13.5%) |
| 5 or more Vehicles | 38 (46.9%) | 16 (30.8%) |
| Total | 81 (100.0%) | 52 (100.0%) |
Commute Time in Snelling
The most frequently occuring commute durations in Snelling are 10 to 14 minutes (36 commuters, 27.5%), 15 to 19 minutes (22 commuters, 16.8%), and 5 to 9 minutes (19 commuters, 14.5%).
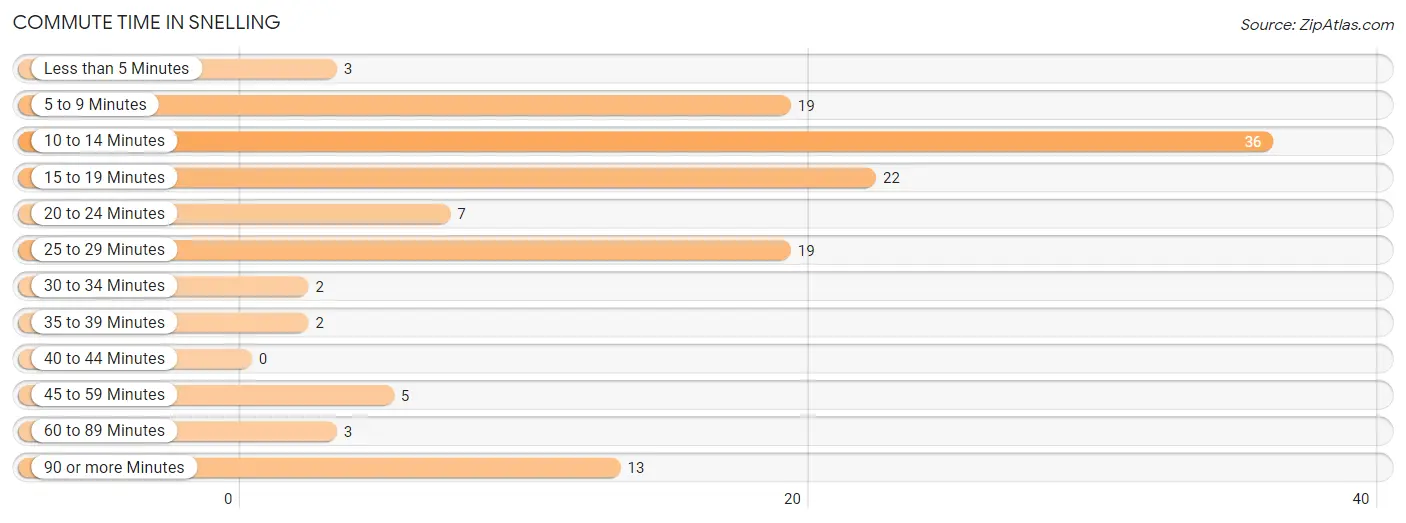
| Commute Time | # Commuters | % Commuters |
| Less than 5 Minutes | 3 | 2.3% |
| 5 to 9 Minutes | 19 | 14.5% |
| 10 to 14 Minutes | 36 | 27.5% |
| 15 to 19 Minutes | 22 | 16.8% |
| 20 to 24 Minutes | 7 | 5.3% |
| 25 to 29 Minutes | 19 | 14.5% |
| 30 to 34 Minutes | 2 | 1.5% |
| 35 to 39 Minutes | 2 | 1.5% |
| 40 to 44 Minutes | 0 | 0.0% |
| 45 to 59 Minutes | 5 | 3.8% |
| 60 to 89 Minutes | 3 | 2.3% |
| 90 or more Minutes | 13 | 9.9% |
Commute Time by Sex in Snelling
The most common commute times in Snelling are 10 to 14 minutes (26 commuters, 32.1%) for males and 25 to 29 minutes (11 commuters, 22.0%) for females.
| Commute Time | Male | Female |
| Less than 5 Minutes | 3 (3.7%) | 0 (0.0%) |
| 5 to 9 Minutes | 12 (14.8%) | 7 (14.0%) |
| 10 to 14 Minutes | 26 (32.1%) | 10 (20.0%) |
| 15 to 19 Minutes | 17 (21.0%) | 5 (10.0%) |
| 20 to 24 Minutes | 0 (0.0%) | 7 (14.0%) |
| 25 to 29 Minutes | 8 (9.9%) | 11 (22.0%) |
| 30 to 34 Minutes | 2 (2.5%) | 0 (0.0%) |
| 35 to 39 Minutes | 0 (0.0%) | 2 (4.0%) |
| 40 to 44 Minutes | 0 (0.0%) | 0 (0.0%) |
| 45 to 59 Minutes | 0 (0.0%) | 5 (10.0%) |
| 60 to 89 Minutes | 0 (0.0%) | 3 (6.0%) |
| 90 or more Minutes | 13 (16.1%) | 0 (0.0%) |
Time of Departure to Work by Sex in Snelling
The most frequent times of departure to work in Snelling are 4:00 PM to 11:59 PM (19, 23.5%) for males and 7:30 AM to 7:59 AM (22, 44.0%) for females.
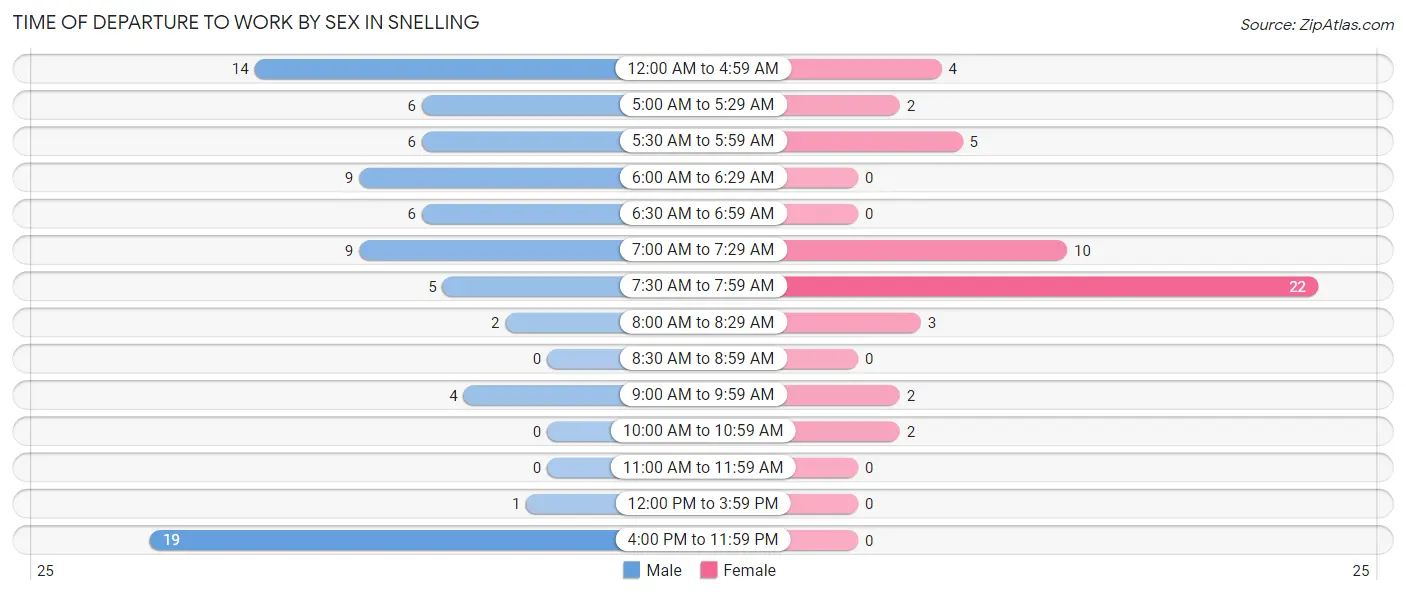
| Time of Departure | Male | Female |
| 12:00 AM to 4:59 AM | 14 (17.3%) | 4 (8.0%) |
| 5:00 AM to 5:29 AM | 6 (7.4%) | 2 (4.0%) |
| 5:30 AM to 5:59 AM | 6 (7.4%) | 5 (10.0%) |
| 6:00 AM to 6:29 AM | 9 (11.1%) | 0 (0.0%) |
| 6:30 AM to 6:59 AM | 6 (7.4%) | 0 (0.0%) |
| 7:00 AM to 7:29 AM | 9 (11.1%) | 10 (20.0%) |
| 7:30 AM to 7:59 AM | 5 (6.2%) | 22 (44.0%) |
| 8:00 AM to 8:29 AM | 2 (2.5%) | 3 (6.0%) |
| 8:30 AM to 8:59 AM | 0 (0.0%) | 0 (0.0%) |
| 9:00 AM to 9:59 AM | 4 (4.9%) | 2 (4.0%) |
| 10:00 AM to 10:59 AM | 0 (0.0%) | 2 (4.0%) |
| 11:00 AM to 11:59 AM | 0 (0.0%) | 0 (0.0%) |
| 12:00 PM to 3:59 PM | 1 (1.2%) | 0 (0.0%) |
| 4:00 PM to 11:59 PM | 19 (23.5%) | 0 (0.0%) |
| Total | 81 (100.0%) | 50 (100.0%) |
Housing Occupancy in Snelling
Occupancy by Ownership in Snelling
Of the total 101 dwellings in Snelling, owner-occupied units account for 87 (86.1%), while renter-occupied units make up 14 (13.9%).
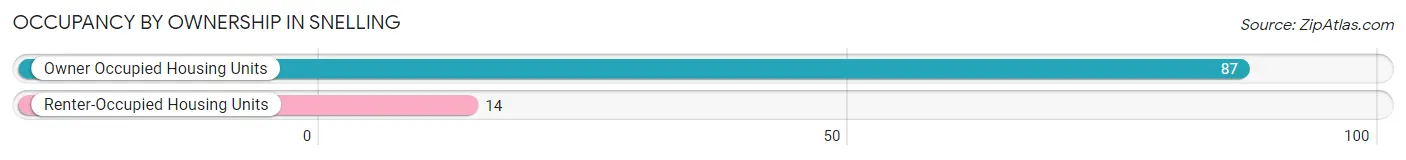
| Occupancy | # Housing Units | % Housing Units |
| Owner Occupied Housing Units | 87 | 86.1% |
| Renter-Occupied Housing Units | 14 | 13.9% |
| Total Occupied Housing Units | 101 | 100.0% |
Occupancy by Household Size in Snelling
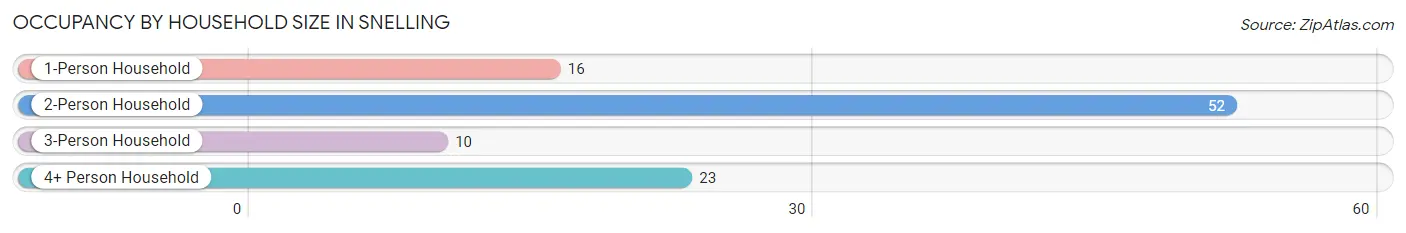
| Household Size | # Housing Units | % Housing Units |
| 1-Person Household | 16 | 15.8% |
| 2-Person Household | 52 | 51.5% |
| 3-Person Household | 10 | 9.9% |
| 4+ Person Household | 23 | 22.8% |
| Total Housing Units | 101 | 100.0% |
Occupancy by Ownership by Household Size in Snelling
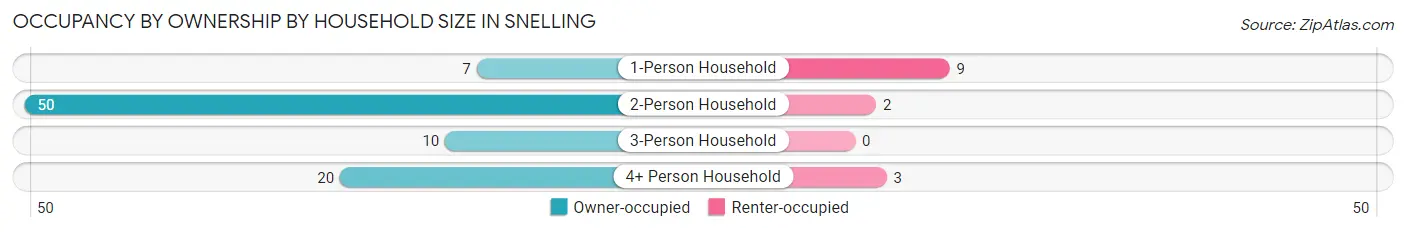
| Household Size | Owner-occupied | Renter-occupied |
| 1-Person Household | 7 (43.8%) | 9 (56.2%) |
| 2-Person Household | 50 (96.2%) | 2 (3.8%) |
| 3-Person Household | 10 (100.0%) | 0 (0.0%) |
| 4+ Person Household | 20 (87.0%) | 3 (13.0%) |
| Total Housing Units | 87 (86.1%) | 14 (13.9%) |
Occupancy by Educational Attainment in Snelling
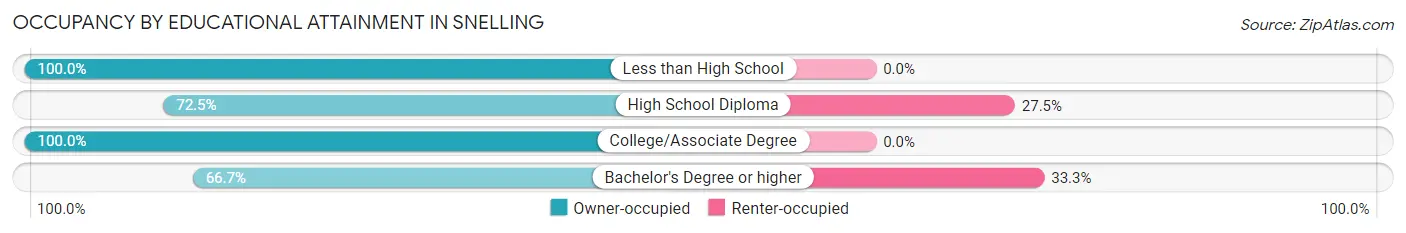
| Household Size | Owner-occupied | Renter-occupied |
| Less than High School | 10 (100.0%) | 0 (0.0%) |
| High School Diploma | 29 (72.5%) | 11 (27.5%) |
| College/Associate Degree | 42 (100.0%) | 0 (0.0%) |
| Bachelor's Degree or higher | 6 (66.7%) | 3 (33.3%) |
Occupancy by Age of Householder in Snelling
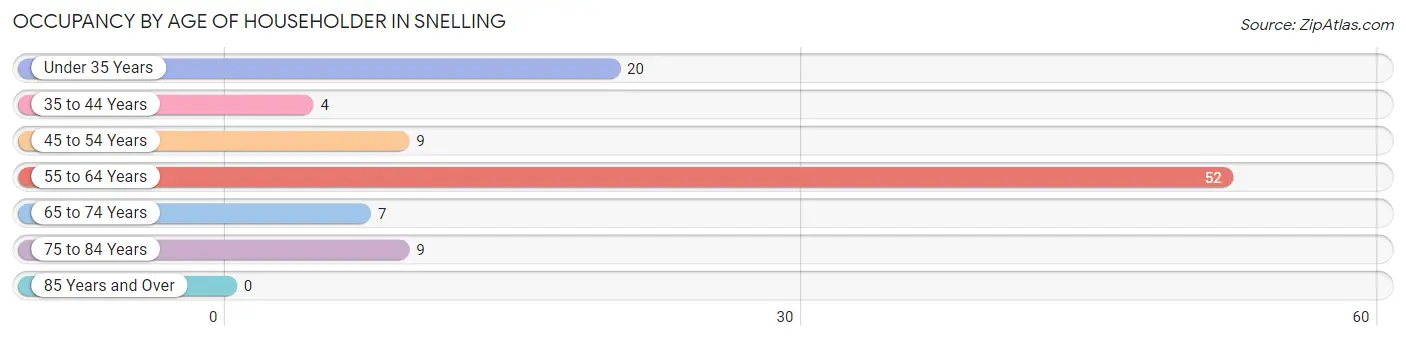
| Age Bracket | # Households | % Households |
| Under 35 Years | 20 | 19.8% |
| 35 to 44 Years | 4 | 4.0% |
| 45 to 54 Years | 9 | 8.9% |
| 55 to 64 Years | 52 | 51.5% |
| 65 to 74 Years | 7 | 6.9% |
| 75 to 84 Years | 9 | 8.9% |
| 85 Years and Over | 0 | 0.0% |
| Total | 101 | 100.0% |
Housing Finances in Snelling
Median Income by Occupancy in Snelling
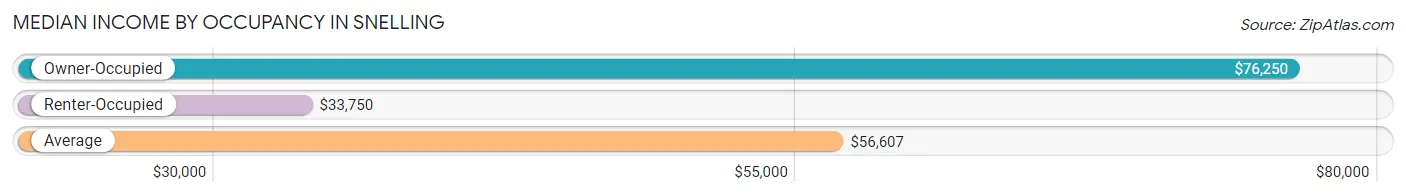
| Occupancy Type | # Households | Median Income |
| Owner-Occupied | 87 (86.1%) | $76,250 |
| Renter-Occupied | 14 (13.9%) | $33,750 |
| Average | 101 (100.0%) | $56,607 |
Occupancy by Householder Income Bracket in Snelling
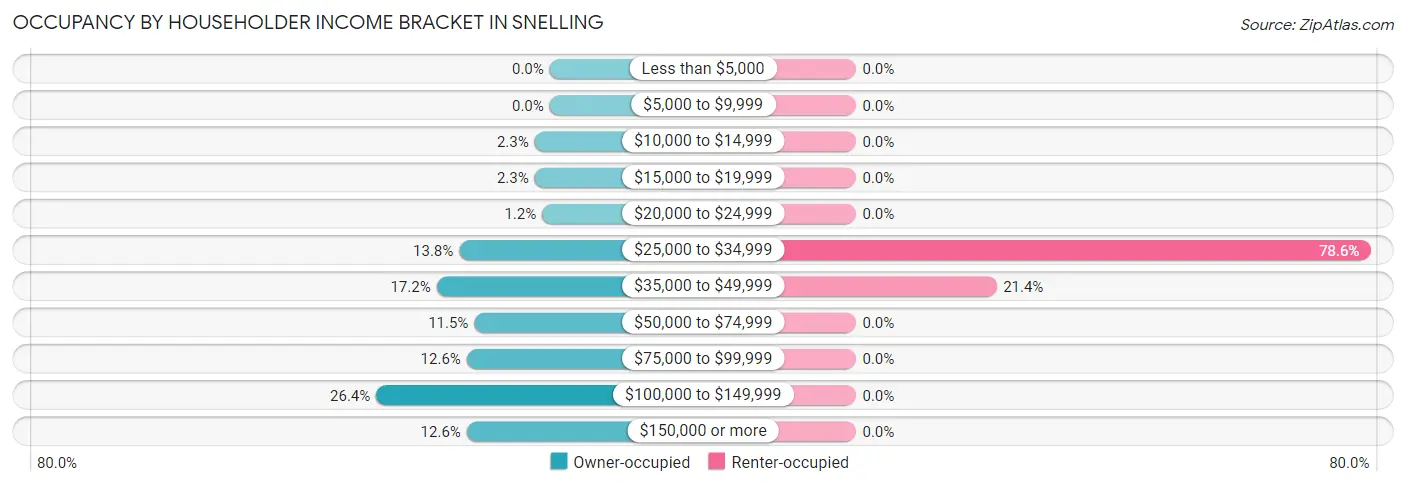
| Income Bracket | Owner-occupied | Renter-occupied |
| Less than $5,000 | 0 (0.0%) | 0 (0.0%) |
| $5,000 to $9,999 | 0 (0.0%) | 0 (0.0%) |
| $10,000 to $14,999 | 2 (2.3%) | 0 (0.0%) |
| $15,000 to $19,999 | 2 (2.3%) | 0 (0.0%) |
| $20,000 to $24,999 | 1 (1.1%) | 0 (0.0%) |
| $25,000 to $34,999 | 12 (13.8%) | 11 (78.6%) |
| $35,000 to $49,999 | 15 (17.2%) | 3 (21.4%) |
| $50,000 to $74,999 | 10 (11.5%) | 0 (0.0%) |
| $75,000 to $99,999 | 11 (12.6%) | 0 (0.0%) |
| $100,000 to $149,999 | 23 (26.4%) | 0 (0.0%) |
| $150,000 or more | 11 (12.6%) | 0 (0.0%) |
| Total | 87 (100.0%) | 14 (100.0%) |
Monthly Housing Cost Tiers in Snelling
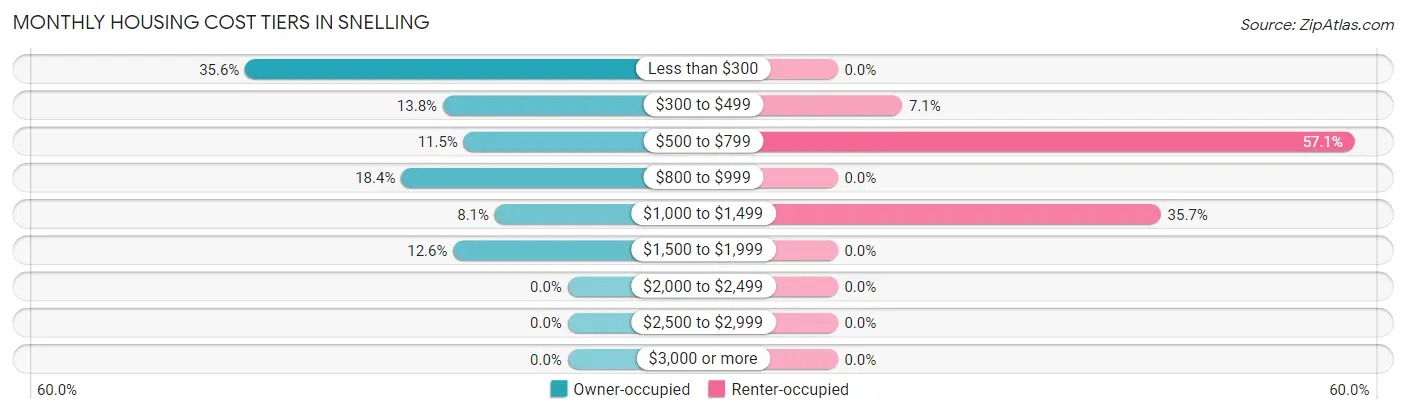
| Monthly Cost | Owner-occupied | Renter-occupied |
| Less than $300 | 31 (35.6%) | 0 (0.0%) |
| $300 to $499 | 12 (13.8%) | 1 (7.1%) |
| $500 to $799 | 10 (11.5%) | 8 (57.1%) |
| $800 to $999 | 16 (18.4%) | 0 (0.0%) |
| $1,000 to $1,499 | 7 (8.1%) | 5 (35.7%) |
| $1,500 to $1,999 | 11 (12.6%) | 0 (0.0%) |
| $2,000 to $2,499 | 0 (0.0%) | 0 (0.0%) |
| $2,500 to $2,999 | 0 (0.0%) | 0 (0.0%) |
| $3,000 or more | 0 (0.0%) | 0 (0.0%) |
| Total | 87 (100.0%) | 14 (100.0%) |
Physical Housing Characteristics in Snelling
Housing Structures in Snelling
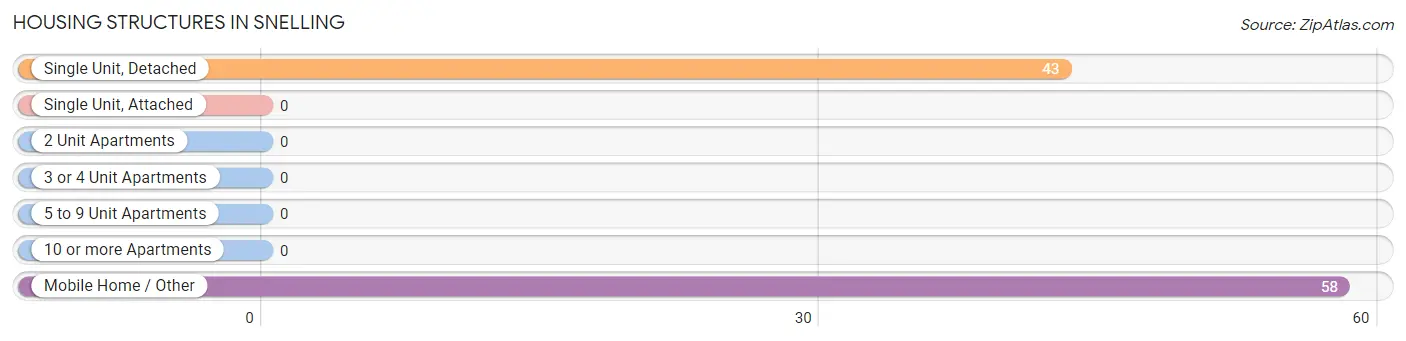
| Structure Type | # Housing Units | % Housing Units |
| Single Unit, Detached | 43 | 42.6% |
| Single Unit, Attached | 0 | 0.0% |
| 2 Unit Apartments | 0 | 0.0% |
| 3 or 4 Unit Apartments | 0 | 0.0% |
| 5 to 9 Unit Apartments | 0 | 0.0% |
| 10 or more Apartments | 0 | 0.0% |
| Mobile Home / Other | 58 | 57.4% |
| Total | 101 | 100.0% |
Housing Structures by Occupancy in Snelling
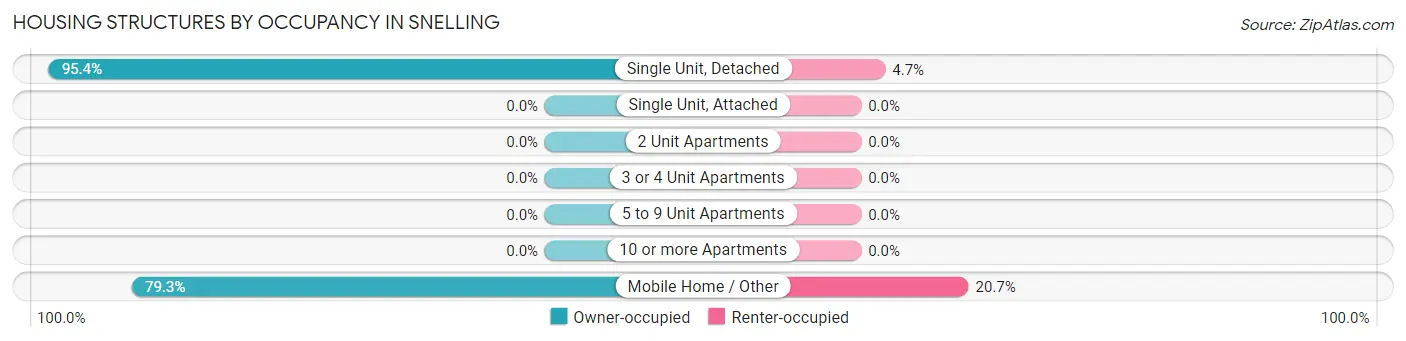
| Structure Type | Owner-occupied | Renter-occupied |
| Single Unit, Detached | 41 (95.4%) | 2 (4.6%) |
| Single Unit, Attached | 0 (0.0%) | 0 (0.0%) |
| 2 Unit Apartments | 0 (0.0%) | 0 (0.0%) |
| 3 or 4 Unit Apartments | 0 (0.0%) | 0 (0.0%) |
| 5 to 9 Unit Apartments | 0 (0.0%) | 0 (0.0%) |
| 10 or more Apartments | 0 (0.0%) | 0 (0.0%) |
| Mobile Home / Other | 46 (79.3%) | 12 (20.7%) |
| Total | 87 (86.1%) | 14 (13.9%) |
Housing Structures by Number of Rooms in Snelling
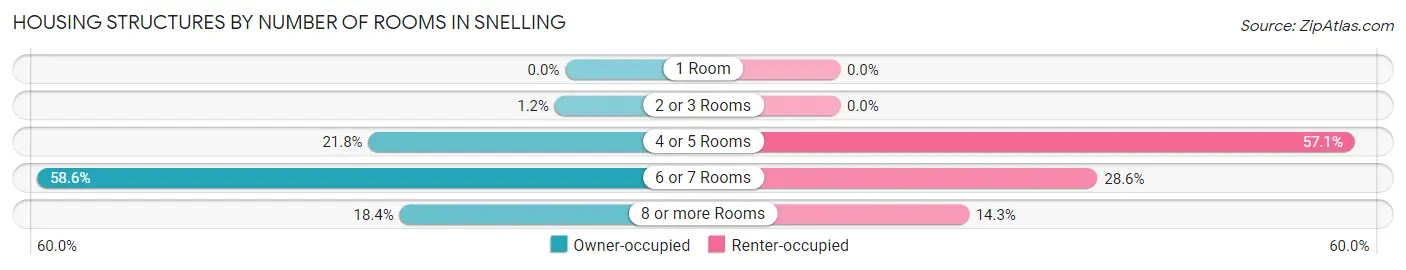
| Number of Rooms | Owner-occupied | Renter-occupied |
| 1 Room | 0 (0.0%) | 0 (0.0%) |
| 2 or 3 Rooms | 1 (1.1%) | 0 (0.0%) |
| 4 or 5 Rooms | 19 (21.8%) | 8 (57.1%) |
| 6 or 7 Rooms | 51 (58.6%) | 4 (28.6%) |
| 8 or more Rooms | 16 (18.4%) | 2 (14.3%) |
| Total | 87 (100.0%) | 14 (100.0%) |
Housing Structure by Heating Type in Snelling
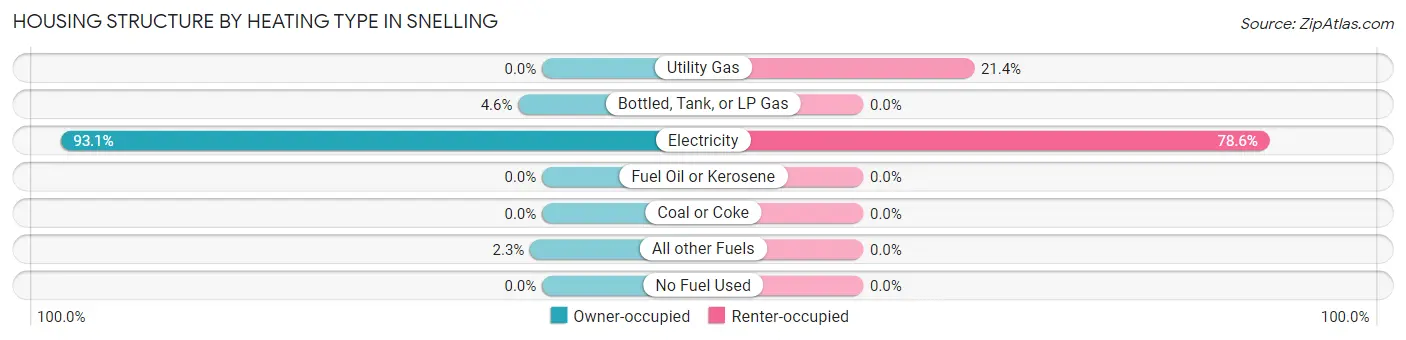
| Heating Type | Owner-occupied | Renter-occupied |
| Utility Gas | 0 (0.0%) | 3 (21.4%) |
| Bottled, Tank, or LP Gas | 4 (4.6%) | 0 (0.0%) |
| Electricity | 81 (93.1%) | 11 (78.6%) |
| Fuel Oil or Kerosene | 0 (0.0%) | 0 (0.0%) |
| Coal or Coke | 0 (0.0%) | 0 (0.0%) |
| All other Fuels | 2 (2.3%) | 0 (0.0%) |
| No Fuel Used | 0 (0.0%) | 0 (0.0%) |
| Total | 87 (100.0%) | 14 (100.0%) |
Household Vehicle Usage in Snelling
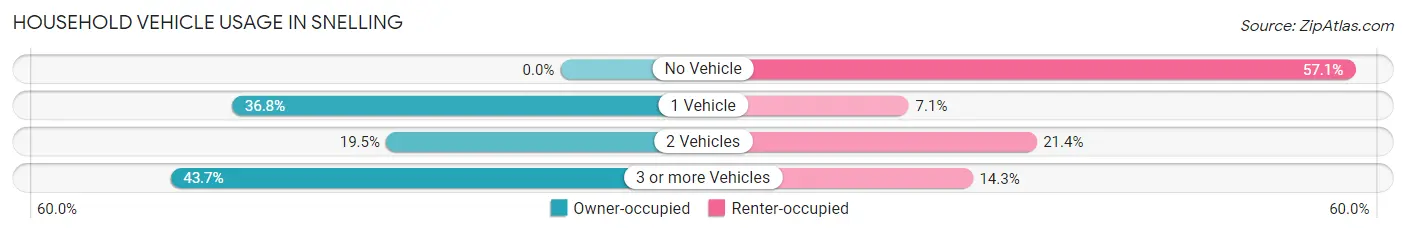
| Vehicles per Household | Owner-occupied | Renter-occupied |
| No Vehicle | 0 (0.0%) | 8 (57.1%) |
| 1 Vehicle | 32 (36.8%) | 1 (7.1%) |
| 2 Vehicles | 17 (19.5%) | 3 (21.4%) |
| 3 or more Vehicles | 38 (43.7%) | 2 (14.3%) |
| Total | 87 (100.0%) | 14 (100.0%) |
Real Estate & Mortgages in Snelling
Real Estate and Mortgage Overview in Snelling
| Characteristic | Without Mortgage | With Mortgage |
| Housing Units | 61 | 26 |
| Median Property Value | $58,300 | $175,000 |
| Median Household Income | $56,607 | $7 |
| Monthly Housing Costs | $298 | $0 |
| Real Estate Taxes | - | - |
Property Value by Mortgage Status in Snelling
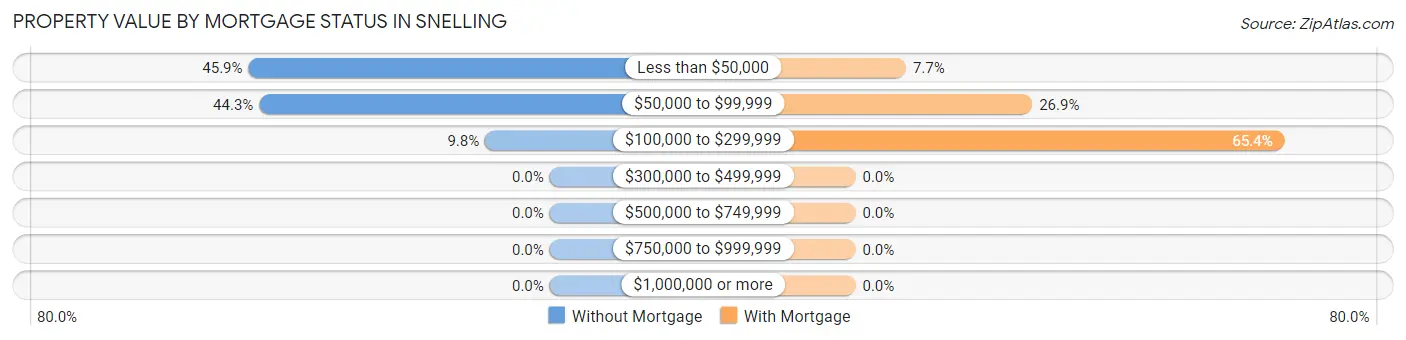
| Property Value | Without Mortgage | With Mortgage |
| Less than $50,000 | 28 (45.9%) | 2 (7.7%) |
| $50,000 to $99,999 | 27 (44.3%) | 7 (26.9%) |
| $100,000 to $299,999 | 6 (9.8%) | 17 (65.4%) |
| $300,000 to $499,999 | 0 (0.0%) | 0 (0.0%) |
| $500,000 to $749,999 | 0 (0.0%) | 0 (0.0%) |
| $750,000 to $999,999 | 0 (0.0%) | 0 (0.0%) |
| $1,000,000 or more | 0 (0.0%) | 0 (0.0%) |
| Total | 61 (100.0%) | 26 (100.0%) |
Household Income by Mortgage Status in Snelling
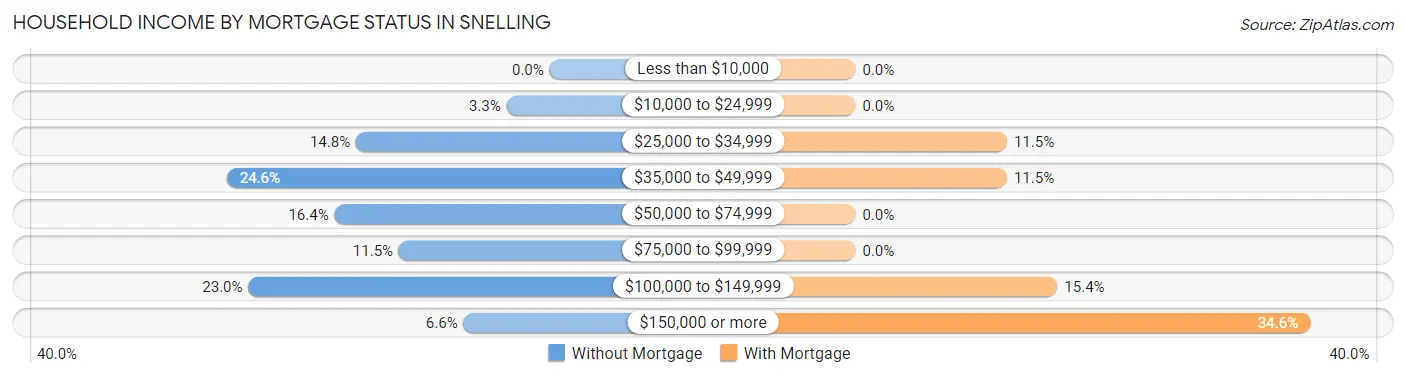
| Household Income | Without Mortgage | With Mortgage |
| Less than $10,000 | 0 (0.0%) | 0 (0.0%) |
| $10,000 to $24,999 | 2 (3.3%) | 0 (0.0%) |
| $25,000 to $34,999 | 9 (14.7%) | 3 (11.5%) |
| $35,000 to $49,999 | 15 (24.6%) | 3 (11.5%) |
| $50,000 to $74,999 | 10 (16.4%) | 0 (0.0%) |
| $75,000 to $99,999 | 7 (11.5%) | 0 (0.0%) |
| $100,000 to $149,999 | 14 (23.0%) | 4 (15.4%) |
| $150,000 or more | 4 (6.6%) | 9 (34.6%) |
| Total | 61 (100.0%) | 26 (100.0%) |
Property Value to Household Income Ratio in Snelling
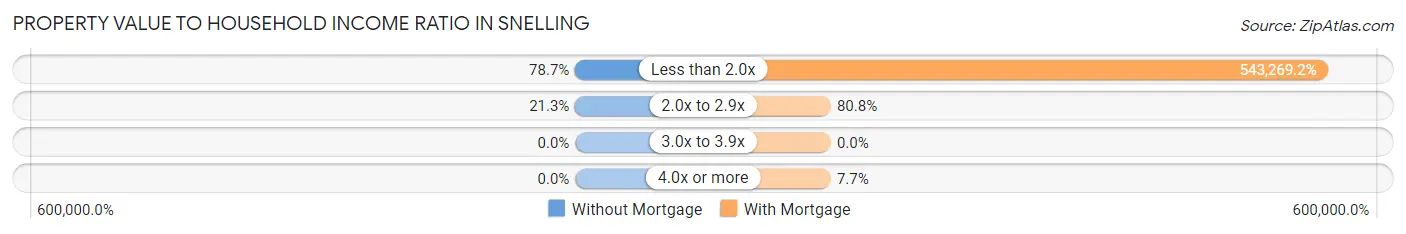
| Value-to-Income Ratio | Without Mortgage | With Mortgage |
| Less than 2.0x | 48 (78.7%) | 141,250 (543,269.2%) |
| 2.0x to 2.9x | 13 (21.3%) | 21 (80.8%) |
| 3.0x to 3.9x | 0 (0.0%) | 0 (0.0%) |
| 4.0x or more | 0 (0.0%) | 2 (7.7%) |
| Total | 61 (100.0%) | 26 (100.0%) |
Real Estate Taxes by Mortgage Status in Snelling
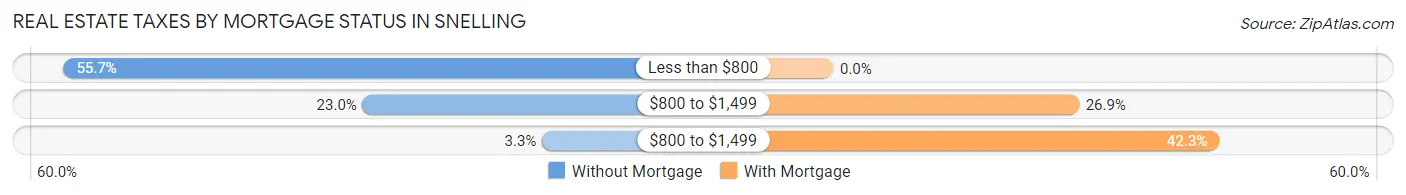
| Property Taxes | Without Mortgage | With Mortgage |
| Less than $800 | 34 (55.7%) | 0 (0.0%) |
| $800 to $1,499 | 14 (23.0%) | 7 (26.9%) |
| $800 to $1,499 | 2 (3.3%) | 11 (42.3%) |
| Total | 61 (100.0%) | 26 (100.0%) |
Health & Disability in Snelling
Health Insurance Coverage by Age in Snelling
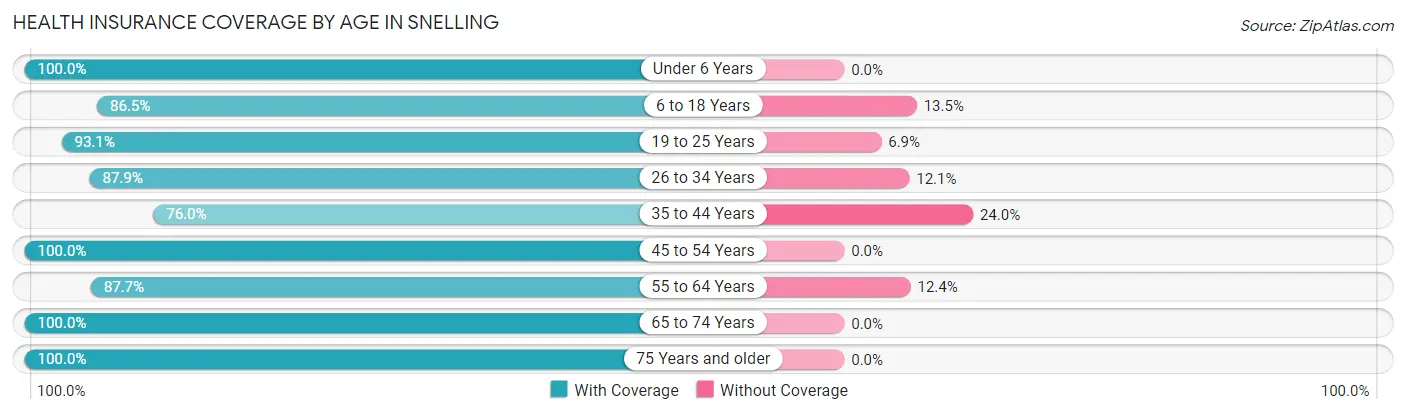
| Age Bracket | With Coverage | Without Coverage |
| Under 6 Years | 12 (100.0%) | 0 (0.0%) |
| 6 to 18 Years | 32 (86.5%) | 5 (13.5%) |
| 19 to 25 Years | 27 (93.1%) | 2 (6.9%) |
| 26 to 34 Years | 29 (87.9%) | 4 (12.1%) |
| 35 to 44 Years | 19 (76.0%) | 6 (24.0%) |
| 45 to 54 Years | 9 (100.0%) | 0 (0.0%) |
| 55 to 64 Years | 71 (87.6%) | 10 (12.3%) |
| 65 to 74 Years | 21 (100.0%) | 0 (0.0%) |
| 75 Years and older | 15 (100.0%) | 0 (0.0%) |
| Total | 235 (89.7%) | 27 (10.3%) |
Health Insurance Coverage by Citizenship Status in Snelling
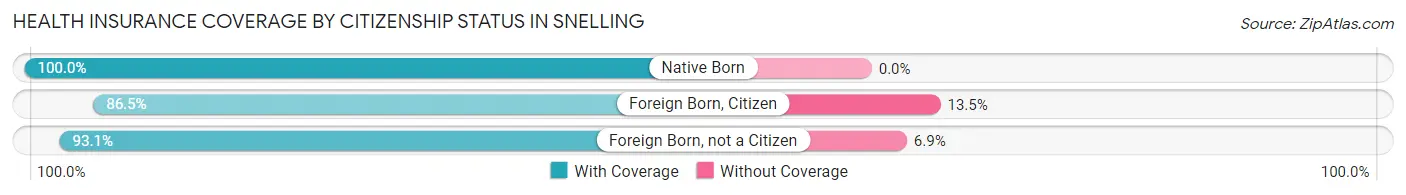
| Citizenship Status | With Coverage | Without Coverage |
| Native Born | 12 (100.0%) | 0 (0.0%) |
| Foreign Born, Citizen | 32 (86.5%) | 5 (13.5%) |
| Foreign Born, not a Citizen | 27 (93.1%) | 2 (6.9%) |
Health Insurance Coverage by Household Income in Snelling
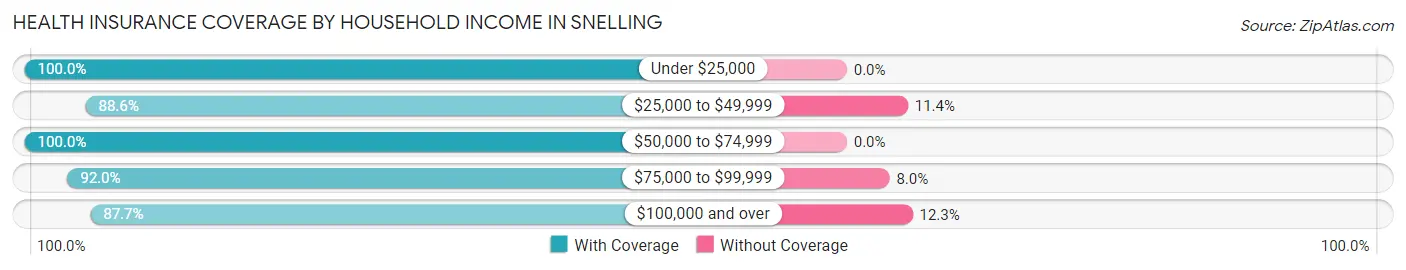
| Household Income | With Coverage | Without Coverage |
| Under $25,000 | 11 (100.0%) | 0 (0.0%) |
| $25,000 to $49,999 | 62 (88.6%) | 8 (11.4%) |
| $50,000 to $74,999 | 18 (100.0%) | 0 (0.0%) |
| $75,000 to $99,999 | 23 (92.0%) | 2 (8.0%) |
| $100,000 and over | 121 (87.7%) | 17 (12.3%) |
Public vs Private Health Insurance Coverage by Age in Snelling
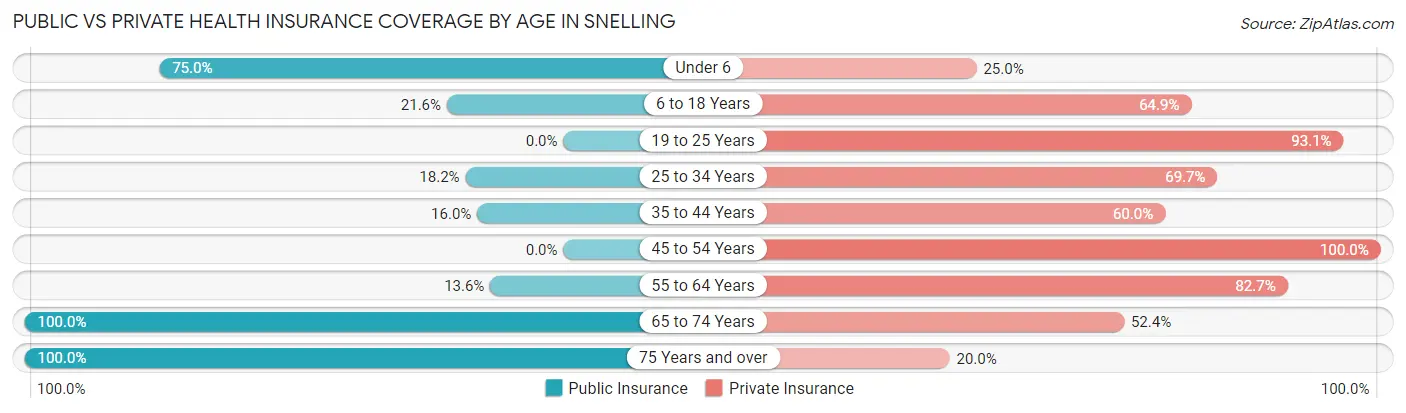
| Age Bracket | Public Insurance | Private Insurance |
| Under 6 | 9 (75.0%) | 3 (25.0%) |
| 6 to 18 Years | 8 (21.6%) | 24 (64.9%) |
| 19 to 25 Years | 0 (0.0%) | 27 (93.1%) |
| 25 to 34 Years | 6 (18.2%) | 23 (69.7%) |
| 35 to 44 Years | 4 (16.0%) | 15 (60.0%) |
| 45 to 54 Years | 0 (0.0%) | 9 (100.0%) |
| 55 to 64 Years | 11 (13.6%) | 67 (82.7%) |
| 65 to 74 Years | 21 (100.0%) | 11 (52.4%) |
| 75 Years and over | 15 (100.0%) | 3 (20.0%) |
| Total | 74 (28.2%) | 182 (69.5%) |
Disability Status by Sex by Age in Snelling
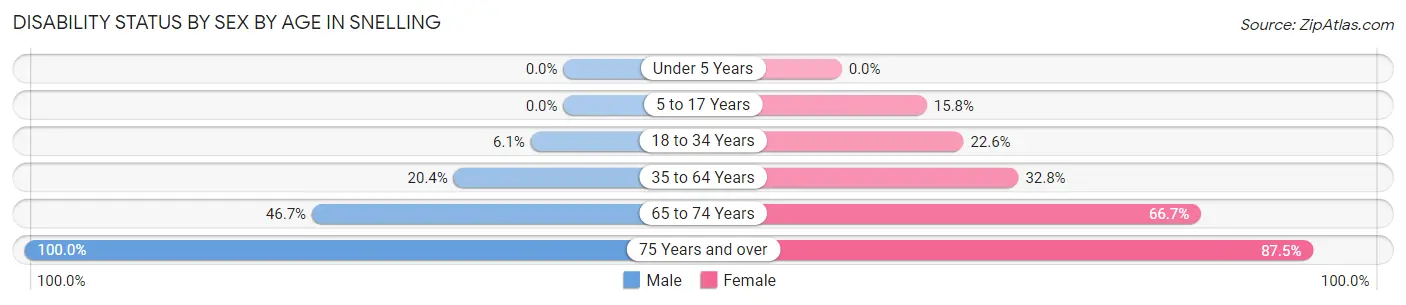
| Age Bracket | Male | Female |
| Under 5 Years | 0 (0.0%) | 0 (0.0%) |
| 5 to 17 Years | 0 (0.0%) | 3 (15.8%) |
| 18 to 34 Years | 2 (6.1%) | 7 (22.6%) |
| 35 to 64 Years | 11 (20.4%) | 20 (32.8%) |
| 65 to 74 Years | 7 (46.7%) | 4 (66.7%) |
| 75 Years and over | 7 (100.0%) | 7 (87.5%) |
Disability Class by Sex by Age in Snelling
Disability Class: Hearing Difficulty
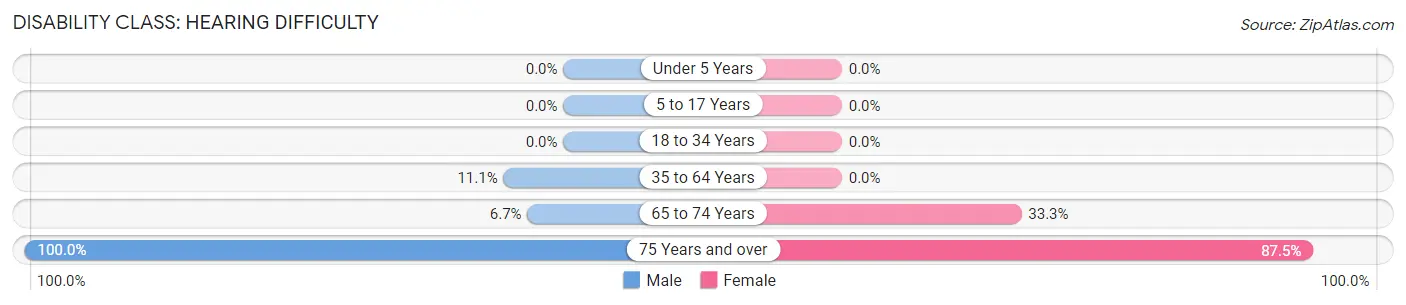
| Age Bracket | Male | Female |
| Under 5 Years | 0 (0.0%) | 0 (0.0%) |
| 5 to 17 Years | 0 (0.0%) | 0 (0.0%) |
| 18 to 34 Years | 0 (0.0%) | 0 (0.0%) |
| 35 to 64 Years | 6 (11.1%) | 0 (0.0%) |
| 65 to 74 Years | 1 (6.7%) | 2 (33.3%) |
| 75 Years and over | 7 (100.0%) | 7 (87.5%) |
Disability Class: Vision Difficulty
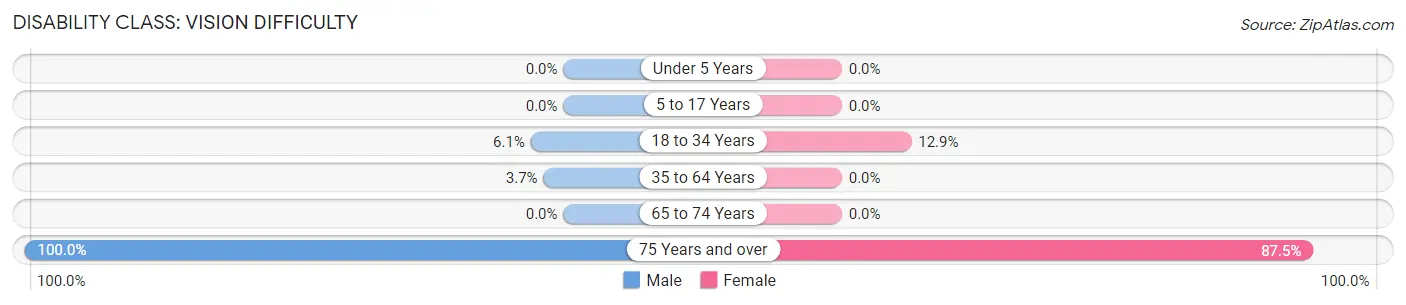
| Age Bracket | Male | Female |
| Under 5 Years | 0 (0.0%) | 0 (0.0%) |
| 5 to 17 Years | 0 (0.0%) | 0 (0.0%) |
| 18 to 34 Years | 2 (6.1%) | 4 (12.9%) |
| 35 to 64 Years | 2 (3.7%) | 0 (0.0%) |
| 65 to 74 Years | 0 (0.0%) | 0 (0.0%) |
| 75 Years and over | 7 (100.0%) | 7 (87.5%) |
Disability Class: Cognitive Difficulty
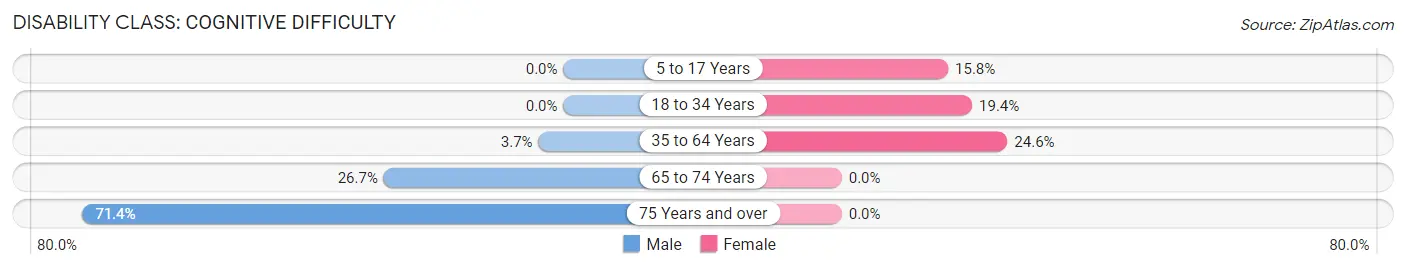
| Age Bracket | Male | Female |
| 5 to 17 Years | 0 (0.0%) | 3 (15.8%) |
| 18 to 34 Years | 0 (0.0%) | 6 (19.4%) |
| 35 to 64 Years | 2 (3.7%) | 15 (24.6%) |
| 65 to 74 Years | 4 (26.7%) | 0 (0.0%) |
| 75 Years and over | 5 (71.4%) | 0 (0.0%) |
Disability Class: Ambulatory Difficulty
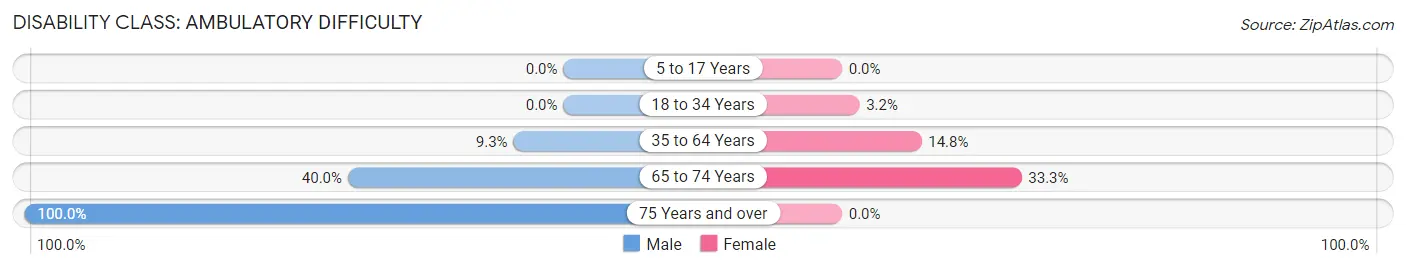
| Age Bracket | Male | Female |
| 5 to 17 Years | 0 (0.0%) | 0 (0.0%) |
| 18 to 34 Years | 0 (0.0%) | 1 (3.2%) |
| 35 to 64 Years | 5 (9.3%) | 9 (14.7%) |
| 65 to 74 Years | 6 (40.0%) | 2 (33.3%) |
| 75 Years and over | 7 (100.0%) | 0 (0.0%) |
Disability Class: Self-Care Difficulty
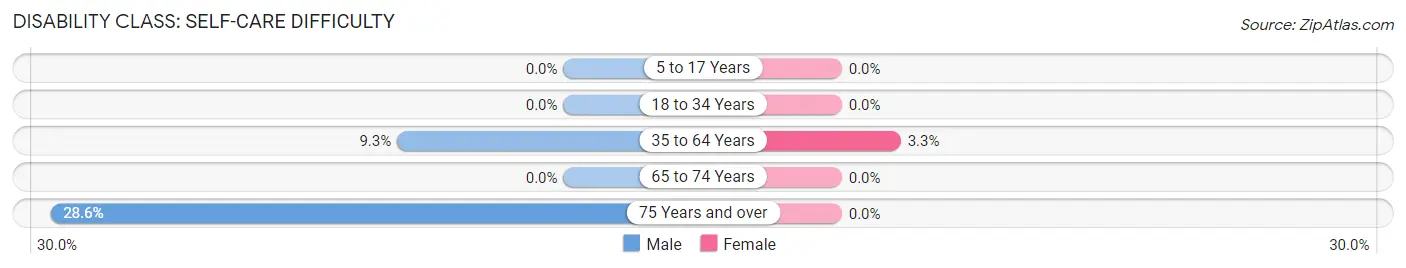
| Age Bracket | Male | Female |
| 5 to 17 Years | 0 (0.0%) | 0 (0.0%) |
| 18 to 34 Years | 0 (0.0%) | 0 (0.0%) |
| 35 to 64 Years | 5 (9.3%) | 2 (3.3%) |
| 65 to 74 Years | 0 (0.0%) | 0 (0.0%) |
| 75 Years and over | 2 (28.6%) | 0 (0.0%) |
Technology Access in Snelling
Computing Device Access in Snelling
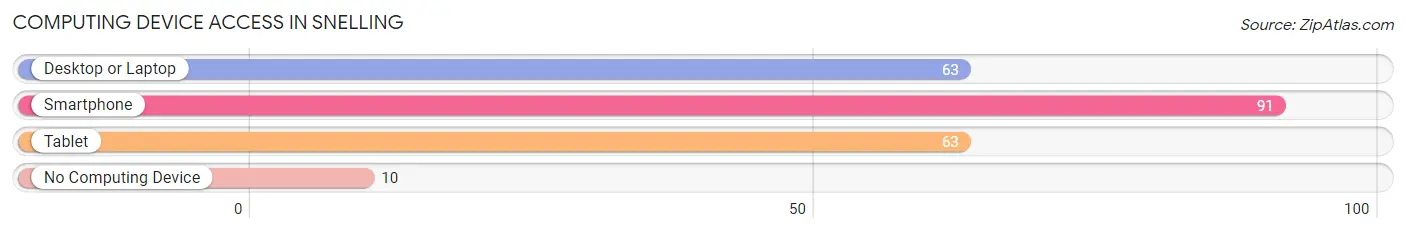
| Device Type | # Households | % Households |
| Desktop or Laptop | 63 | 62.4% |
| Smartphone | 91 | 90.1% |
| Tablet | 63 | 62.4% |
| No Computing Device | 10 | 9.9% |
| Total | 101 | 100.0% |
Internet Access in Snelling
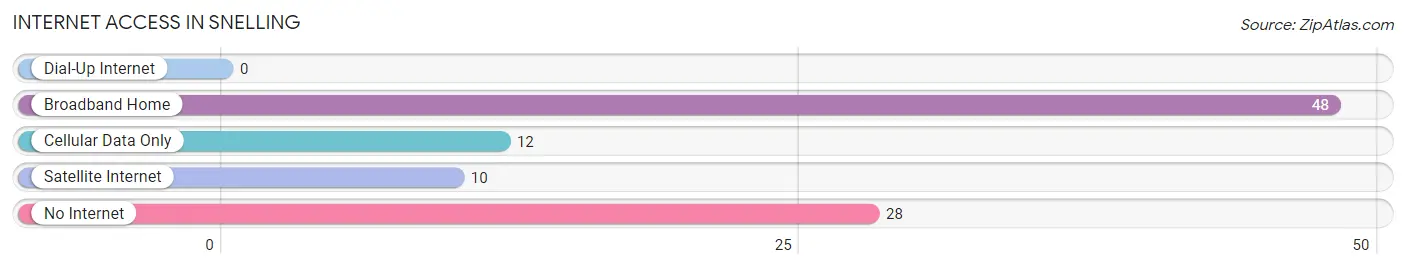
| Internet Type | # Households | % Households |
| Dial-Up Internet | 0 | 0.0% |
| Broadband Home | 48 | 47.5% |
| Cellular Data Only | 12 | 11.9% |
| Satellite Internet | 10 | 9.9% |
| No Internet | 28 | 27.7% |
| Total | 101 | 100.0% |
Snelling Summary
Snelling, South Carolina is a small town located in the Midlands region of the state. It is situated in the northern part of Sumter County, about 25 miles from the state capital of Columbia. The town has a population of just over 1,000 people, and is known for its rural charm and friendly atmosphere.
Snelling was founded in 1820 by a group of settlers from North Carolina. The town was named after a local creek, which was named after a Revolutionary War hero, Colonel William Snelling. The town was originally a farming community, and the main crops grown were cotton, corn, and tobacco. In the late 19th century, the town began to grow and develop, and by the early 20th century, it had become a thriving commercial center.
Geographically, Snelling is located in the Piedmont region of South Carolina. The town is situated on the banks of the Wateree River, and is surrounded by rolling hills and forests. The climate in Snelling is mild, with hot summers and cool winters.
The economy of Snelling is largely based on agriculture. The town is home to several farms, which produce a variety of crops, including cotton, corn, soybeans, and tobacco. In addition, the town is home to several small businesses, including a grocery store, a hardware store, and a few restaurants.
The demographics of Snelling are largely rural. The town is predominantly white, with a small African American population. The median household income in Snelling is slightly below the state average, and the poverty rate is slightly higher than the state average.
Snelling is a small town with a big heart. It is a place where people come together to celebrate the town’s history and culture. The town is home to several festivals and events throughout the year, including the annual Snelling Days Festival, which celebrates the town’s history and culture. The town also hosts a variety of other events, such as the Snelling Music Festival, which features local and regional musicians.
Snelling is a great place to live and work. It is a small town with a big heart, and its friendly atmosphere and rural charm make it a great place to call home.
Common Questions
What is Per Capita Income in Snelling?
Per Capita income in Snelling is $32,324.
What is the Median Family Income in Snelling?
Median Family Income in Snelling is $78,333.
What is the Median Household income in Snelling?
Median Household Income in Snelling is $56,607.
What is Income or Wage Gap in Snelling?
Income or Wage Gap in Snelling is 21.0%.
Women in Snelling earn 79.0 cents for every dollar earned by a man.
What is Inequality or Gini Index in Snelling?
Inequality or Gini Index in Snelling is 0.38.
What is the Total Population of Snelling?
Total Population of Snelling is 262.
What is the Total Male Population of Snelling?
Total Male Population of Snelling is 137.
What is the Total Female Population of Snelling?
Total Female Population of Snelling is 125.
What is the Ratio of Males per 100 Females in Snelling?
There are 109.60 Males per 100 Females in Snelling.
What is the Ratio of Females per 100 Males in Snelling?
There are 91.24 Females per 100 Males in Snelling.
What is the Median Population Age in Snelling?
Median Population Age in Snelling is 43.3 Years.
What is the Average Family Size in Snelling
Average Family Size in Snelling is 2.9 People.
What is the Average Household Size in Snelling
Average Household Size in Snelling is 2.6 People.
How Large is the Labor Force in Snelling?
There are 135 People in the Labor Forcein in Snelling.
What is the Percentage of People in the Labor Force in Snelling?
59.0% of People are in the Labor Force in Snelling.
What is the Unemployment Rate in Snelling?
Unemployment Rate in Snelling is 1.5%.