Zip Codes with the Highest Percentage of Population Employed in Life, Physical & Social Science in Darlington, SC
RELATED REPORTS & OPTIONS
Life, Physical & Social Science
Darlington
Compare Zip Codes
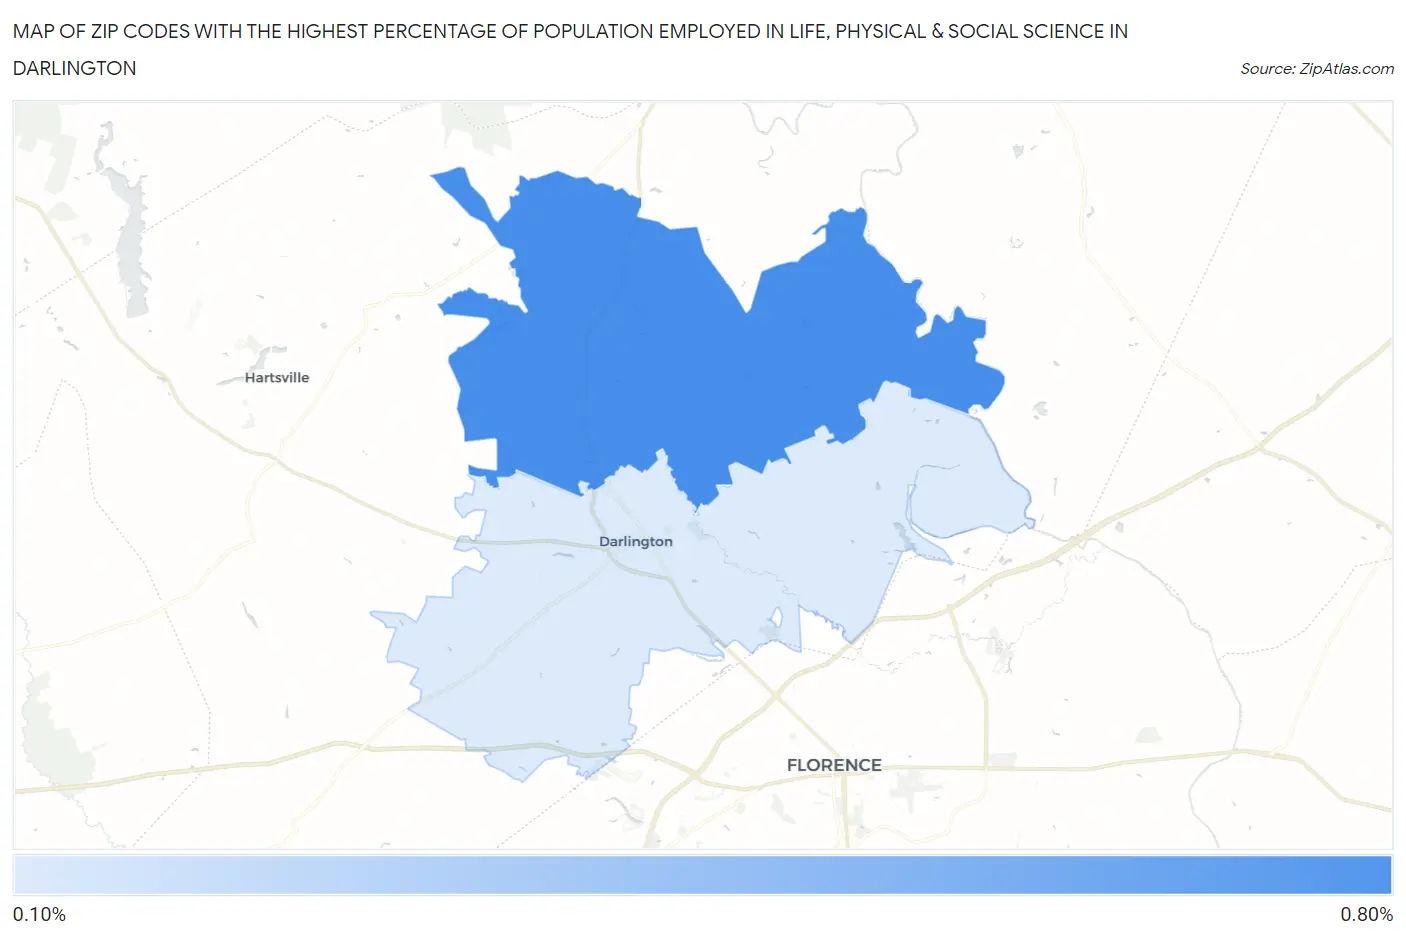
Map of Zip Codes with the Highest Percentage of Population Employed in Life, Physical & Social Science in Darlington
0.17%
0.62%
Zip Codes with the Highest Percentage of Population Employed in Life, Physical & Social Science in Darlington, SC
| Zip Code | % Employed | vs State | vs National | |
| 1. | 29540 | 0.62% | 0.73%(-0.103)#129 | 1.1%(-0.468)#13,003 |
| 2. | 29532 | 0.17% | 0.73%(-0.560)#228 | 1.1%(-0.924)#18,531 |
1
Common Questions
What are the Top Zip Codes with the Highest Percentage of Population Employed in Life, Physical & Social Science in Darlington, SC?
Top Zip Codes with the Highest Percentage of Population Employed in Life, Physical & Social Science in Darlington, SC are:
What zip code has the Highest Percentage of Population Employed in Life, Physical & Social Science in Darlington, SC?
29540 has the Highest Percentage of Population Employed in Life, Physical & Social Science in Darlington, SC with 0.62%.
What is the Percentage of Population Employed in Life, Physical & Social Science in Darlington, SC?
Percentage of Population Employed in Life, Physical & Social Science in Darlington is 0.51%.
What is the Percentage of Population Employed in Life, Physical & Social Science in South Carolina?
Percentage of Population Employed in Life, Physical & Social Science in South Carolina is 0.73%.
What is the Percentage of Population Employed in Life, Physical & Social Science in the United States?
Percentage of Population Employed in Life, Physical & Social Science in the United States is 1.1%.