Surfside Beach, SC Map & Demographics
Surfside Beach Map
Surfside Beach Overview
$38,687
PER CAPITA INCOME
$81,612
AVG FAMILY INCOME
$69,375
AVG HOUSEHOLD INCOME
15.6%
WAGE / INCOME GAP [ % ]
84.4¢/ $1
WAGE / INCOME GAP [ $ ]
0.38
INEQUALITY / GINI INDEX
4,179
TOTAL POPULATION
2,218
MALE POPULATION
1,961
FEMALE POPULATION
113.11
MALES / 100 FEMALES
88.41
FEMALES / 100 MALES
53.6
MEDIAN AGE
2.7
AVG FAMILY SIZE
2.2
AVG HOUSEHOLD SIZE
1,833
LABOR FORCE [ PEOPLE ]
48.9%
PERCENT IN LABOR FORCE
8.3%
UNEMPLOYMENT RATE
Surfside Beach Area Codes
Income in Surfside Beach
Income Overview in Surfside Beach
Per Capita Income in Surfside Beach is $38,687, while median incomes of families and households are $81,612 and $69,375 respectively.
| Characteristic | Number | Measure |
| Per Capita Income | 4,179 | $38,687 |
| Median Family Income | 1,193 | $81,612 |
| Mean Family Income | 1,193 | $87,156 |
| Median Household Income | 1,922 | $69,375 |
| Mean Household Income | 1,922 | $80,666 |
| Income Deficit | 1,193 | $0 |
| Wage / Income Gap (%) | 4,179 | 15.60% |
| Wage / Income Gap ($) | 4,179 | 84.40¢ per $1 |
| Gini / Inequality Index | 4,179 | 0.38 |
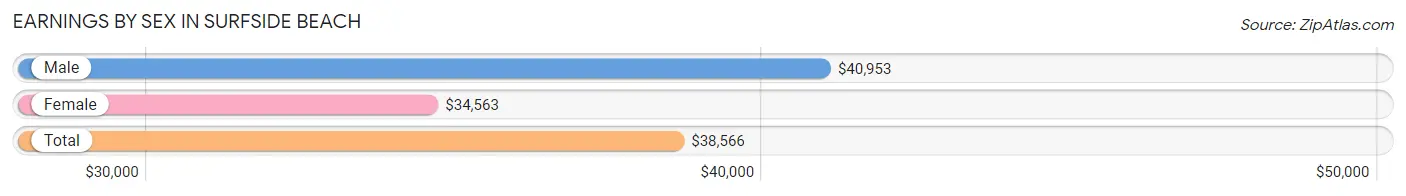
Earnings by Sex in Surfside Beach
Average Earnings in Surfside Beach are $38,566, $40,953 for men and $34,563 for women, a difference of 15.6%.
| Sex | Number | Average Earnings |
| Male | 1,013 (49.5%) | $40,953 |
| Female | 1,032 (50.5%) | $34,563 |
| Total | 2,045 (100.0%) | $38,566 |
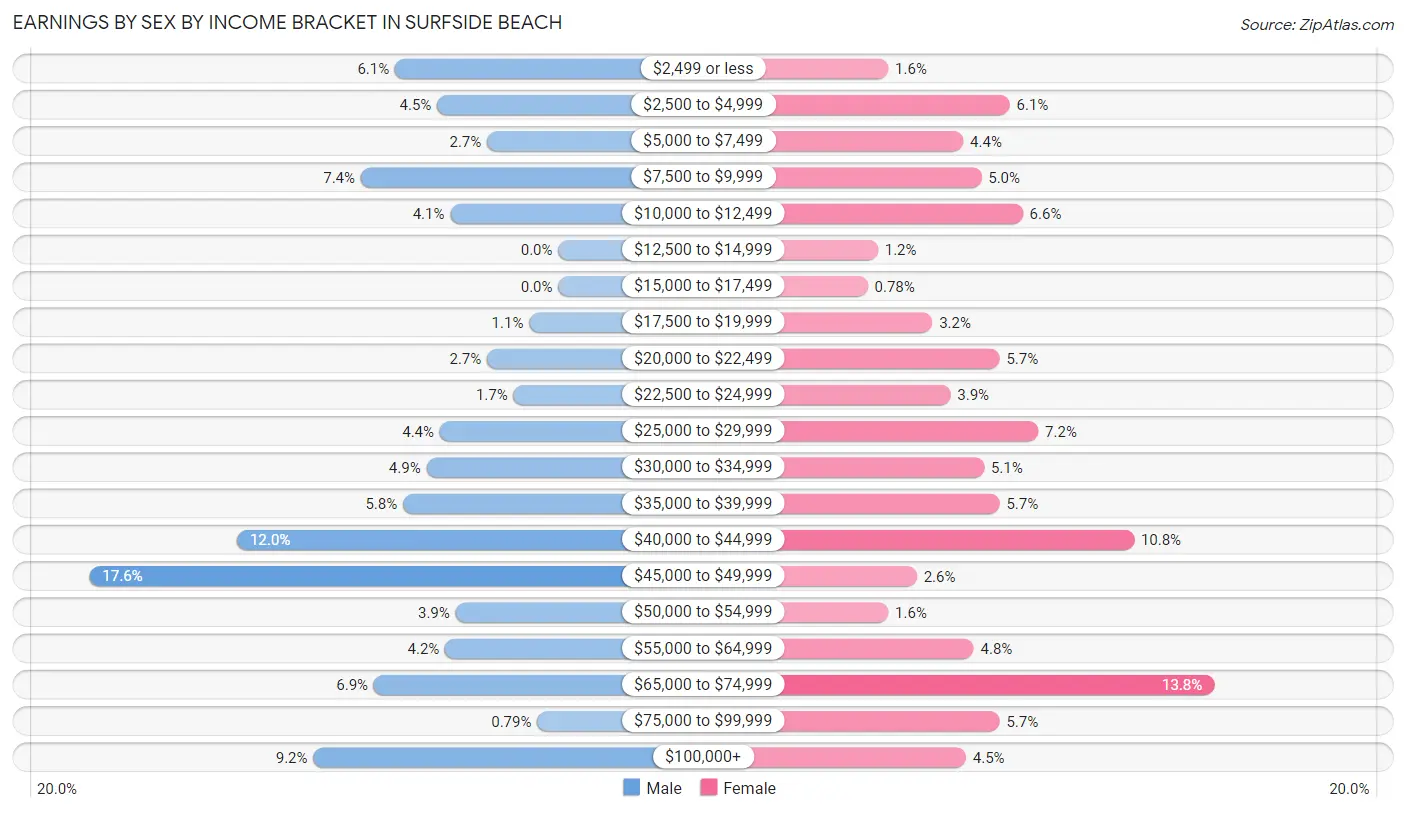
Earnings by Sex by Income Bracket in Surfside Beach
The most common earnings brackets in Surfside Beach are $45,000 to $49,999 for men (178 | 17.6%) and $65,000 to $74,999 for women (142 | 13.8%).
| Income | Male | Female |
| $2,499 or less | 62 (6.1%) | 16 (1.5%) |
| $2,500 to $4,999 | 46 (4.5%) | 63 (6.1%) |
| $5,000 to $7,499 | 27 (2.7%) | 45 (4.4%) |
| $7,500 to $9,999 | 75 (7.4%) | 52 (5.0%) |
| $10,000 to $12,499 | 41 (4.1%) | 68 (6.6%) |
| $12,500 to $14,999 | 0 (0.0%) | 12 (1.2%) |
| $15,000 to $17,499 | 0 (0.0%) | 8 (0.8%) |
| $17,500 to $19,999 | 11 (1.1%) | 33 (3.2%) |
| $20,000 to $22,499 | 27 (2.7%) | 59 (5.7%) |
| $22,500 to $24,999 | 17 (1.7%) | 40 (3.9%) |
| $25,000 to $29,999 | 45 (4.4%) | 74 (7.2%) |
| $30,000 to $34,999 | 50 (4.9%) | 53 (5.1%) |
| $35,000 to $39,999 | 59 (5.8%) | 59 (5.7%) |
| $40,000 to $44,999 | 122 (12.0%) | 111 (10.8%) |
| $45,000 to $49,999 | 178 (17.6%) | 27 (2.6%) |
| $50,000 to $54,999 | 39 (3.8%) | 16 (1.5%) |
| $55,000 to $64,999 | 43 (4.2%) | 49 (4.8%) |
| $65,000 to $74,999 | 70 (6.9%) | 142 (13.8%) |
| $75,000 to $99,999 | 8 (0.8%) | 59 (5.7%) |
| $100,000+ | 93 (9.2%) | 46 (4.5%) |
| Total | 1,013 (100.0%) | 1,032 (100.0%) |
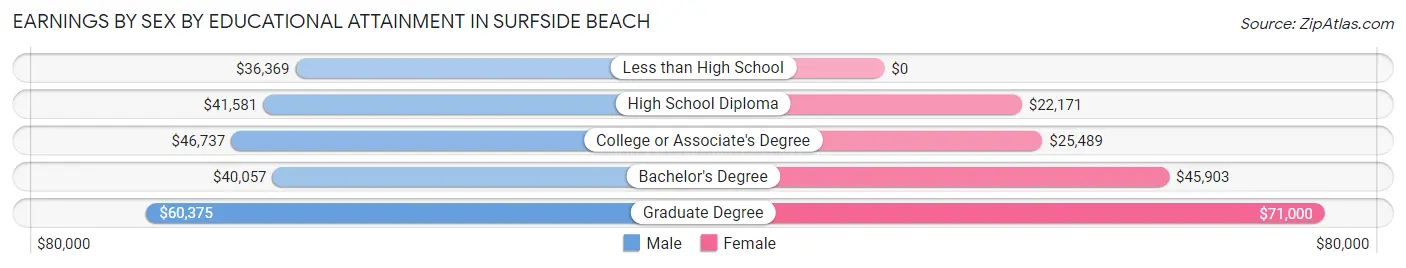
Earnings by Sex by Educational Attainment in Surfside Beach
Average earnings in Surfside Beach are $42,131 for men and $39,350 for women, a difference of 6.6%. Men with an educational attainment of graduate degree enjoy the highest average annual earnings of $60,375, while those with less than high school education earn the least with $36,369. Women with an educational attainment of graduate degree earn the most with the average annual earnings of $71,000, while those with high school diploma education have the smallest earnings of $22,171.
| Educational Attainment | Male Income | Female Income |
| Less than High School | $36,369 | $0 |
| High School Diploma | $41,581 | $22,171 |
| College or Associate's Degree | $46,737 | $25,489 |
| Bachelor's Degree | $40,057 | $45,903 |
| Graduate Degree | $60,375 | $71,000 |
| Total | $42,131 | $39,350 |
Family Income in Surfside Beach
Family Income Brackets in Surfside Beach
According to the Surfside Beach family income data, there are 268 families falling into the $75,000 to $99,999 income range, which is the most common income bracket and makes up 22.5% of all families. Conversely, the $15,000 to $24,999 income bracket is the least frequent group with only 19 families (1.6%) belonging to this category.
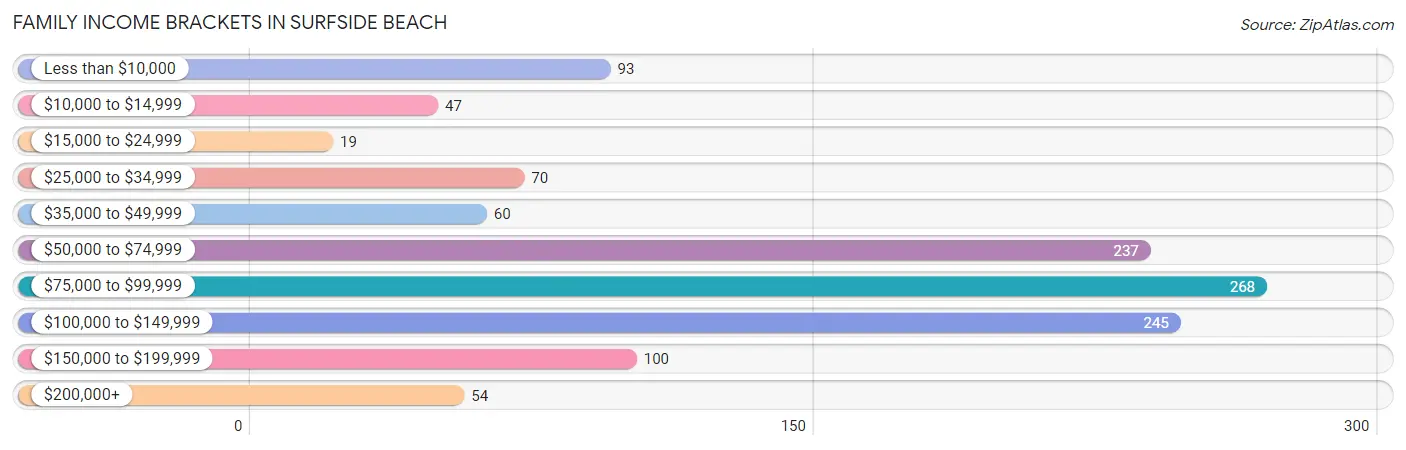
| Income Bracket | # Families | % Families |
| Less than $10,000 | 93 | 7.8% |
| $10,000 to $14,999 | 47 | 3.9% |
| $15,000 to $24,999 | 19 | 1.6% |
| $25,000 to $34,999 | 70 | 5.9% |
| $35,000 to $49,999 | 60 | 5.0% |
| $50,000 to $74,999 | 237 | 19.9% |
| $75,000 to $99,999 | 268 | 22.5% |
| $100,000 to $149,999 | 245 | 20.5% |
| $150,000 to $199,999 | 100 | 8.4% |
| $200,000+ | 54 | 4.5% |
Family Income by Famaliy Size in Surfside Beach
5-person families (88 | 7.4%) account for the highest median family income in Surfside Beach with $104,013 per family, while 2-person families (852 | 71.4%) have the highest median income of $39,420 per family member.
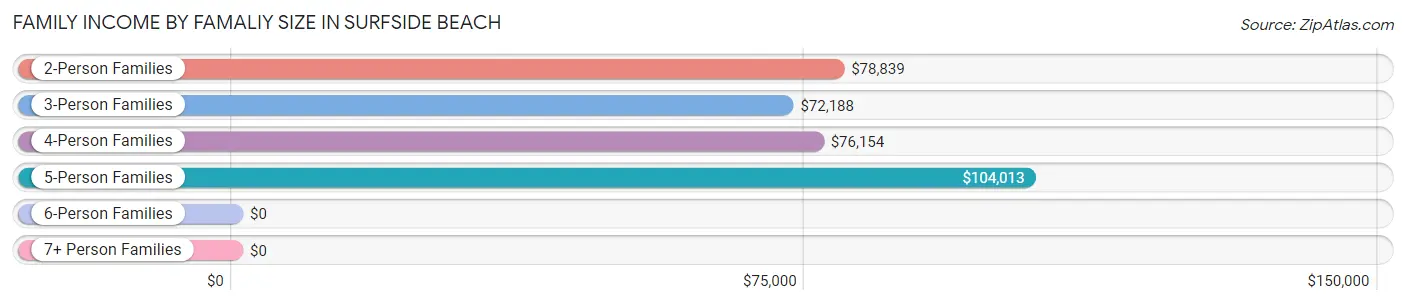
| Income Bracket | # Families | Median Income |
| 2-Person Families | 852 (71.4%) | $78,839 |
| 3-Person Families | 172 (14.4%) | $72,188 |
| 4-Person Families | 74 (6.2%) | $76,154 |
| 5-Person Families | 88 (7.4%) | $104,013 |
| 6-Person Families | 7 (0.6%) | $0 |
| 7+ Person Families | 0 (0.0%) | $0 |
| Total | 1,193 (100.0%) | $81,612 |
Family Income by Number of Earners in Surfside Beach
The median family income in Surfside Beach is $81,612, with families comprising 3+ earners (47) having the highest median family income of $134,125, while families with no earners (322) have the lowest median family income of $62,407, accounting for 3.9% and 27.0% of families, respectively.
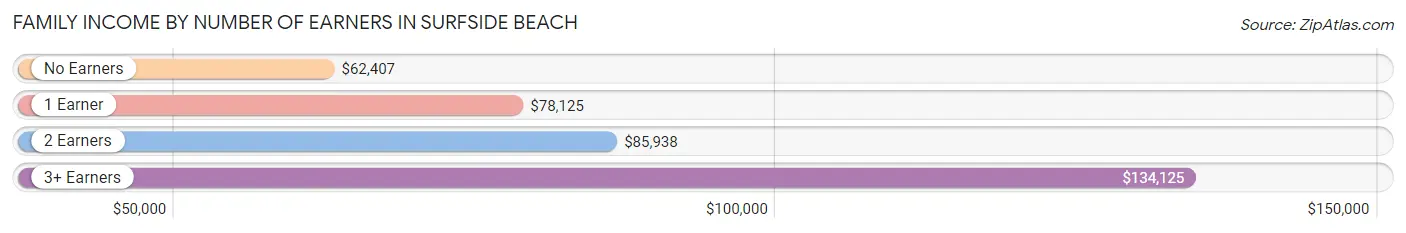
| Number of Earners | # Families | Median Income |
| No Earners | 322 (27.0%) | $62,407 |
| 1 Earner | 473 (39.7%) | $78,125 |
| 2 Earners | 351 (29.4%) | $85,938 |
| 3+ Earners | 47 (3.9%) | $134,125 |
| Total | 1,193 (100.0%) | $81,612 |
Household Income in Surfside Beach
Household Income Brackets in Surfside Beach
With 444 households falling in the category, the $50,000 to $74,999 income range is the most frequent in Surfside Beach, accounting for 23.1% of all households. In contrast, only 63 households (3.3%) fall into the $10,000 to $14,999 income bracket, making it the least populous group.
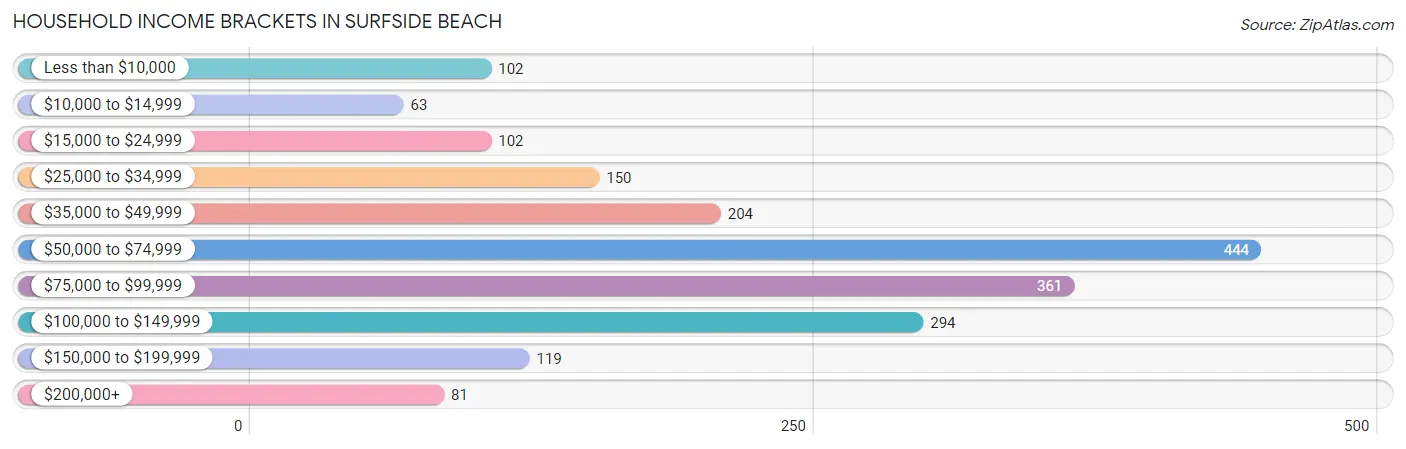
| Income Bracket | # Households | % Households |
| Less than $10,000 | 102 | 5.3% |
| $10,000 to $14,999 | 63 | 3.3% |
| $15,000 to $24,999 | 102 | 5.3% |
| $25,000 to $34,999 | 150 | 7.8% |
| $35,000 to $49,999 | 204 | 10.6% |
| $50,000 to $74,999 | 444 | 23.1% |
| $75,000 to $99,999 | 361 | 18.8% |
| $100,000 to $149,999 | 294 | 15.3% |
| $150,000 to $199,999 | 119 | 6.2% |
| $200,000+ | 81 | 4.2% |
Household Income by Householder Age in Surfside Beach
The median household income in Surfside Beach is $69,375, with the highest median household income of $75,958 found in the 15 to 24 years age bracket for the primary householder. A total of 47 households (2.5%) fall into this category. Meanwhile, the 25 to 44 years age bracket for the primary householder has the lowest median household income of $50,769, with 382 households (19.9%) in this group.
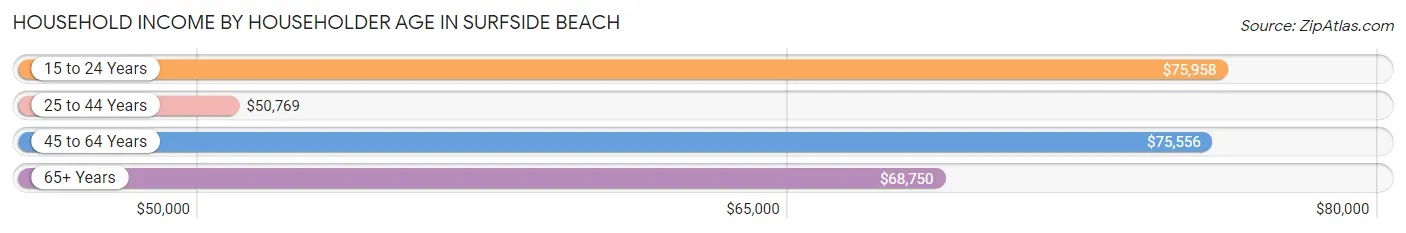
| Income Bracket | # Households | Median Income |
| 15 to 24 Years | 47 (2.5%) | $75,958 |
| 25 to 44 Years | 382 (19.9%) | $50,769 |
| 45 to 64 Years | 740 (38.5%) | $75,556 |
| 65+ Years | 753 (39.2%) | $68,750 |
| Total | 1,922 (100.0%) | $69,375 |
Poverty in Surfside Beach
Income Below Poverty by Sex and Age in Surfside Beach
With 10.4% poverty level for males and 10.8% for females among the residents of Surfside Beach, under 5 year old males and 25 to 34 year old females are the most vulnerable to poverty, with 119 males (54.3%) and 80 females (51.6%) in their respective age groups living below the poverty level.
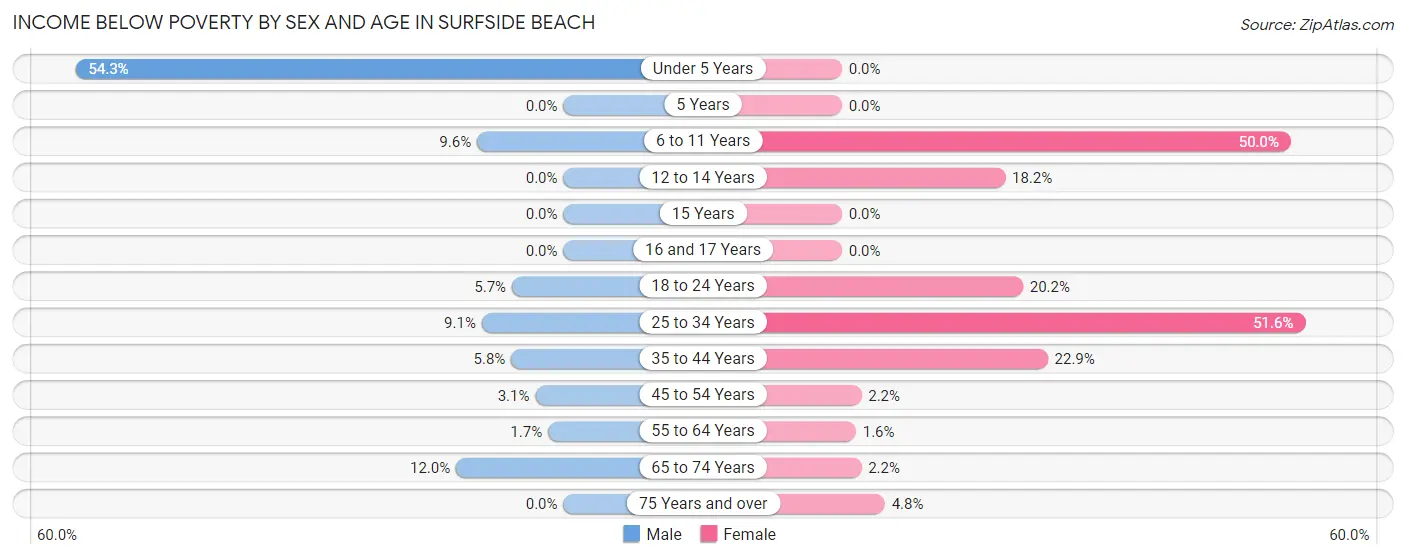
| Age Bracket | Male | Female |
| Under 5 Years | 119 (54.3%) | 0 (0.0%) |
| 5 Years | 0 (0.0%) | 0 (0.0%) |
| 6 to 11 Years | 5 (9.6%) | 10 (50.0%) |
| 12 to 14 Years | 0 (0.0%) | 10 (18.2%) |
| 15 Years | 0 (0.0%) | 0 (0.0%) |
| 16 and 17 Years | 0 (0.0%) | 0 (0.0%) |
| 18 to 24 Years | 9 (5.7%) | 25 (20.2%) |
| 25 to 34 Years | 23 (9.1%) | 80 (51.6%) |
| 35 to 44 Years | 9 (5.8%) | 55 (22.9%) |
| 45 to 54 Years | 9 (3.1%) | 6 (2.2%) |
| 55 to 64 Years | 7 (1.7%) | 7 (1.6%) |
| 65 to 74 Years | 49 (11.9%) | 7 (2.2%) |
| 75 Years and over | 0 (0.0%) | 12 (4.8%) |
| Total | 230 (10.4%) | 212 (10.8%) |
Income Above Poverty by Sex and Age in Surfside Beach
According to the poverty statistics in Surfside Beach, males aged 15 years and females aged under 5 years are the age groups that are most secure financially, with 100.0% of males and 100.0% of females in these age groups living above the poverty line.
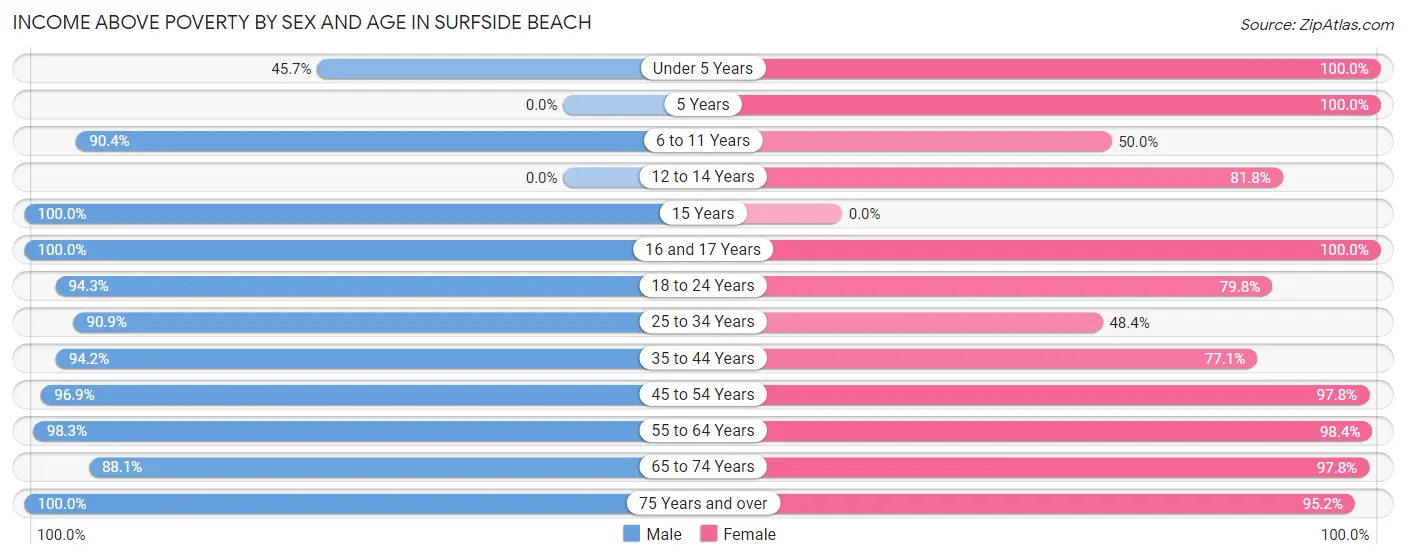
| Age Bracket | Male | Female |
| Under 5 Years | 100 (45.7%) | 21 (100.0%) |
| 5 Years | 0 (0.0%) | 16 (100.0%) |
| 6 to 11 Years | 47 (90.4%) | 10 (50.0%) |
| 12 to 14 Years | 0 (0.0%) | 45 (81.8%) |
| 15 Years | 47 (100.0%) | 0 (0.0%) |
| 16 and 17 Years | 32 (100.0%) | 30 (100.0%) |
| 18 to 24 Years | 148 (94.3%) | 99 (79.8%) |
| 25 to 34 Years | 230 (90.9%) | 75 (48.4%) |
| 35 to 44 Years | 146 (94.2%) | 185 (77.1%) |
| 45 to 54 Years | 279 (96.9%) | 271 (97.8%) |
| 55 to 64 Years | 403 (98.3%) | 441 (98.4%) |
| 65 to 74 Years | 361 (88.0%) | 317 (97.8%) |
| 75 Years and over | 195 (100.0%) | 239 (95.2%) |
| Total | 1,988 (89.6%) | 1,749 (89.2%) |
Income Below Poverty Among Married-Couple Families in Surfside Beach
The poverty statistics for married-couple families in Surfside Beach show that 1.5% or 14 of the total 965 families live below the poverty line. Families with no children have the highest poverty rate of 1.8%, comprising of 14 families. On the other hand, families with 1 or 2 children have the lowest poverty rate of 0.0%, which includes 0 families.
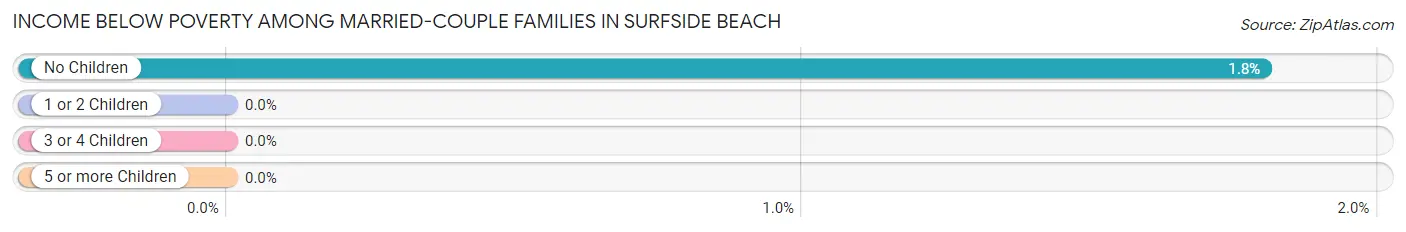
| Children | Above Poverty | Below Poverty |
| No Children | 764 (98.2%) | 14 (1.8%) |
| 1 or 2 Children | 121 (100.0%) | 0 (0.0%) |
| 3 or 4 Children | 66 (100.0%) | 0 (0.0%) |
| 5 or more Children | 0 (0.0%) | 0 (0.0%) |
| Total | 951 (98.6%) | 14 (1.5%) |
Income Below Poverty Among Single-Parent Households in Surfside Beach
According to the poverty data in Surfside Beach, 25.0% or 3 single-father households and 56.5% or 122 single-mother households are living below the poverty line. Among single-father households, those with no children have the highest poverty rate, with 3 households (25.0%) experiencing poverty. Likewise, among single-mother households, those with 1 or 2 children have the highest poverty rate, with 122 households (73.9%) falling below the poverty line.
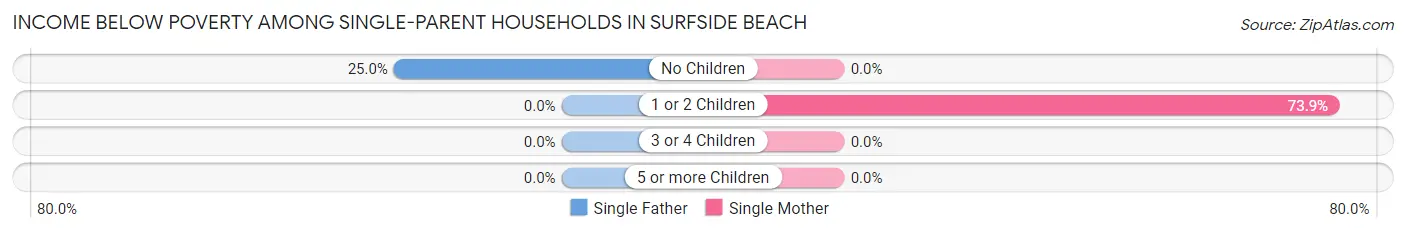
| Children | Single Father | Single Mother |
| No Children | 3 (25.0%) | 0 (0.0%) |
| 1 or 2 Children | 0 (0.0%) | 122 (73.9%) |
| 3 or 4 Children | 0 (0.0%) | 0 (0.0%) |
| 5 or more Children | 0 (0.0%) | 0 (0.0%) |
| Total | 3 (25.0%) | 122 (56.5%) |
Income Below Poverty Among Married-Couple vs Single-Parent Households in Surfside Beach
The poverty data for Surfside Beach shows that 14 of the married-couple family households (1.5%) and 125 of the single-parent households (54.8%) are living below the poverty level. Within the married-couple family households, those with no children have the highest poverty rate, with 14 households (1.8%) falling below the poverty line. Among the single-parent households, those with 1 or 2 children have the highest poverty rate, with 122 household (73.9%) living below poverty.
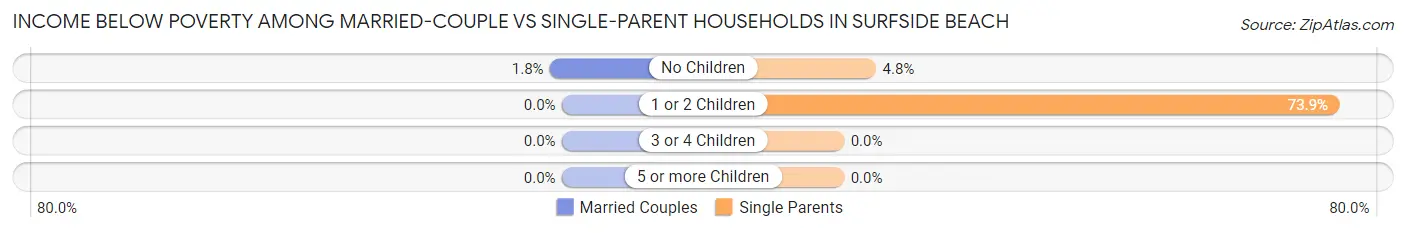
| Children | Married-Couple Families | Single-Parent Households |
| No Children | 14 (1.8%) | 3 (4.8%) |
| 1 or 2 Children | 0 (0.0%) | 122 (73.9%) |
| 3 or 4 Children | 0 (0.0%) | 0 (0.0%) |
| 5 or more Children | 0 (0.0%) | 0 (0.0%) |
| Total | 14 (1.5%) | 125 (54.8%) |
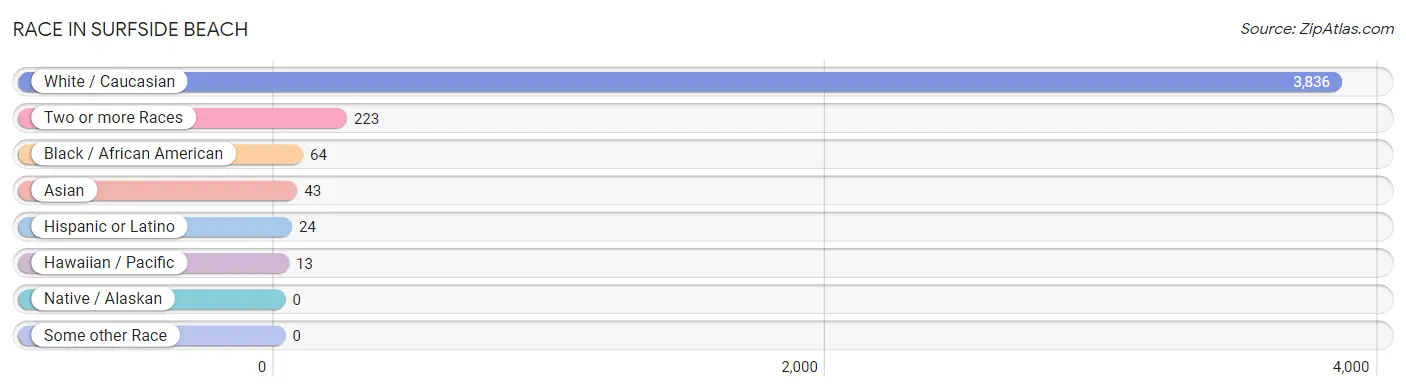
Race in Surfside Beach
The most populous races in Surfside Beach are White / Caucasian (3,836 | 91.8%), Two or more Races (223 | 5.3%), and Black / African American (64 | 1.5%).
| Race | # Population | % Population |
| Asian | 43 | 1.0% |
| Black / African American | 64 | 1.5% |
| Hawaiian / Pacific | 13 | 0.3% |
| Hispanic or Latino | 24 | 0.6% |
| Native / Alaskan | 0 | 0.0% |
| White / Caucasian | 3,836 | 91.8% |
| Two or more Races | 223 | 5.3% |
| Some other Race | 0 | 0.0% |
| Total | 4,179 | 100.0% |
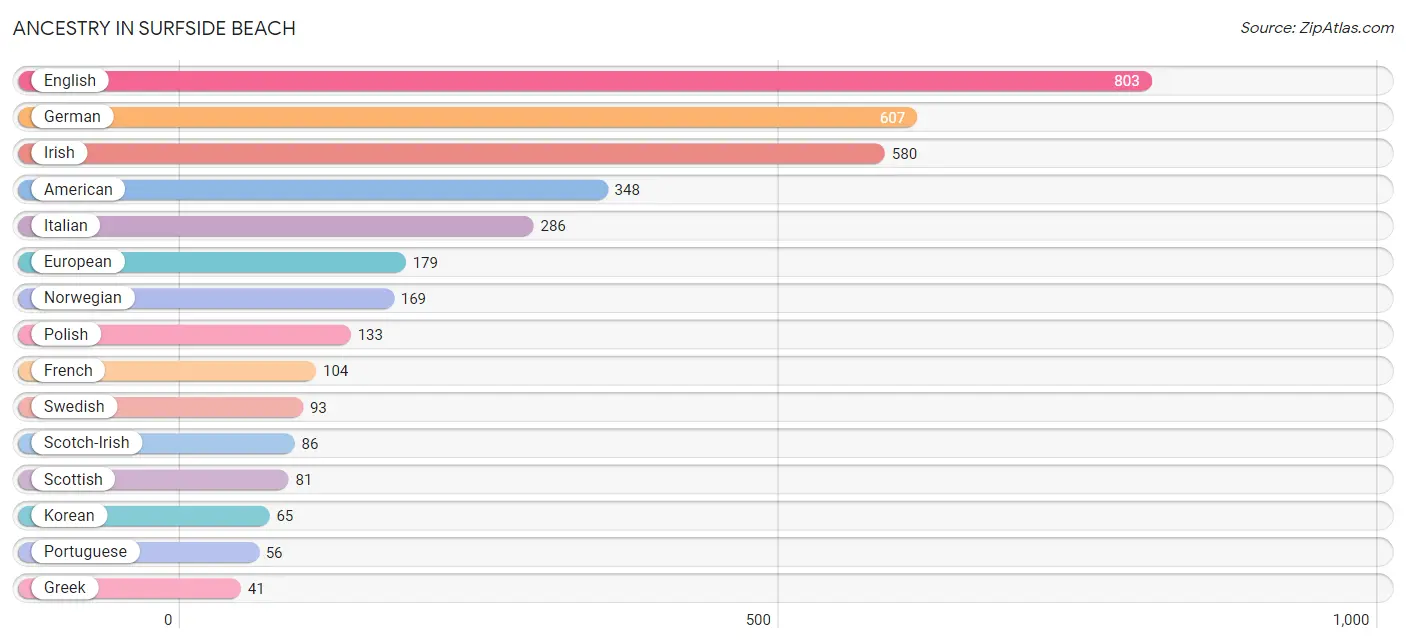
Ancestry in Surfside Beach
The most populous ancestries reported in Surfside Beach are English (803 | 19.2%), German (607 | 14.5%), Irish (580 | 13.9%), American (348 | 8.3%), and Italian (286 | 6.8%), together accounting for 62.8% of all Surfside Beach residents.
| Ancestry | # Population | % Population |
| American | 348 | 8.3% |
| Arab | 6 | 0.1% |
| Austrian | 12 | 0.3% |
| Bhutanese | 22 | 0.5% |
| British | 24 | 0.6% |
| Burmese | 17 | 0.4% |
| Canadian | 8 | 0.2% |
| Central American | 18 | 0.4% |
| Cherokee | 14 | 0.3% |
| Croatian | 6 | 0.1% |
| Danish | 28 | 0.7% |
| Dutch | 17 | 0.4% |
| English | 803 | 19.2% |
| European | 179 | 4.3% |
| Finnish | 17 | 0.4% |
| French | 104 | 2.5% |
| French Canadian | 25 | 0.6% |
| German | 607 | 14.5% |
| Greek | 41 | 1.0% |
| Guamanian / Chamorro | 27 | 0.6% |
| Irish | 580 | 13.9% |
| Italian | 286 | 6.8% |
| Korean | 65 | 1.6% |
| Lithuanian | 11 | 0.3% |
| Norwegian | 169 | 4.0% |
| Pennsylvania German | 28 | 0.7% |
| Polish | 133 | 3.2% |
| Portuguese | 56 | 1.3% |
| Russian | 38 | 0.9% |
| Salvadoran | 18 | 0.4% |
| Scandinavian | 23 | 0.5% |
| Scotch-Irish | 86 | 2.1% |
| Scottish | 81 | 1.9% |
| Slovak | 34 | 0.8% |
| Slovene | 6 | 0.1% |
| South African | 8 | 0.2% |
| Spaniard | 6 | 0.1% |
| Subsaharan African | 8 | 0.2% |
| Swedish | 93 | 2.2% |
| Ukrainian | 5 | 0.1% |
| Welsh | 29 | 0.7% | View All 41 Rows |
Immigrants in Surfside Beach
The most numerous immigrant groups reported in Surfside Beach came from Europe (36 | 0.9%), Asia (25 | 0.6%), Eastern Asia (25 | 0.6%), Central America (18 | 0.4%), and Eastern Europe (18 | 0.4%), together accounting for 2.9% of all Surfside Beach residents.

| Immigration Origin | # Population | % Population |
| Africa | 8 | 0.2% |
| Asia | 25 | 0.6% |
| Canada | 8 | 0.2% |
| Central America | 18 | 0.4% |
| Eastern Asia | 25 | 0.6% |
| Eastern Europe | 18 | 0.4% |
| El Salvador | 18 | 0.4% |
| Europe | 36 | 0.9% |
| Germany | 18 | 0.4% |
| Japan | 8 | 0.2% |
| Korea | 17 | 0.4% |
| Latin America | 18 | 0.4% |
| Russia | 18 | 0.4% |
| South Africa | 8 | 0.2% |
| Western Europe | 18 | 0.4% | View All 15 Rows |
Sex and Age in Surfside Beach
Sex and Age in Surfside Beach
The most populous age groups in Surfside Beach are 60 to 64 Years (237 | 10.7%) for men and 60 to 64 Years (257 | 13.1%) for women.
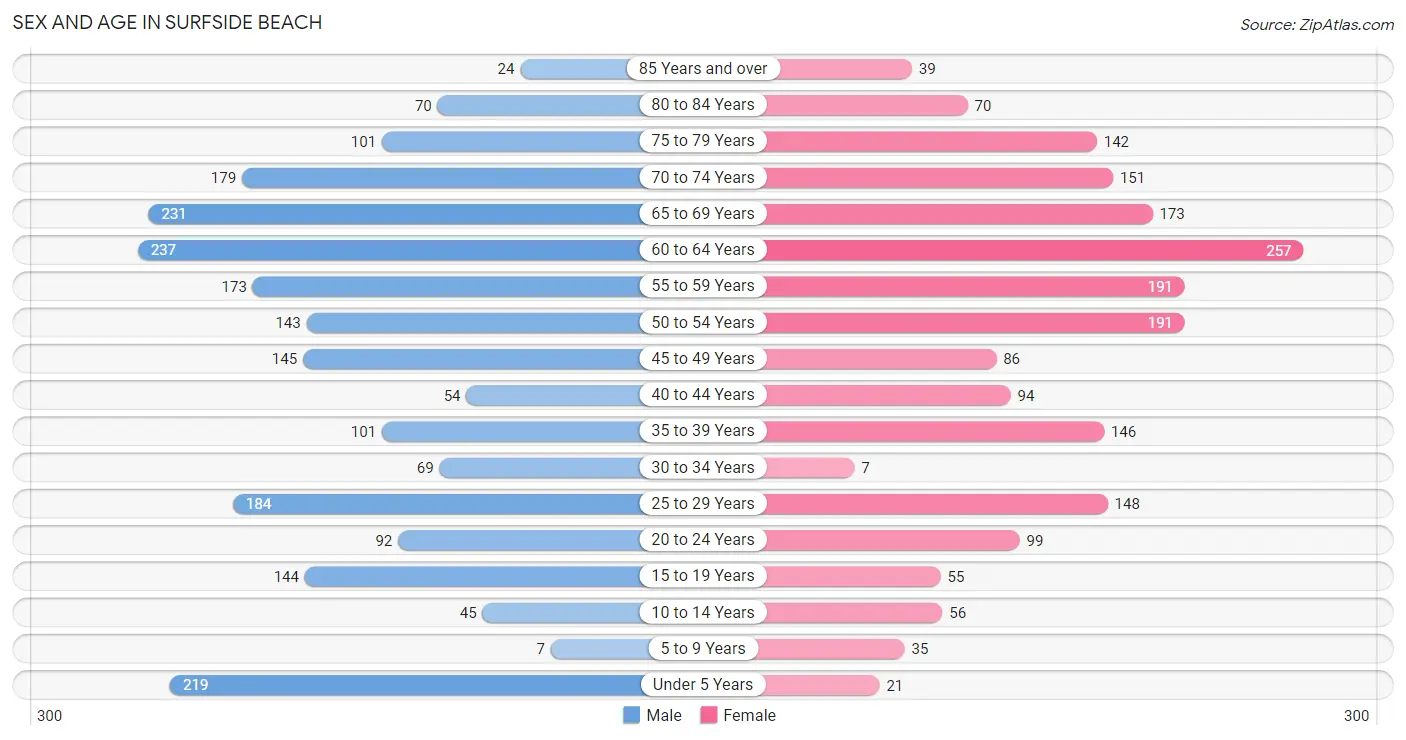
| Age Bracket | Male | Female |
| Under 5 Years | 219 (9.9%) | 21 (1.1%) |
| 5 to 9 Years | 7 (0.3%) | 35 (1.8%) |
| 10 to 14 Years | 45 (2.0%) | 56 (2.9%) |
| 15 to 19 Years | 144 (6.5%) | 55 (2.8%) |
| 20 to 24 Years | 92 (4.2%) | 99 (5.1%) |
| 25 to 29 Years | 184 (8.3%) | 148 (7.5%) |
| 30 to 34 Years | 69 (3.1%) | 7 (0.4%) |
| 35 to 39 Years | 101 (4.5%) | 146 (7.4%) |
| 40 to 44 Years | 54 (2.4%) | 94 (4.8%) |
| 45 to 49 Years | 145 (6.5%) | 86 (4.4%) |
| 50 to 54 Years | 143 (6.5%) | 191 (9.7%) |
| 55 to 59 Years | 173 (7.8%) | 191 (9.7%) |
| 60 to 64 Years | 237 (10.7%) | 257 (13.1%) |
| 65 to 69 Years | 231 (10.4%) | 173 (8.8%) |
| 70 to 74 Years | 179 (8.1%) | 151 (7.7%) |
| 75 to 79 Years | 101 (4.5%) | 142 (7.2%) |
| 80 to 84 Years | 70 (3.2%) | 70 (3.6%) |
| 85 Years and over | 24 (1.1%) | 39 (2.0%) |
| Total | 2,218 (100.0%) | 1,961 (100.0%) |
Families and Households in Surfside Beach
Median Family Size in Surfside Beach
The median family size in Surfside Beach is 2.70 persons per family, with single male/father families (12 | 1.0%) accounting for the largest median family size of 3.08 persons per family. On the other hand, single female/mother families (216 | 18.1%) represent the smallest median family size with 2.52 persons per family.
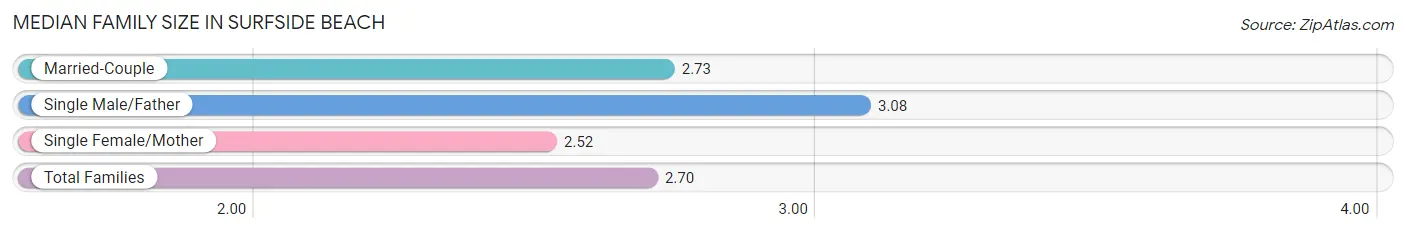
| Family Type | # Families | Family Size |
| Married-Couple | 965 (80.9%) | 2.73 |
| Single Male/Father | 12 (1.0%) | 3.08 |
| Single Female/Mother | 216 (18.1%) | 2.52 |
| Total Families | 1,193 (100.0%) | 2.70 |
Median Household Size in Surfside Beach
The median household size in Surfside Beach is 2.17 persons per household, with single male/father households (12 | 0.6%) accounting for the largest median household size of 3.08 persons per household. non-family households (729 | 37.9%) represent the smallest median household size with 1.23 persons per household.
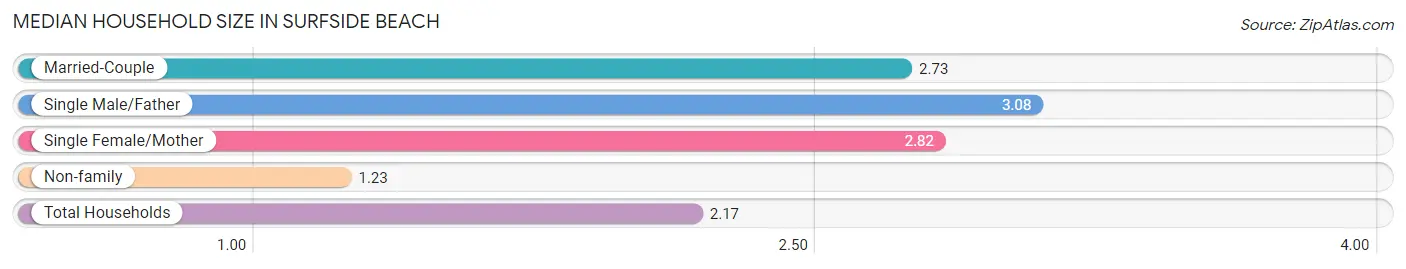
| Household Type | # Households | Household Size |
| Married-Couple | 965 (50.2%) | 2.73 |
| Single Male/Father | 12 (0.6%) | 3.08 |
| Single Female/Mother | 216 (11.2%) | 2.82 |
| Non-family | 729 (37.9%) | 1.23 |
| Total Households | 1,922 (100.0%) | 2.17 |
Household Size by Marriage Status in Surfside Beach
Out of a total of 1,922 households in Surfside Beach, 1,193 (62.1%) are family households, while 729 (37.9%) are nonfamily households. The most numerous type of family households are 2-person households, comprising 808, and the most common type of nonfamily households are 1-person households, comprising 601.
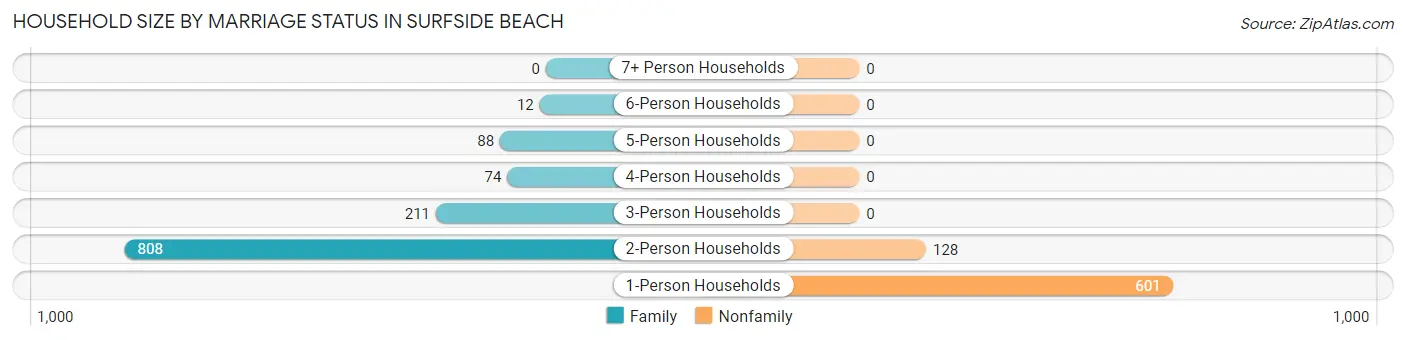
| Household Size | Family Households | Nonfamily Households |
| 1-Person Households | - | 601 (31.3%) |
| 2-Person Households | 808 (42.0%) | 128 (6.7%) |
| 3-Person Households | 211 (11.0%) | 0 (0.0%) |
| 4-Person Households | 74 (3.8%) | 0 (0.0%) |
| 5-Person Households | 88 (4.6%) | 0 (0.0%) |
| 6-Person Households | 12 (0.6%) | 0 (0.0%) |
| 7+ Person Households | 0 (0.0%) | 0 (0.0%) |
| Total | 1,193 (62.1%) | 729 (37.9%) |
Female Fertility in Surfside Beach
Fertility by Age in Surfside Beach
Average fertility rate in Surfside Beach is 89.0 births per 1,000 women. Women in the age bracket of 20 to 34 years have the highest fertility rate with 256.0 births per 1,000 women. Women in the age bracket of 20 to 34 years acount for 100.0% of all women with births.
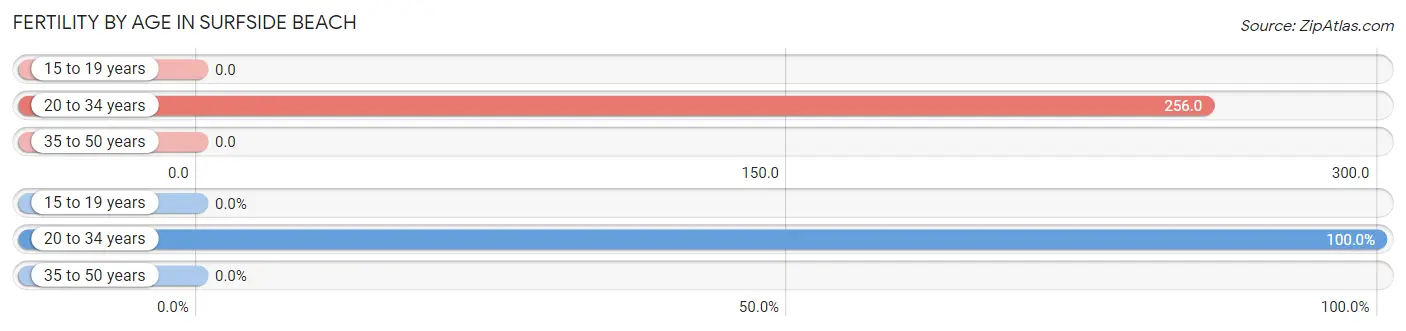
| Age Bracket | Women with Births | Births / 1,000 Women |
| 15 to 19 years | 0 (0.0%) | 0.0 |
| 20 to 34 years | 65 (100.0%) | 256.0 |
| 35 to 50 years | 0 (0.0%) | 0.0 |
| Total | 65 (100.0%) | 89.0 |
Fertility by Age by Marriage Status in Surfside Beach
32.3% of women with births (65) in Surfside Beach are married. The highest percentage of unmarried women with births falls into 20 to 34 years age bracket with 67.7% of them unmarried at the time of birth, while the lowest percentage of unmarried women with births belong to 20 to 34 years age bracket with 67.7% of them unmarried.
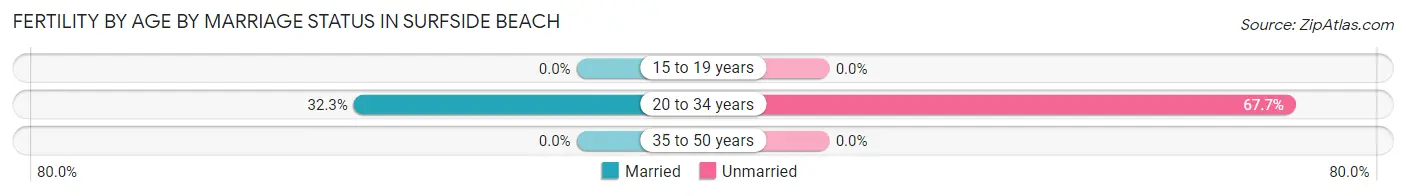
| Age Bracket | Married | Unmarried |
| 15 to 19 years | 0 (0.0%) | 0 (0.0%) |
| 20 to 34 years | 21 (32.3%) | 44 (67.7%) |
| 35 to 50 years | 0 (0.0%) | 0 (0.0%) |
| Total | 21 (32.3%) | 44 (67.7%) |
Fertility by Education in Surfside Beach
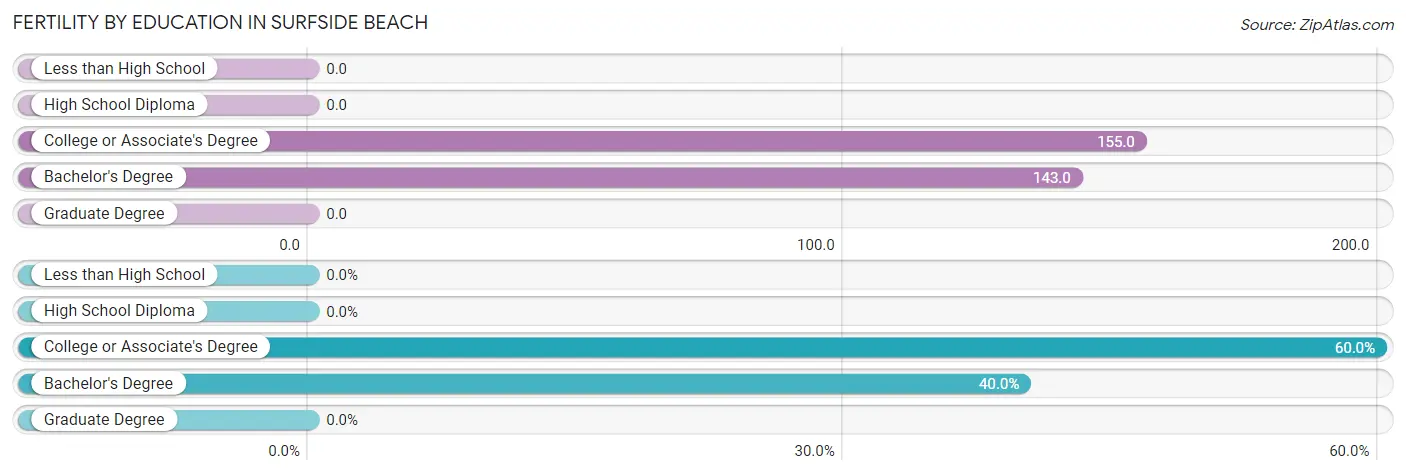
| Educational Attainment | Women with Births | Births / 1,000 Women |
| Less than High School | 0 (0.0%) | 0.0 |
| High School Diploma | 0 (0.0%) | 0.0 |
| College or Associate's Degree | 39 (60.0%) | 155.0 |
| Bachelor's Degree | 26 (40.0%) | 143.0 |
| Graduate Degree | 0 (0.0%) | 0.0 |
| Total | 65 (100.0%) | 89.0 |
Fertility by Education by Marriage Status in Surfside Beach
67.7% of women with births in Surfside Beach are unmarried. Women with the educational attainment of bachelor's degree are most likely to be married with 80.8% of them married at childbirth, while women with the educational attainment of college or associate's degree are least likely to be married with 100.0% of them unmarried at childbirth.
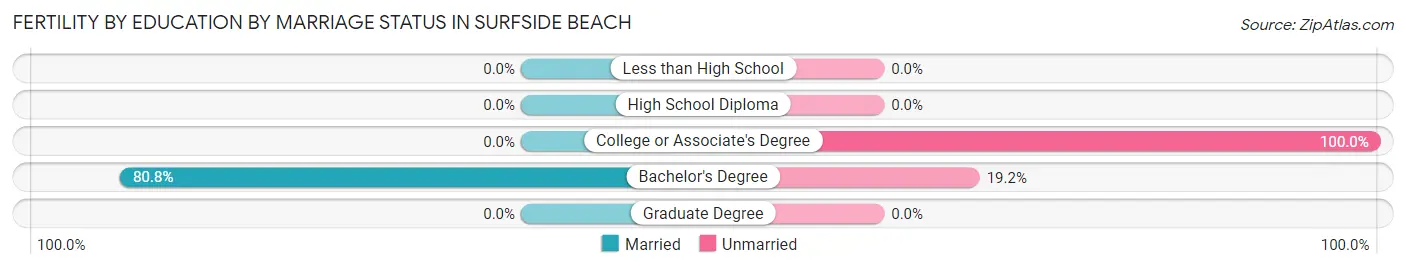
| Educational Attainment | Married | Unmarried |
| Less than High School | 0 (0.0%) | 0 (0.0%) |
| High School Diploma | 0 (0.0%) | 0 (0.0%) |
| College or Associate's Degree | 0 (0.0%) | 39 (100.0%) |
| Bachelor's Degree | 21 (80.8%) | 5 (19.2%) |
| Graduate Degree | 0 (0.0%) | 0 (0.0%) |
| Total | 21 (32.3%) | 44 (67.7%) |
Employment Characteristics in Surfside Beach
Employment by Class of Employer in Surfside Beach
Among the 1,675 employed individuals in Surfside Beach, private company employees (934 | 55.8%), self-employed (not incorporated) (235 | 14.0%), and state government employees (173 | 10.3%) make up the most common classes of employment.
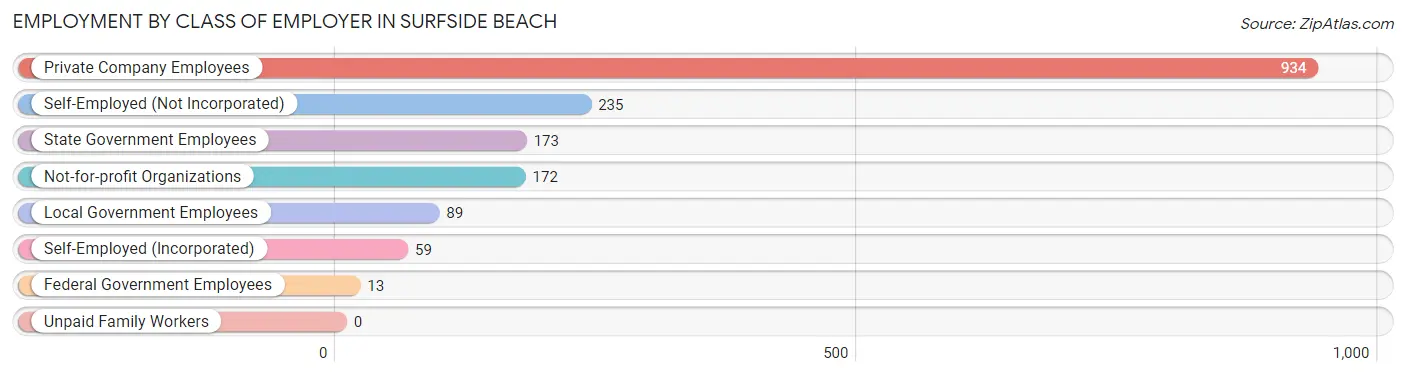
| Employer Class | # Employees | % Employees |
| Private Company Employees | 934 | 55.8% |
| Self-Employed (Incorporated) | 59 | 3.5% |
| Self-Employed (Not Incorporated) | 235 | 14.0% |
| Not-for-profit Organizations | 172 | 10.3% |
| Local Government Employees | 89 | 5.3% |
| State Government Employees | 173 | 10.3% |
| Federal Government Employees | 13 | 0.8% |
| Unpaid Family Workers | 0 | 0.0% |
| Total | 1,675 | 100.0% |
Employment Status by Age in Surfside Beach
According to the labor force statistics for Surfside Beach, out of the total population over 16 years of age (3,749), 48.9% or 1,833 individuals are in the labor force, with 8.3% or 152 of them unemployed. The age group with the highest labor force participation rate is 30 to 34 years, with 88.2% or 67 individuals in the labor force. Within the labor force, the 65 to 74 years age range has the highest percentage of unemployed individuals, with 21.5% or 43 of them being unemployed.
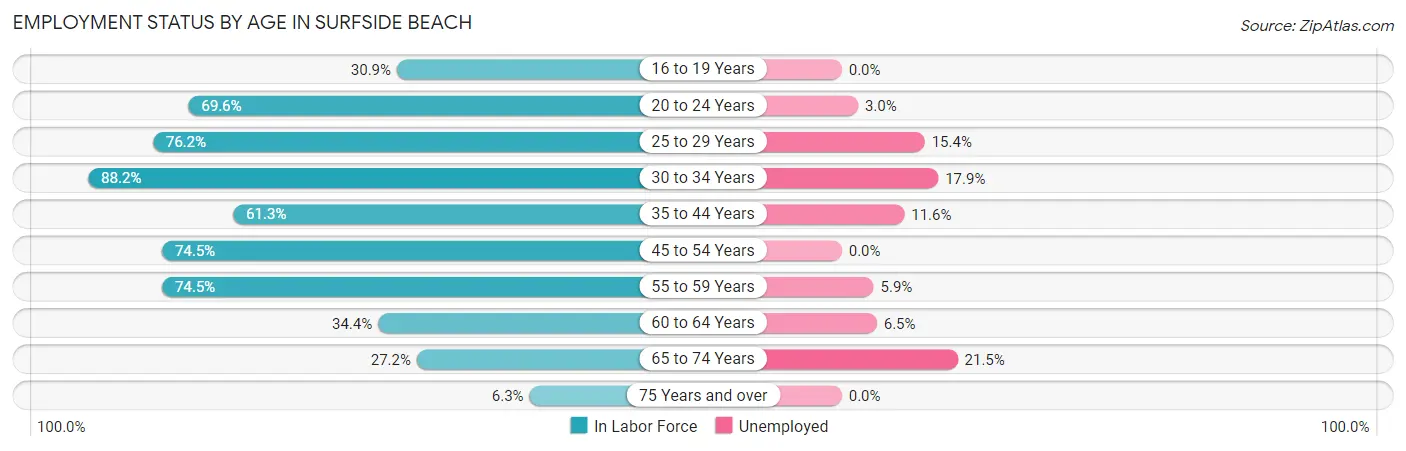
| Age Bracket | In Labor Force | Unemployed |
| 16 to 19 Years | 47 (30.9%) | 0 (0.0%) |
| 20 to 24 Years | 133 (69.6%) | 4 (3.0%) |
| 25 to 29 Years | 253 (76.2%) | 39 (15.4%) |
| 30 to 34 Years | 67 (88.2%) | 12 (17.9%) |
| 35 to 44 Years | 242 (61.3%) | 28 (11.6%) |
| 45 to 54 Years | 421 (74.5%) | 0 (0.0%) |
| 55 to 59 Years | 271 (74.5%) | 16 (5.9%) |
| 60 to 64 Years | 170 (34.4%) | 11 (6.5%) |
| 65 to 74 Years | 200 (27.2%) | 43 (21.5%) |
| 75 Years and over | 28 (6.3%) | 0 (0.0%) |
| Total | 1,833 (48.9%) | 152 (8.3%) |
Employment Status by Educational Attainment in Surfside Beach
According to labor force statistics for Surfside Beach, 64.0% of individuals (1,425) out of the total population between 25 and 64 years of age (2,226) are in the labor force, with 7.4% or 105 of them being unemployed. The group with the highest labor force participation rate are those with the educational attainment of high school diploma, with 72.0% or 360 individuals in the labor force. Within the labor force, individuals with college / associate degree education have the highest percentage of unemployment, with 8.0% or 38 of them being unemployed.
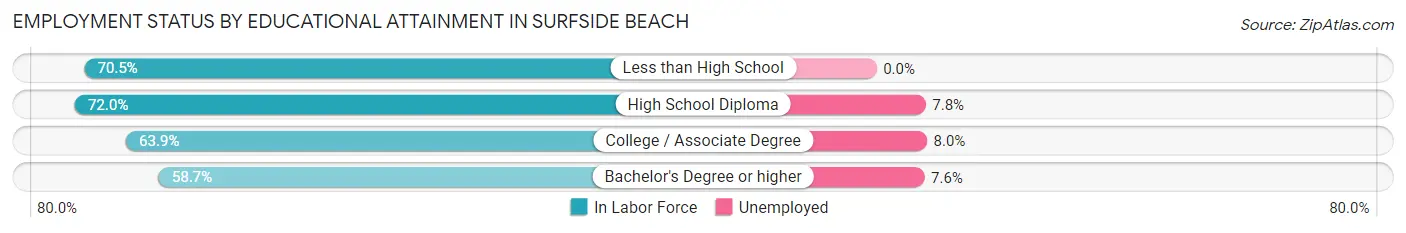
| Educational Attainment | In Labor Force | Unemployed |
| Less than High School | 74 (70.5%) | 0 (0.0%) |
| High School Diploma | 360 (72.0%) | 39 (7.8%) |
| College / Associate Degree | 474 (63.9%) | 59 (8.0%) |
| Bachelor's Degree or higher | 516 (58.7%) | 67 (7.6%) |
| Total | 1,425 (64.0%) | 165 (7.4%) |
Employment Occupations by Sex in Surfside Beach
Management, Business, Science and Arts Occupations
The most common Management, Business, Science and Arts occupations in Surfside Beach are Community & Social Service (256 | 15.3%), Management (146 | 8.7%), Education Instruction & Library (141 | 8.5%), Health Diagnosing & Treating (112 | 6.7%), and Health Technologists (103 | 6.2%).
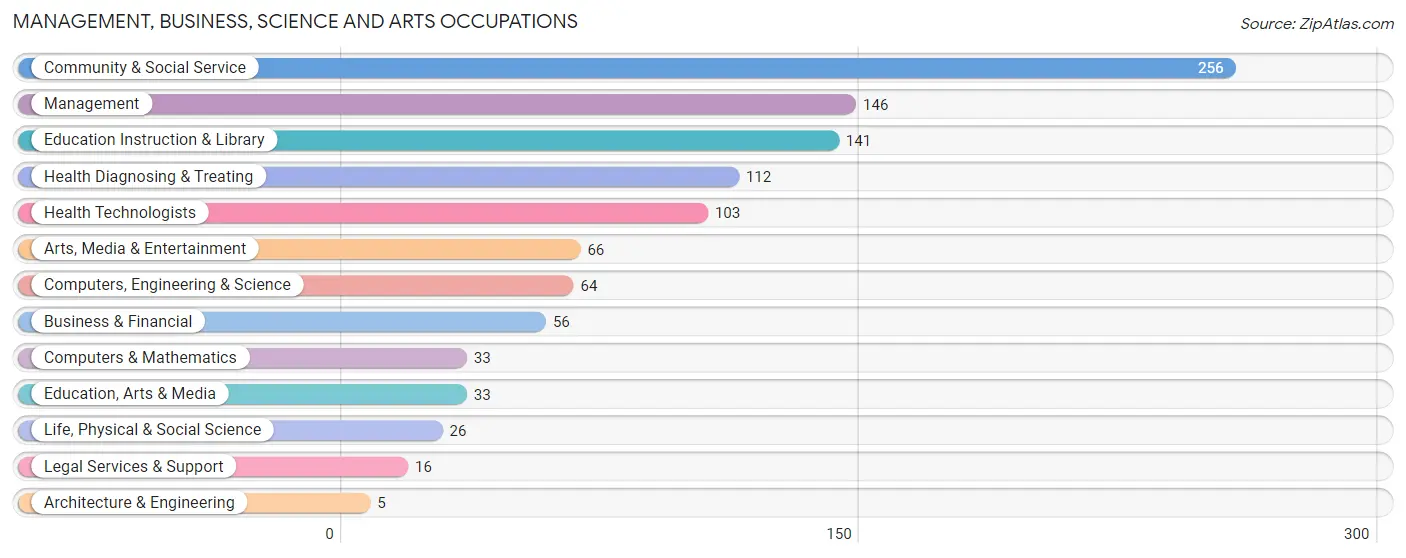
Management, Business, Science and Arts Occupations by Sex
Within the Management, Business, Science and Arts occupations in Surfside Beach, the most male-oriented occupations are Architecture & Engineering (100.0%), Business & Financial (78.6%), and Arts, Media & Entertainment (47.0%), while the most female-oriented occupations are Life, Physical & Social Science (100.0%), Legal Services & Support (100.0%), and Health Diagnosing & Treating (93.8%).
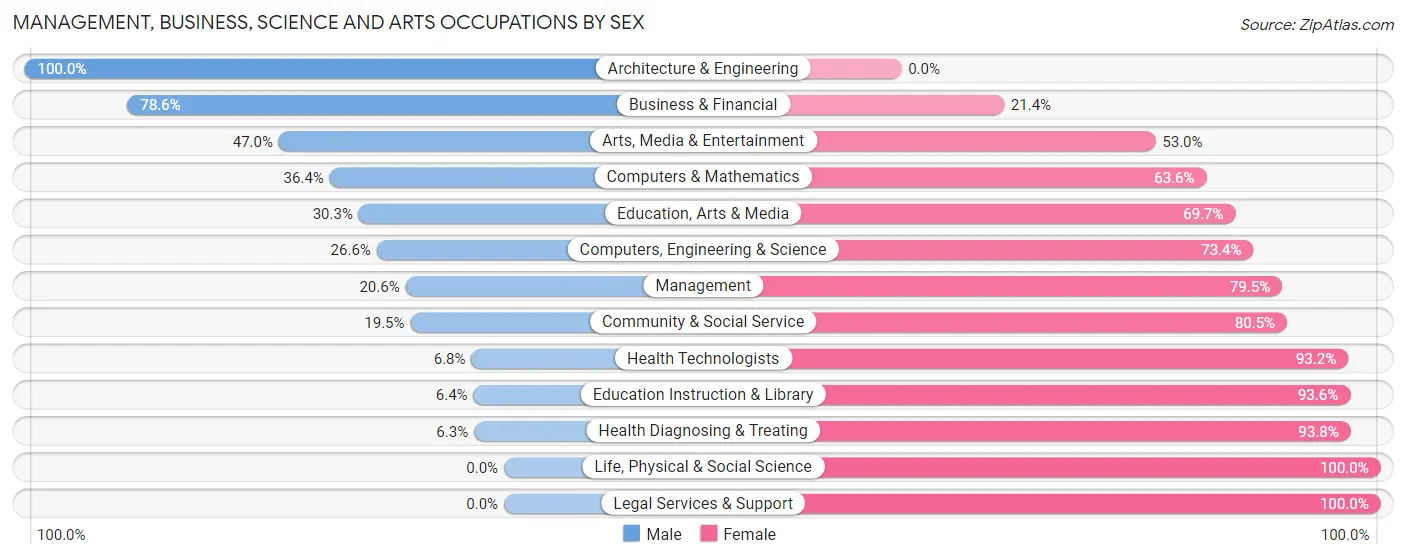
| Occupation | Male | Female |
| Management | 30 (20.5%) | 116 (79.4%) |
| Business & Financial | 44 (78.6%) | 12 (21.4%) |
| Computers, Engineering & Science | 17 (26.6%) | 47 (73.4%) |
| Computers & Mathematics | 12 (36.4%) | 21 (63.6%) |
| Architecture & Engineering | 5 (100.0%) | 0 (0.0%) |
| Life, Physical & Social Science | 0 (0.0%) | 26 (100.0%) |
| Community & Social Service | 50 (19.5%) | 206 (80.5%) |
| Education, Arts & Media | 10 (30.3%) | 23 (69.7%) |
| Legal Services & Support | 0 (0.0%) | 16 (100.0%) |
| Education Instruction & Library | 9 (6.4%) | 132 (93.6%) |
| Arts, Media & Entertainment | 31 (47.0%) | 35 (53.0%) |
| Health Diagnosing & Treating | 7 (6.2%) | 105 (93.8%) |
| Health Technologists | 7 (6.8%) | 96 (93.2%) |
| Total (Category) | 148 (23.3%) | 486 (76.7%) |
| Total (Overall) | 787 (47.2%) | 881 (52.8%) |
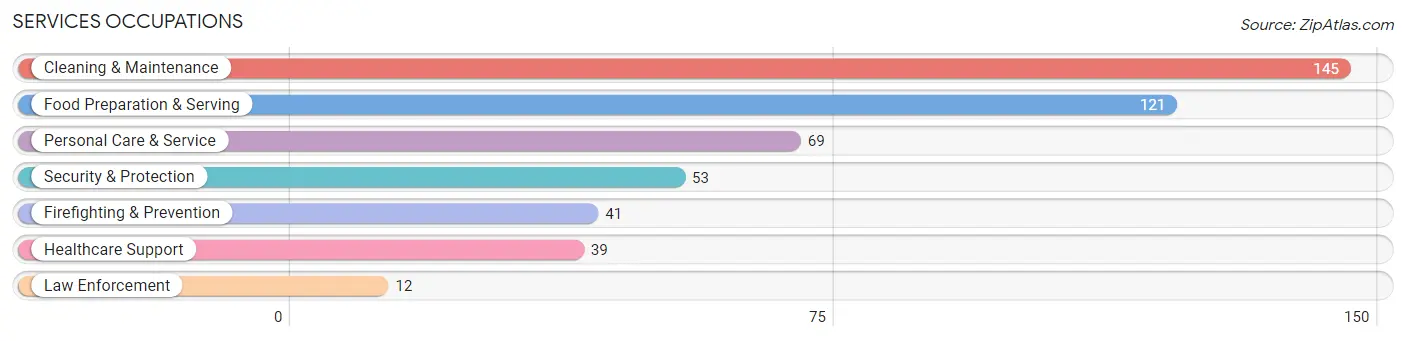
Services Occupations
The most common Services occupations in Surfside Beach are Cleaning & Maintenance (145 | 8.7%), Food Preparation & Serving (121 | 7.2%), Personal Care & Service (69 | 4.1%), Security & Protection (53 | 3.2%), and Firefighting & Prevention (41 | 2.5%).
Services Occupations by Sex
Within the Services occupations in Surfside Beach, the most male-oriented occupations are Law Enforcement (100.0%), Security & Protection (86.8%), and Firefighting & Prevention (82.9%), while the most female-oriented occupations are Healthcare Support (100.0%), Personal Care & Service (73.9%), and Cleaning & Maintenance (31.7%).
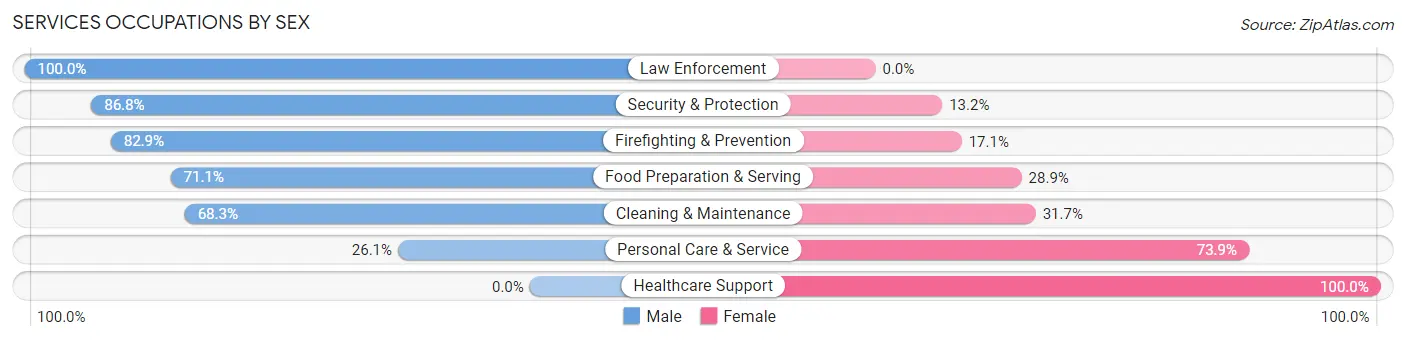
| Occupation | Male | Female |
| Healthcare Support | 0 (0.0%) | 39 (100.0%) |
| Security & Protection | 46 (86.8%) | 7 (13.2%) |
| Firefighting & Prevention | 34 (82.9%) | 7 (17.1%) |
| Law Enforcement | 12 (100.0%) | 0 (0.0%) |
| Food Preparation & Serving | 86 (71.1%) | 35 (28.9%) |
| Cleaning & Maintenance | 99 (68.3%) | 46 (31.7%) |
| Personal Care & Service | 18 (26.1%) | 51 (73.9%) |
| Total (Category) | 249 (58.3%) | 178 (41.7%) |
| Total (Overall) | 787 (47.2%) | 881 (52.8%) |
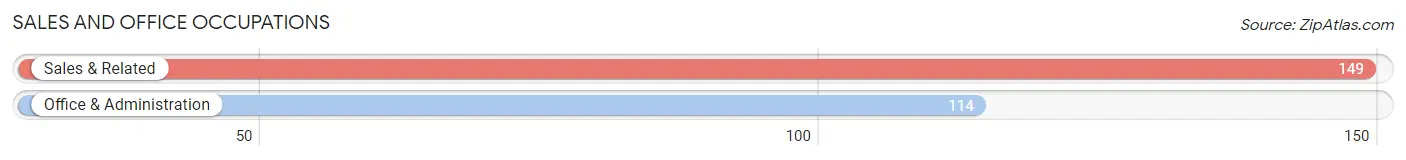
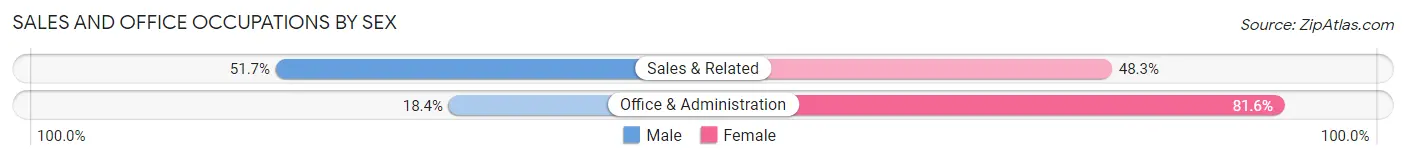
Sales and Office Occupations
The most common Sales and Office occupations in Surfside Beach are Sales & Related (149 | 8.9%), and Office & Administration (114 | 6.8%).
Sales and Office Occupations by Sex
| Occupation | Male | Female |
| Sales & Related | 77 (51.7%) | 72 (48.3%) |
| Office & Administration | 21 (18.4%) | 93 (81.6%) |
| Total (Category) | 98 (37.3%) | 165 (62.7%) |
| Total (Overall) | 787 (47.2%) | 881 (52.8%) |
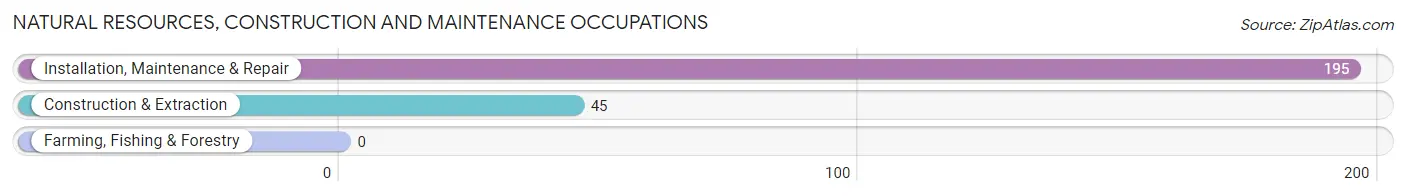
Natural Resources, Construction and Maintenance Occupations
The most common Natural Resources, Construction and Maintenance occupations in Surfside Beach are Installation, Maintenance & Repair (195 | 11.7%), and Construction & Extraction (45 | 2.7%).
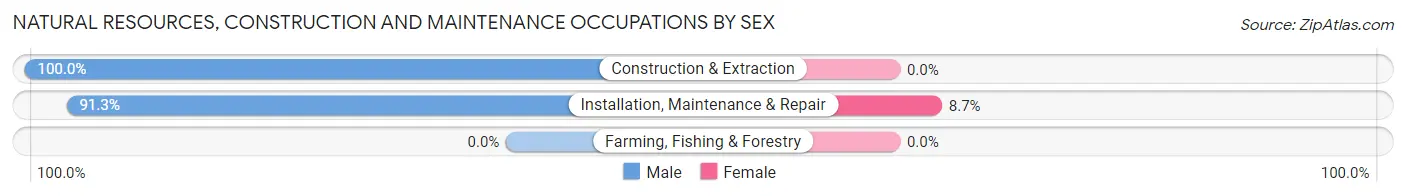
Natural Resources, Construction and Maintenance Occupations by Sex
| Occupation | Male | Female |
| Farming, Fishing & Forestry | 0 (0.0%) | 0 (0.0%) |
| Construction & Extraction | 45 (100.0%) | 0 (0.0%) |
| Installation, Maintenance & Repair | 178 (91.3%) | 17 (8.7%) |
| Total (Category) | 223 (92.9%) | 17 (7.1%) |
| Total (Overall) | 787 (47.2%) | 881 (52.8%) |
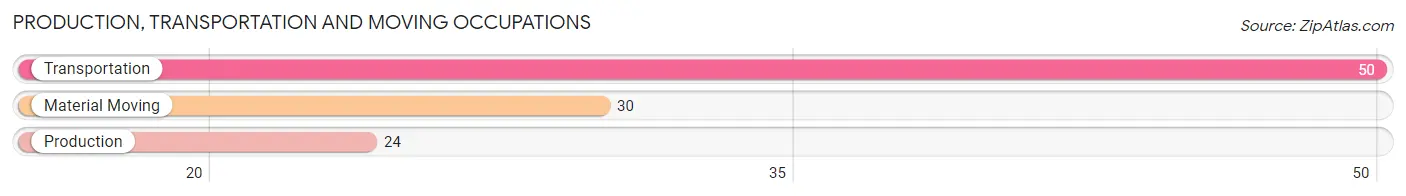
Production, Transportation and Moving Occupations
The most common Production, Transportation and Moving occupations in Surfside Beach are Transportation (50 | 3.0%), Material Moving (30 | 1.8%), and Production (24 | 1.4%).
Production, Transportation and Moving Occupations by Sex
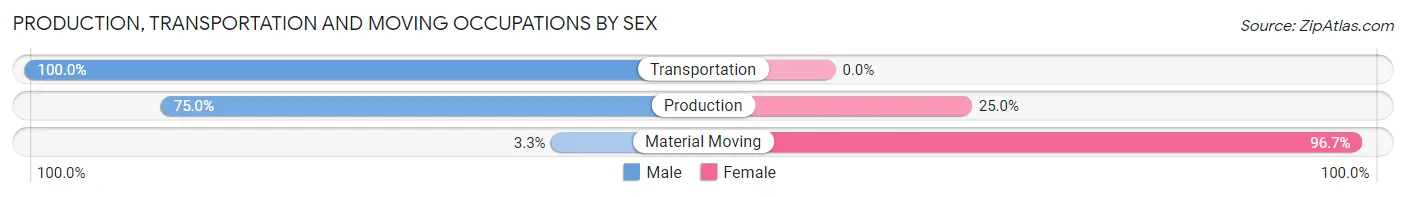
| Occupation | Male | Female |
| Production | 18 (75.0%) | 6 (25.0%) |
| Transportation | 50 (100.0%) | 0 (0.0%) |
| Material Moving | 1 (3.3%) | 29 (96.7%) |
| Total (Category) | 69 (66.3%) | 35 (33.7%) |
| Total (Overall) | 787 (47.2%) | 881 (52.8%) |
Employment Industries by Sex in Surfside Beach
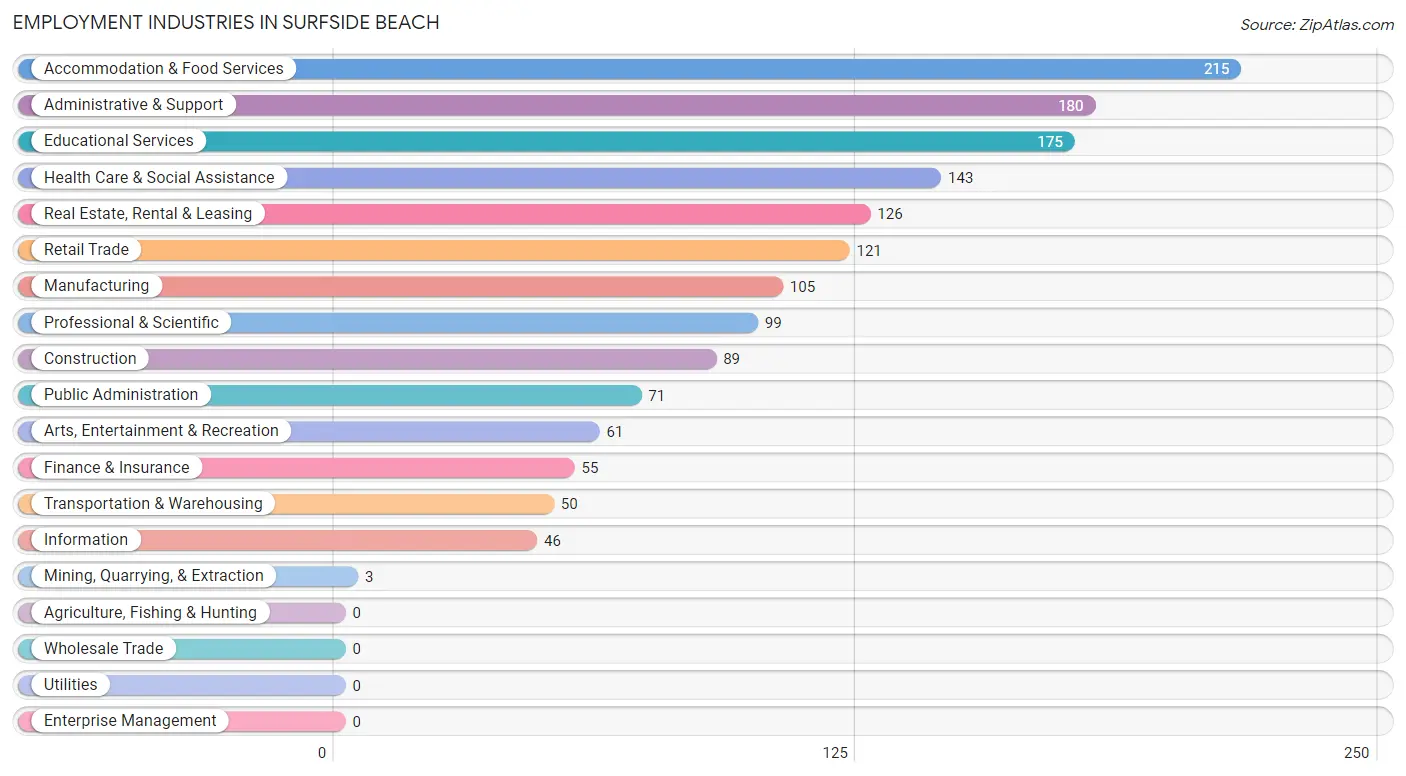
Employment Industries in Surfside Beach
The major employment industries in Surfside Beach include Accommodation & Food Services (215 | 12.9%), Administrative & Support (180 | 10.8%), Educational Services (175 | 10.5%), Health Care & Social Assistance (143 | 8.6%), and Real Estate, Rental & Leasing (126 | 7.5%).
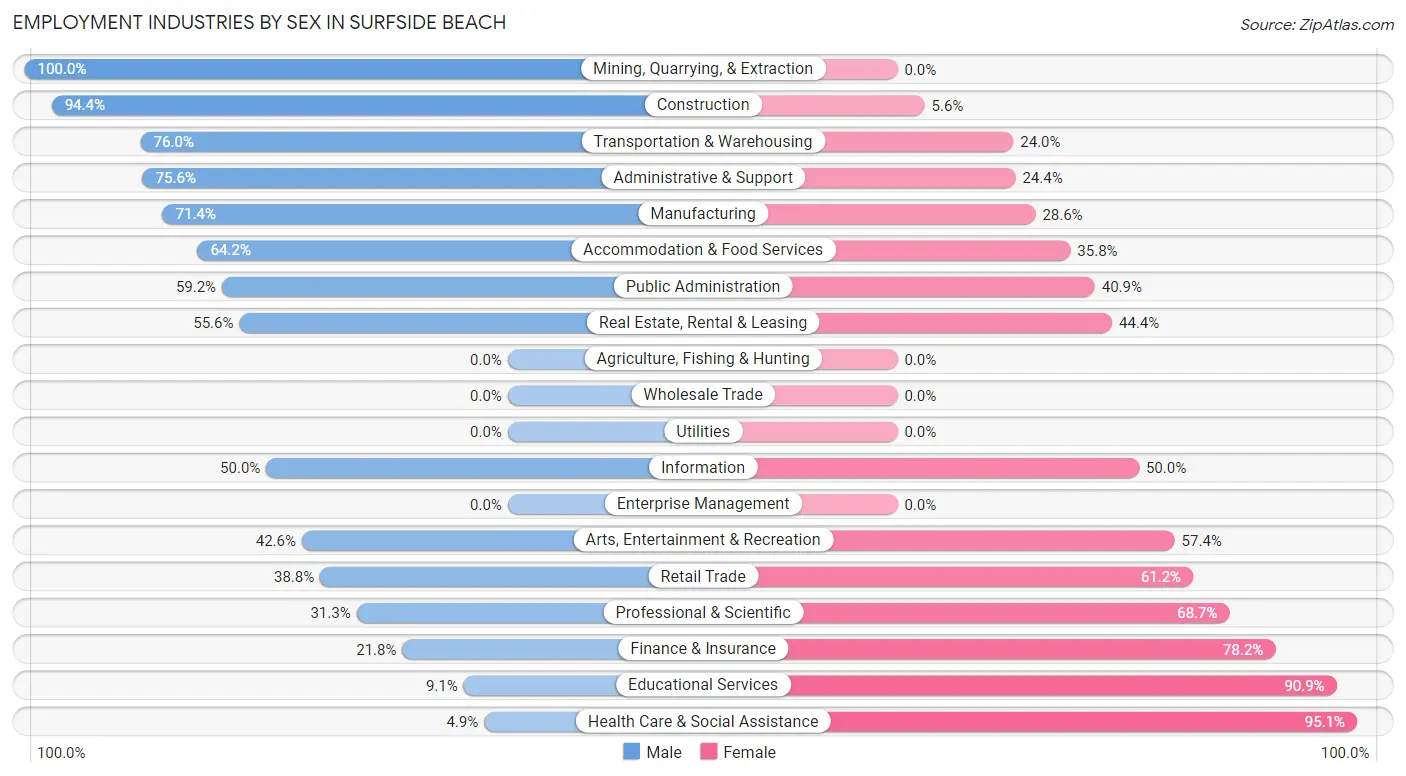
Employment Industries by Sex in Surfside Beach
The Surfside Beach industries that see more men than women are Mining, Quarrying, & Extraction (100.0%), Construction (94.4%), and Transportation & Warehousing (76.0%), whereas the industries that tend to have a higher number of women are Health Care & Social Assistance (95.1%), Educational Services (90.9%), and Finance & Insurance (78.2%).
| Industry | Male | Female |
| Agriculture, Fishing & Hunting | 0 (0.0%) | 0 (0.0%) |
| Mining, Quarrying, & Extraction | 3 (100.0%) | 0 (0.0%) |
| Construction | 84 (94.4%) | 5 (5.6%) |
| Manufacturing | 75 (71.4%) | 30 (28.6%) |
| Wholesale Trade | 0 (0.0%) | 0 (0.0%) |
| Retail Trade | 47 (38.8%) | 74 (61.2%) |
| Transportation & Warehousing | 38 (76.0%) | 12 (24.0%) |
| Utilities | 0 (0.0%) | 0 (0.0%) |
| Information | 23 (50.0%) | 23 (50.0%) |
| Finance & Insurance | 12 (21.8%) | 43 (78.2%) |
| Real Estate, Rental & Leasing | 70 (55.6%) | 56 (44.4%) |
| Professional & Scientific | 31 (31.3%) | 68 (68.7%) |
| Enterprise Management | 0 (0.0%) | 0 (0.0%) |
| Administrative & Support | 136 (75.6%) | 44 (24.4%) |
| Educational Services | 16 (9.1%) | 159 (90.9%) |
| Health Care & Social Assistance | 7 (4.9%) | 136 (95.1%) |
| Arts, Entertainment & Recreation | 26 (42.6%) | 35 (57.4%) |
| Accommodation & Food Services | 138 (64.2%) | 77 (35.8%) |
| Public Administration | 42 (59.2%) | 29 (40.8%) |
| Total | 787 (47.2%) | 881 (52.8%) |
Education in Surfside Beach
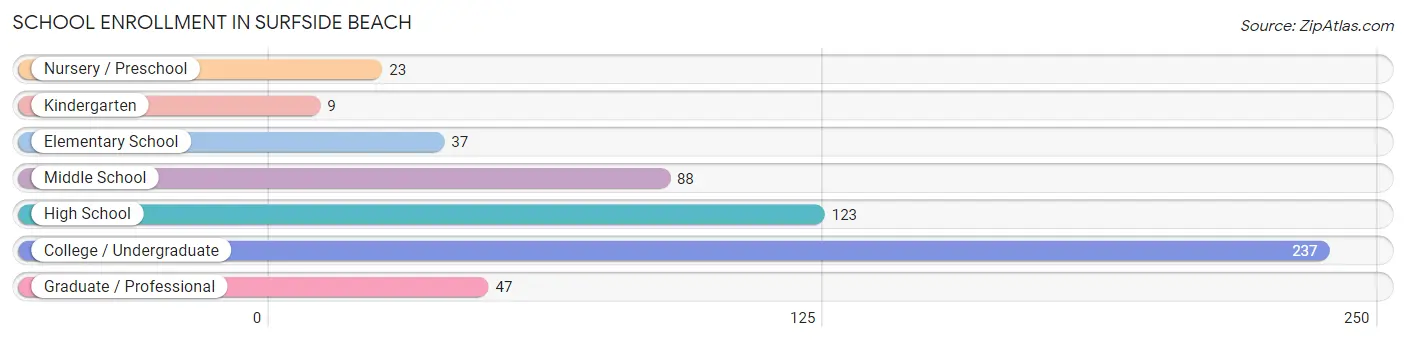
School Enrollment in Surfside Beach
The most common levels of schooling among the 564 students in Surfside Beach are college / undergraduate (237 | 42.0%), high school (123 | 21.8%), and middle school (88 | 15.6%).
| School Level | # Students | % Students |
| Nursery / Preschool | 23 | 4.1% |
| Kindergarten | 9 | 1.6% |
| Elementary School | 37 | 6.6% |
| Middle School | 88 | 15.6% |
| High School | 123 | 21.8% |
| College / Undergraduate | 237 | 42.0% |
| Graduate / Professional | 47 | 8.3% |
| Total | 564 | 100.0% |
School Enrollment by Age by Funding Source in Surfside Beach
Out of a total of 564 students who are enrolled in schools in Surfside Beach, 206 (36.5%) attend a private institution, while the remaining 358 (63.5%) are enrolled in public schools. The age group of 35 years and over has the highest likelihood of being enrolled in private schools, with 18 (100.0% in the age bracket) enrolled. Conversely, the age group of 25 to 34 year olds has the lowest likelihood of being enrolled in a private school, with 101 (94.4% in the age bracket) attending a public institution.
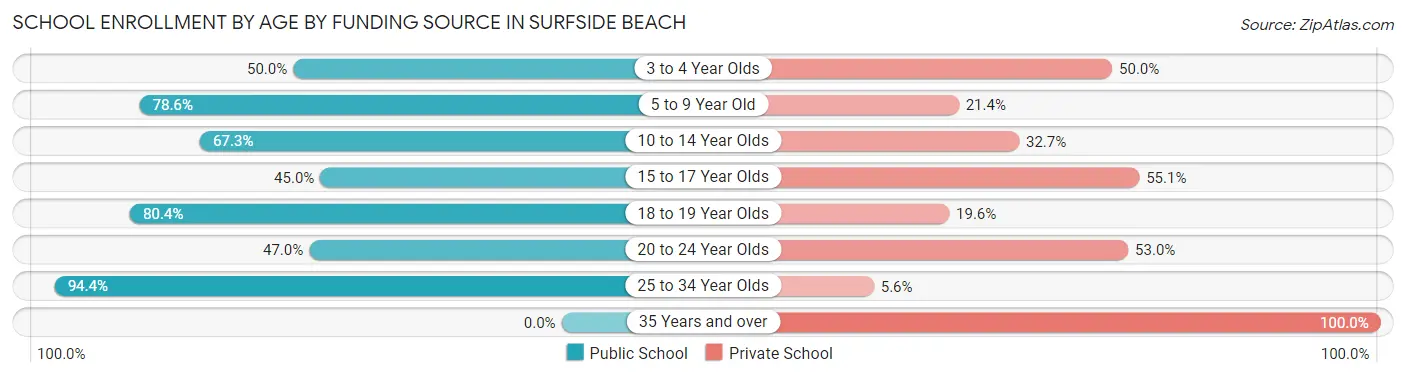
| Age Bracket | Public School | Private School |
| 3 to 4 Year Olds | 7 (50.0%) | 7 (50.0%) |
| 5 to 9 Year Old | 33 (78.6%) | 9 (21.4%) |
| 10 to 14 Year Olds | 68 (67.3%) | 33 (32.7%) |
| 15 to 17 Year Olds | 49 (45.0%) | 60 (55.0%) |
| 18 to 19 Year Olds | 45 (80.4%) | 11 (19.6%) |
| 20 to 24 Year Olds | 55 (47.0%) | 62 (53.0%) |
| 25 to 34 Year Olds | 101 (94.4%) | 6 (5.6%) |
| 35 Years and over | 0 (0.0%) | 18 (100.0%) |
| Total | 358 (63.5%) | 206 (36.5%) |
Educational Attainment by Field of Study in Surfside Beach
Business (334 | 22.7%), education (315 | 21.4%), science & technology (194 | 13.2%), social sciences (120 | 8.1%), and engineering (92 | 6.2%) are the most common fields of study among 1,474 individuals in Surfside Beach who have obtained a bachelor's degree or higher.
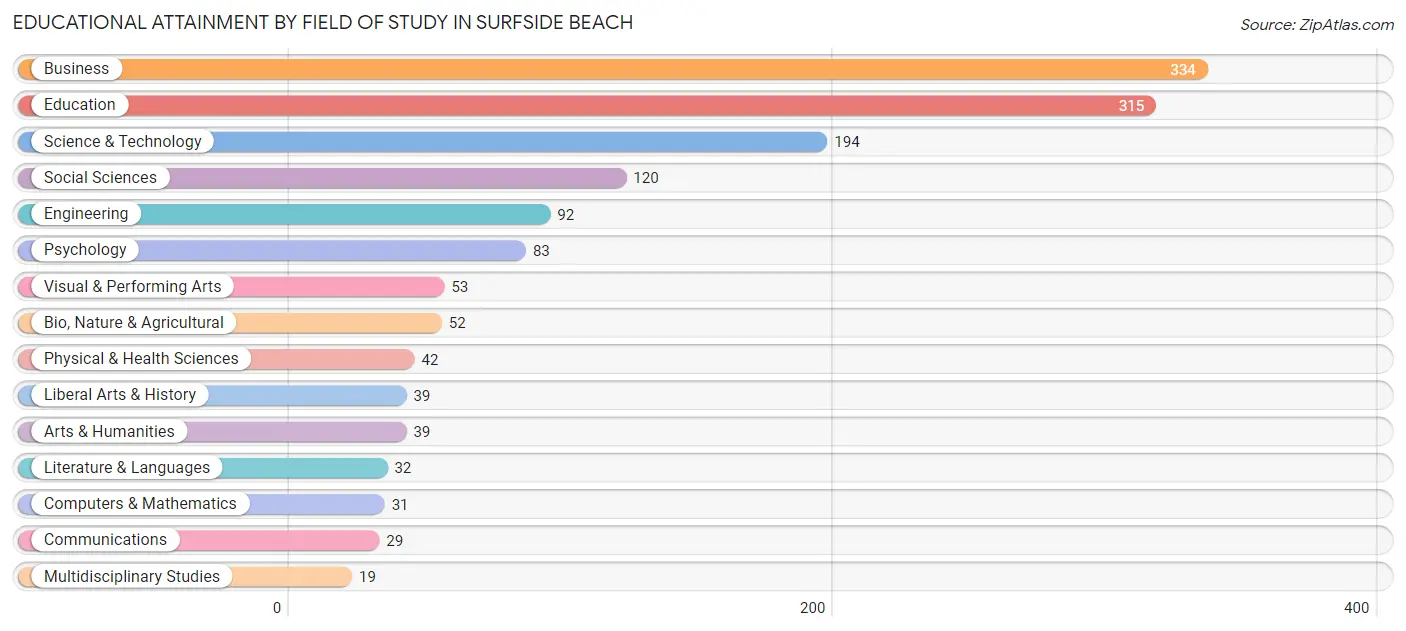
| Field of Study | # Graduates | % Graduates |
| Computers & Mathematics | 31 | 2.1% |
| Bio, Nature & Agricultural | 52 | 3.5% |
| Physical & Health Sciences | 42 | 2.9% |
| Psychology | 83 | 5.6% |
| Social Sciences | 120 | 8.1% |
| Engineering | 92 | 6.2% |
| Multidisciplinary Studies | 19 | 1.3% |
| Science & Technology | 194 | 13.2% |
| Business | 334 | 22.7% |
| Education | 315 | 21.4% |
| Literature & Languages | 32 | 2.2% |
| Liberal Arts & History | 39 | 2.6% |
| Visual & Performing Arts | 53 | 3.6% |
| Communications | 29 | 2.0% |
| Arts & Humanities | 39 | 2.6% |
| Total | 1,474 | 100.0% |
Transportation & Commute in Surfside Beach
Vehicle Availability by Sex in Surfside Beach
The most prevalent vehicle ownership categories in Surfside Beach are males with 2 vehicles (308, accounting for 38.5%) and females with 2 vehicles (406, making up 35.2%).
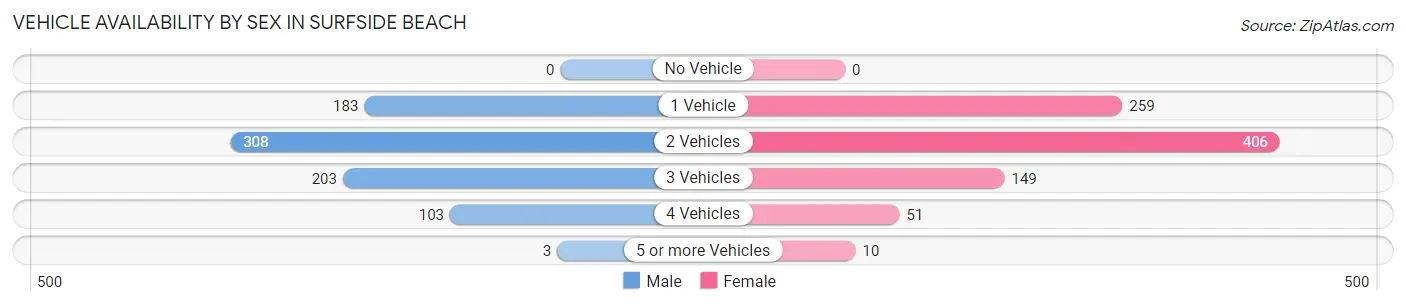
| Vehicles Available | Male | Female |
| No Vehicle | 0 (0.0%) | 0 (0.0%) |
| 1 Vehicle | 183 (22.9%) | 259 (29.6%) |
| 2 Vehicles | 308 (38.5%) | 406 (46.4%) |
| 3 Vehicles | 203 (25.4%) | 149 (17.0%) |
| 4 Vehicles | 103 (12.9%) | 51 (5.8%) |
| 5 or more Vehicles | 3 (0.4%) | 10 (1.1%) |
| Total | 800 (100.0%) | 875 (100.0%) |
Commute Time in Surfside Beach
The most frequently occuring commute durations in Surfside Beach are 20 to 24 minutes (323 commuters, 21.8%), 15 to 19 minutes (296 commuters, 20.0%), and 10 to 14 minutes (268 commuters, 18.1%).
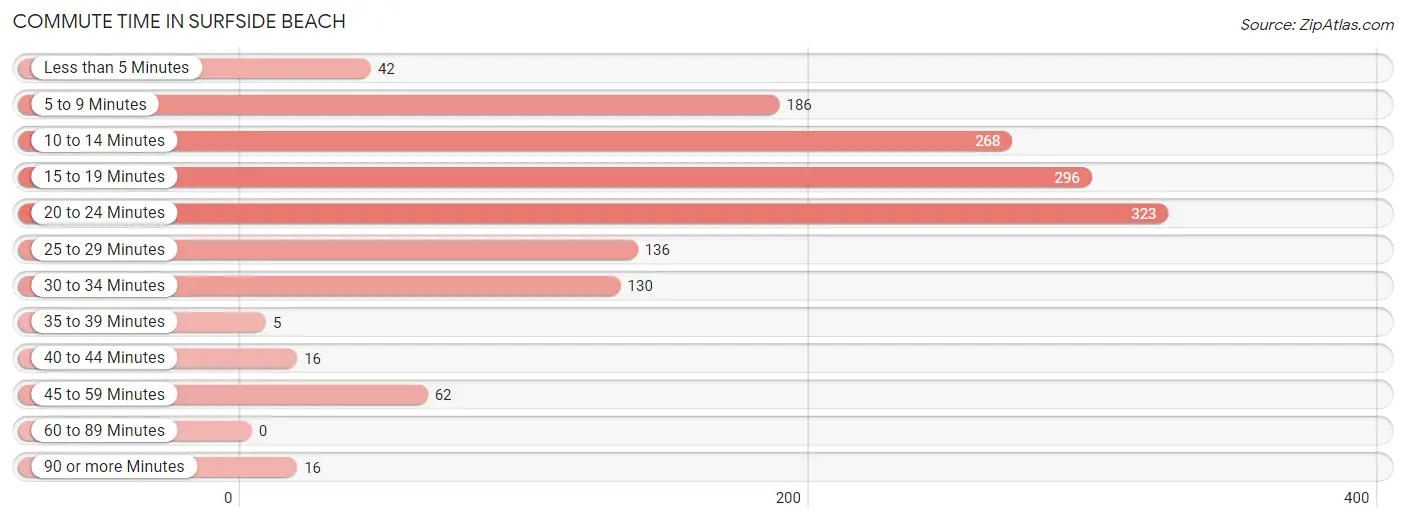
| Commute Time | # Commuters | % Commuters |
| Less than 5 Minutes | 42 | 2.8% |
| 5 to 9 Minutes | 186 | 12.6% |
| 10 to 14 Minutes | 268 | 18.1% |
| 15 to 19 Minutes | 296 | 20.0% |
| 20 to 24 Minutes | 323 | 21.8% |
| 25 to 29 Minutes | 136 | 9.2% |
| 30 to 34 Minutes | 130 | 8.8% |
| 35 to 39 Minutes | 5 | 0.3% |
| 40 to 44 Minutes | 16 | 1.1% |
| 45 to 59 Minutes | 62 | 4.2% |
| 60 to 89 Minutes | 0 | 0.0% |
| 90 or more Minutes | 16 | 1.1% |
Commute Time by Sex in Surfside Beach
The most common commute times in Surfside Beach are 20 to 24 minutes (212 commuters, 28.8%) for males and 15 to 19 minutes (199 commuters, 26.7%) for females.
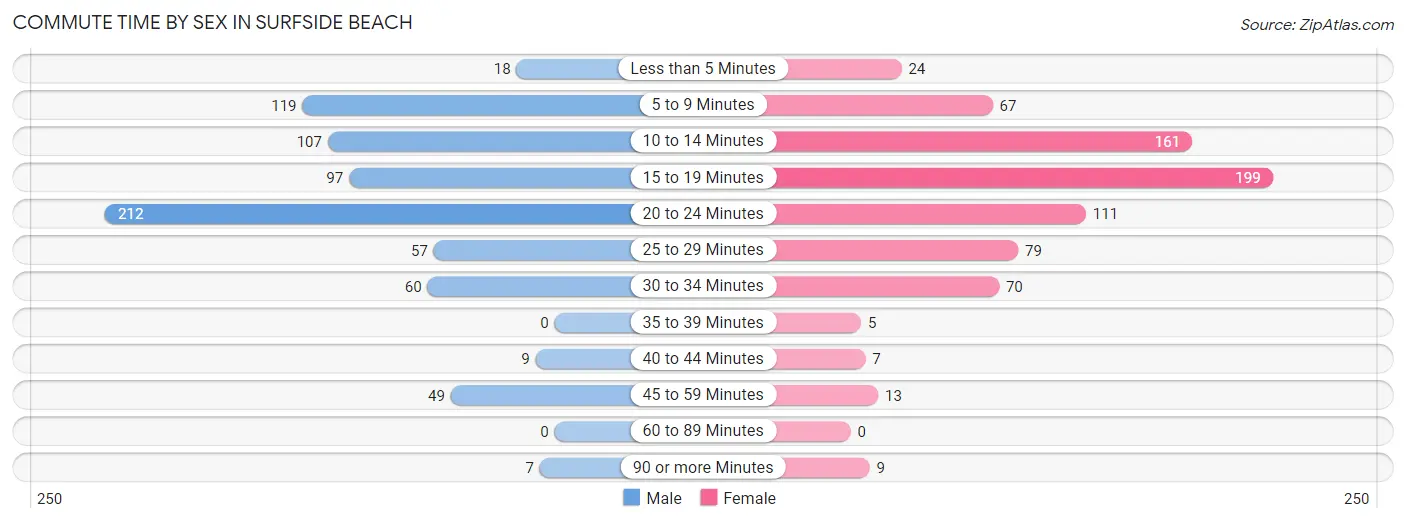
| Commute Time | Male | Female |
| Less than 5 Minutes | 18 (2.5%) | 24 (3.2%) |
| 5 to 9 Minutes | 119 (16.2%) | 67 (9.0%) |
| 10 to 14 Minutes | 107 (14.6%) | 161 (21.6%) |
| 15 to 19 Minutes | 97 (13.2%) | 199 (26.7%) |
| 20 to 24 Minutes | 212 (28.8%) | 111 (14.9%) |
| 25 to 29 Minutes | 57 (7.8%) | 79 (10.6%) |
| 30 to 34 Minutes | 60 (8.2%) | 70 (9.4%) |
| 35 to 39 Minutes | 0 (0.0%) | 5 (0.7%) |
| 40 to 44 Minutes | 9 (1.2%) | 7 (0.9%) |
| 45 to 59 Minutes | 49 (6.7%) | 13 (1.7%) |
| 60 to 89 Minutes | 0 (0.0%) | 0 (0.0%) |
| 90 or more Minutes | 7 (0.9%) | 9 (1.2%) |
Time of Departure to Work by Sex in Surfside Beach
The most frequent times of departure to work in Surfside Beach are 9:00 AM to 9:59 AM (156, 21.2%) for males and 12:00 PM to 3:59 PM (104, 14.0%) for females.
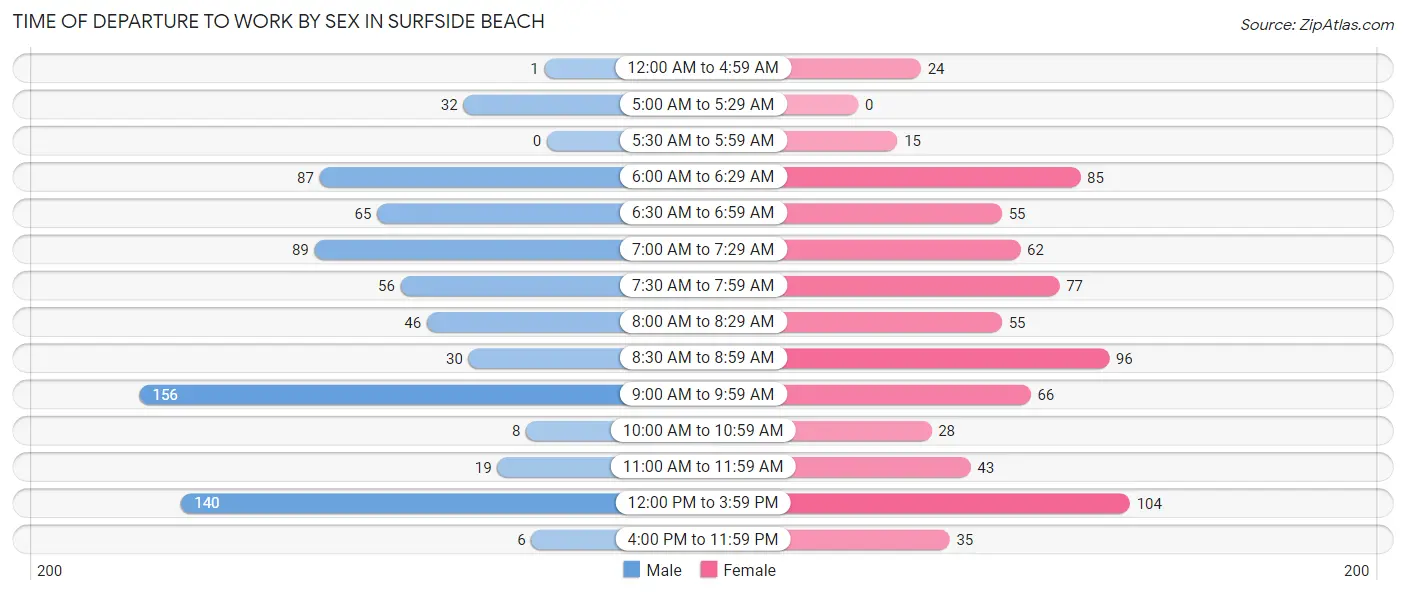
| Time of Departure | Male | Female |
| 12:00 AM to 4:59 AM | 1 (0.1%) | 24 (3.2%) |
| 5:00 AM to 5:29 AM | 32 (4.3%) | 0 (0.0%) |
| 5:30 AM to 5:59 AM | 0 (0.0%) | 15 (2.0%) |
| 6:00 AM to 6:29 AM | 87 (11.8%) | 85 (11.4%) |
| 6:30 AM to 6:59 AM | 65 (8.8%) | 55 (7.4%) |
| 7:00 AM to 7:29 AM | 89 (12.1%) | 62 (8.3%) |
| 7:30 AM to 7:59 AM | 56 (7.6%) | 77 (10.3%) |
| 8:00 AM to 8:29 AM | 46 (6.3%) | 55 (7.4%) |
| 8:30 AM to 8:59 AM | 30 (4.1%) | 96 (12.9%) |
| 9:00 AM to 9:59 AM | 156 (21.2%) | 66 (8.9%) |
| 10:00 AM to 10:59 AM | 8 (1.1%) | 28 (3.8%) |
| 11:00 AM to 11:59 AM | 19 (2.6%) | 43 (5.8%) |
| 12:00 PM to 3:59 PM | 140 (19.1%) | 104 (14.0%) |
| 4:00 PM to 11:59 PM | 6 (0.8%) | 35 (4.7%) |
| Total | 735 (100.0%) | 745 (100.0%) |
Housing Occupancy in Surfside Beach
Occupancy by Ownership in Surfside Beach
Of the total 1,922 dwellings in Surfside Beach, owner-occupied units account for 1,175 (61.1%), while renter-occupied units make up 747 (38.9%).
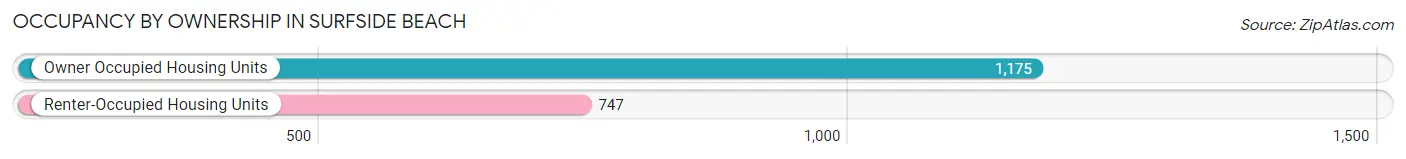
| Occupancy | # Housing Units | % Housing Units |
| Owner Occupied Housing Units | 1,175 | 61.1% |
| Renter-Occupied Housing Units | 747 | 38.9% |
| Total Occupied Housing Units | 1,922 | 100.0% |
Occupancy by Household Size in Surfside Beach
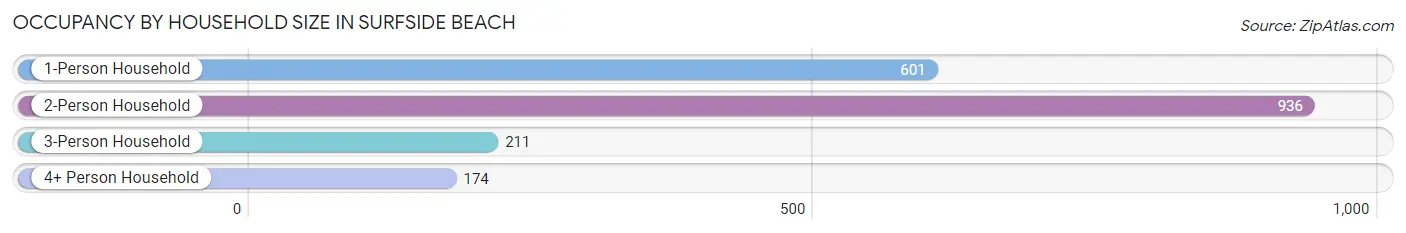
| Household Size | # Housing Units | % Housing Units |
| 1-Person Household | 601 | 31.3% |
| 2-Person Household | 936 | 48.7% |
| 3-Person Household | 211 | 11.0% |
| 4+ Person Household | 174 | 9.0% |
| Total Housing Units | 1,922 | 100.0% |
Occupancy by Ownership by Household Size in Surfside Beach
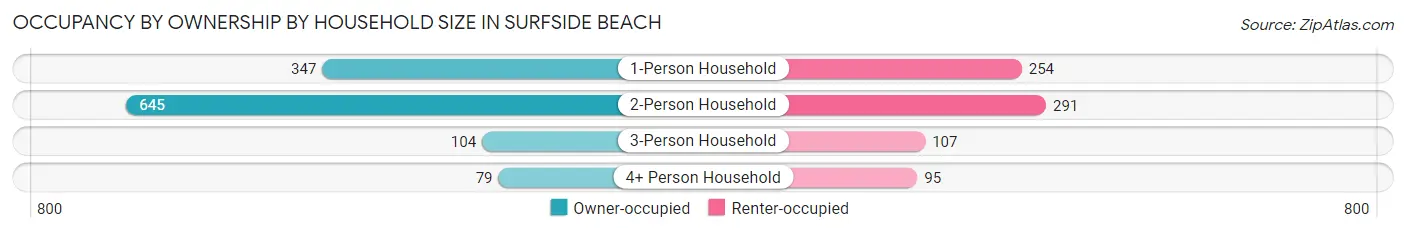
| Household Size | Owner-occupied | Renter-occupied |
| 1-Person Household | 347 (57.7%) | 254 (42.3%) |
| 2-Person Household | 645 (68.9%) | 291 (31.1%) |
| 3-Person Household | 104 (49.3%) | 107 (50.7%) |
| 4+ Person Household | 79 (45.4%) | 95 (54.6%) |
| Total Housing Units | 1,175 (61.1%) | 747 (38.9%) |
Occupancy by Educational Attainment in Surfside Beach
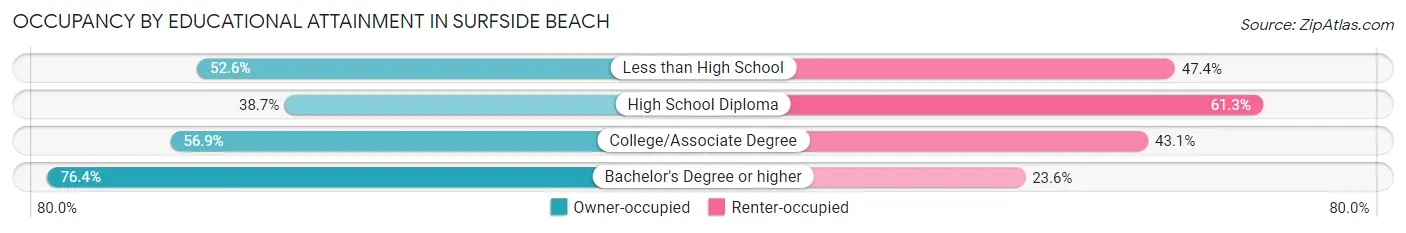
| Household Size | Owner-occupied | Renter-occupied |
| Less than High School | 10 (52.6%) | 9 (47.4%) |
| High School Diploma | 159 (38.7%) | 252 (61.3%) |
| College/Associate Degree | 389 (56.9%) | 295 (43.1%) |
| Bachelor's Degree or higher | 617 (76.4%) | 191 (23.6%) |
Occupancy by Age of Householder in Surfside Beach
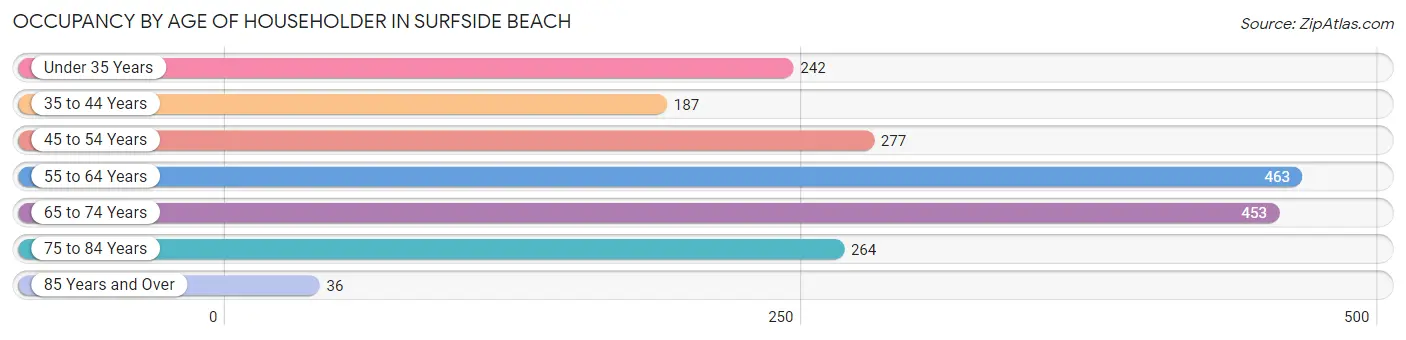
| Age Bracket | # Households | % Households |
| Under 35 Years | 242 | 12.6% |
| 35 to 44 Years | 187 | 9.7% |
| 45 to 54 Years | 277 | 14.4% |
| 55 to 64 Years | 463 | 24.1% |
| 65 to 74 Years | 453 | 23.6% |
| 75 to 84 Years | 264 | 13.7% |
| 85 Years and Over | 36 | 1.9% |
| Total | 1,922 | 100.0% |
Housing Finances in Surfside Beach
Median Income by Occupancy in Surfside Beach
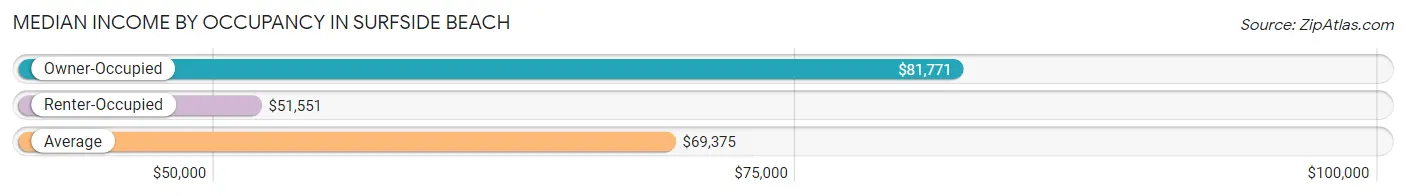
| Occupancy Type | # Households | Median Income |
| Owner-Occupied | 1,175 (61.1%) | $81,771 |
| Renter-Occupied | 747 (38.9%) | $51,551 |
| Average | 1,922 (100.0%) | $69,375 |
Occupancy by Householder Income Bracket in Surfside Beach
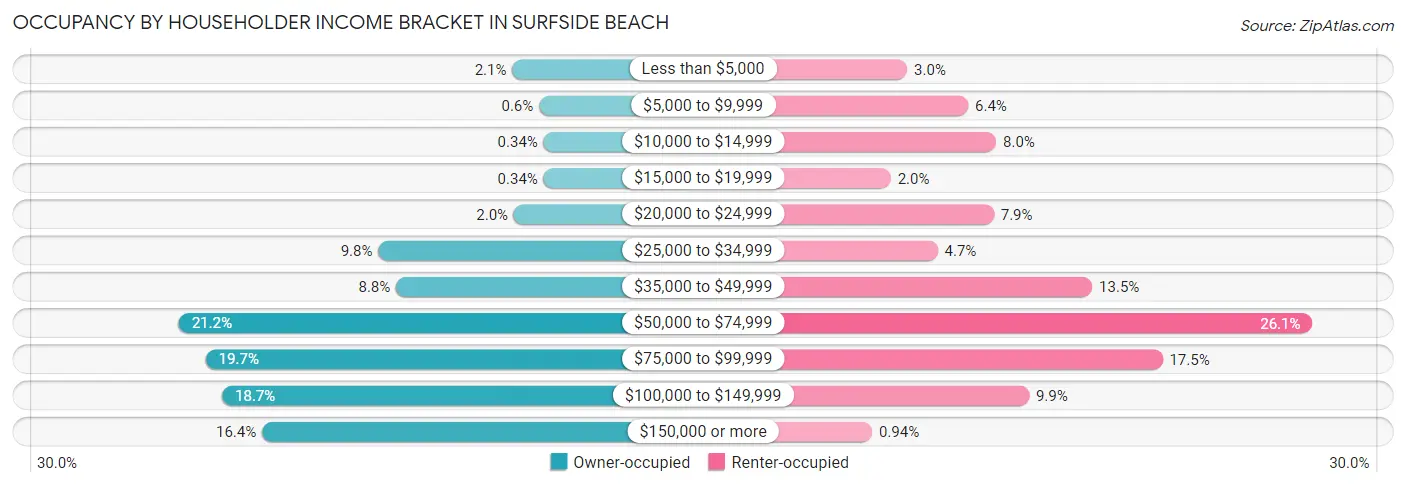
| Income Bracket | Owner-occupied | Renter-occupied |
| Less than $5,000 | 25 (2.1%) | 22 (2.9%) |
| $5,000 to $9,999 | 7 (0.6%) | 48 (6.4%) |
| $10,000 to $14,999 | 4 (0.3%) | 60 (8.0%) |
| $15,000 to $19,999 | 4 (0.3%) | 15 (2.0%) |
| $20,000 to $24,999 | 24 (2.0%) | 59 (7.9%) |
| $25,000 to $34,999 | 115 (9.8%) | 35 (4.7%) |
| $35,000 to $49,999 | 103 (8.8%) | 101 (13.5%) |
| $50,000 to $74,999 | 249 (21.2%) | 195 (26.1%) |
| $75,000 to $99,999 | 231 (19.7%) | 131 (17.5%) |
| $100,000 to $149,999 | 220 (18.7%) | 74 (9.9%) |
| $150,000 or more | 193 (16.4%) | 7 (0.9%) |
| Total | 1,175 (100.0%) | 747 (100.0%) |
Monthly Housing Cost Tiers in Surfside Beach
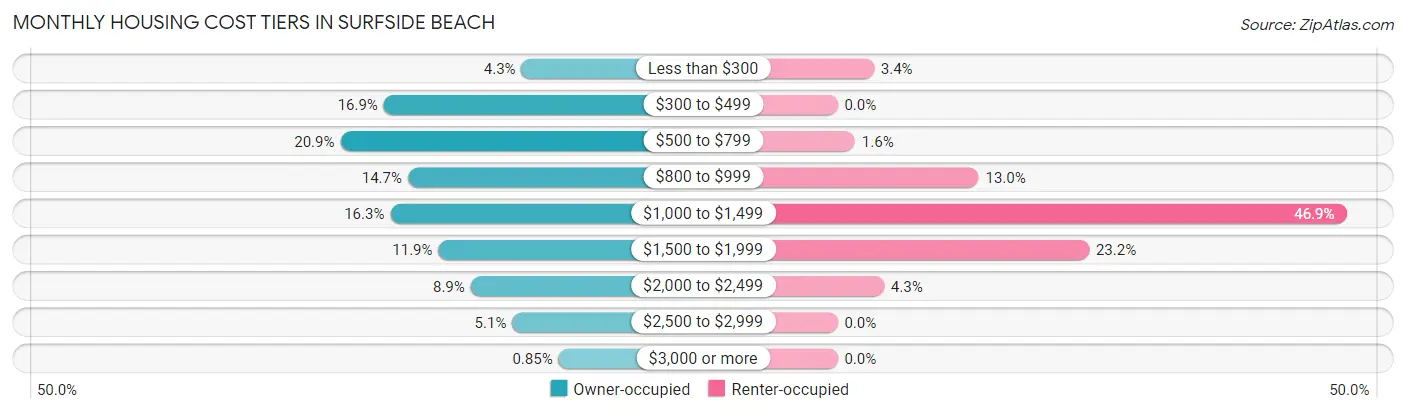
| Monthly Cost | Owner-occupied | Renter-occupied |
| Less than $300 | 50 (4.3%) | 25 (3.4%) |
| $300 to $499 | 199 (16.9%) | 0 (0.0%) |
| $500 to $799 | 246 (20.9%) | 12 (1.6%) |
| $800 to $999 | 173 (14.7%) | 97 (13.0%) |
| $1,000 to $1,499 | 192 (16.3%) | 350 (46.9%) |
| $1,500 to $1,999 | 140 (11.9%) | 173 (23.2%) |
| $2,000 to $2,499 | 105 (8.9%) | 32 (4.3%) |
| $2,500 to $2,999 | 60 (5.1%) | 0 (0.0%) |
| $3,000 or more | 10 (0.9%) | 0 (0.0%) |
| Total | 1,175 (100.0%) | 747 (100.0%) |
Physical Housing Characteristics in Surfside Beach
Housing Structures in Surfside Beach
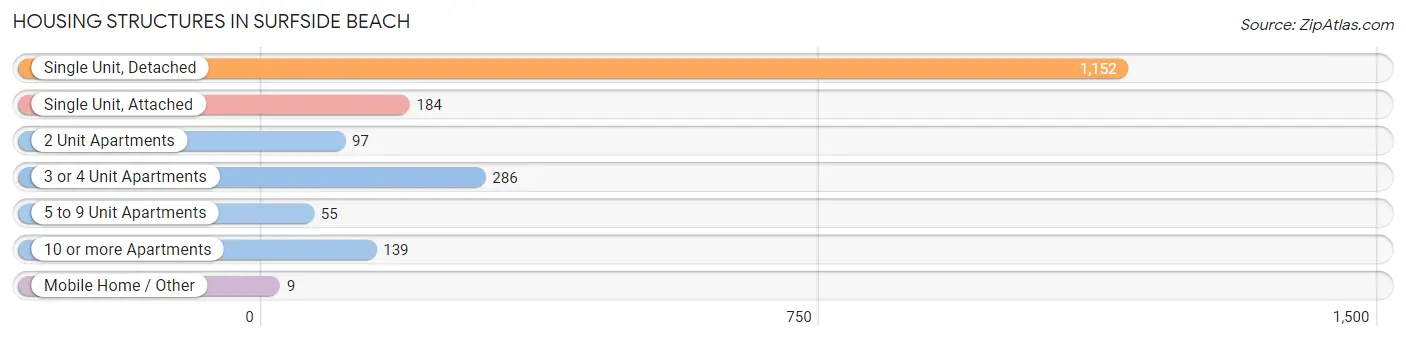
| Structure Type | # Housing Units | % Housing Units |
| Single Unit, Detached | 1,152 | 59.9% |
| Single Unit, Attached | 184 | 9.6% |
| 2 Unit Apartments | 97 | 5.1% |
| 3 or 4 Unit Apartments | 286 | 14.9% |
| 5 to 9 Unit Apartments | 55 | 2.9% |
| 10 or more Apartments | 139 | 7.2% |
| Mobile Home / Other | 9 | 0.5% |
| Total | 1,922 | 100.0% |
Housing Structures by Occupancy in Surfside Beach
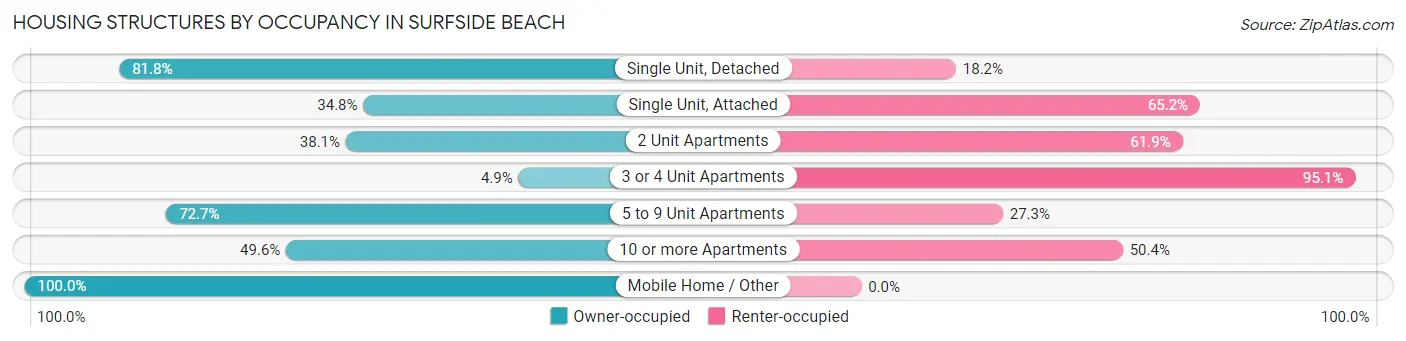
| Structure Type | Owner-occupied | Renter-occupied |
| Single Unit, Detached | 942 (81.8%) | 210 (18.2%) |
| Single Unit, Attached | 64 (34.8%) | 120 (65.2%) |
| 2 Unit Apartments | 37 (38.1%) | 60 (61.9%) |
| 3 or 4 Unit Apartments | 14 (4.9%) | 272 (95.1%) |
| 5 to 9 Unit Apartments | 40 (72.7%) | 15 (27.3%) |
| 10 or more Apartments | 69 (49.6%) | 70 (50.4%) |
| Mobile Home / Other | 9 (100.0%) | 0 (0.0%) |
| Total | 1,175 (61.1%) | 747 (38.9%) |
Housing Structures by Number of Rooms in Surfside Beach
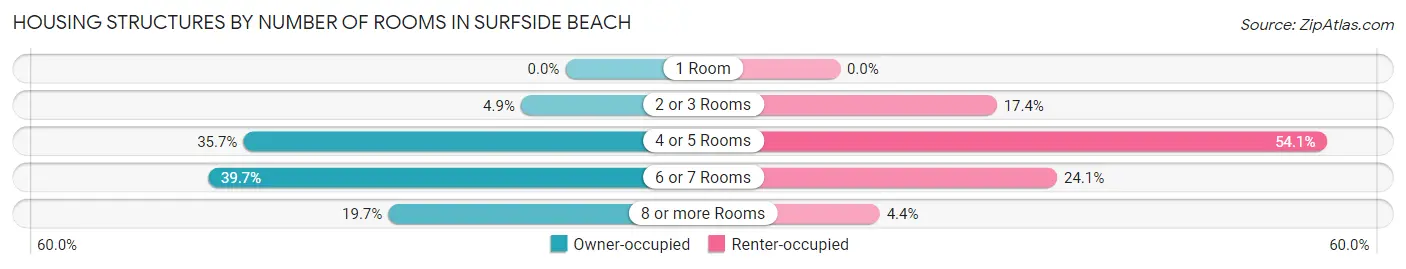
| Number of Rooms | Owner-occupied | Renter-occupied |
| 1 Room | 0 (0.0%) | 0 (0.0%) |
| 2 or 3 Rooms | 58 (4.9%) | 130 (17.4%) |
| 4 or 5 Rooms | 420 (35.7%) | 404 (54.1%) |
| 6 or 7 Rooms | 466 (39.7%) | 180 (24.1%) |
| 8 or more Rooms | 231 (19.7%) | 33 (4.4%) |
| Total | 1,175 (100.0%) | 747 (100.0%) |
Housing Structure by Heating Type in Surfside Beach
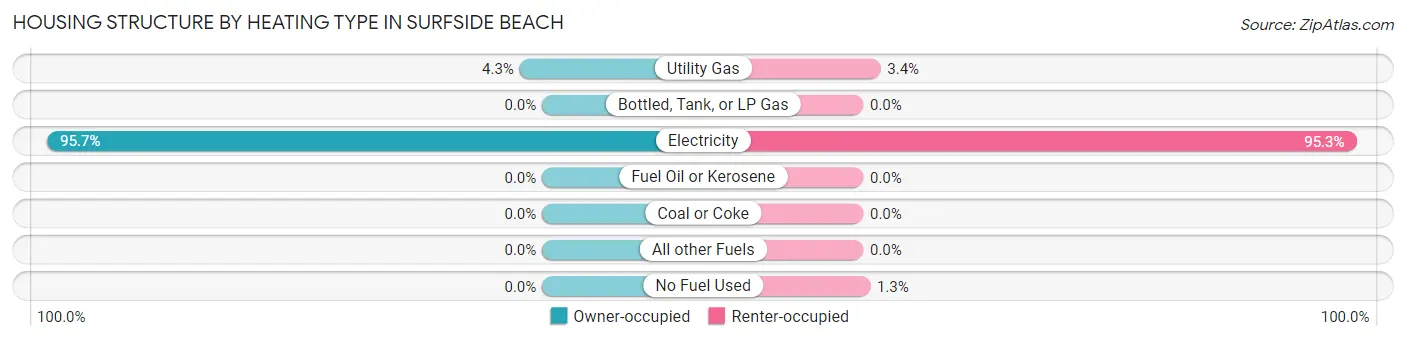
| Heating Type | Owner-occupied | Renter-occupied |
| Utility Gas | 51 (4.3%) | 25 (3.4%) |
| Bottled, Tank, or LP Gas | 0 (0.0%) | 0 (0.0%) |
| Electricity | 1,124 (95.7%) | 712 (95.3%) |
| Fuel Oil or Kerosene | 0 (0.0%) | 0 (0.0%) |
| Coal or Coke | 0 (0.0%) | 0 (0.0%) |
| All other Fuels | 0 (0.0%) | 0 (0.0%) |
| No Fuel Used | 0 (0.0%) | 10 (1.3%) |
| Total | 1,175 (100.0%) | 747 (100.0%) |
Household Vehicle Usage in Surfside Beach
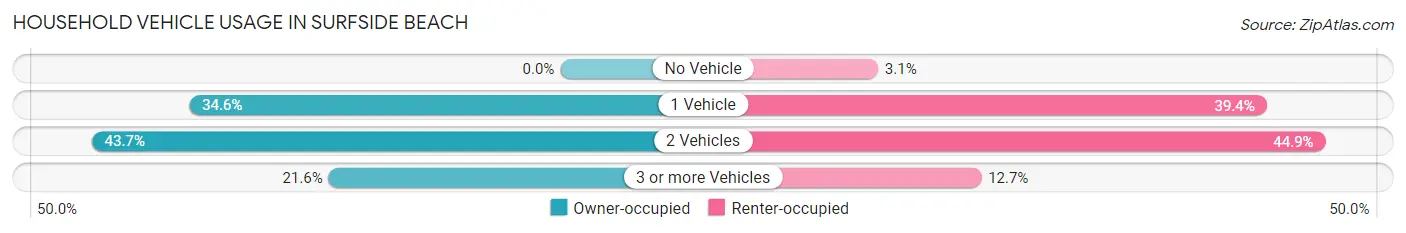
| Vehicles per Household | Owner-occupied | Renter-occupied |
| No Vehicle | 0 (0.0%) | 23 (3.1%) |
| 1 Vehicle | 407 (34.6%) | 294 (39.4%) |
| 2 Vehicles | 514 (43.7%) | 335 (44.9%) |
| 3 or more Vehicles | 254 (21.6%) | 95 (12.7%) |
| Total | 1,175 (100.0%) | 747 (100.0%) |
Real Estate & Mortgages in Surfside Beach
Real Estate and Mortgage Overview in Surfside Beach
| Characteristic | Without Mortgage | With Mortgage |
| Housing Units | 642 | 533 |
| Median Property Value | $363,400 | $368,700 |
| Median Household Income | $70,081 | $101 |
| Monthly Housing Costs | $581 | $10 |
| Real Estate Taxes | $1,309 | $13 |
Property Value by Mortgage Status in Surfside Beach
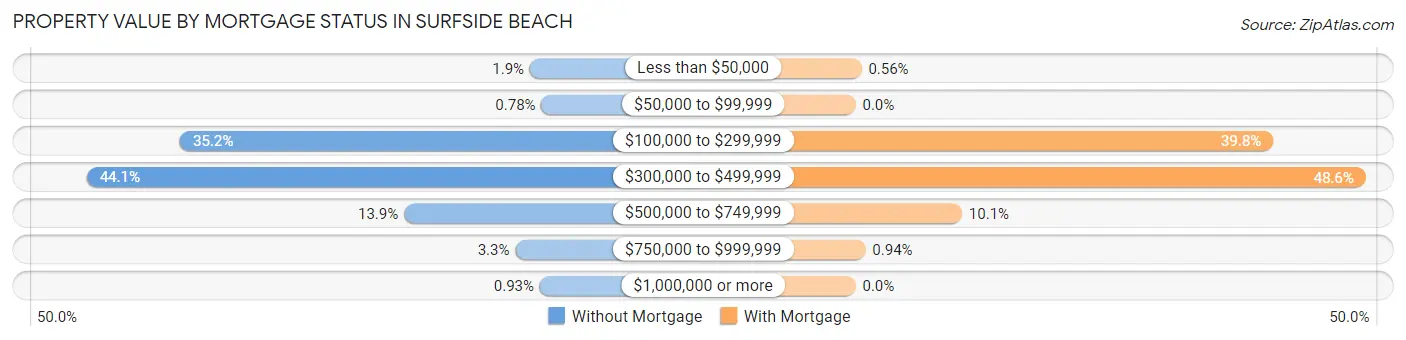
| Property Value | Without Mortgage | With Mortgage |
| Less than $50,000 | 12 (1.9%) | 3 (0.6%) |
| $50,000 to $99,999 | 5 (0.8%) | 0 (0.0%) |
| $100,000 to $299,999 | 226 (35.2%) | 212 (39.8%) |
| $300,000 to $499,999 | 283 (44.1%) | 259 (48.6%) |
| $500,000 to $749,999 | 89 (13.9%) | 54 (10.1%) |
| $750,000 to $999,999 | 21 (3.3%) | 5 (0.9%) |
| $1,000,000 or more | 6 (0.9%) | 0 (0.0%) |
| Total | 642 (100.0%) | 533 (100.0%) |
Household Income by Mortgage Status in Surfside Beach
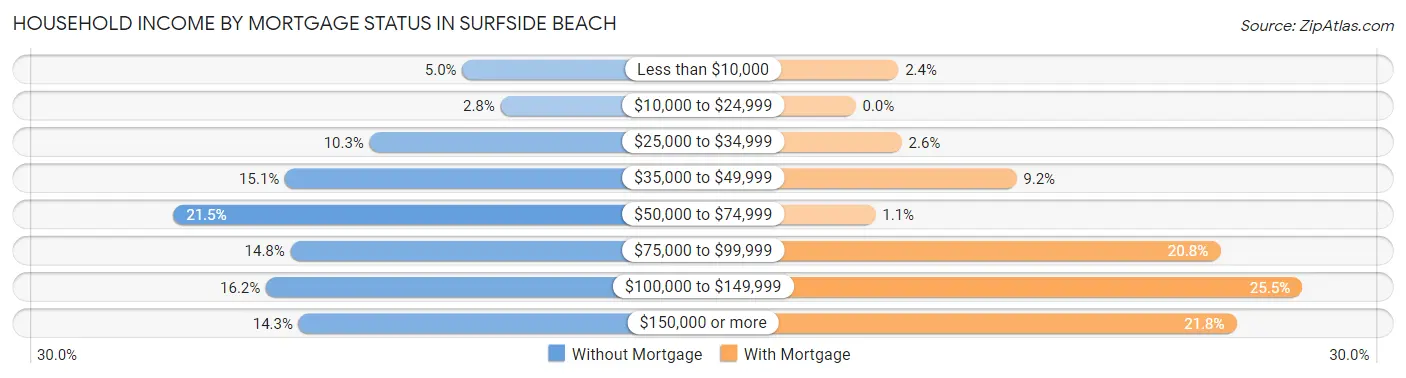
| Household Income | Without Mortgage | With Mortgage |
| Less than $10,000 | 32 (5.0%) | 13 (2.4%) |
| $10,000 to $24,999 | 18 (2.8%) | 0 (0.0%) |
| $25,000 to $34,999 | 66 (10.3%) | 14 (2.6%) |
| $35,000 to $49,999 | 97 (15.1%) | 49 (9.2%) |
| $50,000 to $74,999 | 138 (21.5%) | 6 (1.1%) |
| $75,000 to $99,999 | 95 (14.8%) | 111 (20.8%) |
| $100,000 to $149,999 | 104 (16.2%) | 136 (25.5%) |
| $150,000 or more | 92 (14.3%) | 116 (21.8%) |
| Total | 642 (100.0%) | 533 (100.0%) |
Property Value to Household Income Ratio in Surfside Beach
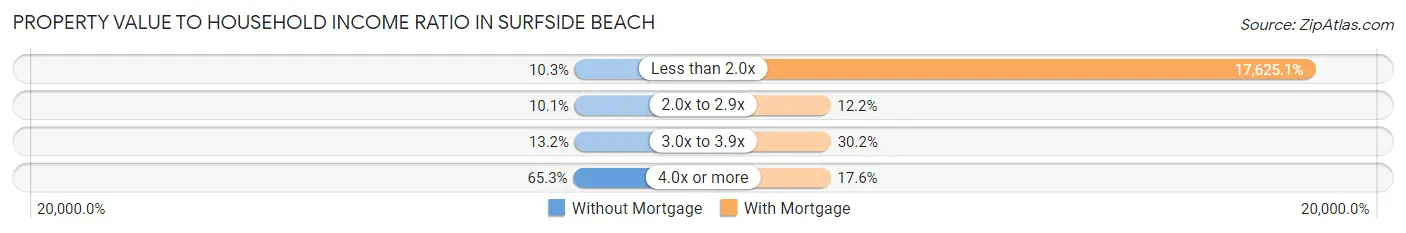
| Value-to-Income Ratio | Without Mortgage | With Mortgage |
| Less than 2.0x | 66 (10.3%) | 93,942 (17,625.1%) |
| 2.0x to 2.9x | 65 (10.1%) | 65 (12.2%) |
| 3.0x to 3.9x | 85 (13.2%) | 161 (30.2%) |
| 4.0x or more | 419 (65.3%) | 94 (17.6%) |
| Total | 642 (100.0%) | 533 (100.0%) |
Real Estate Taxes by Mortgage Status in Surfside Beach
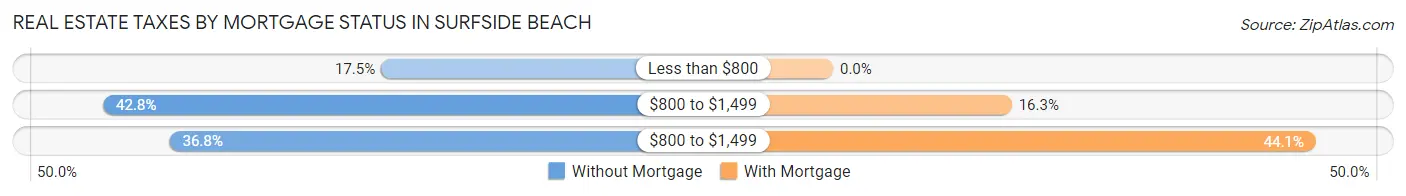
| Property Taxes | Without Mortgage | With Mortgage |
| Less than $800 | 112 (17.4%) | 0 (0.0%) |
| $800 to $1,499 | 275 (42.8%) | 87 (16.3%) |
| $800 to $1,499 | 236 (36.8%) | 235 (44.1%) |
| Total | 642 (100.0%) | 533 (100.0%) |
Health & Disability in Surfside Beach
Health Insurance Coverage by Age in Surfside Beach
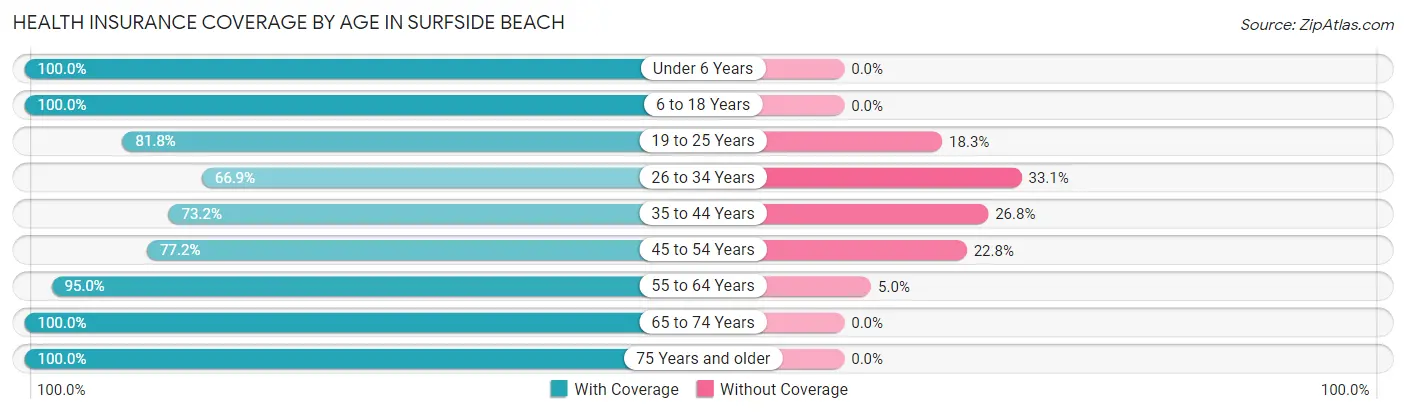
| Age Bracket | With Coverage | Without Coverage |
| Under 6 Years | 256 (100.0%) | 0 (0.0%) |
| 6 to 18 Years | 261 (100.0%) | 0 (0.0%) |
| 19 to 25 Years | 233 (81.8%) | 52 (18.2%) |
| 26 to 34 Years | 245 (66.9%) | 121 (33.1%) |
| 35 to 44 Years | 289 (73.2%) | 106 (26.8%) |
| 45 to 54 Years | 436 (77.2%) | 129 (22.8%) |
| 55 to 64 Years | 815 (95.0%) | 43 (5.0%) |
| 65 to 74 Years | 734 (100.0%) | 0 (0.0%) |
| 75 Years and older | 446 (100.0%) | 0 (0.0%) |
| Total | 3,715 (89.2%) | 451 (10.8%) |
Health Insurance Coverage by Citizenship Status in Surfside Beach
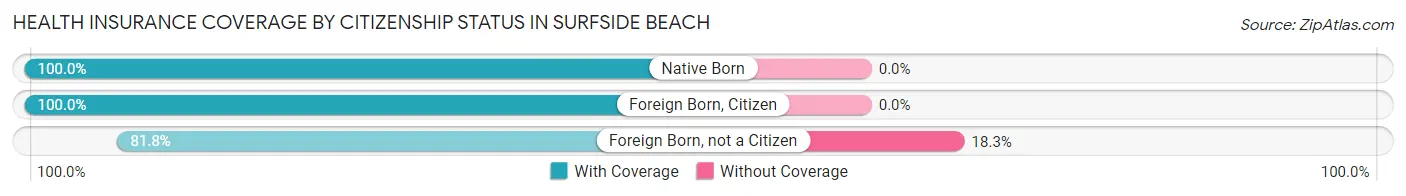
| Citizenship Status | With Coverage | Without Coverage |
| Native Born | 256 (100.0%) | 0 (0.0%) |
| Foreign Born, Citizen | 261 (100.0%) | 0 (0.0%) |
| Foreign Born, not a Citizen | 233 (81.8%) | 52 (18.2%) |
Health Insurance Coverage by Household Income in Surfside Beach
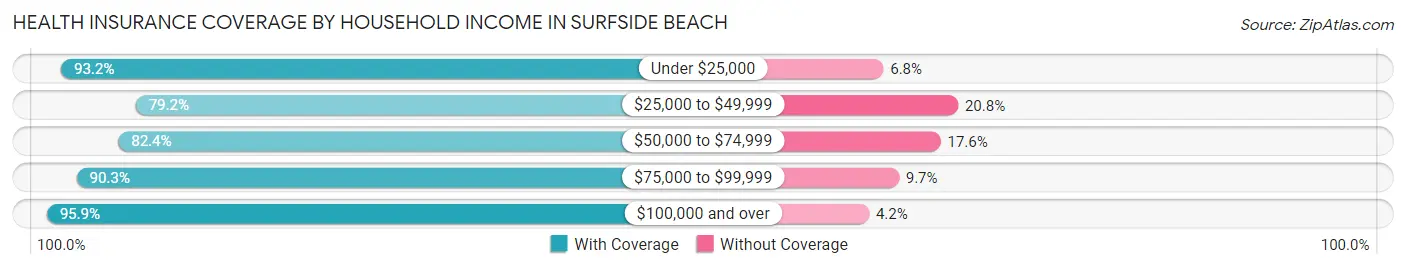
| Household Income | With Coverage | Without Coverage |
| Under $25,000 | 422 (93.2%) | 31 (6.8%) |
| $25,000 to $49,999 | 437 (79.2%) | 115 (20.8%) |
| $50,000 to $74,999 | 751 (82.4%) | 160 (17.6%) |
| $75,000 to $99,999 | 834 (90.3%) | 90 (9.7%) |
| $100,000 and over | 1,271 (95.9%) | 55 (4.2%) |
Public vs Private Health Insurance Coverage by Age in Surfside Beach
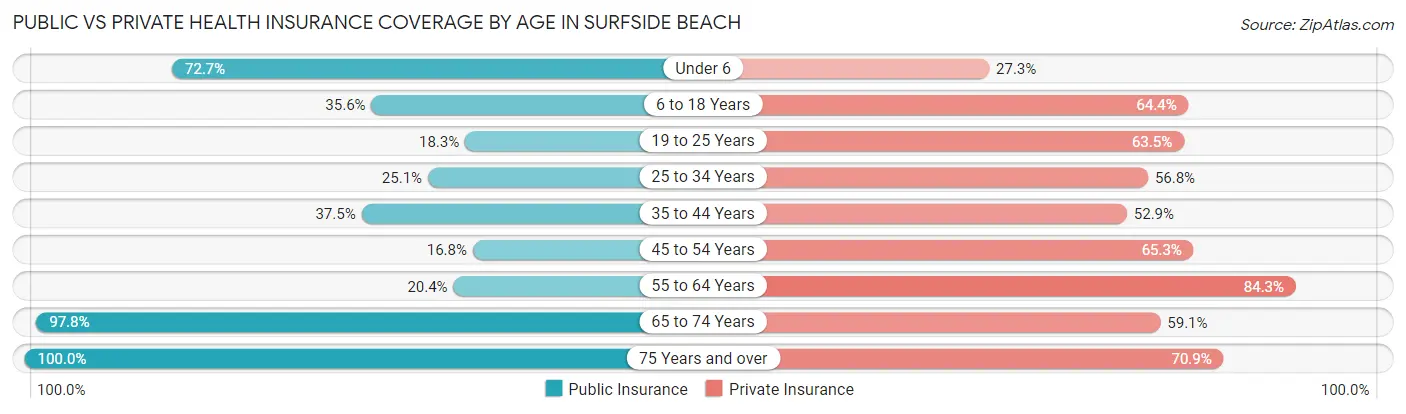
| Age Bracket | Public Insurance | Private Insurance |
| Under 6 | 186 (72.7%) | 70 (27.3%) |
| 6 to 18 Years | 93 (35.6%) | 168 (64.4%) |
| 19 to 25 Years | 52 (18.2%) | 181 (63.5%) |
| 25 to 34 Years | 92 (25.1%) | 208 (56.8%) |
| 35 to 44 Years | 148 (37.5%) | 209 (52.9%) |
| 45 to 54 Years | 95 (16.8%) | 369 (65.3%) |
| 55 to 64 Years | 175 (20.4%) | 723 (84.3%) |
| 65 to 74 Years | 718 (97.8%) | 434 (59.1%) |
| 75 Years and over | 446 (100.0%) | 316 (70.9%) |
| Total | 2,005 (48.1%) | 2,678 (64.3%) |
Disability Status by Sex by Age in Surfside Beach
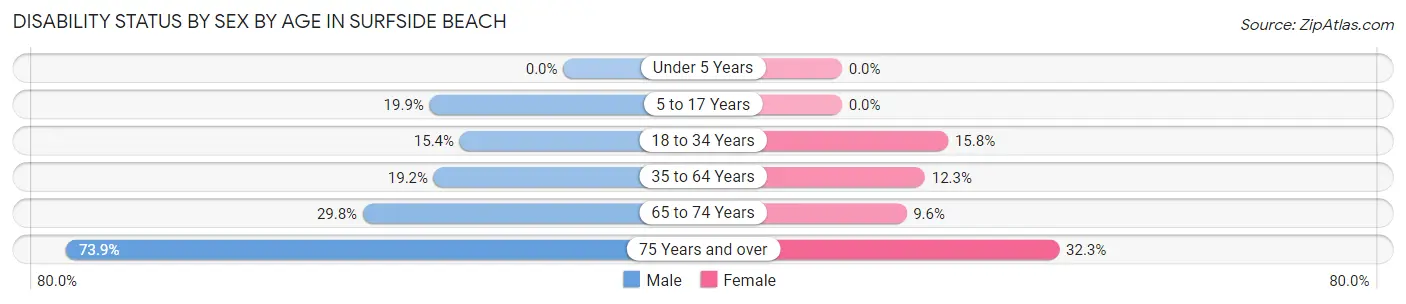
| Age Bracket | Male | Female |
| Under 5 Years | 0 (0.0%) | 0 (0.0%) |
| 5 to 17 Years | 26 (19.9%) | 0 (0.0%) |
| 18 to 34 Years | 61 (15.4%) | 44 (15.8%) |
| 35 to 64 Years | 164 (19.2%) | 119 (12.3%) |
| 65 to 74 Years | 122 (29.8%) | 31 (9.6%) |
| 75 Years and over | 144 (73.9%) | 81 (32.3%) |
Disability Class by Sex by Age in Surfside Beach
Disability Class: Hearing Difficulty
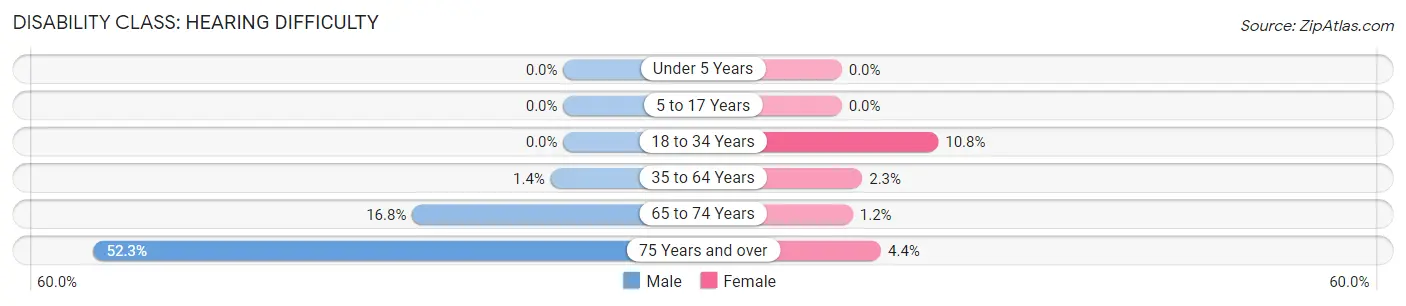
| Age Bracket | Male | Female |
| Under 5 Years | 0 (0.0%) | 0 (0.0%) |
| 5 to 17 Years | 0 (0.0%) | 0 (0.0%) |
| 18 to 34 Years | 0 (0.0%) | 30 (10.7%) |
| 35 to 64 Years | 12 (1.4%) | 22 (2.3%) |
| 65 to 74 Years | 69 (16.8%) | 4 (1.2%) |
| 75 Years and over | 102 (52.3%) | 11 (4.4%) |
Disability Class: Vision Difficulty
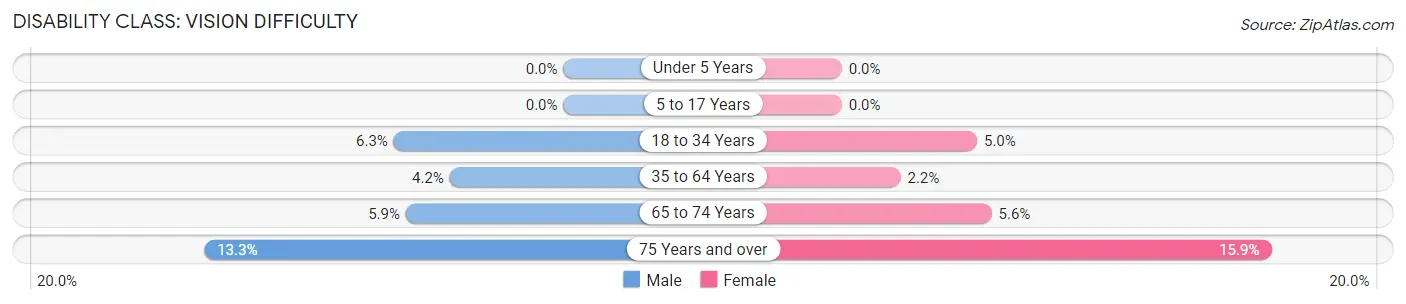
| Age Bracket | Male | Female |
| Under 5 Years | 0 (0.0%) | 0 (0.0%) |
| 5 to 17 Years | 0 (0.0%) | 0 (0.0%) |
| 18 to 34 Years | 25 (6.3%) | 14 (5.0%) |
| 35 to 64 Years | 36 (4.2%) | 21 (2.2%) |
| 65 to 74 Years | 24 (5.9%) | 18 (5.6%) |
| 75 Years and over | 26 (13.3%) | 40 (15.9%) |
Disability Class: Cognitive Difficulty
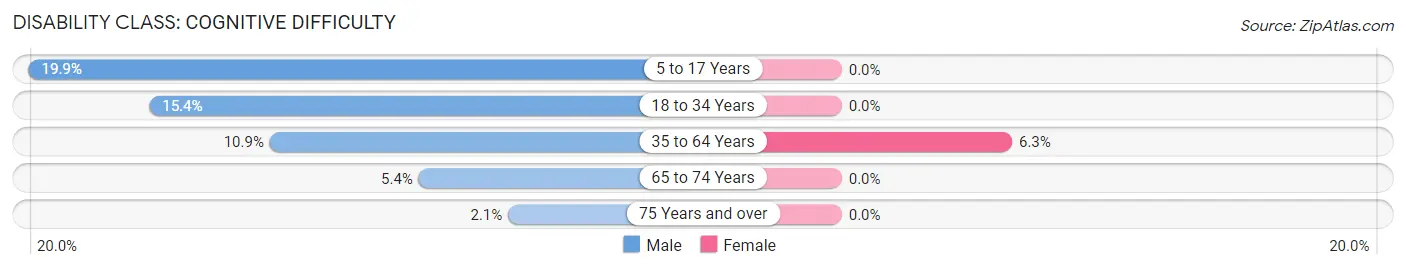
| Age Bracket | Male | Female |
| 5 to 17 Years | 26 (19.9%) | 0 (0.0%) |
| 18 to 34 Years | 61 (15.4%) | 0 (0.0%) |
| 35 to 64 Years | 93 (10.9%) | 61 (6.3%) |
| 65 to 74 Years | 22 (5.4%) | 0 (0.0%) |
| 75 Years and over | 4 (2.1%) | 0 (0.0%) |
Disability Class: Ambulatory Difficulty
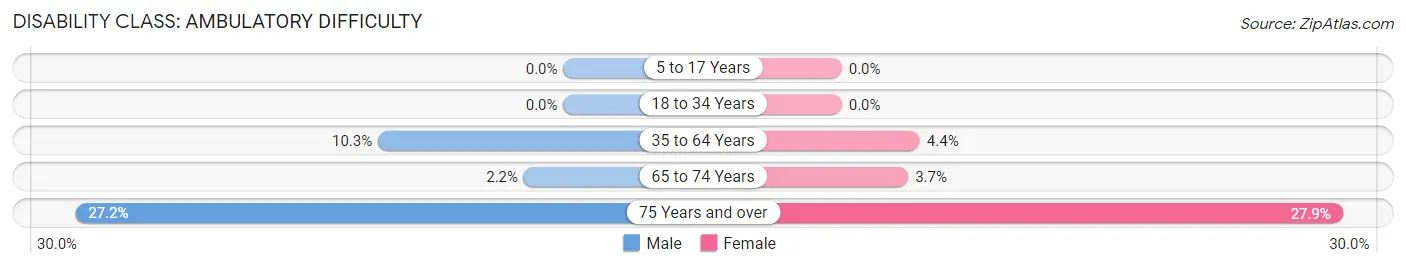
| Age Bracket | Male | Female |
| 5 to 17 Years | 0 (0.0%) | 0 (0.0%) |
| 18 to 34 Years | 0 (0.0%) | 0 (0.0%) |
| 35 to 64 Years | 88 (10.3%) | 42 (4.3%) |
| 65 to 74 Years | 9 (2.2%) | 12 (3.7%) |
| 75 Years and over | 53 (27.2%) | 70 (27.9%) |
Disability Class: Self-Care Difficulty
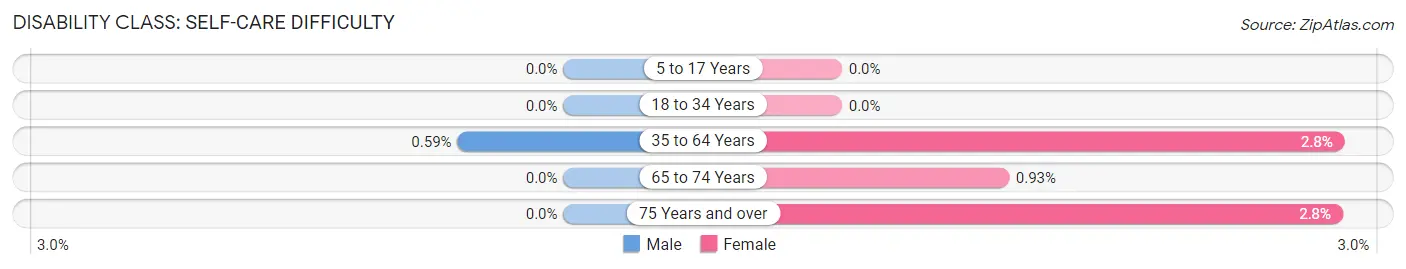
| Age Bracket | Male | Female |
| 5 to 17 Years | 0 (0.0%) | 0 (0.0%) |
| 18 to 34 Years | 0 (0.0%) | 0 (0.0%) |
| 35 to 64 Years | 5 (0.6%) | 27 (2.8%) |
| 65 to 74 Years | 0 (0.0%) | 3 (0.9%) |
| 75 Years and over | 0 (0.0%) | 7 (2.8%) |
Technology Access in Surfside Beach
Computing Device Access in Surfside Beach
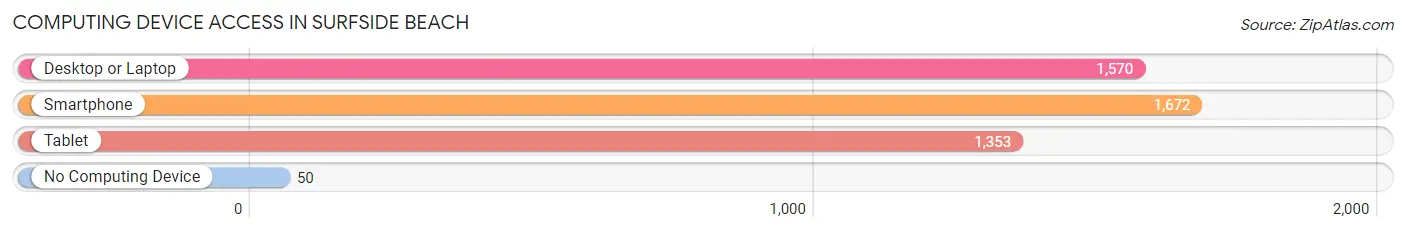
| Device Type | # Households | % Households |
| Desktop or Laptop | 1,570 | 81.7% |
| Smartphone | 1,672 | 87.0% |
| Tablet | 1,353 | 70.4% |
| No Computing Device | 50 | 2.6% |
| Total | 1,922 | 100.0% |
Internet Access in Surfside Beach
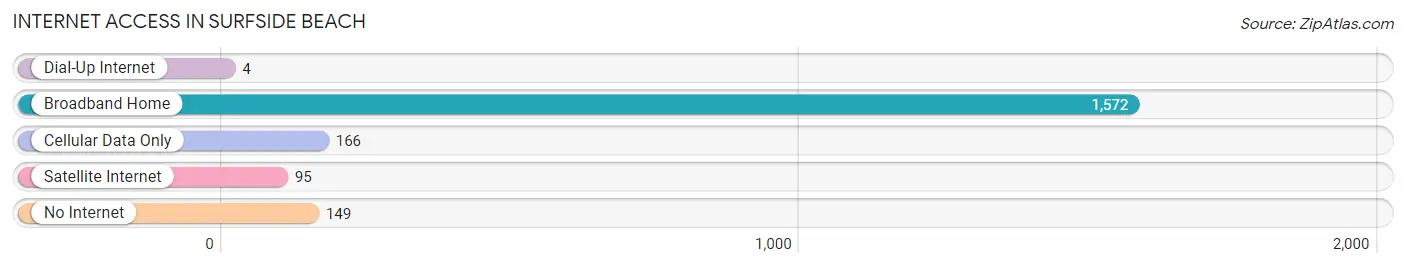
| Internet Type | # Households | % Households |
| Dial-Up Internet | 4 | 0.2% |
| Broadband Home | 1,572 | 81.8% |
| Cellular Data Only | 166 | 8.6% |
| Satellite Internet | 95 | 4.9% |
| No Internet | 149 | 7.7% |
| Total | 1,922 | 100.0% |
Surfside Beach Summary
Surfside Beach is a small town located in Horry County, South Carolina. It is situated on the Atlantic Ocean, just south of Myrtle Beach. The town has a population of approximately 4,000 people and is a popular tourist destination.
Geography
Surfside Beach is located in the Grand Strand region of South Carolina, which is a 60-mile stretch of beaches along the Atlantic Ocean. The town is situated on the northern end of the Grand Strand, just south of Myrtle Beach. The town is bordered by the Atlantic Ocean to the east, the Waccamaw River to the west, and the Intracoastal Waterway to the north. The town is approximately 4.5 square miles in size and is located at an elevation of 10 feet above sea level.
The climate in Surfside Beach is classified as humid subtropical, with hot, humid summers and mild winters. The average temperature in the summer is around 80 degrees Fahrenheit, while the average temperature in the winter is around 60 degrees Fahrenheit. The town receives an average of 48 inches of rain per year, with the majority of the rain falling in the summer months.
History
Surfside Beach was first settled in the early 1900s by a group of fishermen from the nearby town of Murrells Inlet. The town was originally known as “New Inlet” and was later renamed “Surfside Beach” in the 1930s. The town was incorporated in 1953 and has since become a popular tourist destination.
Economy
The economy of Surfside Beach is largely driven by tourism. The town is home to several hotels, restaurants, and other tourist attractions. The town also has a thriving fishing industry, with many local fishermen selling their catches to local restaurants and markets.
Demographics
As of the 2010 census, the population of Surfside Beach was 4,037. The racial makeup of the town was 94.3% White, 2.2% African American, 0.7% Native American, 0.7% Asian, 0.2% Pacific Islander, and 1.9% from two or more races. The median household income was $41,944, and the median family income was $50,944. The per capita income was $22,845.
Conclusion
Surfside Beach is a small town located in Horry County, South Carolina. It is situated on the Atlantic Ocean, just south of Myrtle Beach. The town has a population of approximately 4,000 people and is a popular tourist destination. The economy of Surfside Beach is largely driven by tourism, with many hotels, restaurants, and other tourist attractions. The town also has a thriving fishing industry. The racial makeup of the town is 94.3% White, 2.2% African American, 0.7% Native American, 0.7% Asian, 0.2% Pacific Islander, and 1.9% from two or more races. The median household income was $41,944, and the median family income was $50,944. The per capita income was $22,845.
Common Questions
What is Per Capita Income in Surfside Beach?
Per Capita income in Surfside Beach is $38,687.
What is the Median Family Income in Surfside Beach?
Median Family Income in Surfside Beach is $81,612.
What is the Median Household income in Surfside Beach?
Median Household Income in Surfside Beach is $69,375.
What is Income or Wage Gap in Surfside Beach?
Income or Wage Gap in Surfside Beach is 15.6%.
Women in Surfside Beach earn 84.4 cents for every dollar earned by a man.
What is Inequality or Gini Index in Surfside Beach?
Inequality or Gini Index in Surfside Beach is 0.38.
What is the Total Population of Surfside Beach?
Total Population of Surfside Beach is 4,179.
What is the Total Male Population of Surfside Beach?
Total Male Population of Surfside Beach is 2,218.
What is the Total Female Population of Surfside Beach?
Total Female Population of Surfside Beach is 1,961.
What is the Ratio of Males per 100 Females in Surfside Beach?
There are 113.11 Males per 100 Females in Surfside Beach.
What is the Ratio of Females per 100 Males in Surfside Beach?
There are 88.41 Females per 100 Males in Surfside Beach.
What is the Median Population Age in Surfside Beach?
Median Population Age in Surfside Beach is 53.6 Years.
What is the Average Family Size in Surfside Beach
Average Family Size in Surfside Beach is 2.7 People.
What is the Average Household Size in Surfside Beach
Average Household Size in Surfside Beach is 2.2 People.
How Large is the Labor Force in Surfside Beach?
There are 1,833 People in the Labor Forcein in Surfside Beach.
What is the Percentage of People in the Labor Force in Surfside Beach?
48.9% of People are in the Labor Force in Surfside Beach.
What is the Unemployment Rate in Surfside Beach?
Unemployment Rate in Surfside Beach is 8.3%.