James Island, SC Map & Demographics
James Island Map
James Island Overview
$46,843
PER CAPITA INCOME
$108,611
AVG FAMILY INCOME
$95,364
AVG HOUSEHOLD INCOME
14.2%
WAGE / INCOME GAP [ % ]
85.8¢/ $1
WAGE / INCOME GAP [ $ ]
0.39
INEQUALITY / GINI INDEX
11,689
TOTAL POPULATION
5,914
MALE POPULATION
5,775
FEMALE POPULATION
102.41
MALES / 100 FEMALES
97.65
FEMALES / 100 MALES
41.4
MEDIAN AGE
3.1
AVG FAMILY SIZE
2.6
AVG HOUSEHOLD SIZE
6,540
LABOR FORCE [ PEOPLE ]
68.6%
PERCENT IN LABOR FORCE
1.7%
UNEMPLOYMENT RATE
Income in James Island
Income Overview in James Island
Per Capita Income in James Island is $46,843, while median incomes of families and households are $108,611 and $95,364 respectively.
| Characteristic | Number | Measure |
| Per Capita Income | 11,689 | $46,843 |
| Median Family Income | 3,156 | $108,611 |
| Mean Family Income | 3,156 | $135,266 |
| Median Household Income | 4,422 | $95,364 |
| Mean Household Income | 4,422 | $120,203 |
| Income Deficit | 3,156 | $0 |
| Wage / Income Gap (%) | 11,689 | 14.22% |
| Wage / Income Gap ($) | 11,689 | 85.78¢ per $1 |
| Gini / Inequality Index | 11,689 | 0.39 |
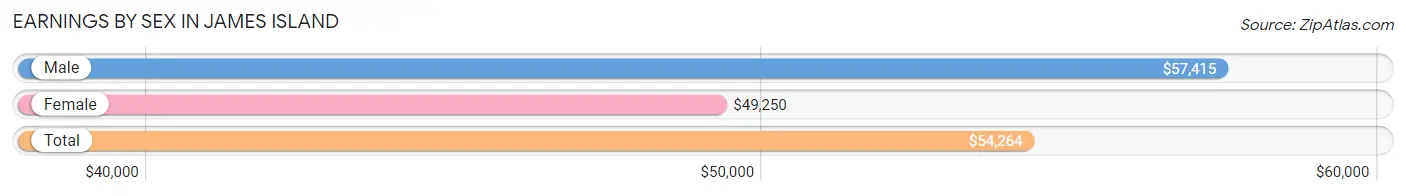
Earnings by Sex in James Island
Average Earnings in James Island are $54,264, $57,415 for men and $49,250 for women, a difference of 14.2%.
| Sex | Number | Average Earnings |
| Male | 3,519 (52.0%) | $57,415 |
| Female | 3,251 (48.0%) | $49,250 |
| Total | 6,770 (100.0%) | $54,264 |
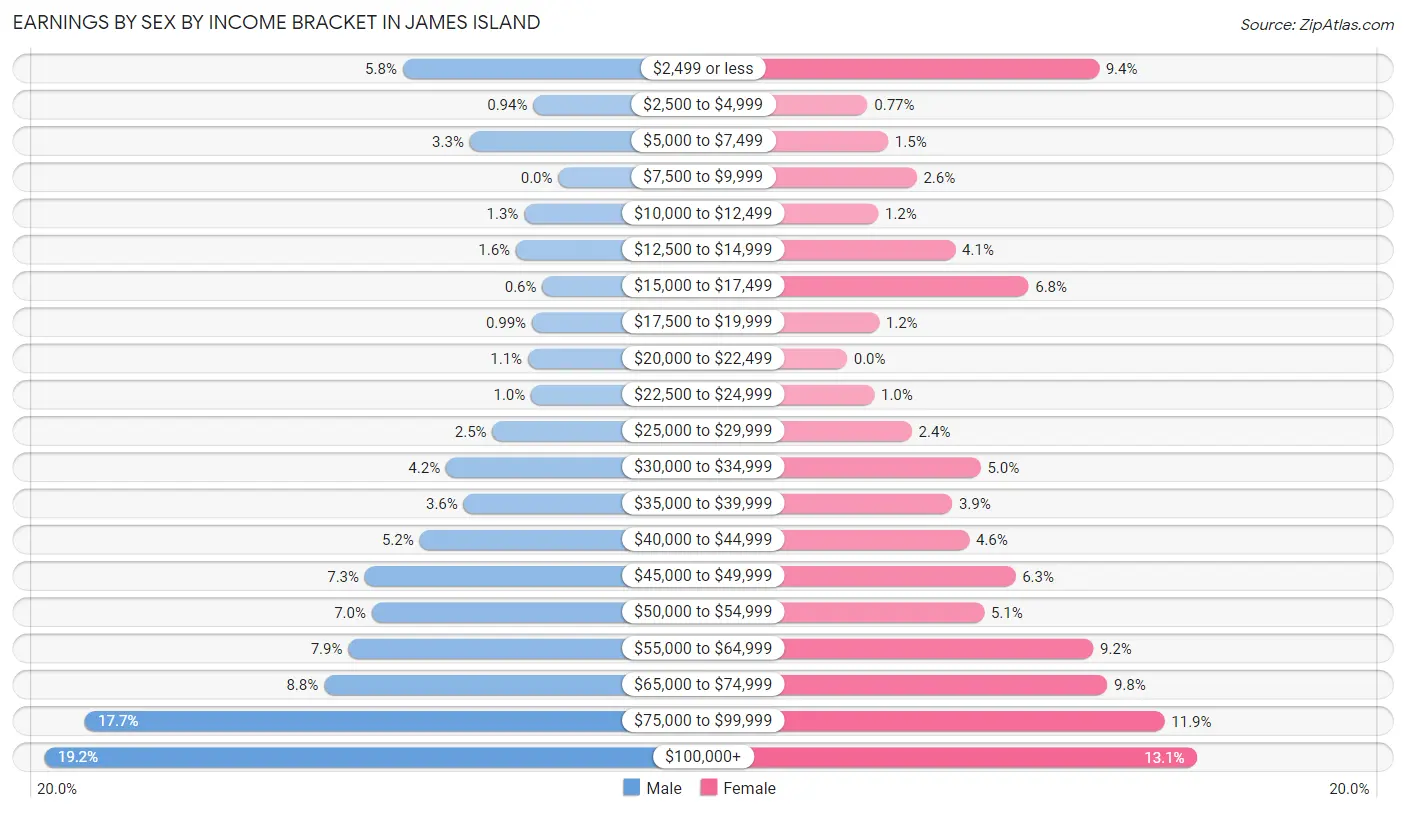
Earnings by Sex by Income Bracket in James Island
The most common earnings brackets in James Island are $100,000+ for men (677 | 19.2%) and $100,000+ for women (426 | 13.1%).
| Income | Male | Female |
| $2,499 or less | 205 (5.8%) | 307 (9.4%) |
| $2,500 to $4,999 | 33 (0.9%) | 25 (0.8%) |
| $5,000 to $7,499 | 117 (3.3%) | 50 (1.5%) |
| $7,500 to $9,999 | 0 (0.0%) | 85 (2.6%) |
| $10,000 to $12,499 | 45 (1.3%) | 38 (1.2%) |
| $12,500 to $14,999 | 56 (1.6%) | 132 (4.1%) |
| $15,000 to $17,499 | 21 (0.6%) | 221 (6.8%) |
| $17,500 to $19,999 | 35 (1.0%) | 39 (1.2%) |
| $20,000 to $22,499 | 40 (1.1%) | 0 (0.0%) |
| $22,500 to $24,999 | 36 (1.0%) | 33 (1.0%) |
| $25,000 to $29,999 | 87 (2.5%) | 79 (2.4%) |
| $30,000 to $34,999 | 148 (4.2%) | 163 (5.0%) |
| $35,000 to $39,999 | 125 (3.5%) | 128 (3.9%) |
| $40,000 to $44,999 | 183 (5.2%) | 149 (4.6%) |
| $45,000 to $49,999 | 255 (7.2%) | 205 (6.3%) |
| $50,000 to $54,999 | 246 (7.0%) | 167 (5.1%) |
| $55,000 to $64,999 | 277 (7.9%) | 300 (9.2%) |
| $65,000 to $74,999 | 309 (8.8%) | 317 (9.8%) |
| $75,000 to $99,999 | 624 (17.7%) | 387 (11.9%) |
| $100,000+ | 677 (19.2%) | 426 (13.1%) |
| Total | 3,519 (100.0%) | 3,251 (100.0%) |
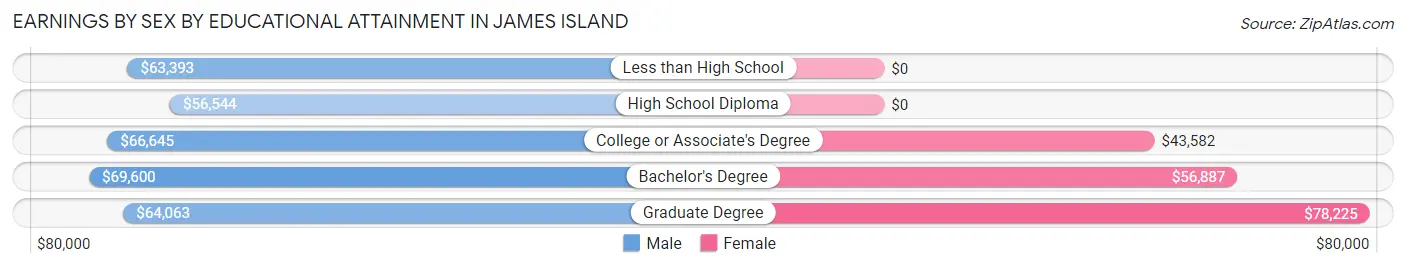
Earnings by Sex by Educational Attainment in James Island
Average earnings in James Island are $65,914 for men and $54,482 for women, a difference of 17.3%. Men with an educational attainment of bachelor's degree enjoy the highest average annual earnings of $69,600, while those with high school diploma education earn the least with $56,544. Women with an educational attainment of graduate degree earn the most with the average annual earnings of $78,225, while those with college or associate's degree education have the smallest earnings of $43,582.
| Educational Attainment | Male Income | Female Income |
| Less than High School | $63,393 | $0 |
| High School Diploma | $56,544 | $0 |
| College or Associate's Degree | $66,645 | $43,582 |
| Bachelor's Degree | $69,600 | $56,887 |
| Graduate Degree | $64,063 | $78,225 |
| Total | $65,914 | $54,482 |
Family Income in James Island
Family Income Brackets in James Island
According to the James Island family income data, there are 732 families falling into the $75,000 to $99,999 income range, which is the most common income bracket and makes up 23.2% of all families. Conversely, the less than $10,000 income bracket is the least frequent group with only 6 families (0.2%) belonging to this category.
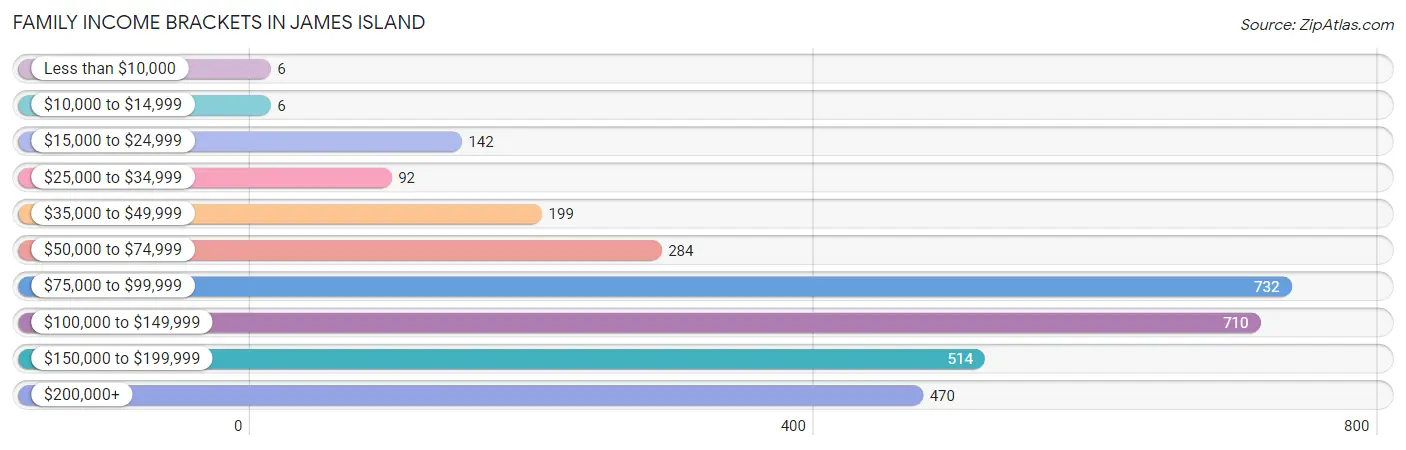
| Income Bracket | # Families | % Families |
| Less than $10,000 | 6 | 0.2% |
| $10,000 to $14,999 | 6 | 0.2% |
| $15,000 to $24,999 | 142 | 4.5% |
| $25,000 to $34,999 | 92 | 2.9% |
| $35,000 to $49,999 | 199 | 6.3% |
| $50,000 to $74,999 | 284 | 9.0% |
| $75,000 to $99,999 | 732 | 23.2% |
| $100,000 to $149,999 | 710 | 22.5% |
| $150,000 to $199,999 | 514 | 16.3% |
| $200,000+ | 470 | 14.9% |
Family Income by Famaliy Size in James Island
4-person families (618 | 19.6%) account for the highest median family income in James Island with $147,014 per family, while 2-person families (1,587 | 50.3%) have the highest median income of $45,390 per family member.
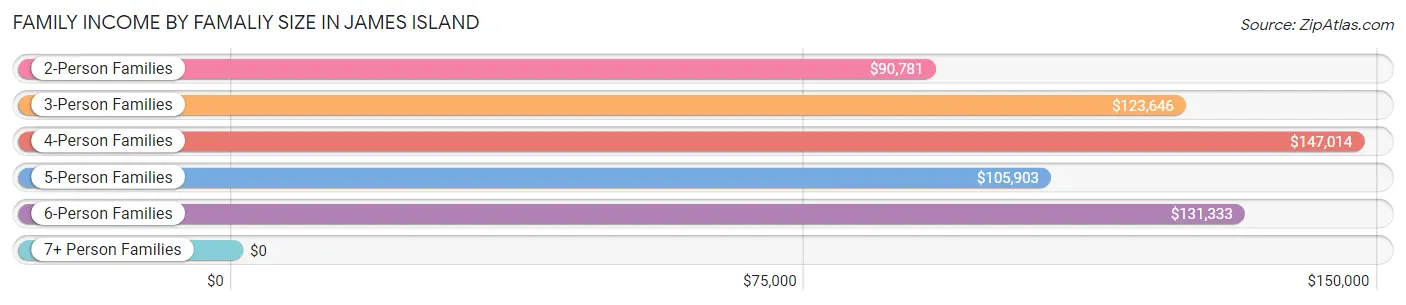
| Income Bracket | # Families | Median Income |
| 2-Person Families | 1,587 (50.3%) | $90,781 |
| 3-Person Families | 593 (18.8%) | $123,646 |
| 4-Person Families | 618 (19.6%) | $147,014 |
| 5-Person Families | 270 (8.6%) | $105,903 |
| 6-Person Families | 88 (2.8%) | $131,333 |
| 7+ Person Families | 0 (0.0%) | $0 |
| Total | 3,156 (100.0%) | $108,611 |
Family Income by Number of Earners in James Island
The median family income in James Island is $108,611, with families comprising 3+ earners (382) having the highest median family income of $178,952, while families with no earners (519) have the lowest median family income of $81,875, accounting for 12.1% and 16.4% of families, respectively.
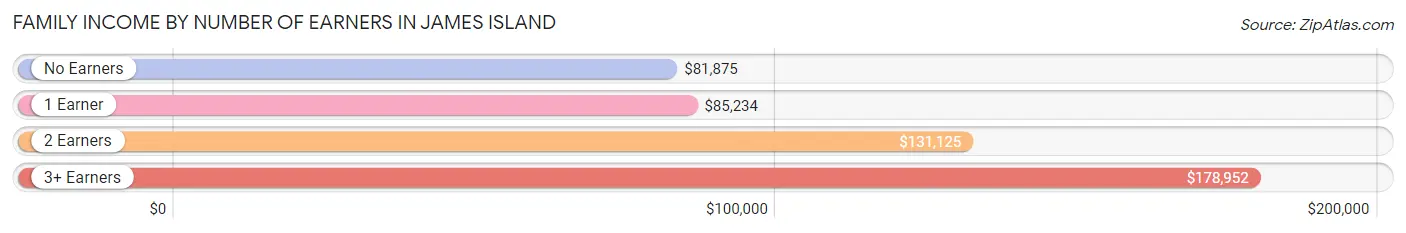
| Number of Earners | # Families | Median Income |
| No Earners | 519 (16.4%) | $81,875 |
| 1 Earner | 695 (22.0%) | $85,234 |
| 2 Earners | 1,560 (49.4%) | $131,125 |
| 3+ Earners | 382 (12.1%) | $178,952 |
| Total | 3,156 (100.0%) | $108,611 |
Household Income in James Island
Household Income Brackets in James Island
With 1,057 households falling in the category, the $75,000 to $99,999 income range is the most frequent in James Island, accounting for 23.9% of all households. In contrast, only 18 households (0.4%) fall into the $10,000 to $14,999 income bracket, making it the least populous group.
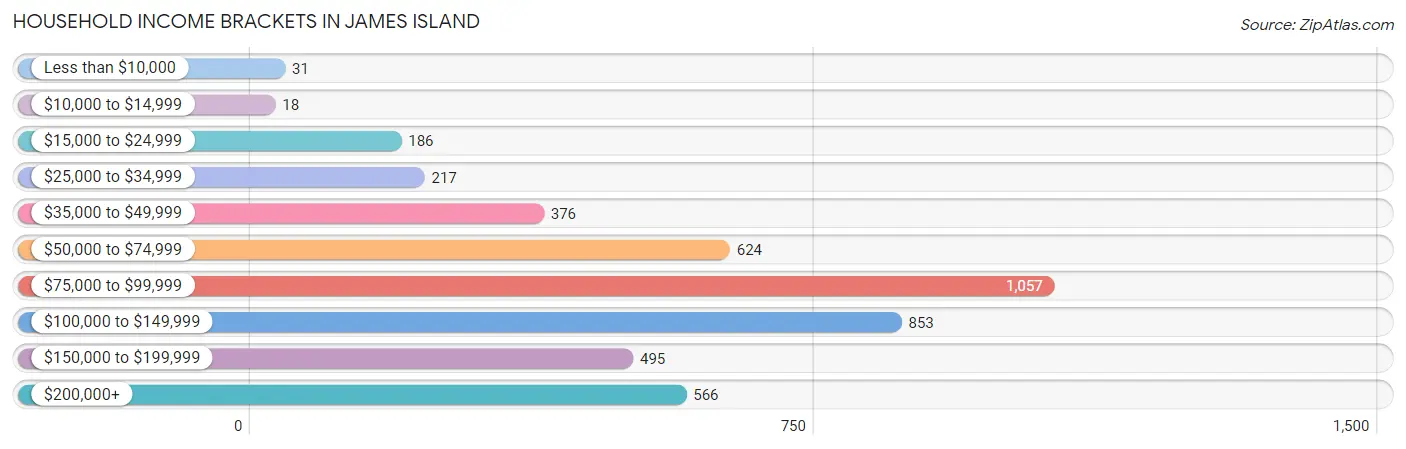
| Income Bracket | # Households | % Households |
| Less than $10,000 | 31 | 0.7% |
| $10,000 to $14,999 | 18 | 0.4% |
| $15,000 to $24,999 | 186 | 4.2% |
| $25,000 to $34,999 | 217 | 4.9% |
| $35,000 to $49,999 | 376 | 8.5% |
| $50,000 to $74,999 | 624 | 14.1% |
| $75,000 to $99,999 | 1,057 | 23.9% |
| $100,000 to $149,999 | 853 | 19.3% |
| $150,000 to $199,999 | 495 | 11.2% |
| $200,000+ | 566 | 12.8% |
Household Income by Householder Age in James Island
The median household income in James Island is $95,364, with the highest median household income of $106,701 found in the 25 to 44 years age bracket for the primary householder. A total of 1,555 households (35.2%) fall into this category.
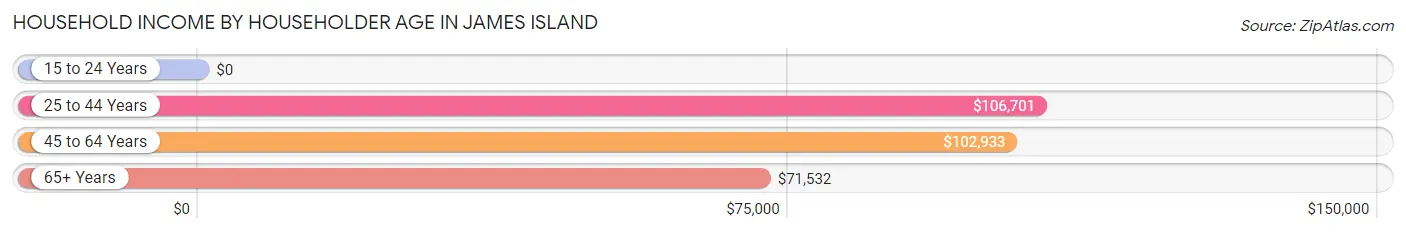
| Income Bracket | # Households | Median Income |
| 15 to 24 Years | 0 (0.0%) | $0 |
| 25 to 44 Years | 1,555 (35.2%) | $106,701 |
| 45 to 64 Years | 1,651 (37.3%) | $102,933 |
| 65+ Years | 1,216 (27.5%) | $71,532 |
| Total | 4,422 (100.0%) | $95,364 |
Poverty in James Island
Income Below Poverty by Sex and Age in James Island
With 3.2% poverty level for males and 5.1% for females among the residents of James Island, 15 year old males and 12 to 14 year old females are the most vulnerable to poverty, with 43 males (81.1%) and 40 females (22.1%) in their respective age groups living below the poverty level.
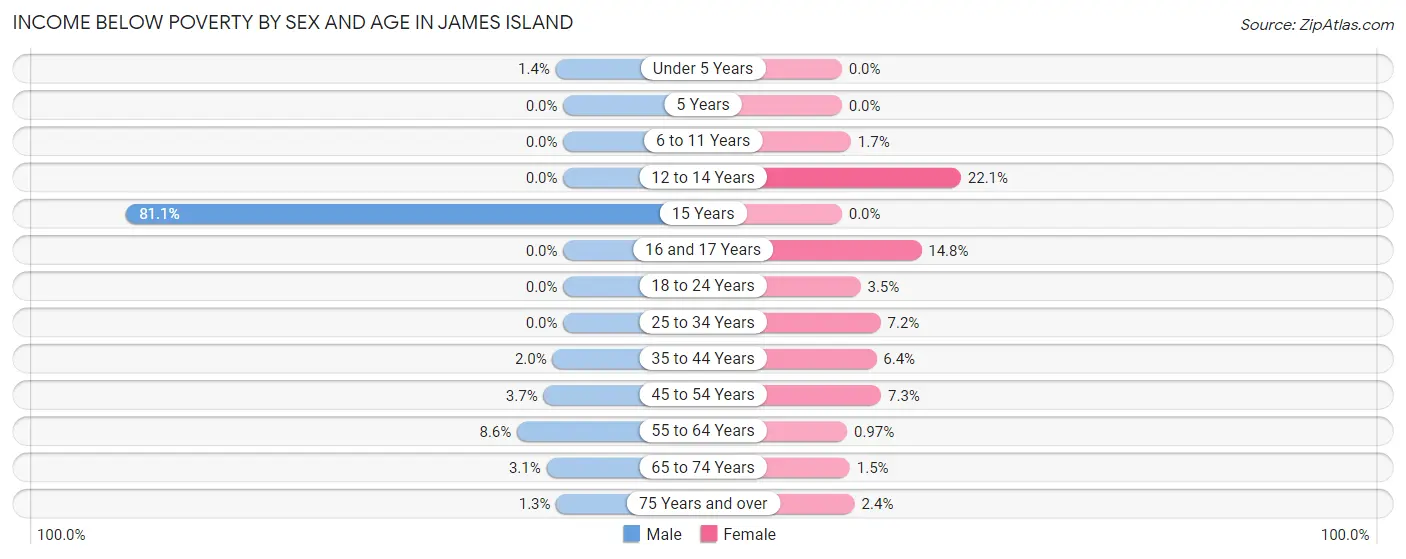
| Age Bracket | Male | Female |
| Under 5 Years | 6 (1.4%) | 0 (0.0%) |
| 5 Years | 0 (0.0%) | 0 (0.0%) |
| 6 to 11 Years | 0 (0.0%) | 6 (1.7%) |
| 12 to 14 Years | 0 (0.0%) | 40 (22.1%) |
| 15 Years | 43 (81.1%) | 0 (0.0%) |
| 16 and 17 Years | 0 (0.0%) | 40 (14.8%) |
| 18 to 24 Years | 0 (0.0%) | 8 (3.5%) |
| 25 to 34 Years | 0 (0.0%) | 41 (7.2%) |
| 35 to 44 Years | 24 (2.0%) | 62 (6.4%) |
| 45 to 54 Years | 39 (3.7%) | 66 (7.3%) |
| 55 to 64 Years | 57 (8.6%) | 7 (1.0%) |
| 65 to 74 Years | 16 (3.1%) | 8 (1.5%) |
| 75 Years and over | 5 (1.3%) | 15 (2.4%) |
| Total | 190 (3.2%) | 293 (5.1%) |
Income Above Poverty by Sex and Age in James Island
According to the poverty statistics in James Island, males aged 5 years and females aged under 5 years are the age groups that are most secure financially, with 100.0% of males and 100.0% of females in these age groups living above the poverty line.
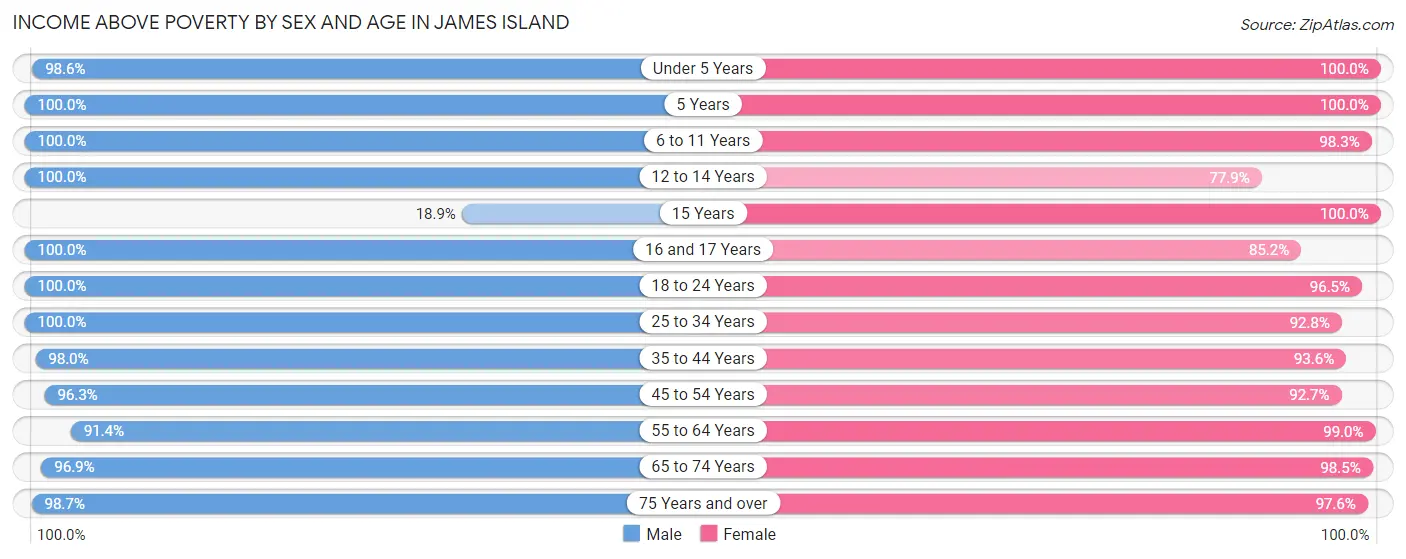
| Age Bracket | Male | Female |
| Under 5 Years | 417 (98.6%) | 210 (100.0%) |
| 5 Years | 102 (100.0%) | 140 (100.0%) |
| 6 to 11 Years | 482 (100.0%) | 348 (98.3%) |
| 12 to 14 Years | 144 (100.0%) | 141 (77.9%) |
| 15 Years | 10 (18.9%) | 66 (100.0%) |
| 16 and 17 Years | 89 (100.0%) | 231 (85.2%) |
| 18 to 24 Years | 299 (100.0%) | 222 (96.5%) |
| 25 to 34 Years | 499 (100.0%) | 528 (92.8%) |
| 35 to 44 Years | 1,177 (98.0%) | 903 (93.6%) |
| 45 to 54 Years | 1,018 (96.3%) | 839 (92.7%) |
| 55 to 64 Years | 607 (91.4%) | 711 (99.0%) |
| 65 to 74 Years | 497 (96.9%) | 526 (98.5%) |
| 75 Years and over | 380 (98.7%) | 612 (97.6%) |
| Total | 5,721 (96.8%) | 5,477 (94.9%) |
Income Below Poverty Among Married-Couple Families in James Island
The poverty statistics for married-couple families in James Island show that 2.5% or 69 of the total 2,708 families live below the poverty line. Families with no children have the highest poverty rate of 4.1%, comprising of 69 families. On the other hand, families with 1 or 2 children have the lowest poverty rate of 0.0%, which includes 0 families.
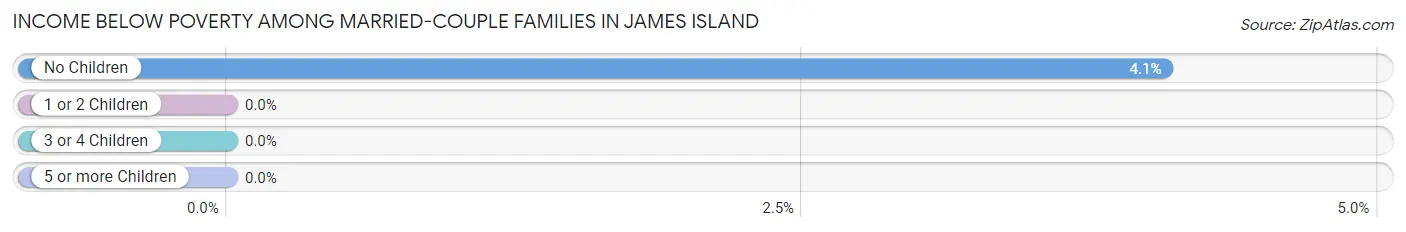
| Children | Above Poverty | Below Poverty |
| No Children | 1,625 (95.9%) | 69 (4.1%) |
| 1 or 2 Children | 832 (100.0%) | 0 (0.0%) |
| 3 or 4 Children | 182 (100.0%) | 0 (0.0%) |
| 5 or more Children | 0 (0.0%) | 0 (0.0%) |
| Total | 2,639 (97.5%) | 69 (2.5%) |
Income Below Poverty Among Single-Parent Households in James Island
According to the poverty data in James Island, 18.9% or 39 single-father households and 2.5% or 6 single-mother households are living below the poverty line. Among single-father households, those with 3 or 4 children have the highest poverty rate, with 39 households (100.0%) experiencing poverty. Likewise, among single-mother households, those with 1 or 2 children have the highest poverty rate, with 6 households (3.4%) falling below the poverty line.
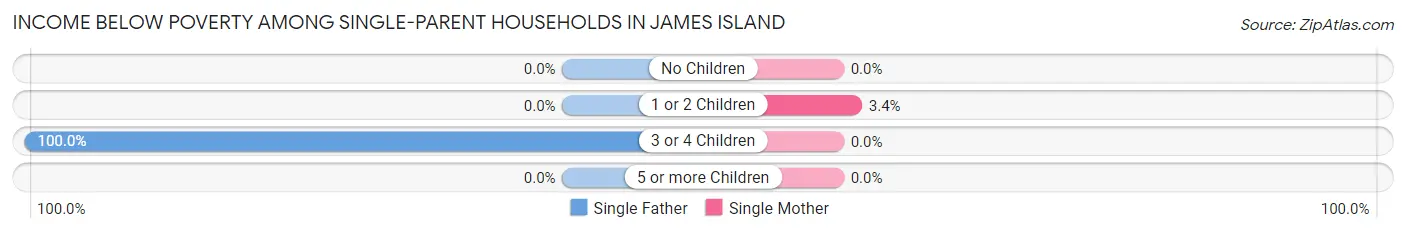
| Children | Single Father | Single Mother |
| No Children | 0 (0.0%) | 0 (0.0%) |
| 1 or 2 Children | 0 (0.0%) | 6 (3.4%) |
| 3 or 4 Children | 39 (100.0%) | 0 (0.0%) |
| 5 or more Children | 0 (0.0%) | 0 (0.0%) |
| Total | 39 (18.9%) | 6 (2.5%) |
Income Below Poverty Among Married-Couple vs Single-Parent Households in James Island
The poverty data for James Island shows that 69 of the married-couple family households (2.5%) and 45 of the single-parent households (10.0%) are living below the poverty level. Within the married-couple family households, those with no children have the highest poverty rate, with 69 households (4.1%) falling below the poverty line. Among the single-parent households, those with 3 or 4 children have the highest poverty rate, with 39 household (76.5%) living below poverty.
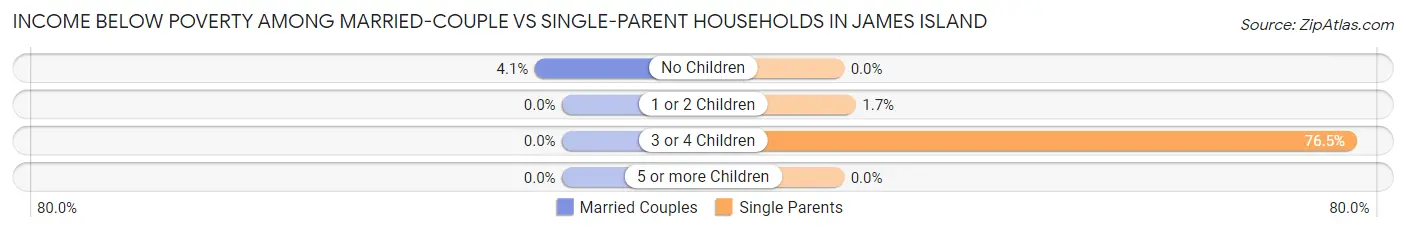
| Children | Married-Couple Families | Single-Parent Households |
| No Children | 69 (4.1%) | 0 (0.0%) |
| 1 or 2 Children | 0 (0.0%) | 6 (1.7%) |
| 3 or 4 Children | 0 (0.0%) | 39 (76.5%) |
| 5 or more Children | 0 (0.0%) | 0 (0.0%) |
| Total | 69 (2.5%) | 45 (10.0%) |
Race in James Island
The most populous races in James Island are White / Caucasian (9,944 | 85.1%), Black / African American (1,187 | 10.2%), and Two or more Races (384 | 3.3%).
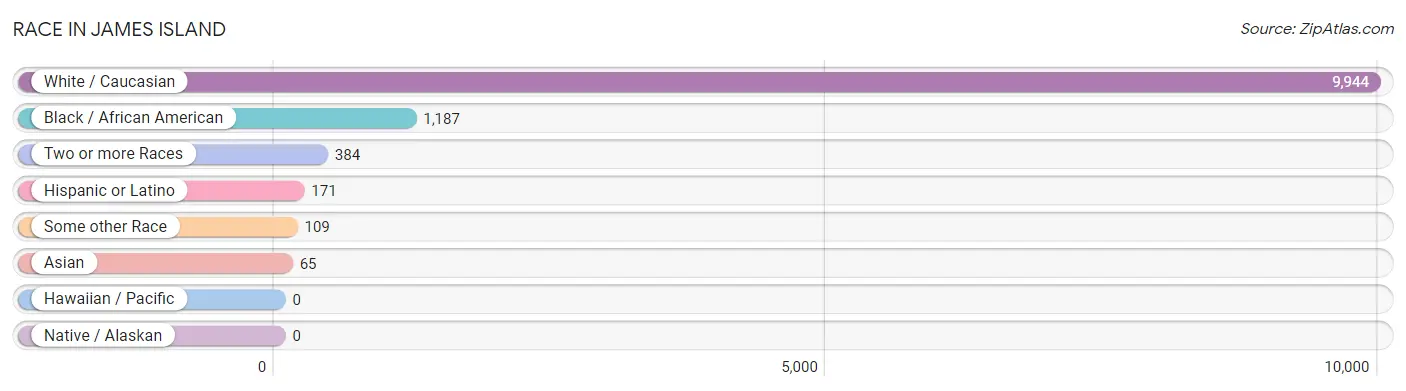
| Race | # Population | % Population |
| Asian | 65 | 0.6% |
| Black / African American | 1,187 | 10.2% |
| Hawaiian / Pacific | 0 | 0.0% |
| Hispanic or Latino | 171 | 1.5% |
| Native / Alaskan | 0 | 0.0% |
| White / Caucasian | 9,944 | 85.1% |
| Two or more Races | 384 | 3.3% |
| Some other Race | 109 | 0.9% |
| Total | 11,689 | 100.0% |
Ancestry in James Island
The most populous ancestries reported in James Island are English (2,134 | 18.3%), American (2,129 | 18.2%), Irish (1,654 | 14.1%), German (1,479 | 12.7%), and European (601 | 5.1%), together accounting for 68.4% of all James Island residents.
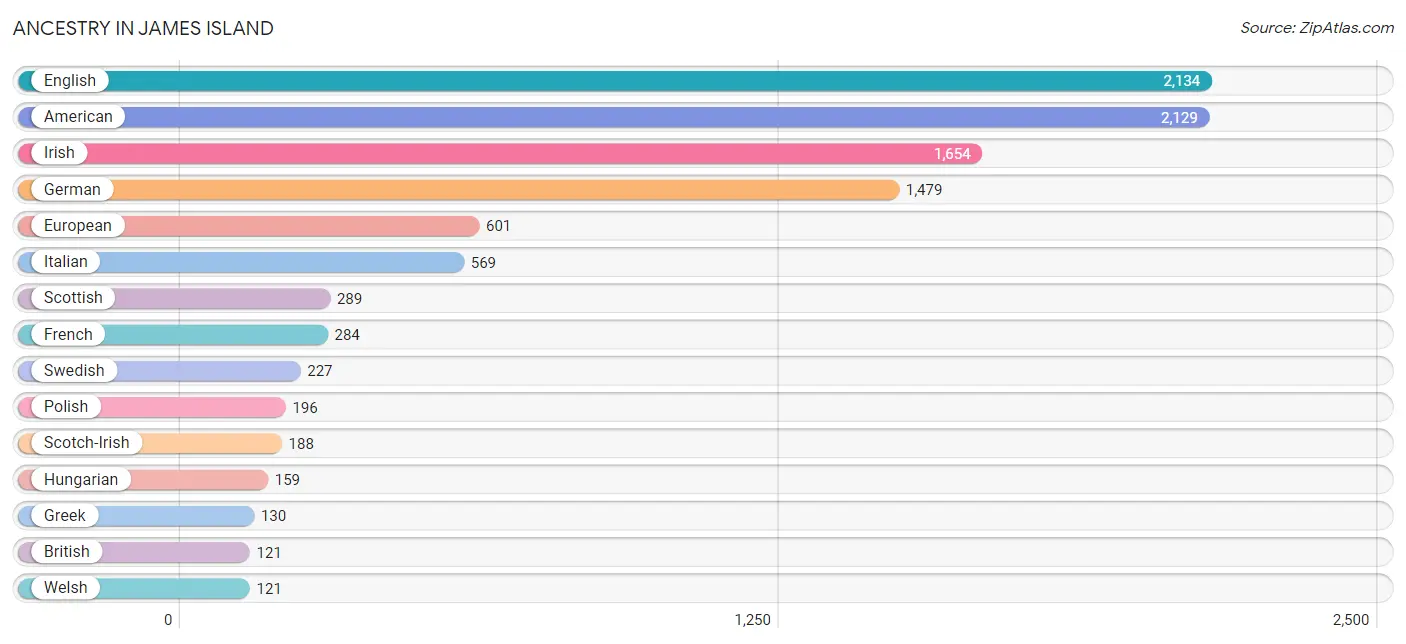
| Ancestry | # Population | % Population |
| American | 2,129 | 18.2% |
| Arab | 81 | 0.7% |
| Austrian | 20 | 0.2% |
| Belgian | 1 | 0.0% |
| British | 121 | 1.0% |
| Burmese | 36 | 0.3% |
| Canadian | 29 | 0.3% |
| Central American | 5 | 0.0% |
| Cherokee | 23 | 0.2% |
| Czech | 104 | 0.9% |
| Danish | 41 | 0.4% |
| Dutch | 113 | 1.0% |
| Eastern European | 57 | 0.5% |
| Ecuadorian | 15 | 0.1% |
| English | 2,134 | 18.3% |
| European | 601 | 5.1% |
| Finnish | 53 | 0.4% |
| French | 284 | 2.4% |
| French Canadian | 40 | 0.3% |
| German | 1,479 | 12.7% |
| Greek | 130 | 1.1% |
| Guamanian / Chamorro | 9 | 0.1% |
| Guatemalan | 4 | 0.0% |
| Hungarian | 159 | 1.4% |
| Indian (Asian) | 25 | 0.2% |
| Irish | 1,654 | 14.1% |
| Italian | 569 | 4.9% |
| Korean | 72 | 0.6% |
| Lebanese | 30 | 0.3% |
| Lithuanian | 30 | 0.3% |
| Mexican | 65 | 0.6% |
| Nicaraguan | 1 | 0.0% |
| Northern European | 52 | 0.4% |
| Norwegian | 44 | 0.4% |
| Polish | 196 | 1.7% |
| Portuguese | 31 | 0.3% |
| Puerto Rican | 4 | 0.0% |
| Romanian | 13 | 0.1% |
| Russian | 27 | 0.2% |
| Scandinavian | 35 | 0.3% |
| Scotch-Irish | 188 | 1.6% |
| Scottish | 289 | 2.5% |
| Slovak | 26 | 0.2% |
| Slovene | 49 | 0.4% |
| South American | 15 | 0.1% |
| Spanish | 82 | 0.7% |
| Swedish | 227 | 1.9% |
| Swiss | 11 | 0.1% |
| Syrian | 51 | 0.4% |
| Thai | 19 | 0.2% |
| Welsh | 121 | 1.0% | View All 51 Rows |
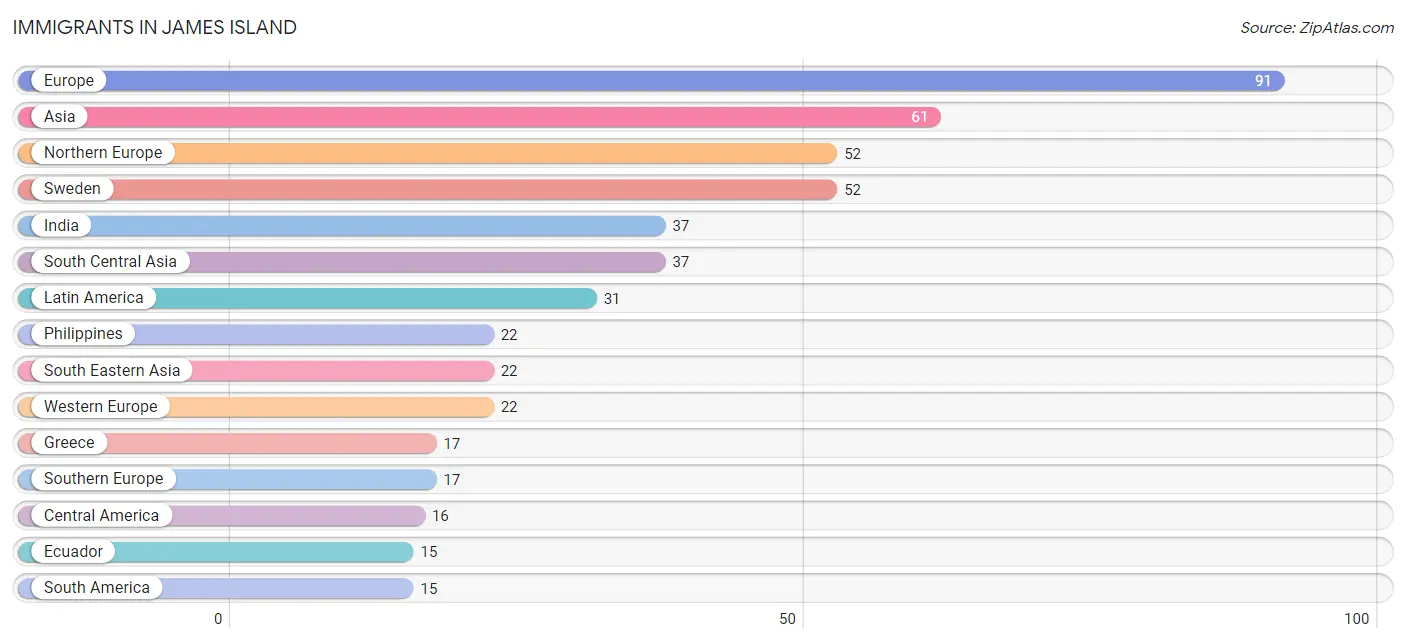
Immigrants in James Island
The most numerous immigrant groups reported in James Island came from Europe (91 | 0.8%), Asia (61 | 0.5%), Northern Europe (52 | 0.4%), Sweden (52 | 0.4%), and India (37 | 0.3%), together accounting for 2.5% of all James Island residents.
| Immigration Origin | # Population | % Population |
| Asia | 61 | 0.5% |
| Austria | 8 | 0.1% |
| Belgium | 1 | 0.0% |
| Canada | 12 | 0.1% |
| Central America | 16 | 0.1% |
| China | 2 | 0.0% |
| Eastern Asia | 2 | 0.0% |
| Ecuador | 15 | 0.1% |
| Europe | 91 | 0.8% |
| France | 13 | 0.1% |
| Greece | 17 | 0.2% |
| Guatemala | 4 | 0.0% |
| India | 37 | 0.3% |
| Latin America | 31 | 0.3% |
| Mexico | 12 | 0.1% |
| Northern Europe | 52 | 0.4% |
| Philippines | 22 | 0.2% |
| South America | 15 | 0.1% |
| South Central Asia | 37 | 0.3% |
| South Eastern Asia | 22 | 0.2% |
| Southern Europe | 17 | 0.2% |
| Sweden | 52 | 0.4% |
| Western Europe | 22 | 0.2% | View All 23 Rows |
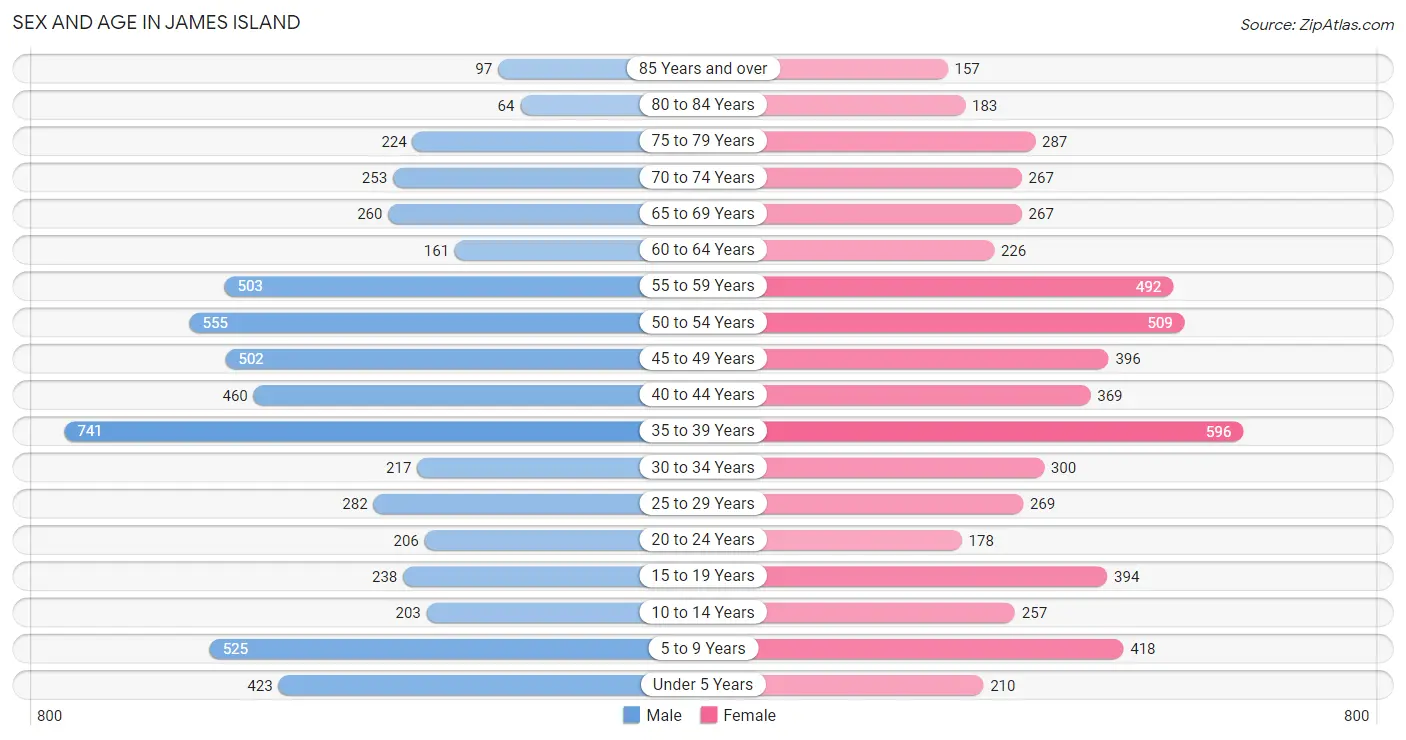
Sex and Age in James Island
Sex and Age in James Island
The most populous age groups in James Island are 35 to 39 Years (741 | 12.5%) for men and 35 to 39 Years (596 | 10.3%) for women.
| Age Bracket | Male | Female |
| Under 5 Years | 423 (7.1%) | 210 (3.6%) |
| 5 to 9 Years | 525 (8.9%) | 418 (7.2%) |
| 10 to 14 Years | 203 (3.4%) | 257 (4.4%) |
| 15 to 19 Years | 238 (4.0%) | 394 (6.8%) |
| 20 to 24 Years | 206 (3.5%) | 178 (3.1%) |
| 25 to 29 Years | 282 (4.8%) | 269 (4.7%) |
| 30 to 34 Years | 217 (3.7%) | 300 (5.2%) |
| 35 to 39 Years | 741 (12.5%) | 596 (10.3%) |
| 40 to 44 Years | 460 (7.8%) | 369 (6.4%) |
| 45 to 49 Years | 502 (8.5%) | 396 (6.9%) |
| 50 to 54 Years | 555 (9.4%) | 509 (8.8%) |
| 55 to 59 Years | 503 (8.5%) | 492 (8.5%) |
| 60 to 64 Years | 161 (2.7%) | 226 (3.9%) |
| 65 to 69 Years | 260 (4.4%) | 267 (4.6%) |
| 70 to 74 Years | 253 (4.3%) | 267 (4.6%) |
| 75 to 79 Years | 224 (3.8%) | 287 (5.0%) |
| 80 to 84 Years | 64 (1.1%) | 183 (3.2%) |
| 85 Years and over | 97 (1.6%) | 157 (2.7%) |
| Total | 5,914 (100.0%) | 5,775 (100.0%) |
Families and Households in James Island
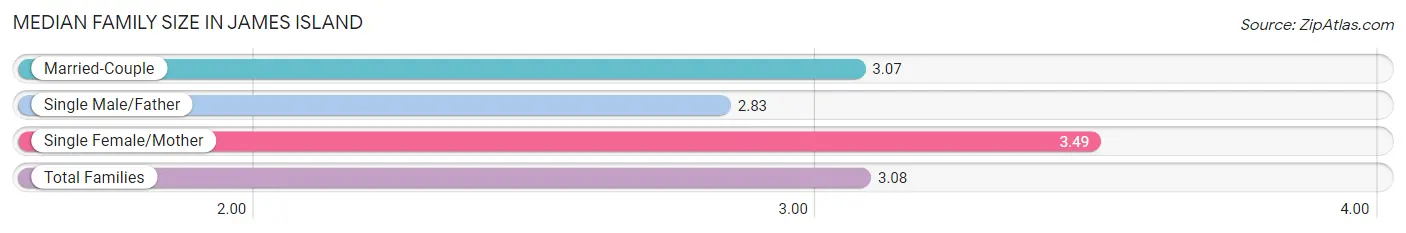
Median Family Size in James Island
The median family size in James Island is 3.08 persons per family, with single female/mother families (242 | 7.7%) accounting for the largest median family size of 3.49 persons per family. On the other hand, single male/father families (206 | 6.5%) represent the smallest median family size with 2.83 persons per family.
| Family Type | # Families | Family Size |
| Married-Couple | 2,708 (85.8%) | 3.07 |
| Single Male/Father | 206 (6.5%) | 2.83 |
| Single Female/Mother | 242 (7.7%) | 3.49 |
| Total Families | 3,156 (100.0%) | 3.08 |
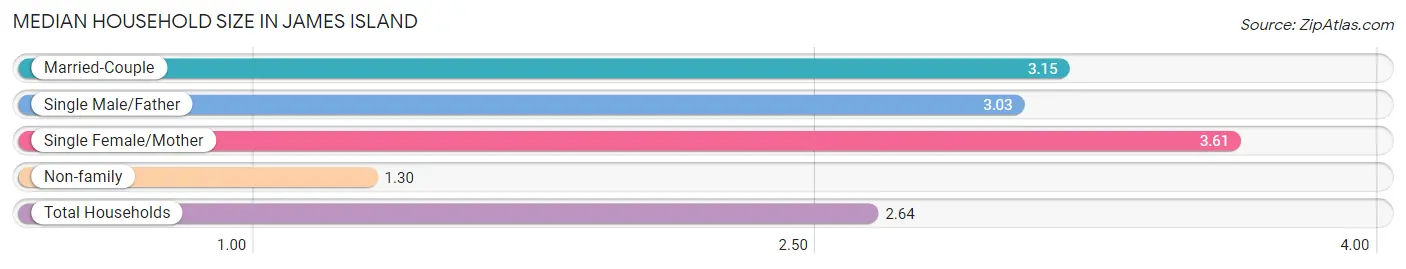
Median Household Size in James Island
The median household size in James Island is 2.64 persons per household, with single female/mother households (242 | 5.5%) accounting for the largest median household size of 3.61 persons per household. non-family households (1,266 | 28.6%) represent the smallest median household size with 1.30 persons per household.
| Household Type | # Households | Household Size |
| Married-Couple | 2,708 (61.2%) | 3.15 |
| Single Male/Father | 206 (4.7%) | 3.03 |
| Single Female/Mother | 242 (5.5%) | 3.61 |
| Non-family | 1,266 (28.6%) | 1.30 |
| Total Households | 4,422 (100.0%) | 2.64 |
Household Size by Marriage Status in James Island
Out of a total of 4,422 households in James Island, 3,156 (71.4%) are family households, while 1,266 (28.6%) are nonfamily households. The most numerous type of family households are 2-person households, comprising 1,483, and the most common type of nonfamily households are 1-person households, comprising 932.
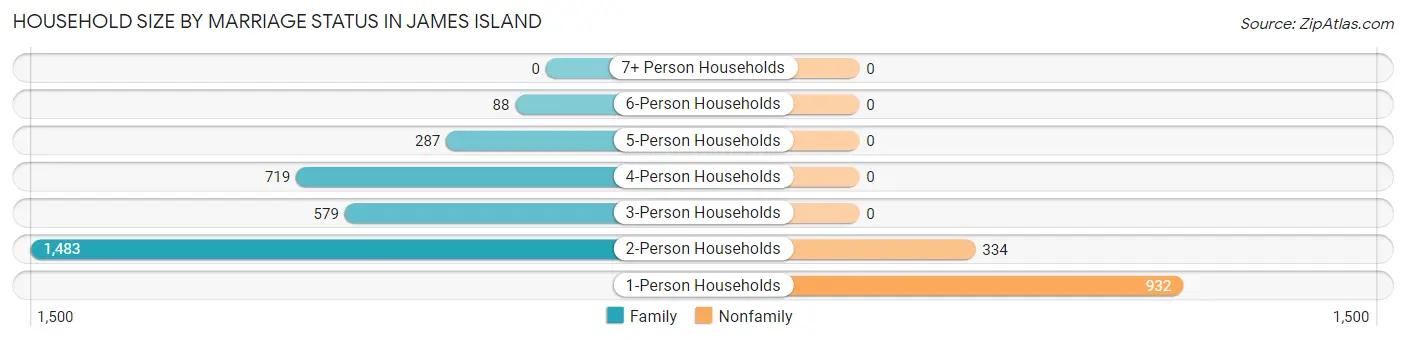
| Household Size | Family Households | Nonfamily Households |
| 1-Person Households | - | 932 (21.1%) |
| 2-Person Households | 1,483 (33.5%) | 334 (7.5%) |
| 3-Person Households | 579 (13.1%) | 0 (0.0%) |
| 4-Person Households | 719 (16.3%) | 0 (0.0%) |
| 5-Person Households | 287 (6.5%) | 0 (0.0%) |
| 6-Person Households | 88 (2.0%) | 0 (0.0%) |
| 7+ Person Households | 0 (0.0%) | 0 (0.0%) |
| Total | 3,156 (71.4%) | 1,266 (28.6%) |
Female Fertility in James Island
Fertility by Age in James Island
Average fertility rate in James Island is 41.0 births per 1,000 women. Women in the age bracket of 20 to 34 years have the highest fertility rate with 79.0 births per 1,000 women. Women in the age bracket of 20 to 34 years acount for 51.3% of all women with births.
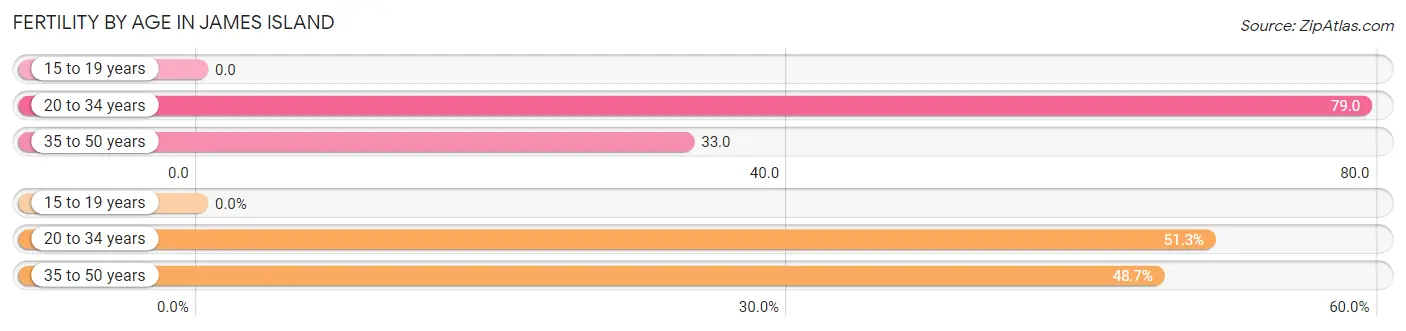
| Age Bracket | Women with Births | Births / 1,000 Women |
| 15 to 19 years | 0 (0.0%) | 0.0 |
| 20 to 34 years | 59 (51.3%) | 79.0 |
| 35 to 50 years | 56 (48.7%) | 33.0 |
| Total | 115 (100.0%) | 41.0 |
Fertility by Age by Marriage Status in James Island
44.3% of women with births (115) in James Island are married. The highest percentage of unmarried women with births falls into 20 to 34 years age bracket with 74.6% of them unmarried at the time of birth, while the lowest percentage of unmarried women with births belong to 35 to 50 years age bracket with 35.7% of them unmarried.
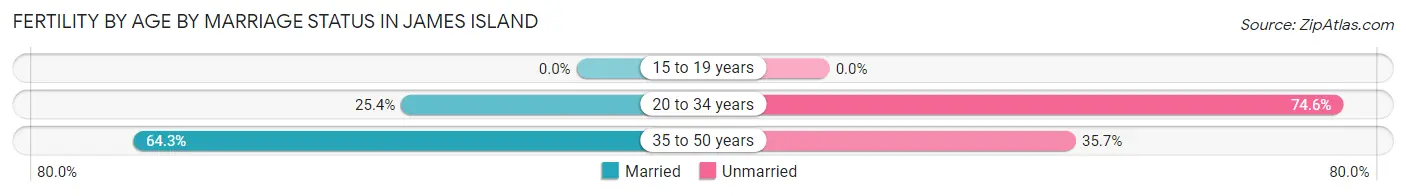
| Age Bracket | Married | Unmarried |
| 15 to 19 years | 0 (0.0%) | 0 (0.0%) |
| 20 to 34 years | 15 (25.4%) | 44 (74.6%) |
| 35 to 50 years | 36 (64.3%) | 20 (35.7%) |
| Total | 51 (44.4%) | 64 (55.6%) |
Fertility by Education in James Island
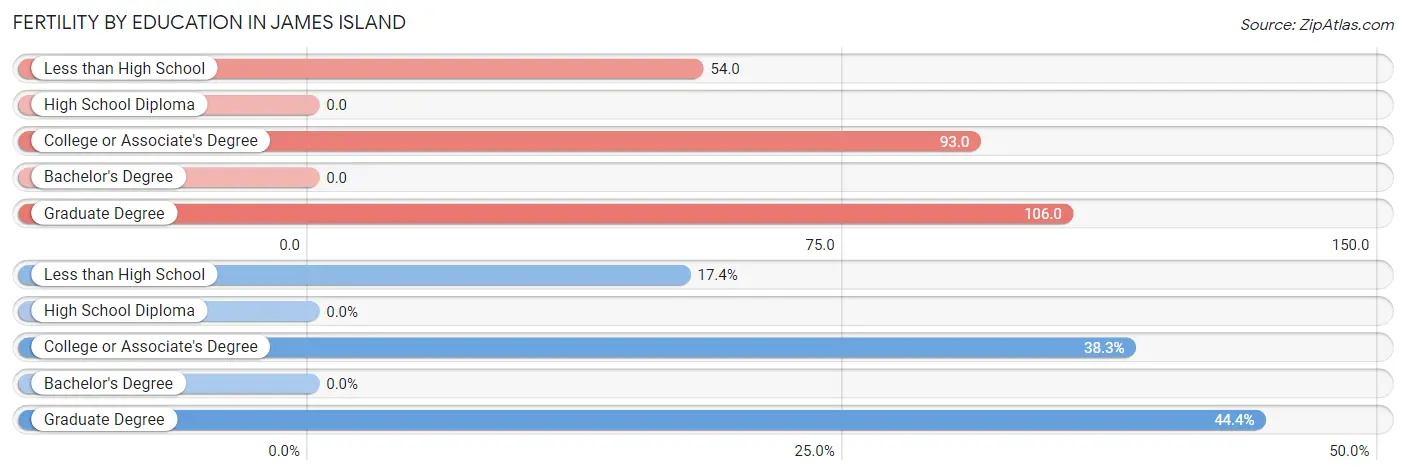
| Educational Attainment | Women with Births | Births / 1,000 Women |
| Less than High School | 20 (17.4%) | 54.0 |
| High School Diploma | 0 (0.0%) | 0.0 |
| College or Associate's Degree | 44 (38.3%) | 93.0 |
| Bachelor's Degree | 0 (0.0%) | 0.0 |
| Graduate Degree | 51 (44.4%) | 106.0 |
| Total | 115 (100.0%) | 41.0 |
Fertility by Education by Marriage Status in James Island
55.6% of women with births in James Island are unmarried. Women with the educational attainment of graduate degree are most likely to be married with 100.0% of them married at childbirth, while women with the educational attainment of less than high school are least likely to be married with 100.0% of them unmarried at childbirth.
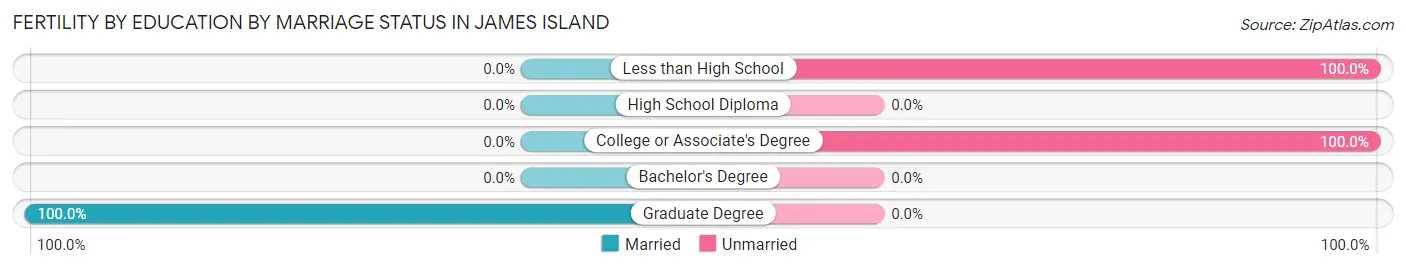
| Educational Attainment | Married | Unmarried |
| Less than High School | 0 (0.0%) | 20 (100.0%) |
| High School Diploma | 0 (0.0%) | 0 (0.0%) |
| College or Associate's Degree | 0 (0.0%) | 44 (100.0%) |
| Bachelor's Degree | 0 (0.0%) | 0 (0.0%) |
| Graduate Degree | 51 (100.0%) | 0 (0.0%) |
| Total | 51 (44.4%) | 64 (55.6%) |
Employment Characteristics in James Island
Employment by Class of Employer in James Island
Among the 6,364 employed individuals in James Island, private company employees (4,090 | 64.3%), state government employees (555 | 8.7%), and self-employed (not incorporated) (398 | 6.2%) make up the most common classes of employment.
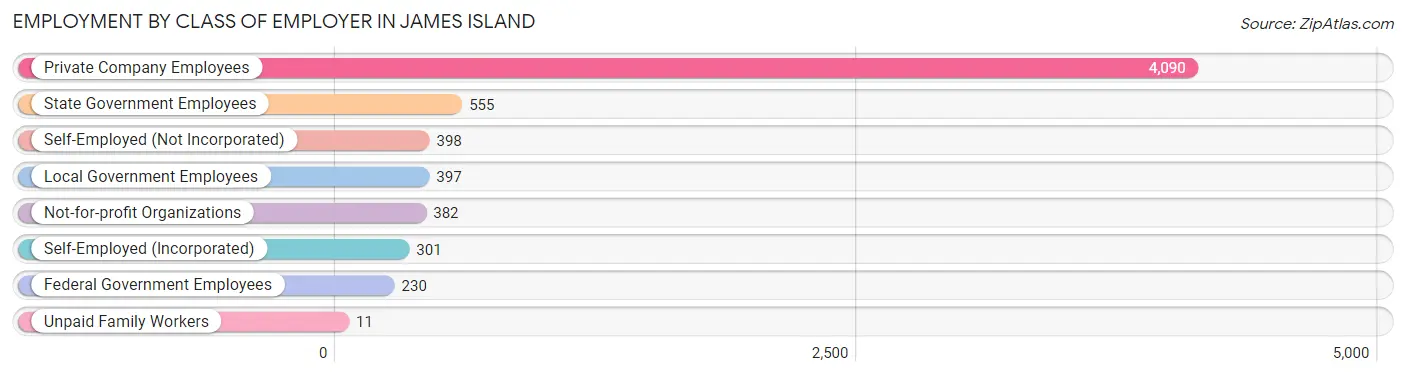
| Employer Class | # Employees | % Employees |
| Private Company Employees | 4,090 | 64.3% |
| Self-Employed (Incorporated) | 301 | 4.7% |
| Self-Employed (Not Incorporated) | 398 | 6.2% |
| Not-for-profit Organizations | 382 | 6.0% |
| Local Government Employees | 397 | 6.2% |
| State Government Employees | 555 | 8.7% |
| Federal Government Employees | 230 | 3.6% |
| Unpaid Family Workers | 11 | 0.2% |
| Total | 6,364 | 100.0% |
Employment Status by Age in James Island
According to the labor force statistics for James Island, out of the total population over 16 years of age (9,534), 68.6% or 6,540 individuals are in the labor force, with 1.7% or 111 of them unemployed. The age group with the highest labor force participation rate is 25 to 29 years, with 98.7% or 544 individuals in the labor force. Within the labor force, the 65 to 74 years age range has the highest percentage of unemployed individuals, with 8.8% or 33 of them being unemployed.
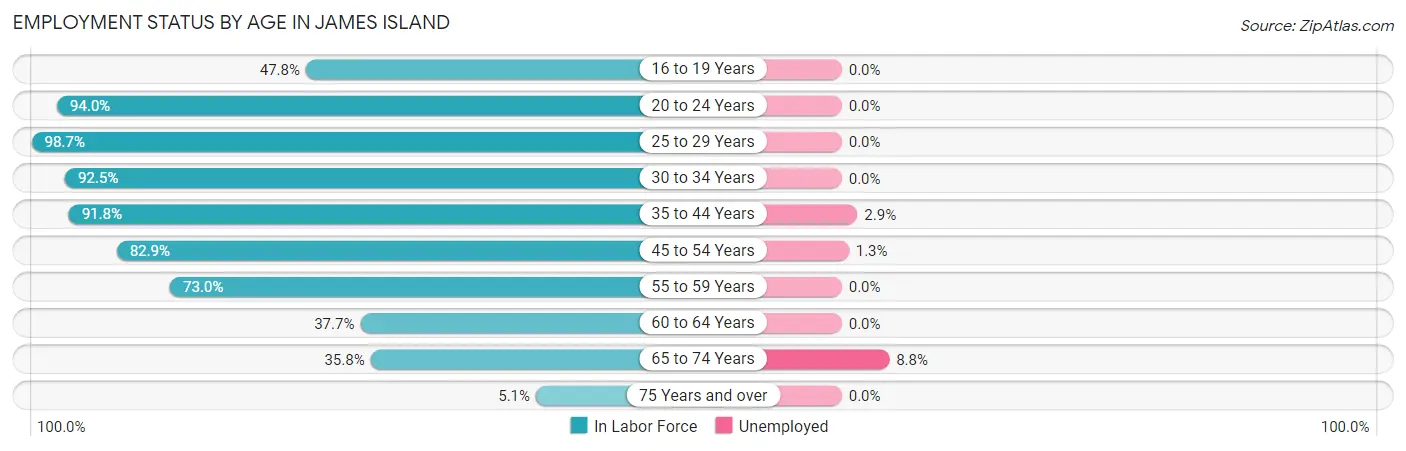
| Age Bracket | In Labor Force | Unemployed |
| 16 to 19 Years | 245 (47.8%) | 0 (0.0%) |
| 20 to 24 Years | 361 (94.0%) | 0 (0.0%) |
| 25 to 29 Years | 544 (98.7%) | 0 (0.0%) |
| 30 to 34 Years | 478 (92.5%) | 0 (0.0%) |
| 35 to 44 Years | 1,988 (91.8%) | 58 (2.9%) |
| 45 to 54 Years | 1,626 (82.9%) | 21 (1.3%) |
| 55 to 59 Years | 726 (73.0%) | 0 (0.0%) |
| 60 to 64 Years | 146 (37.7%) | 0 (0.0%) |
| 65 to 74 Years | 375 (35.8%) | 33 (8.8%) |
| 75 Years and over | 52 (5.1%) | 0 (0.0%) |
| Total | 6,540 (68.6%) | 111 (1.7%) |
Employment Status by Educational Attainment in James Island
According to labor force statistics for James Island, 83.8% of individuals (5,512) out of the total population between 25 and 64 years of age (6,578) are in the labor force, with 1.4% or 77 of them being unemployed. The group with the highest labor force participation rate are those with the educational attainment of bachelor's degree or higher, with 94.0% or 3,370 individuals in the labor force. Within the labor force, individuals with bachelor's degree or higher education have the highest percentage of unemployment, with 1.7% or 57 of them being unemployed.
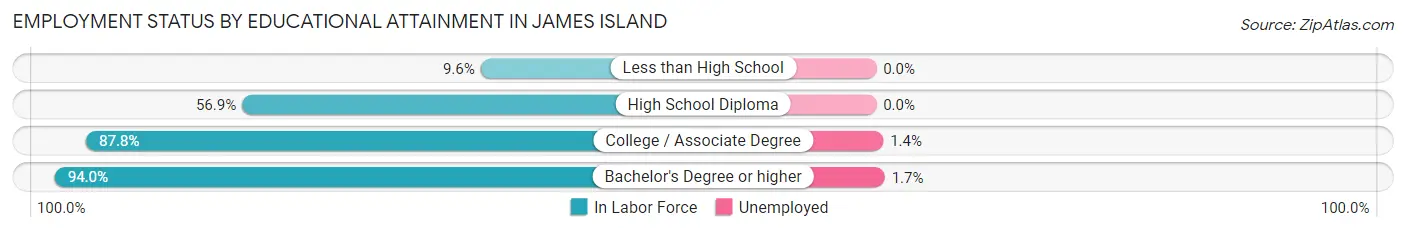
| Educational Attainment | In Labor Force | Unemployed |
| Less than High School | 18 (9.6%) | 0 (0.0%) |
| High School Diploma | 629 (56.9%) | 0 (0.0%) |
| College / Associate Degree | 1,493 (87.8%) | 24 (1.4%) |
| Bachelor's Degree or higher | 3,370 (94.0%) | 61 (1.7%) |
| Total | 5,512 (83.8%) | 92 (1.4%) |
Employment Occupations by Sex in James Island
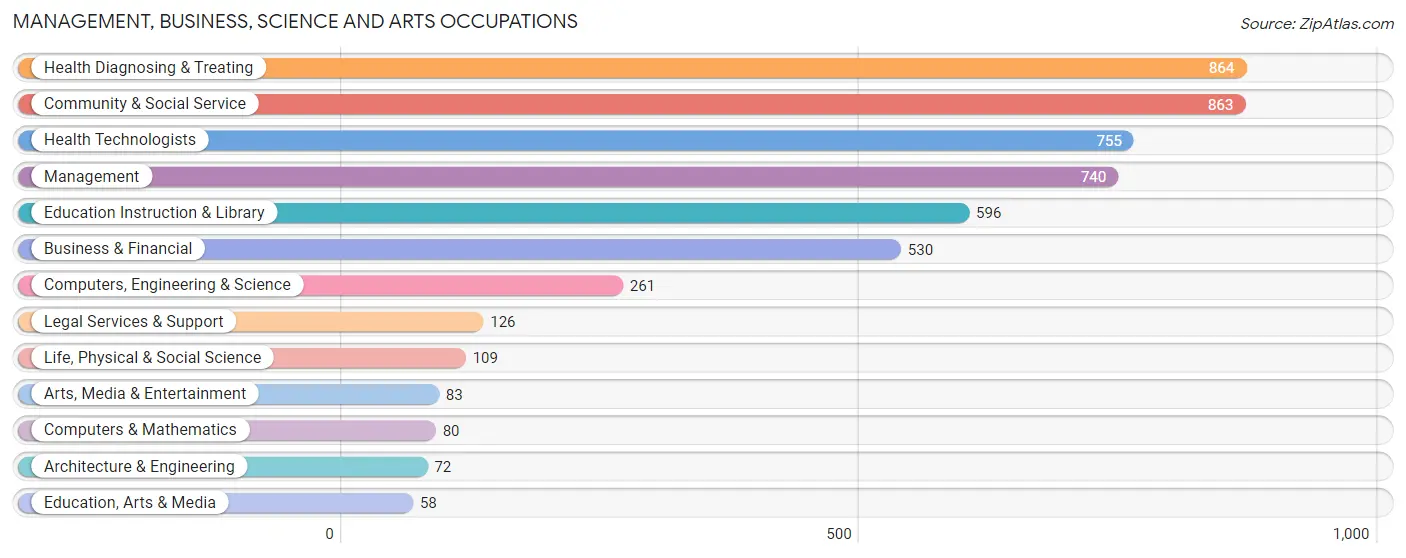
Management, Business, Science and Arts Occupations
The most common Management, Business, Science and Arts occupations in James Island are Health Diagnosing & Treating (864 | 13.4%), Community & Social Service (863 | 13.4%), Health Technologists (755 | 11.7%), Management (740 | 11.5%), and Education Instruction & Library (596 | 9.3%).
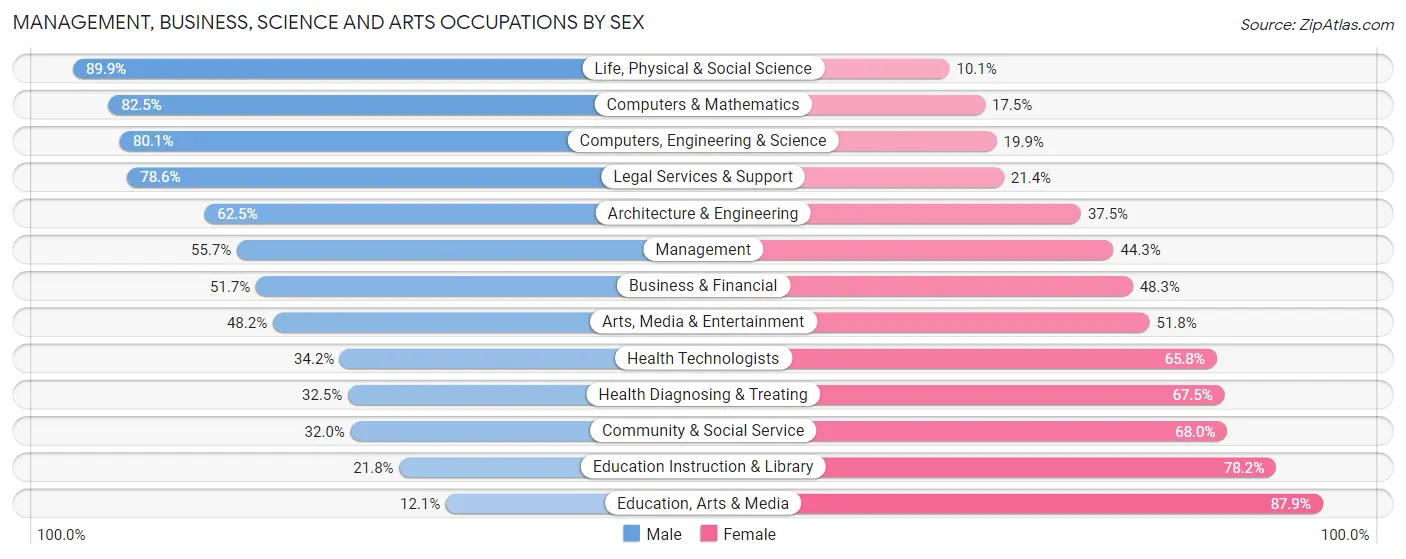
Management, Business, Science and Arts Occupations by Sex
Within the Management, Business, Science and Arts occupations in James Island, the most male-oriented occupations are Life, Physical & Social Science (89.9%), Computers & Mathematics (82.5%), and Computers, Engineering & Science (80.1%), while the most female-oriented occupations are Education, Arts & Media (87.9%), Education Instruction & Library (78.2%), and Community & Social Service (68.0%).
| Occupation | Male | Female |
| Management | 412 (55.7%) | 328 (44.3%) |
| Business & Financial | 274 (51.7%) | 256 (48.3%) |
| Computers, Engineering & Science | 209 (80.1%) | 52 (19.9%) |
| Computers & Mathematics | 66 (82.5%) | 14 (17.5%) |
| Architecture & Engineering | 45 (62.5%) | 27 (37.5%) |
| Life, Physical & Social Science | 98 (89.9%) | 11 (10.1%) |
| Community & Social Service | 276 (32.0%) | 587 (68.0%) |
| Education, Arts & Media | 7 (12.1%) | 51 (87.9%) |
| Legal Services & Support | 99 (78.6%) | 27 (21.4%) |
| Education Instruction & Library | 130 (21.8%) | 466 (78.2%) |
| Arts, Media & Entertainment | 40 (48.2%) | 43 (51.8%) |
| Health Diagnosing & Treating | 281 (32.5%) | 583 (67.5%) |
| Health Technologists | 258 (34.2%) | 497 (65.8%) |
| Total (Category) | 1,452 (44.6%) | 1,806 (55.4%) |
| Total (Overall) | 3,252 (50.6%) | 3,180 (49.4%) |
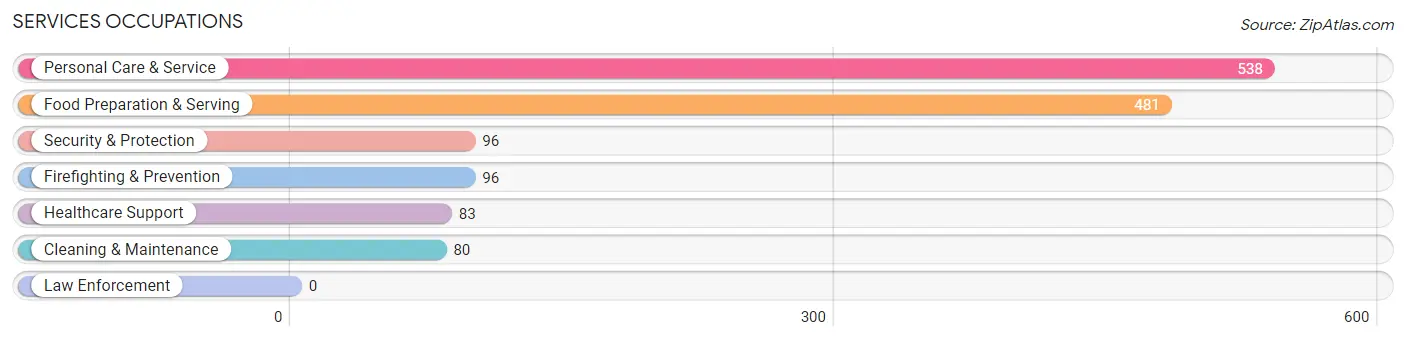
Services Occupations
The most common Services occupations in James Island are Personal Care & Service (538 | 8.4%), Food Preparation & Serving (481 | 7.5%), Security & Protection (96 | 1.5%), Firefighting & Prevention (96 | 1.5%), and Healthcare Support (83 | 1.3%).
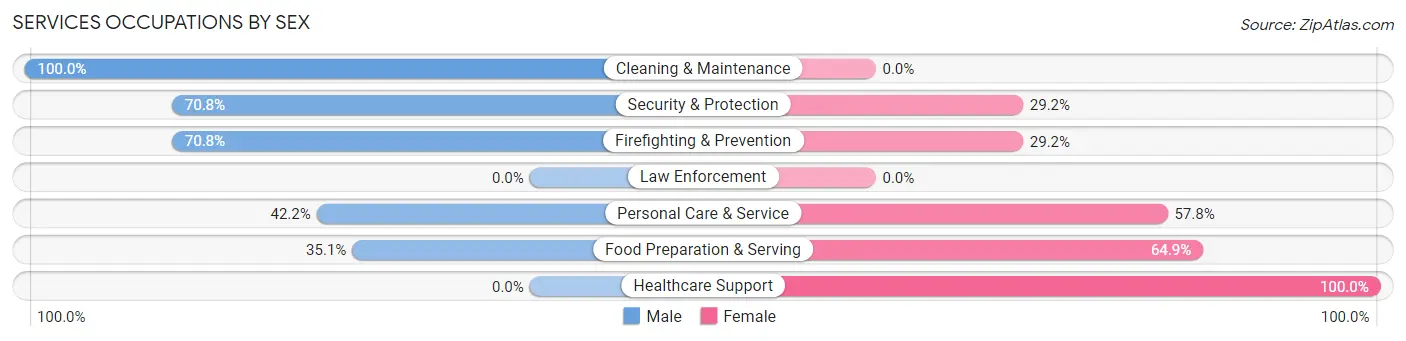
Services Occupations by Sex
Within the Services occupations in James Island, the most male-oriented occupations are Cleaning & Maintenance (100.0%), Security & Protection (70.8%), and Firefighting & Prevention (70.8%), while the most female-oriented occupations are Healthcare Support (100.0%), Food Preparation & Serving (64.9%), and Personal Care & Service (57.8%).
| Occupation | Male | Female |
| Healthcare Support | 0 (0.0%) | 83 (100.0%) |
| Security & Protection | 68 (70.8%) | 28 (29.2%) |
| Firefighting & Prevention | 68 (70.8%) | 28 (29.2%) |
| Law Enforcement | 0 (0.0%) | 0 (0.0%) |
| Food Preparation & Serving | 169 (35.1%) | 312 (64.9%) |
| Cleaning & Maintenance | 80 (100.0%) | 0 (0.0%) |
| Personal Care & Service | 227 (42.2%) | 311 (57.8%) |
| Total (Category) | 544 (42.6%) | 734 (57.4%) |
| Total (Overall) | 3,252 (50.6%) | 3,180 (49.4%) |
Sales and Office Occupations
The most common Sales and Office occupations in James Island are Office & Administration (552 | 8.6%), and Sales & Related (463 | 7.2%).
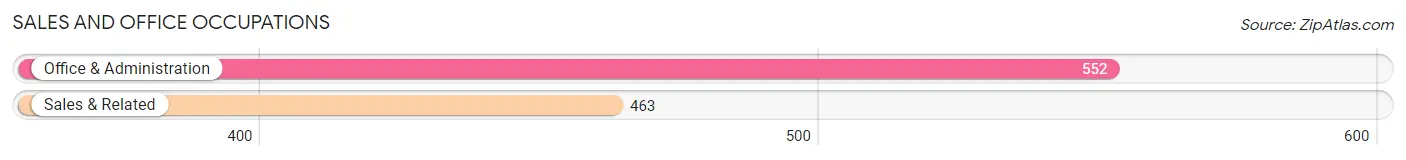
Sales and Office Occupations by Sex
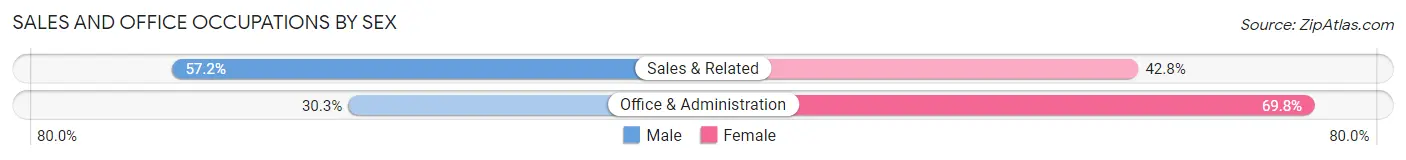
| Occupation | Male | Female |
| Sales & Related | 265 (57.2%) | 198 (42.8%) |
| Office & Administration | 167 (30.2%) | 385 (69.8%) |
| Total (Category) | 432 (42.6%) | 583 (57.4%) |
| Total (Overall) | 3,252 (50.6%) | 3,180 (49.4%) |
Natural Resources, Construction and Maintenance Occupations
The most common Natural Resources, Construction and Maintenance occupations in James Island are Installation, Maintenance & Repair (314 | 4.9%), and Construction & Extraction (105 | 1.6%).
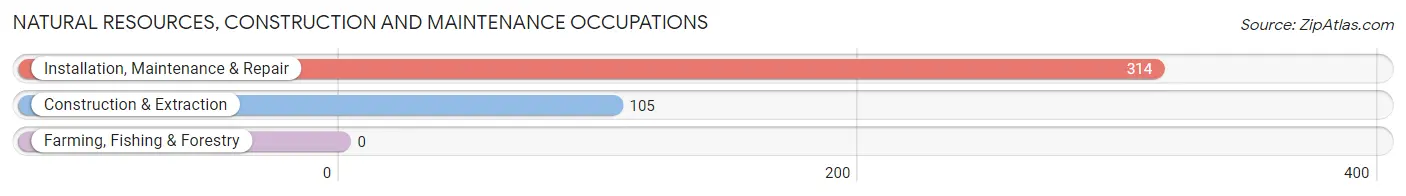
Natural Resources, Construction and Maintenance Occupations by Sex
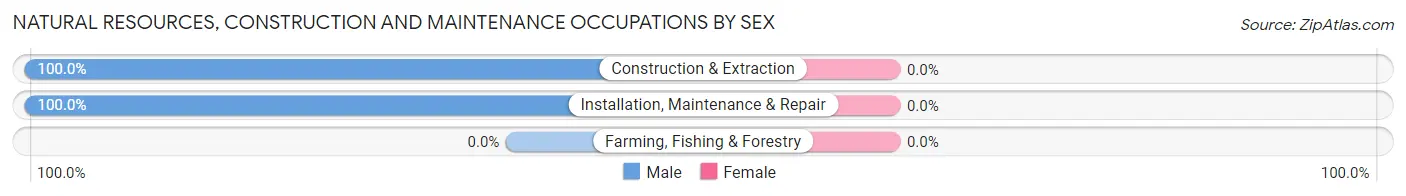
| Occupation | Male | Female |
| Farming, Fishing & Forestry | 0 (0.0%) | 0 (0.0%) |
| Construction & Extraction | 105 (100.0%) | 0 (0.0%) |
| Installation, Maintenance & Repair | 314 (100.0%) | 0 (0.0%) |
| Total (Category) | 419 (100.0%) | 0 (0.0%) |
| Total (Overall) | 3,252 (50.6%) | 3,180 (49.4%) |
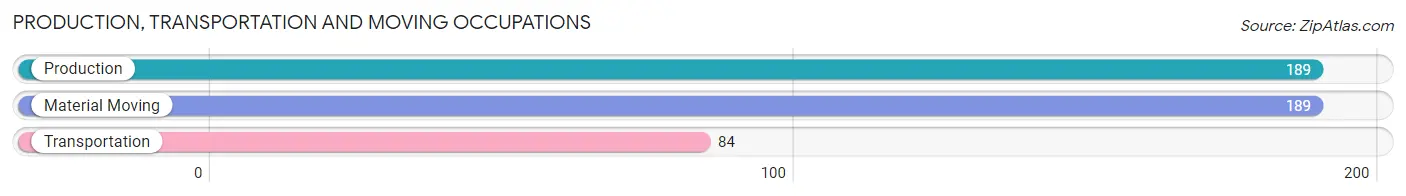
Production, Transportation and Moving Occupations
The most common Production, Transportation and Moving occupations in James Island are Production (189 | 2.9%), Material Moving (189 | 2.9%), and Transportation (84 | 1.3%).
Production, Transportation and Moving Occupations by Sex
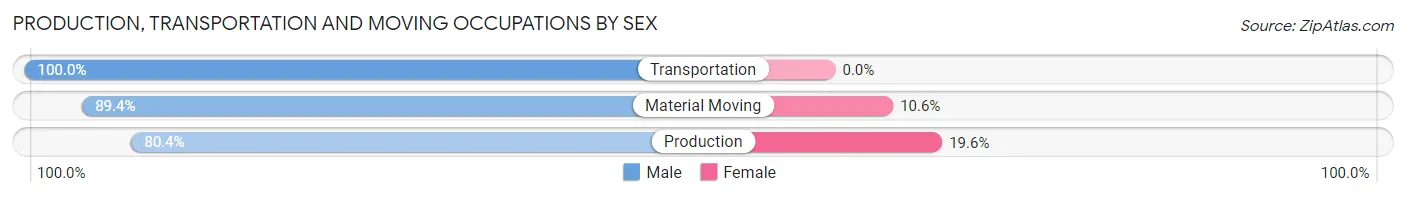
| Occupation | Male | Female |
| Production | 152 (80.4%) | 37 (19.6%) |
| Transportation | 84 (100.0%) | 0 (0.0%) |
| Material Moving | 169 (89.4%) | 20 (10.6%) |
| Total (Category) | 405 (87.7%) | 57 (12.3%) |
| Total (Overall) | 3,252 (50.6%) | 3,180 (49.4%) |
Employment Industries by Sex in James Island
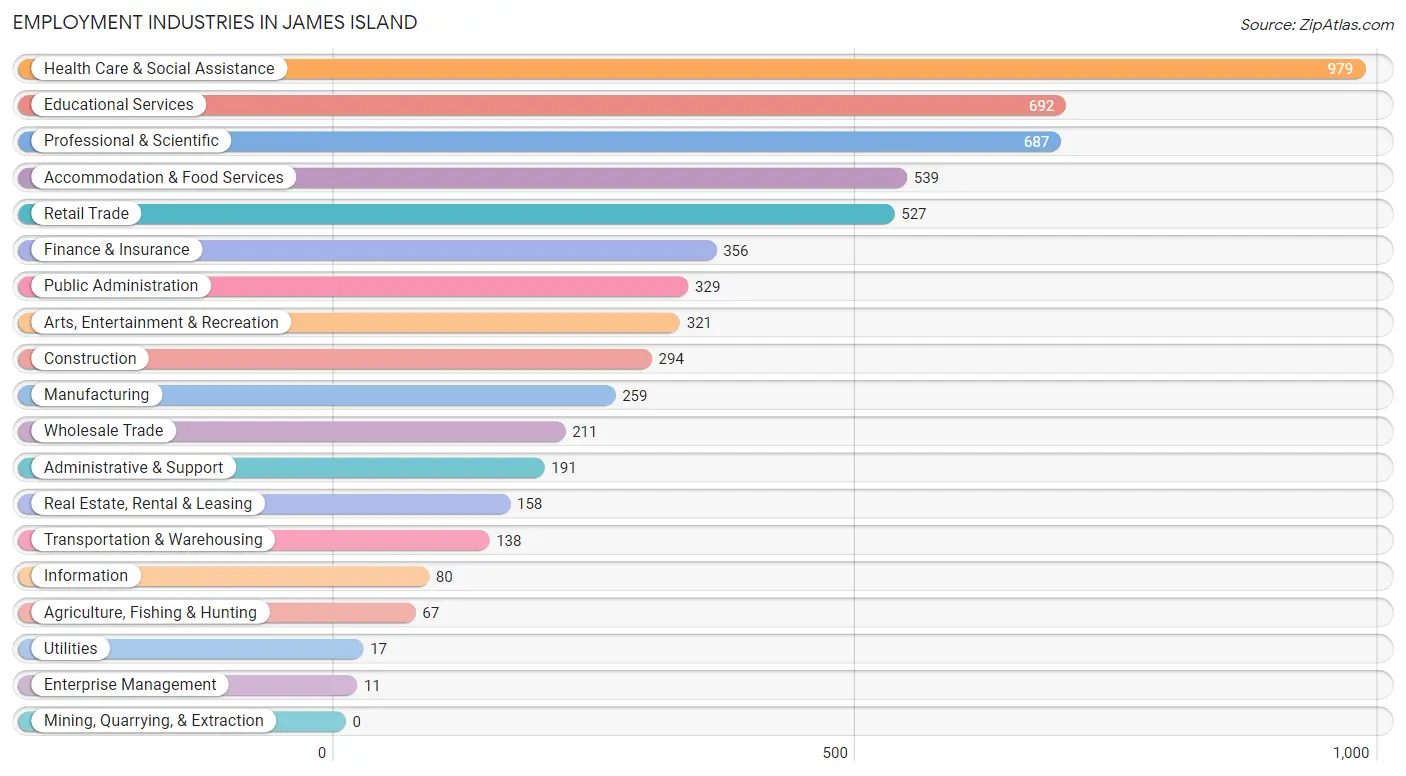
Employment Industries in James Island
The major employment industries in James Island include Health Care & Social Assistance (979 | 15.2%), Educational Services (692 | 10.8%), Professional & Scientific (687 | 10.7%), Accommodation & Food Services (539 | 8.4%), and Retail Trade (527 | 8.2%).
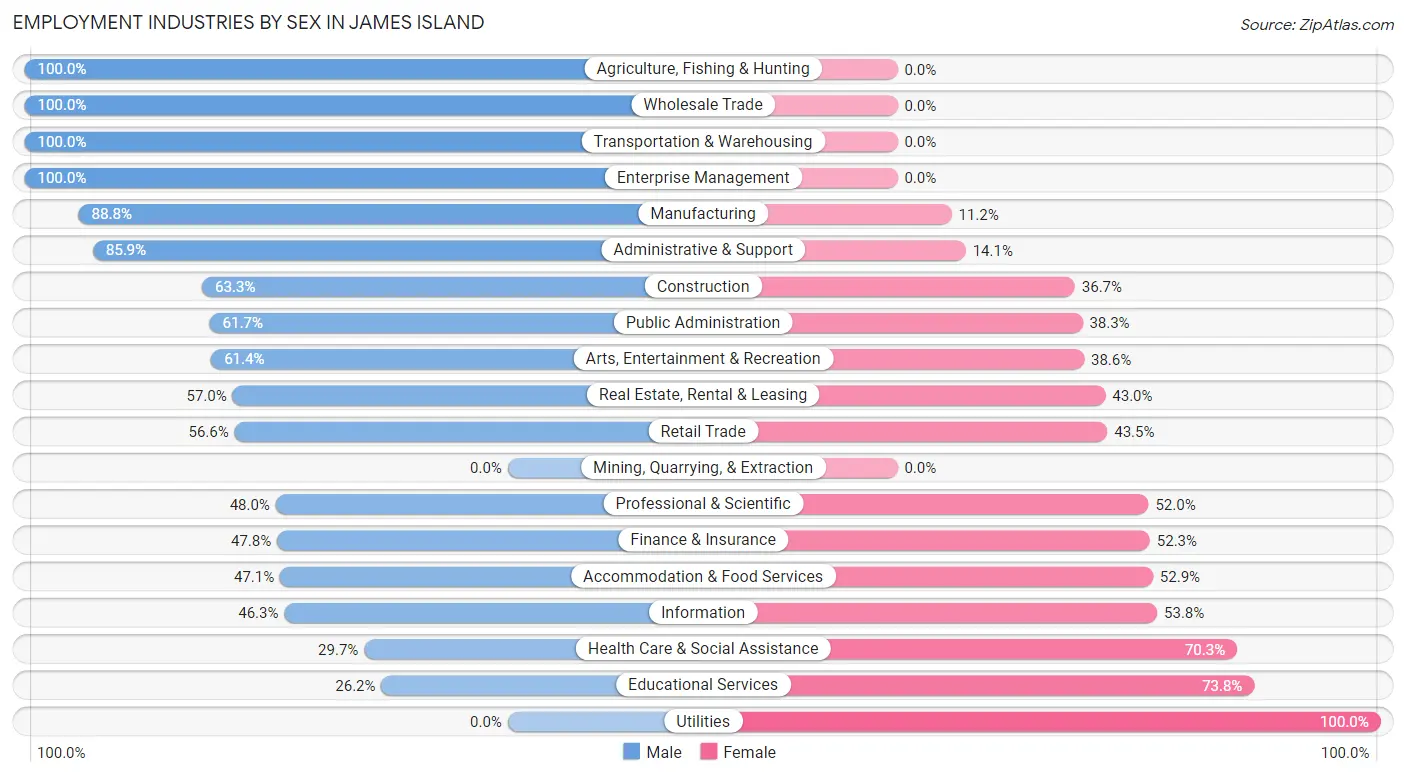
Employment Industries by Sex in James Island
The James Island industries that see more men than women are Agriculture, Fishing & Hunting (100.0%), Wholesale Trade (100.0%), and Transportation & Warehousing (100.0%), whereas the industries that tend to have a higher number of women are Utilities (100.0%), Educational Services (73.8%), and Health Care & Social Assistance (70.3%).
| Industry | Male | Female |
| Agriculture, Fishing & Hunting | 67 (100.0%) | 0 (0.0%) |
| Mining, Quarrying, & Extraction | 0 (0.0%) | 0 (0.0%) |
| Construction | 186 (63.3%) | 108 (36.7%) |
| Manufacturing | 230 (88.8%) | 29 (11.2%) |
| Wholesale Trade | 211 (100.0%) | 0 (0.0%) |
| Retail Trade | 298 (56.6%) | 229 (43.4%) |
| Transportation & Warehousing | 138 (100.0%) | 0 (0.0%) |
| Utilities | 0 (0.0%) | 17 (100.0%) |
| Information | 37 (46.3%) | 43 (53.7%) |
| Finance & Insurance | 170 (47.7%) | 186 (52.2%) |
| Real Estate, Rental & Leasing | 90 (57.0%) | 68 (43.0%) |
| Professional & Scientific | 330 (48.0%) | 357 (52.0%) |
| Enterprise Management | 11 (100.0%) | 0 (0.0%) |
| Administrative & Support | 164 (85.9%) | 27 (14.1%) |
| Educational Services | 181 (26.2%) | 511 (73.8%) |
| Health Care & Social Assistance | 291 (29.7%) | 688 (70.3%) |
| Arts, Entertainment & Recreation | 197 (61.4%) | 124 (38.6%) |
| Accommodation & Food Services | 254 (47.1%) | 285 (52.9%) |
| Public Administration | 203 (61.7%) | 126 (38.3%) |
| Total | 3,252 (50.6%) | 3,180 (49.4%) |
Education in James Island
School Enrollment in James Island
The most common levels of schooling among the 2,455 students in James Island are high school (680 | 27.7%), elementary school (547 | 22.3%), and middle school (372 | 15.1%).
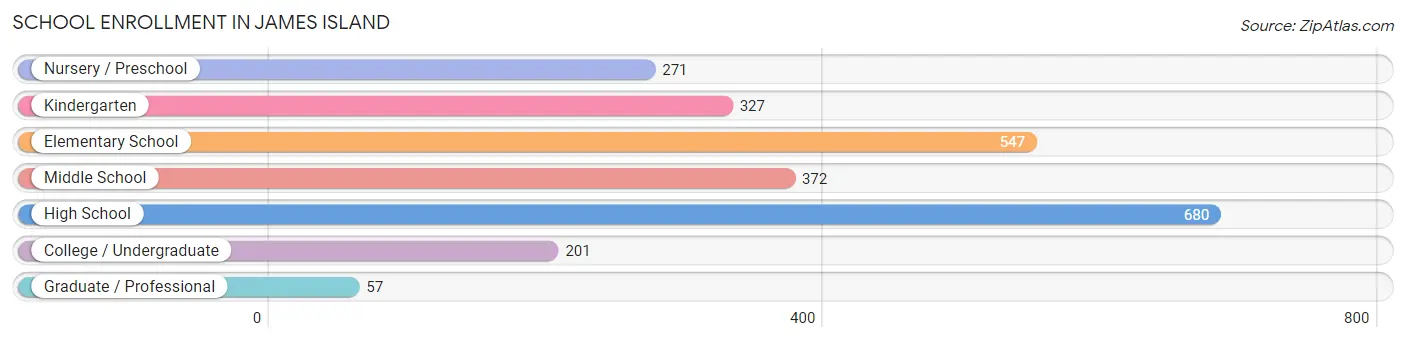
| School Level | # Students | % Students |
| Nursery / Preschool | 271 | 11.0% |
| Kindergarten | 327 | 13.3% |
| Elementary School | 547 | 22.3% |
| Middle School | 372 | 15.1% |
| High School | 680 | 27.7% |
| College / Undergraduate | 201 | 8.2% |
| Graduate / Professional | 57 | 2.3% |
| Total | 2,455 | 100.0% |
School Enrollment by Age by Funding Source in James Island
Out of a total of 2,455 students who are enrolled in schools in James Island, 670 (27.3%) attend a private institution, while the remaining 1,785 (72.7%) are enrolled in public schools. The age group of 3 to 4 year olds has the highest likelihood of being enrolled in private schools, with 82 (39.8% in the age bracket) enrolled. Conversely, the age group of 25 to 34 year olds has the lowest likelihood of being enrolled in a private school, with 32 (100.0% in the age bracket) attending a public institution.
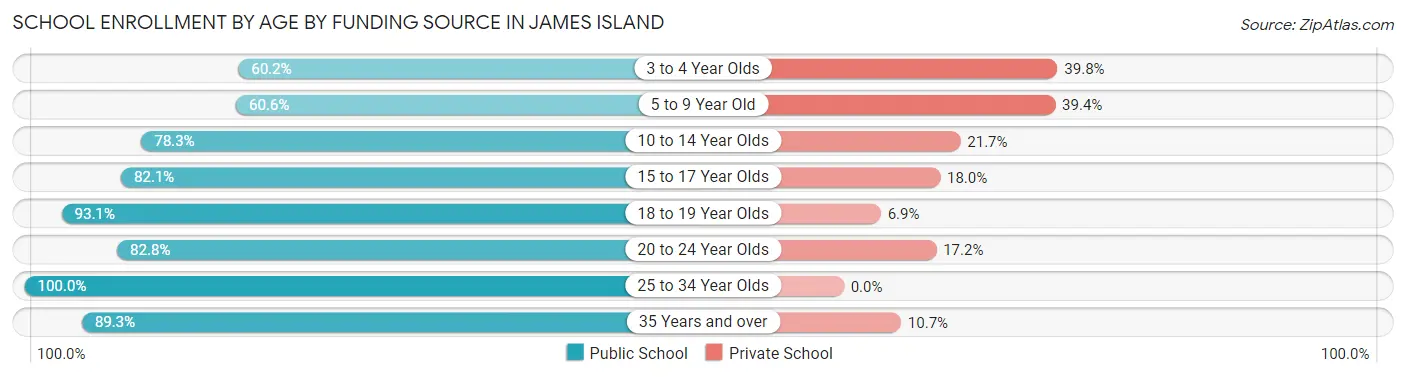
| Age Bracket | Public School | Private School |
| 3 to 4 Year Olds | 124 (60.2%) | 82 (39.8%) |
| 5 to 9 Year Old | 560 (60.6%) | 364 (39.4%) |
| 10 to 14 Year Olds | 360 (78.3%) | 100 (21.7%) |
| 15 to 17 Year Olds | 393 (82.1%) | 86 (17.9%) |
| 18 to 19 Year Olds | 135 (93.1%) | 10 (6.9%) |
| 20 to 24 Year Olds | 72 (82.8%) | 15 (17.2%) |
| 25 to 34 Year Olds | 32 (100.0%) | 0 (0.0%) |
| 35 Years and over | 109 (89.3%) | 13 (10.7%) |
| Total | 1,785 (72.7%) | 670 (27.3%) |
Educational Attainment by Field of Study in James Island
Business (881 | 17.8%), science & technology (563 | 11.4%), education (487 | 9.8%), bio, nature & agricultural (416 | 8.4%), and engineering (353 | 7.1%) are the most common fields of study among 4,959 individuals in James Island who have obtained a bachelor's degree or higher.
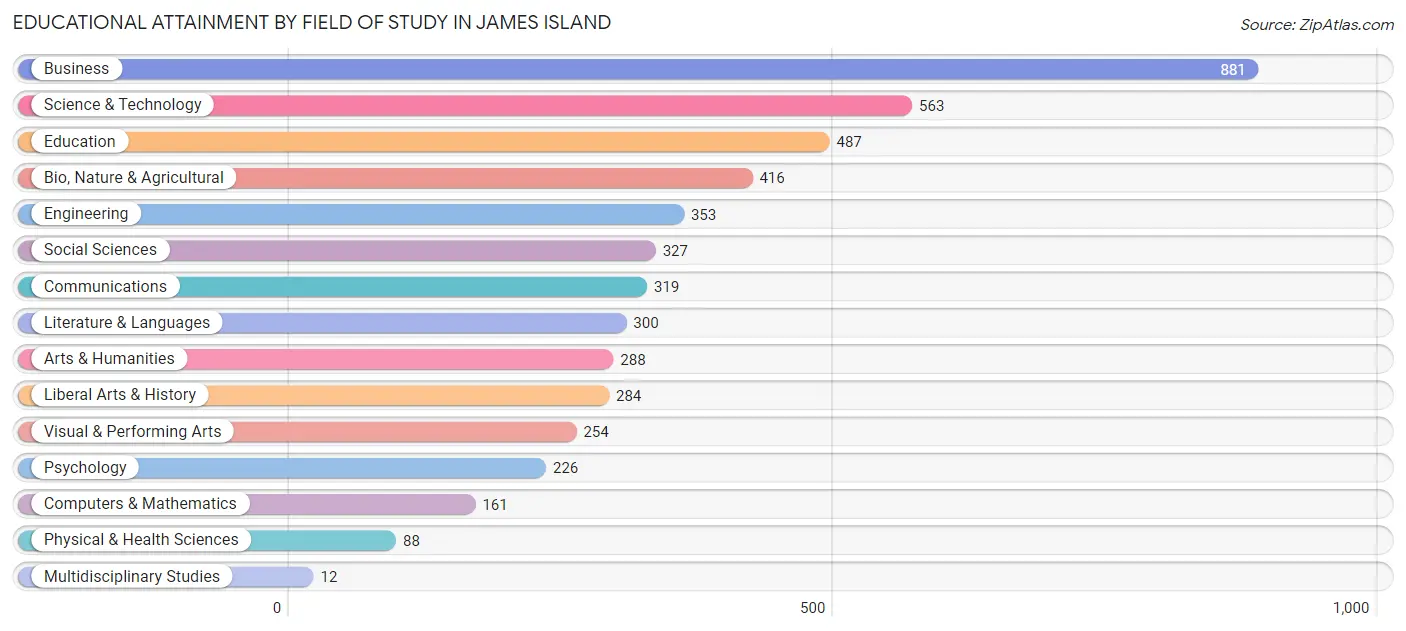
| Field of Study | # Graduates | % Graduates |
| Computers & Mathematics | 161 | 3.3% |
| Bio, Nature & Agricultural | 416 | 8.4% |
| Physical & Health Sciences | 88 | 1.8% |
| Psychology | 226 | 4.6% |
| Social Sciences | 327 | 6.6% |
| Engineering | 353 | 7.1% |
| Multidisciplinary Studies | 12 | 0.2% |
| Science & Technology | 563 | 11.4% |
| Business | 881 | 17.8% |
| Education | 487 | 9.8% |
| Literature & Languages | 300 | 6.0% |
| Liberal Arts & History | 284 | 5.7% |
| Visual & Performing Arts | 254 | 5.1% |
| Communications | 319 | 6.4% |
| Arts & Humanities | 288 | 5.8% |
| Total | 4,959 | 100.0% |
Transportation & Commute in James Island
Vehicle Availability by Sex in James Island
The most prevalent vehicle ownership categories in James Island are males with 2 vehicles (1,570, accounting for 49.1%) and females with 2 vehicles (1,353, making up 49.6%).
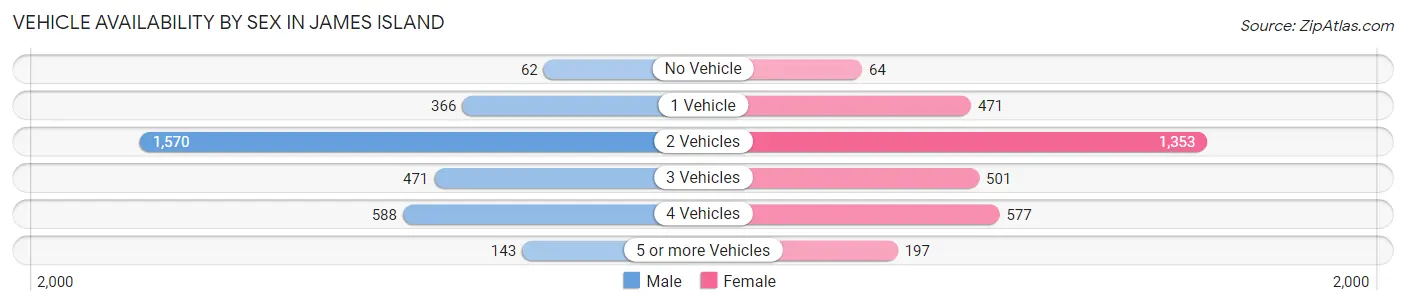
| Vehicles Available | Male | Female |
| No Vehicle | 62 (1.9%) | 64 (2.0%) |
| 1 Vehicle | 366 (11.4%) | 471 (14.9%) |
| 2 Vehicles | 1,570 (49.1%) | 1,353 (42.8%) |
| 3 Vehicles | 471 (14.7%) | 501 (15.8%) |
| 4 Vehicles | 588 (18.4%) | 577 (18.2%) |
| 5 or more Vehicles | 143 (4.5%) | 197 (6.2%) |
| Total | 3,200 (100.0%) | 3,163 (100.0%) |
Commute Time in James Island
The most frequently occuring commute durations in James Island are 15 to 19 minutes (1,245 commuters, 22.8%), 20 to 24 minutes (969 commuters, 17.7%), and 30 to 34 minutes (756 commuters, 13.8%).
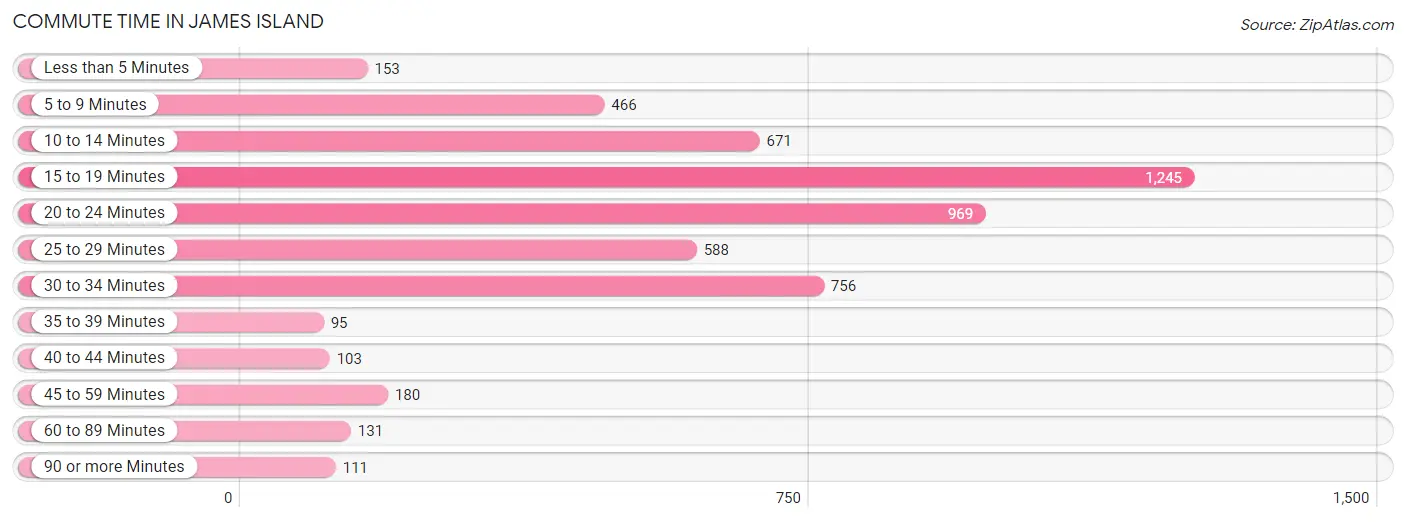
| Commute Time | # Commuters | % Commuters |
| Less than 5 Minutes | 153 | 2.8% |
| 5 to 9 Minutes | 466 | 8.5% |
| 10 to 14 Minutes | 671 | 12.3% |
| 15 to 19 Minutes | 1,245 | 22.8% |
| 20 to 24 Minutes | 969 | 17.7% |
| 25 to 29 Minutes | 588 | 10.7% |
| 30 to 34 Minutes | 756 | 13.8% |
| 35 to 39 Minutes | 95 | 1.7% |
| 40 to 44 Minutes | 103 | 1.9% |
| 45 to 59 Minutes | 180 | 3.3% |
| 60 to 89 Minutes | 131 | 2.4% |
| 90 or more Minutes | 111 | 2.0% |
Commute Time by Sex in James Island
The most common commute times in James Island are 20 to 24 minutes (557 commuters, 19.5%) for males and 15 to 19 minutes (728 commuters, 28.0%) for females.
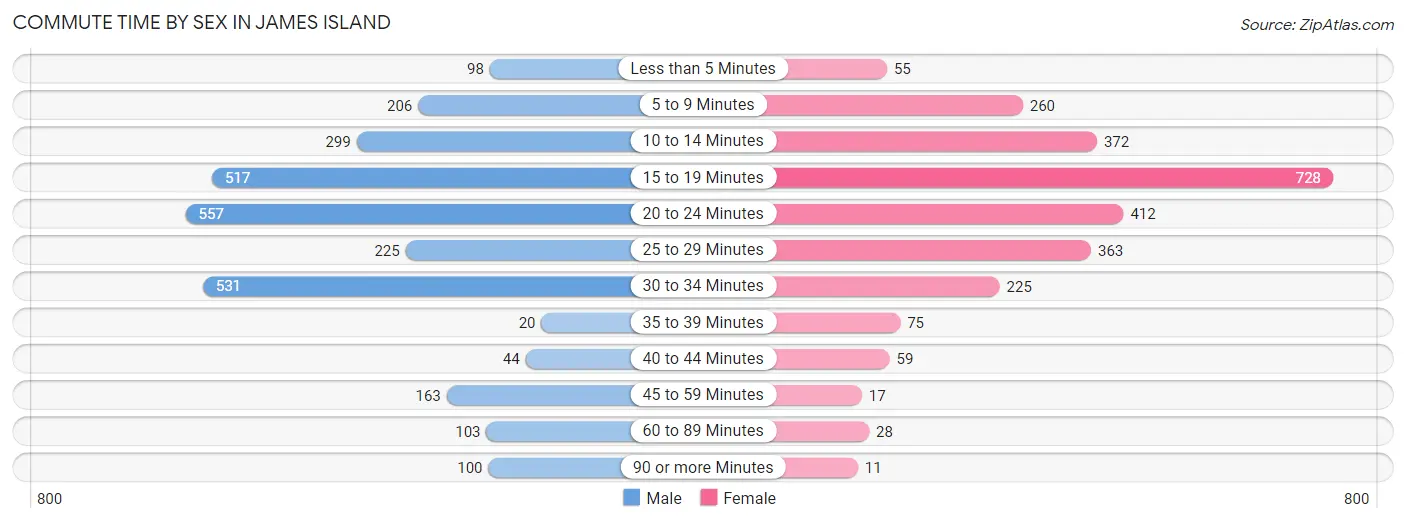
| Commute Time | Male | Female |
| Less than 5 Minutes | 98 (3.4%) | 55 (2.1%) |
| 5 to 9 Minutes | 206 (7.2%) | 260 (10.0%) |
| 10 to 14 Minutes | 299 (10.4%) | 372 (14.3%) |
| 15 to 19 Minutes | 517 (18.1%) | 728 (28.0%) |
| 20 to 24 Minutes | 557 (19.5%) | 412 (15.8%) |
| 25 to 29 Minutes | 225 (7.9%) | 363 (13.9%) |
| 30 to 34 Minutes | 531 (18.5%) | 225 (8.6%) |
| 35 to 39 Minutes | 20 (0.7%) | 75 (2.9%) |
| 40 to 44 Minutes | 44 (1.5%) | 59 (2.3%) |
| 45 to 59 Minutes | 163 (5.7%) | 17 (0.6%) |
| 60 to 89 Minutes | 103 (3.6%) | 28 (1.1%) |
| 90 or more Minutes | 100 (3.5%) | 11 (0.4%) |
Time of Departure to Work by Sex in James Island
The most frequent times of departure to work in James Island are 8:00 AM to 8:29 AM (670, 23.4%) for males and 8:00 AM to 8:29 AM (629, 24.1%) for females.
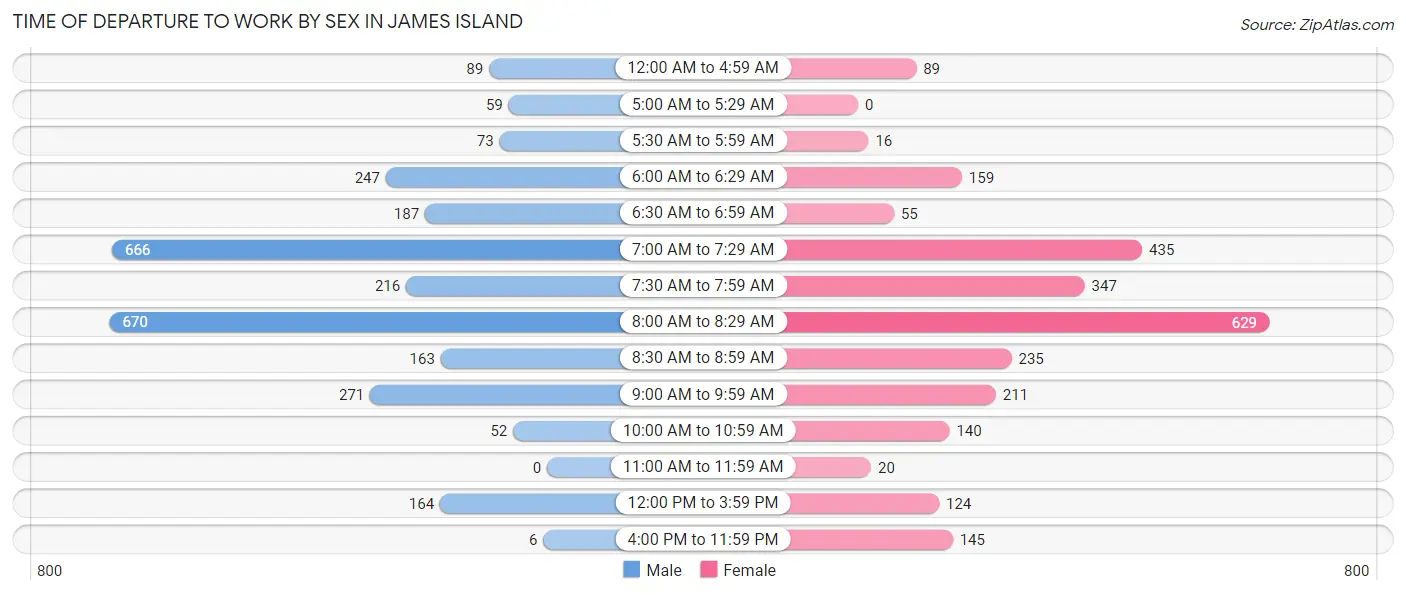
| Time of Departure | Male | Female |
| 12:00 AM to 4:59 AM | 89 (3.1%) | 89 (3.4%) |
| 5:00 AM to 5:29 AM | 59 (2.1%) | 0 (0.0%) |
| 5:30 AM to 5:59 AM | 73 (2.5%) | 16 (0.6%) |
| 6:00 AM to 6:29 AM | 247 (8.6%) | 159 (6.1%) |
| 6:30 AM to 6:59 AM | 187 (6.5%) | 55 (2.1%) |
| 7:00 AM to 7:29 AM | 666 (23.3%) | 435 (16.7%) |
| 7:30 AM to 7:59 AM | 216 (7.5%) | 347 (13.3%) |
| 8:00 AM to 8:29 AM | 670 (23.4%) | 629 (24.1%) |
| 8:30 AM to 8:59 AM | 163 (5.7%) | 235 (9.0%) |
| 9:00 AM to 9:59 AM | 271 (9.5%) | 211 (8.1%) |
| 10:00 AM to 10:59 AM | 52 (1.8%) | 140 (5.4%) |
| 11:00 AM to 11:59 AM | 0 (0.0%) | 20 (0.8%) |
| 12:00 PM to 3:59 PM | 164 (5.7%) | 124 (4.8%) |
| 4:00 PM to 11:59 PM | 6 (0.2%) | 145 (5.6%) |
| Total | 2,863 (100.0%) | 2,605 (100.0%) |
Housing Occupancy in James Island
Occupancy by Ownership in James Island
Of the total 4,422 dwellings in James Island, owner-occupied units account for 3,811 (86.2%), while renter-occupied units make up 611 (13.8%).
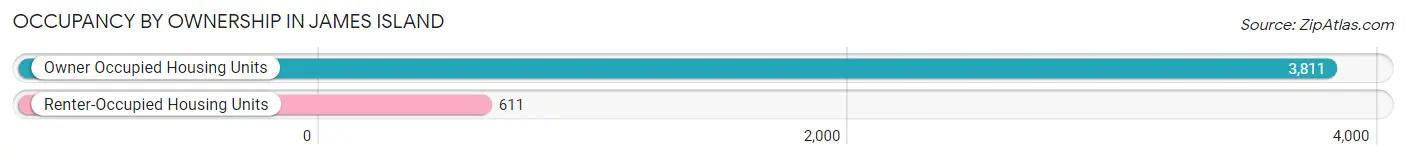
| Occupancy | # Housing Units | % Housing Units |
| Owner Occupied Housing Units | 3,811 | 86.2% |
| Renter-Occupied Housing Units | 611 | 13.8% |
| Total Occupied Housing Units | 4,422 | 100.0% |
Occupancy by Household Size in James Island
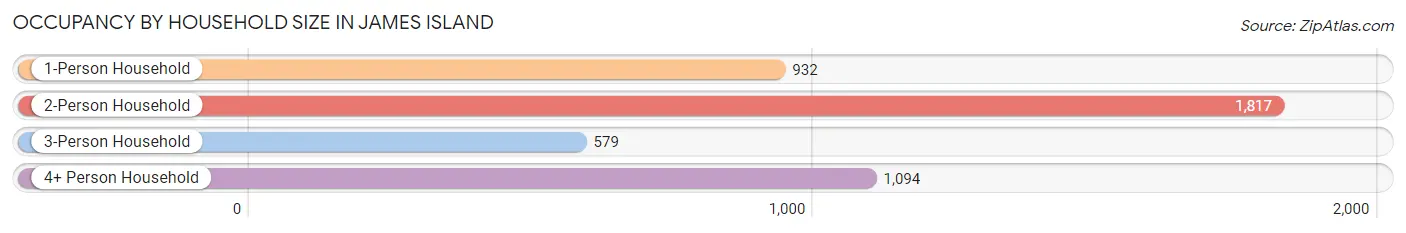
| Household Size | # Housing Units | % Housing Units |
| 1-Person Household | 932 | 21.1% |
| 2-Person Household | 1,817 | 41.1% |
| 3-Person Household | 579 | 13.1% |
| 4+ Person Household | 1,094 | 24.7% |
| Total Housing Units | 4,422 | 100.0% |
Occupancy by Ownership by Household Size in James Island
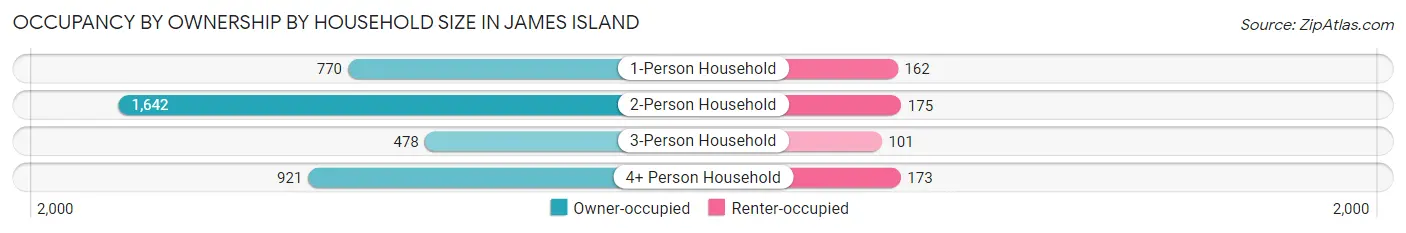
| Household Size | Owner-occupied | Renter-occupied |
| 1-Person Household | 770 (82.6%) | 162 (17.4%) |
| 2-Person Household | 1,642 (90.4%) | 175 (9.6%) |
| 3-Person Household | 478 (82.6%) | 101 (17.4%) |
| 4+ Person Household | 921 (84.2%) | 173 (15.8%) |
| Total Housing Units | 3,811 (86.2%) | 611 (13.8%) |
Occupancy by Educational Attainment in James Island
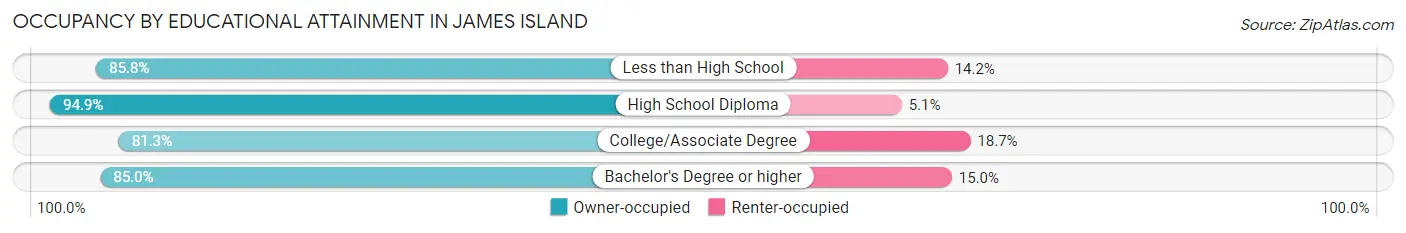
| Household Size | Owner-occupied | Renter-occupied |
| Less than High School | 121 (85.8%) | 20 (14.2%) |
| High School Diploma | 845 (94.9%) | 45 (5.1%) |
| College/Associate Degree | 818 (81.3%) | 188 (18.7%) |
| Bachelor's Degree or higher | 2,027 (85.0%) | 358 (15.0%) |
Occupancy by Age of Householder in James Island
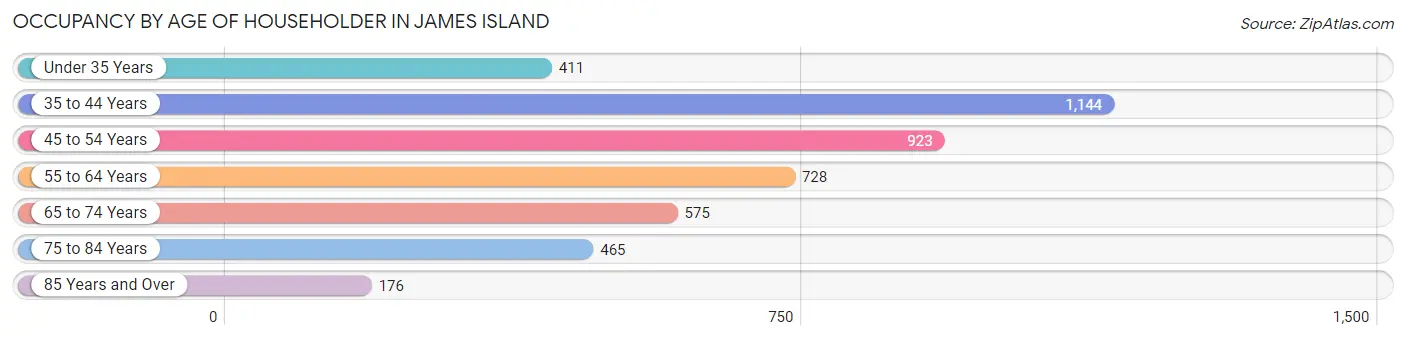
| Age Bracket | # Households | % Households |
| Under 35 Years | 411 | 9.3% |
| 35 to 44 Years | 1,144 | 25.9% |
| 45 to 54 Years | 923 | 20.9% |
| 55 to 64 Years | 728 | 16.5% |
| 65 to 74 Years | 575 | 13.0% |
| 75 to 84 Years | 465 | 10.5% |
| 85 Years and Over | 176 | 4.0% |
| Total | 4,422 | 100.0% |
Housing Finances in James Island
Median Income by Occupancy in James Island
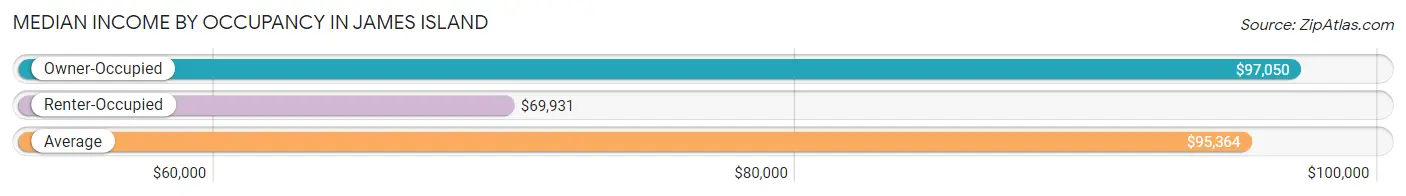
| Occupancy Type | # Households | Median Income |
| Owner-Occupied | 3,811 (86.2%) | $97,050 |
| Renter-Occupied | 611 (13.8%) | $69,931 |
| Average | 4,422 (100.0%) | $95,364 |
Occupancy by Householder Income Bracket in James Island
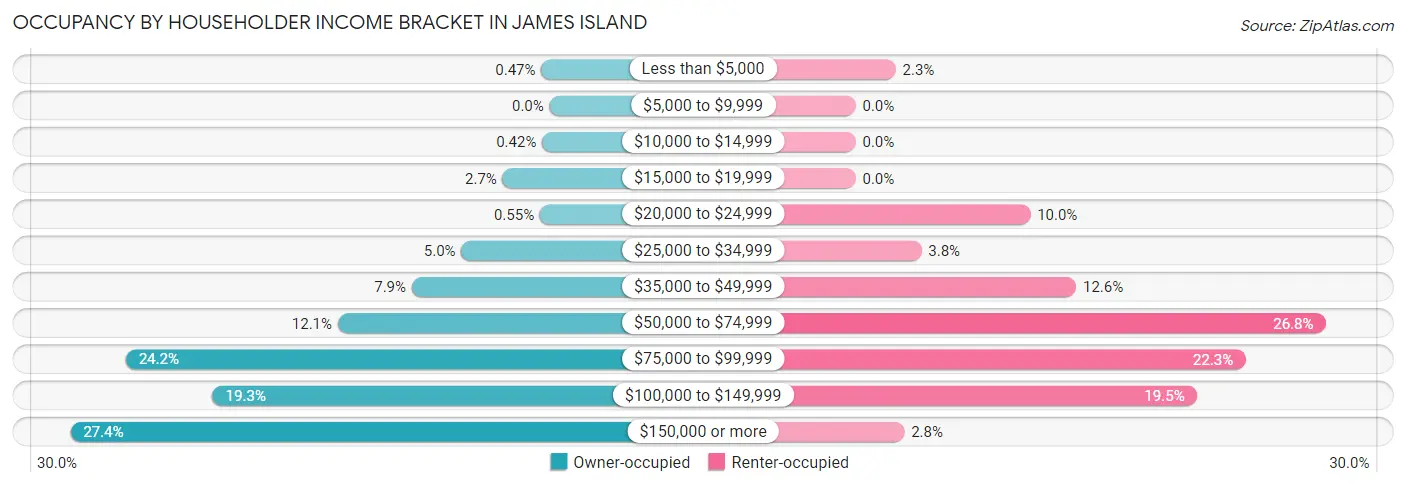
| Income Bracket | Owner-occupied | Renter-occupied |
| Less than $5,000 | 18 (0.5%) | 14 (2.3%) |
| $5,000 to $9,999 | 0 (0.0%) | 0 (0.0%) |
| $10,000 to $14,999 | 16 (0.4%) | 0 (0.0%) |
| $15,000 to $19,999 | 102 (2.7%) | 0 (0.0%) |
| $20,000 to $24,999 | 21 (0.5%) | 61 (10.0%) |
| $25,000 to $34,999 | 192 (5.0%) | 23 (3.8%) |
| $35,000 to $49,999 | 300 (7.9%) | 77 (12.6%) |
| $50,000 to $74,999 | 461 (12.1%) | 164 (26.8%) |
| $75,000 to $99,999 | 923 (24.2%) | 136 (22.3%) |
| $100,000 to $149,999 | 734 (19.3%) | 119 (19.5%) |
| $150,000 or more | 1,044 (27.4%) | 17 (2.8%) |
| Total | 3,811 (100.0%) | 611 (100.0%) |
Monthly Housing Cost Tiers in James Island
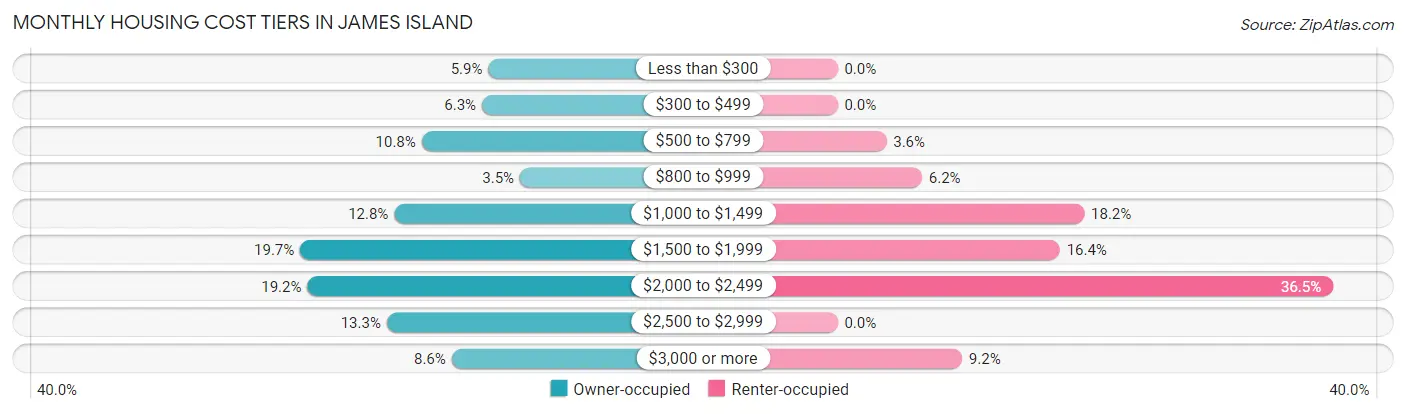
| Monthly Cost | Owner-occupied | Renter-occupied |
| Less than $300 | 223 (5.9%) | 0 (0.0%) |
| $300 to $499 | 241 (6.3%) | 0 (0.0%) |
| $500 to $799 | 410 (10.8%) | 22 (3.6%) |
| $800 to $999 | 134 (3.5%) | 38 (6.2%) |
| $1,000 to $1,499 | 487 (12.8%) | 111 (18.2%) |
| $1,500 to $1,999 | 751 (19.7%) | 100 (16.4%) |
| $2,000 to $2,499 | 731 (19.2%) | 223 (36.5%) |
| $2,500 to $2,999 | 508 (13.3%) | 0 (0.0%) |
| $3,000 or more | 326 (8.6%) | 56 (9.2%) |
| Total | 3,811 (100.0%) | 611 (100.0%) |
Physical Housing Characteristics in James Island
Housing Structures in James Island
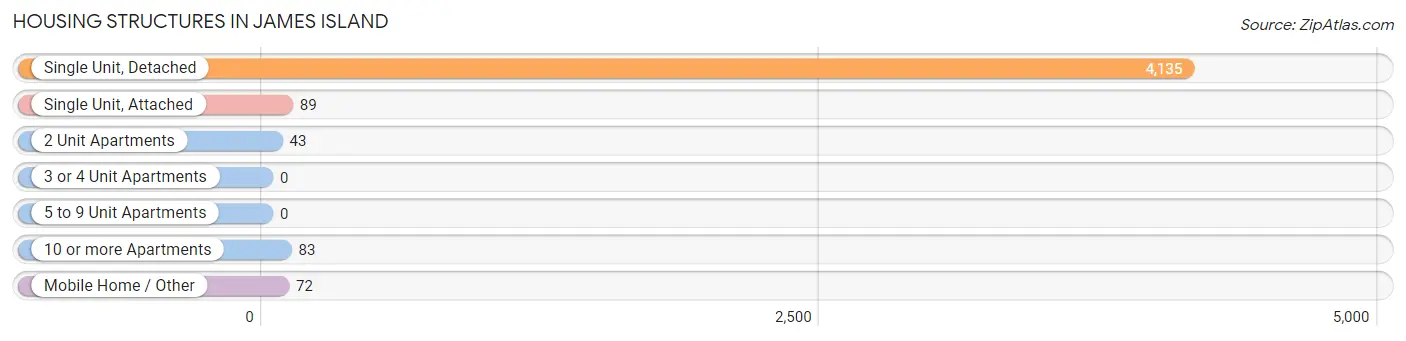
| Structure Type | # Housing Units | % Housing Units |
| Single Unit, Detached | 4,135 | 93.5% |
| Single Unit, Attached | 89 | 2.0% |
| 2 Unit Apartments | 43 | 1.0% |
| 3 or 4 Unit Apartments | 0 | 0.0% |
| 5 to 9 Unit Apartments | 0 | 0.0% |
| 10 or more Apartments | 83 | 1.9% |
| Mobile Home / Other | 72 | 1.6% |
| Total | 4,422 | 100.0% |
Housing Structures by Occupancy in James Island
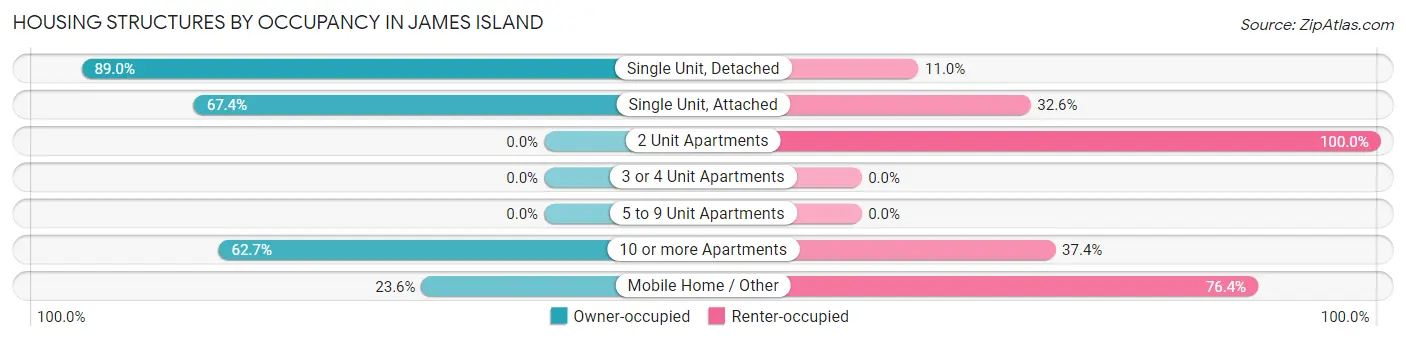
| Structure Type | Owner-occupied | Renter-occupied |
| Single Unit, Detached | 3,682 (89.0%) | 453 (11.0%) |
| Single Unit, Attached | 60 (67.4%) | 29 (32.6%) |
| 2 Unit Apartments | 0 (0.0%) | 43 (100.0%) |
| 3 or 4 Unit Apartments | 0 (0.0%) | 0 (0.0%) |
| 5 to 9 Unit Apartments | 0 (0.0%) | 0 (0.0%) |
| 10 or more Apartments | 52 (62.6%) | 31 (37.3%) |
| Mobile Home / Other | 17 (23.6%) | 55 (76.4%) |
| Total | 3,811 (86.2%) | 611 (13.8%) |
Housing Structures by Number of Rooms in James Island
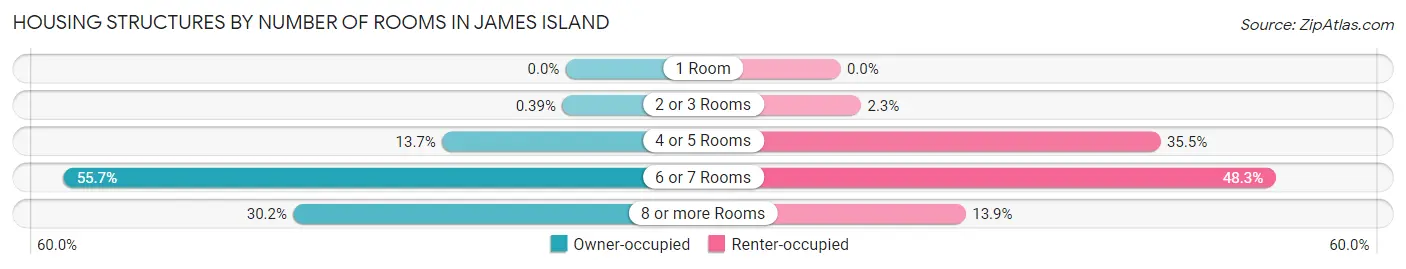
| Number of Rooms | Owner-occupied | Renter-occupied |
| 1 Room | 0 (0.0%) | 0 (0.0%) |
| 2 or 3 Rooms | 15 (0.4%) | 14 (2.3%) |
| 4 or 5 Rooms | 523 (13.7%) | 217 (35.5%) |
| 6 or 7 Rooms | 2,121 (55.6%) | 295 (48.3%) |
| 8 or more Rooms | 1,152 (30.2%) | 85 (13.9%) |
| Total | 3,811 (100.0%) | 611 (100.0%) |
Housing Structure by Heating Type in James Island
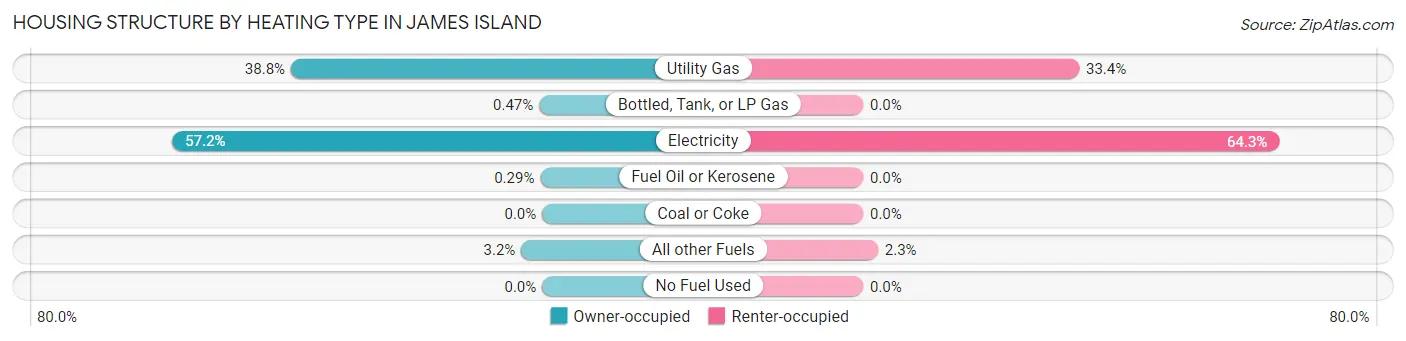
| Heating Type | Owner-occupied | Renter-occupied |
| Utility Gas | 1,480 (38.8%) | 204 (33.4%) |
| Bottled, Tank, or LP Gas | 18 (0.5%) | 0 (0.0%) |
| Electricity | 2,179 (57.2%) | 393 (64.3%) |
| Fuel Oil or Kerosene | 11 (0.3%) | 0 (0.0%) |
| Coal or Coke | 0 (0.0%) | 0 (0.0%) |
| All other Fuels | 123 (3.2%) | 14 (2.3%) |
| No Fuel Used | 0 (0.0%) | 0 (0.0%) |
| Total | 3,811 (100.0%) | 611 (100.0%) |
Household Vehicle Usage in James Island
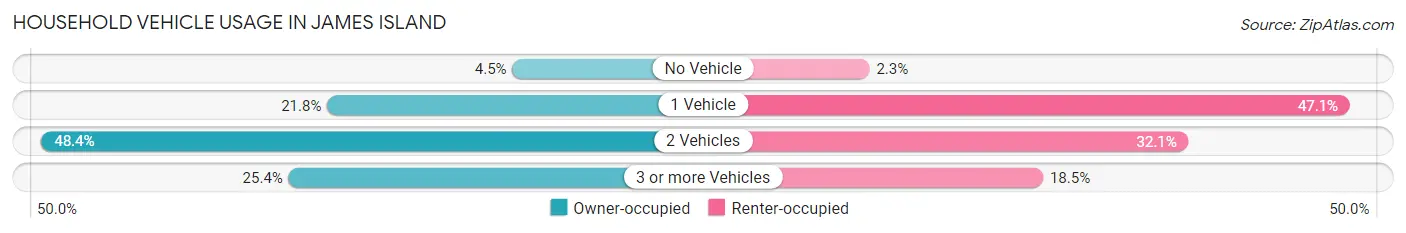
| Vehicles per Household | Owner-occupied | Renter-occupied |
| No Vehicle | 170 (4.5%) | 14 (2.3%) |
| 1 Vehicle | 829 (21.7%) | 288 (47.1%) |
| 2 Vehicles | 1,846 (48.4%) | 196 (32.1%) |
| 3 or more Vehicles | 966 (25.4%) | 113 (18.5%) |
| Total | 3,811 (100.0%) | 611 (100.0%) |
Real Estate & Mortgages in James Island
Real Estate and Mortgage Overview in James Island
| Characteristic | Without Mortgage | With Mortgage |
| Housing Units | 1,054 | 2,757 |
| Median Property Value | $407,100 | $419,100 |
| Median Household Income | $82,181 | $889 |
| Monthly Housing Costs | $611 | $313 |
| Real Estate Taxes | $1,520 | $0 |
Property Value by Mortgage Status in James Island
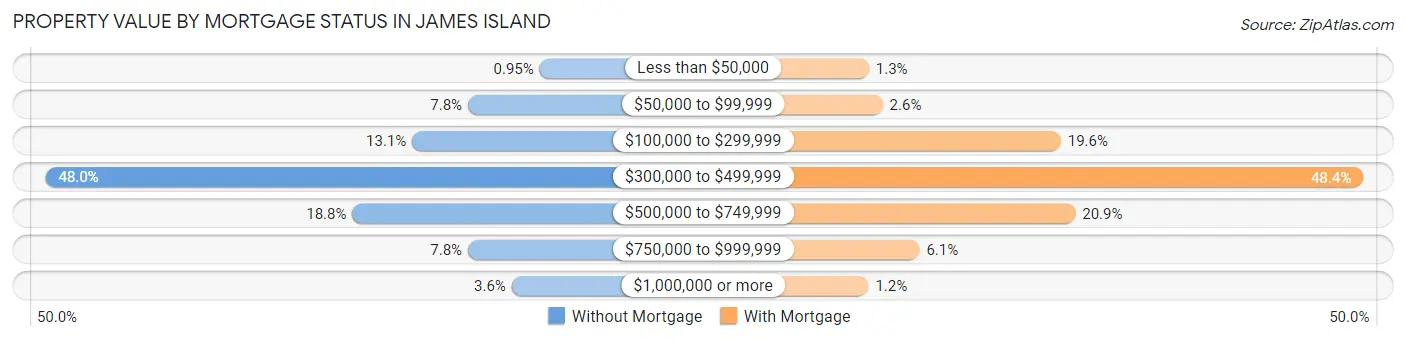
| Property Value | Without Mortgage | With Mortgage |
| Less than $50,000 | 10 (0.9%) | 35 (1.3%) |
| $50,000 to $99,999 | 82 (7.8%) | 71 (2.6%) |
| $100,000 to $299,999 | 138 (13.1%) | 539 (19.6%) |
| $300,000 to $499,999 | 506 (48.0%) | 1,333 (48.3%) |
| $500,000 to $749,999 | 198 (18.8%) | 577 (20.9%) |
| $750,000 to $999,999 | 82 (7.8%) | 168 (6.1%) |
| $1,000,000 or more | 38 (3.6%) | 34 (1.2%) |
| Total | 1,054 (100.0%) | 2,757 (100.0%) |
Household Income by Mortgage Status in James Island
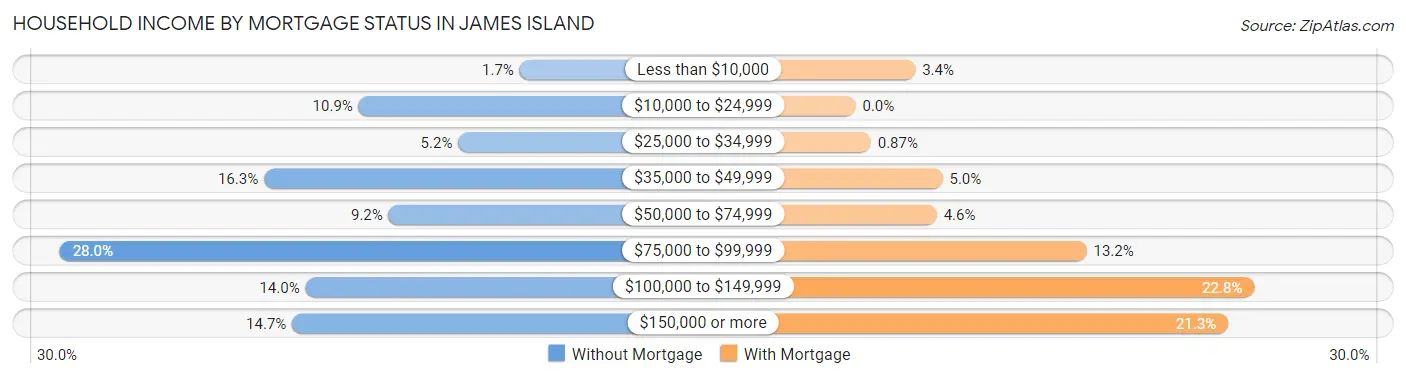
| Household Income | Without Mortgage | With Mortgage |
| Less than $10,000 | 18 (1.7%) | 94 (3.4%) |
| $10,000 to $24,999 | 115 (10.9%) | 0 (0.0%) |
| $25,000 to $34,999 | 55 (5.2%) | 24 (0.9%) |
| $35,000 to $49,999 | 172 (16.3%) | 137 (5.0%) |
| $50,000 to $74,999 | 97 (9.2%) | 128 (4.6%) |
| $75,000 to $99,999 | 295 (28.0%) | 364 (13.2%) |
| $100,000 to $149,999 | 147 (14.0%) | 628 (22.8%) |
| $150,000 or more | 155 (14.7%) | 587 (21.3%) |
| Total | 1,054 (100.0%) | 2,757 (100.0%) |
Property Value to Household Income Ratio in James Island
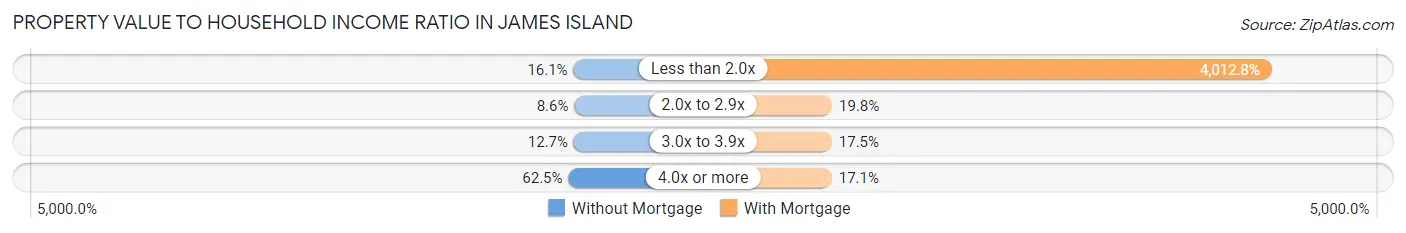
| Value-to-Income Ratio | Without Mortgage | With Mortgage |
| Less than 2.0x | 170 (16.1%) | 110,633 (4,012.8%) |
| 2.0x to 2.9x | 91 (8.6%) | 545 (19.8%) |
| 3.0x to 3.9x | 134 (12.7%) | 482 (17.5%) |
| 4.0x or more | 659 (62.5%) | 471 (17.1%) |
| Total | 1,054 (100.0%) | 2,757 (100.0%) |
Real Estate Taxes by Mortgage Status in James Island
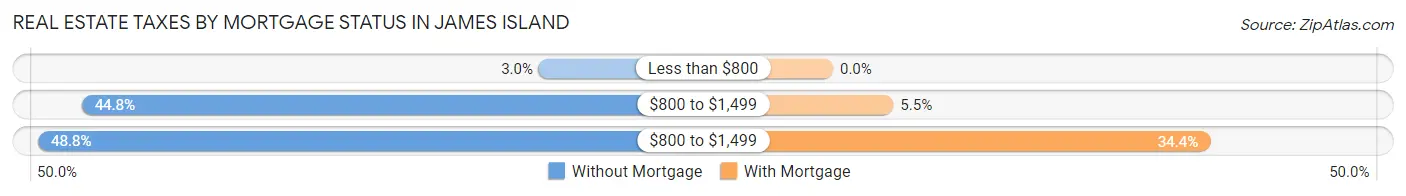
| Property Taxes | Without Mortgage | With Mortgage |
| Less than $800 | 32 (3.0%) | 0 (0.0%) |
| $800 to $1,499 | 472 (44.8%) | 152 (5.5%) |
| $800 to $1,499 | 514 (48.8%) | 949 (34.4%) |
| Total | 1,054 (100.0%) | 2,757 (100.0%) |
Health & Disability in James Island
Health Insurance Coverage by Age in James Island
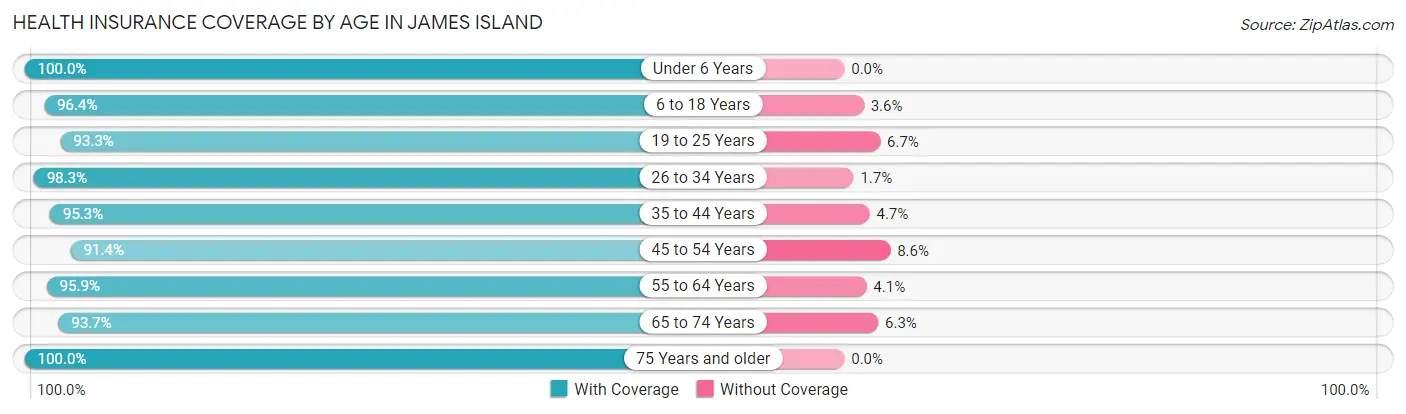
| Age Bracket | With Coverage | Without Coverage |
| Under 6 Years | 875 (100.0%) | 0 (0.0%) |
| 6 to 18 Years | 1,675 (96.4%) | 63 (3.6%) |
| 19 to 25 Years | 531 (93.3%) | 38 (6.7%) |
| 26 to 34 Years | 922 (98.3%) | 16 (1.7%) |
| 35 to 44 Years | 2,064 (95.3%) | 102 (4.7%) |
| 45 to 54 Years | 1,794 (91.4%) | 168 (8.6%) |
| 55 to 64 Years | 1,325 (95.9%) | 57 (4.1%) |
| 65 to 74 Years | 981 (93.7%) | 66 (6.3%) |
| 75 Years and older | 1,012 (100.0%) | 0 (0.0%) |
| Total | 11,179 (95.6%) | 510 (4.4%) |
Health Insurance Coverage by Citizenship Status in James Island
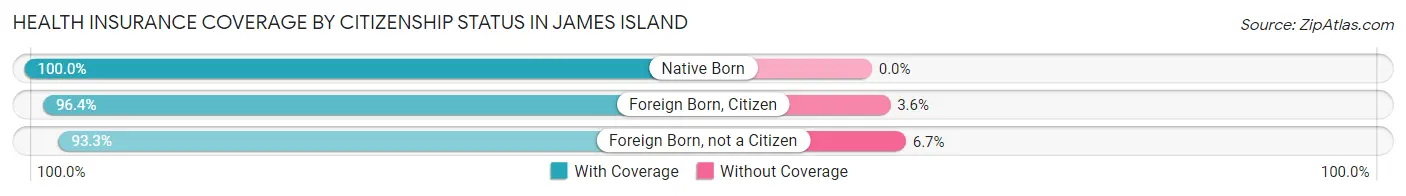
| Citizenship Status | With Coverage | Without Coverage |
| Native Born | 875 (100.0%) | 0 (0.0%) |
| Foreign Born, Citizen | 1,675 (96.4%) | 63 (3.6%) |
| Foreign Born, not a Citizen | 531 (93.3%) | 38 (6.7%) |
Health Insurance Coverage by Household Income in James Island
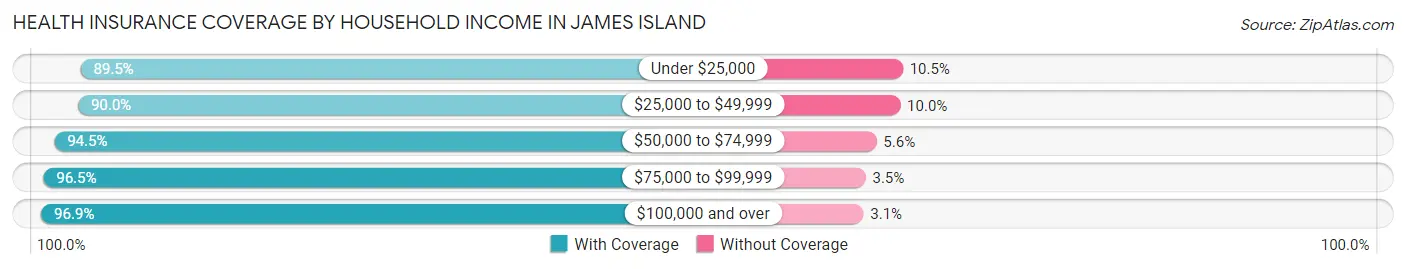
| Household Income | With Coverage | Without Coverage |
| Under $25,000 | 402 (89.5%) | 47 (10.5%) |
| $25,000 to $49,999 | 882 (90.0%) | 98 (10.0%) |
| $50,000 to $74,999 | 1,395 (94.5%) | 82 (5.6%) |
| $75,000 to $99,999 | 2,725 (96.5%) | 99 (3.5%) |
| $100,000 and over | 5,758 (96.9%) | 184 (3.1%) |
Public vs Private Health Insurance Coverage by Age in James Island
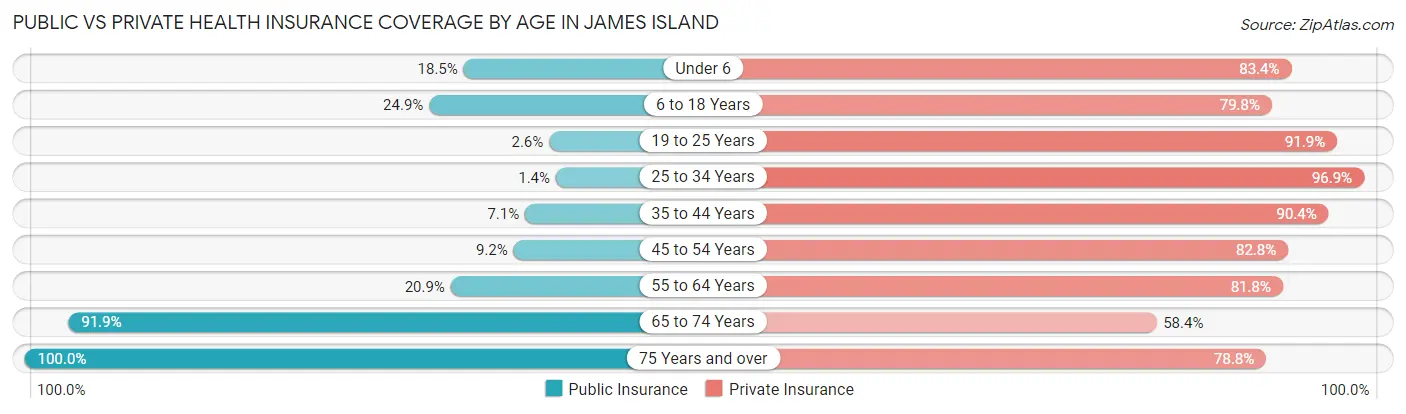
| Age Bracket | Public Insurance | Private Insurance |
| Under 6 | 162 (18.5%) | 730 (83.4%) |
| 6 to 18 Years | 433 (24.9%) | 1,387 (79.8%) |
| 19 to 25 Years | 15 (2.6%) | 523 (91.9%) |
| 25 to 34 Years | 13 (1.4%) | 909 (96.9%) |
| 35 to 44 Years | 154 (7.1%) | 1,957 (90.3%) |
| 45 to 54 Years | 181 (9.2%) | 1,625 (82.8%) |
| 55 to 64 Years | 289 (20.9%) | 1,131 (81.8%) |
| 65 to 74 Years | 962 (91.9%) | 611 (58.4%) |
| 75 Years and over | 1,012 (100.0%) | 797 (78.7%) |
| Total | 3,221 (27.6%) | 9,670 (82.7%) |
Disability Status by Sex by Age in James Island
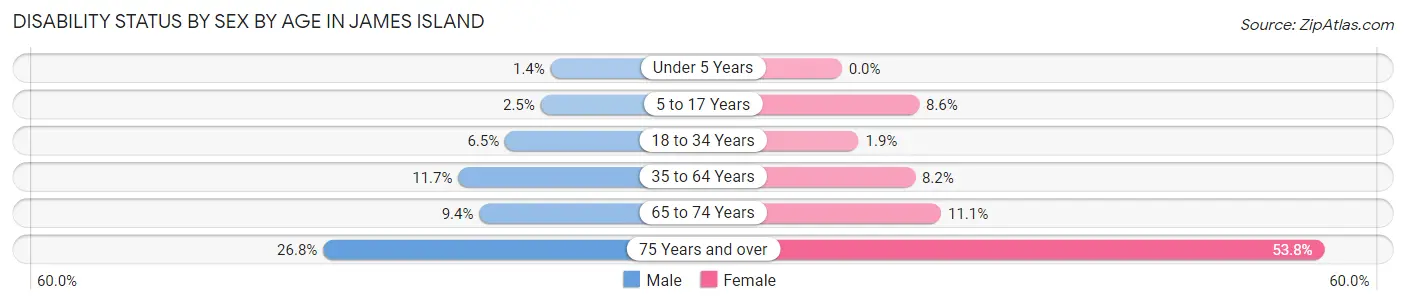
| Age Bracket | Male | Female |
| Under 5 Years | 6 (1.4%) | 0 (0.0%) |
| 5 to 17 Years | 22 (2.5%) | 87 (8.6%) |
| 18 to 34 Years | 52 (6.5%) | 15 (1.9%) |
| 35 to 64 Years | 342 (11.7%) | 211 (8.2%) |
| 65 to 74 Years | 48 (9.4%) | 59 (11.1%) |
| 75 Years and over | 103 (26.8%) | 337 (53.7%) |
Disability Class by Sex by Age in James Island
Disability Class: Hearing Difficulty
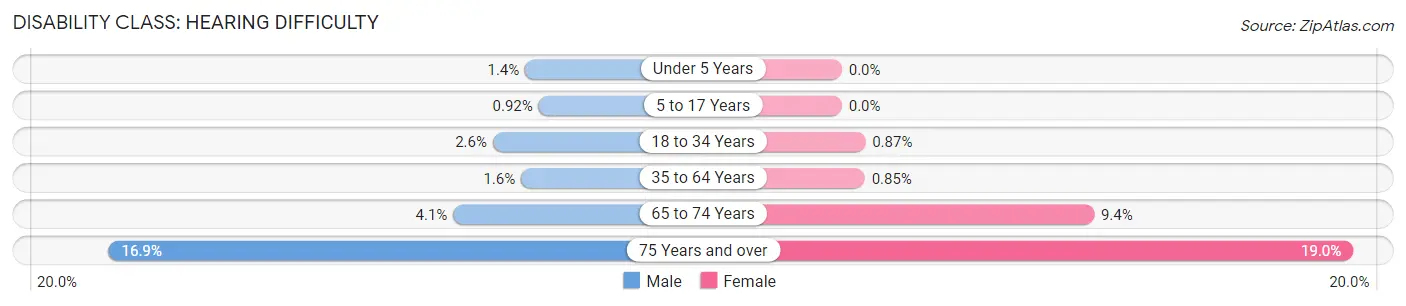
| Age Bracket | Male | Female |
| Under 5 Years | 6 (1.4%) | 0 (0.0%) |
| 5 to 17 Years | 8 (0.9%) | 0 (0.0%) |
| 18 to 34 Years | 21 (2.6%) | 7 (0.9%) |
| 35 to 64 Years | 46 (1.6%) | 22 (0.9%) |
| 65 to 74 Years | 21 (4.1%) | 50 (9.4%) |
| 75 Years and over | 65 (16.9%) | 119 (19.0%) |
Disability Class: Vision Difficulty
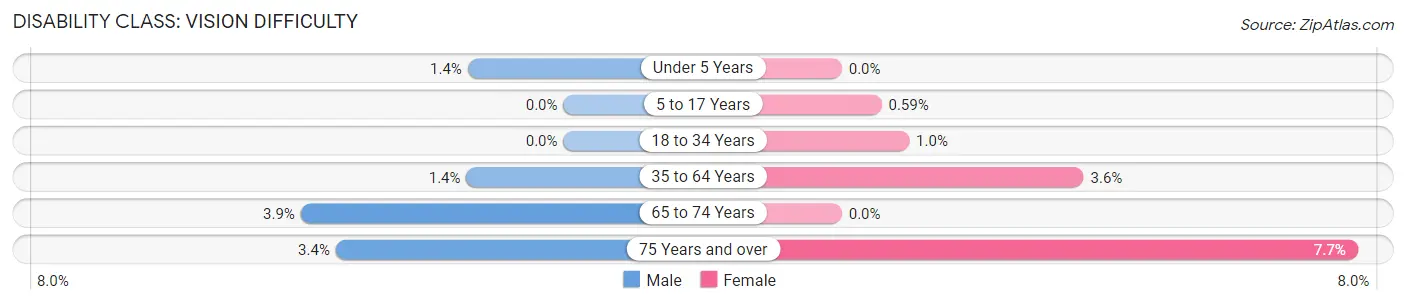
| Age Bracket | Male | Female |
| Under 5 Years | 6 (1.4%) | 0 (0.0%) |
| 5 to 17 Years | 0 (0.0%) | 6 (0.6%) |
| 18 to 34 Years | 0 (0.0%) | 8 (1.0%) |
| 35 to 64 Years | 42 (1.4%) | 93 (3.6%) |
| 65 to 74 Years | 20 (3.9%) | 0 (0.0%) |
| 75 Years and over | 13 (3.4%) | 48 (7.7%) |
Disability Class: Cognitive Difficulty
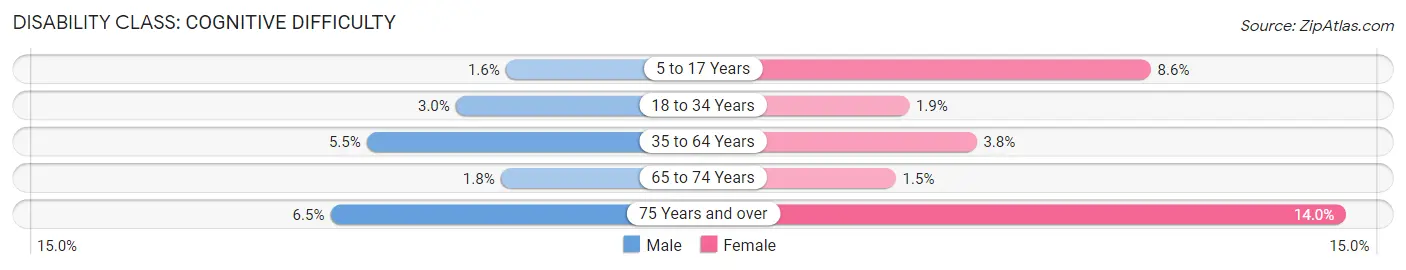
| Age Bracket | Male | Female |
| 5 to 17 Years | 14 (1.6%) | 87 (8.6%) |
| 18 to 34 Years | 24 (3.0%) | 15 (1.9%) |
| 35 to 64 Years | 160 (5.5%) | 97 (3.7%) |
| 65 to 74 Years | 9 (1.8%) | 8 (1.5%) |
| 75 Years and over | 25 (6.5%) | 88 (14.0%) |
Disability Class: Ambulatory Difficulty
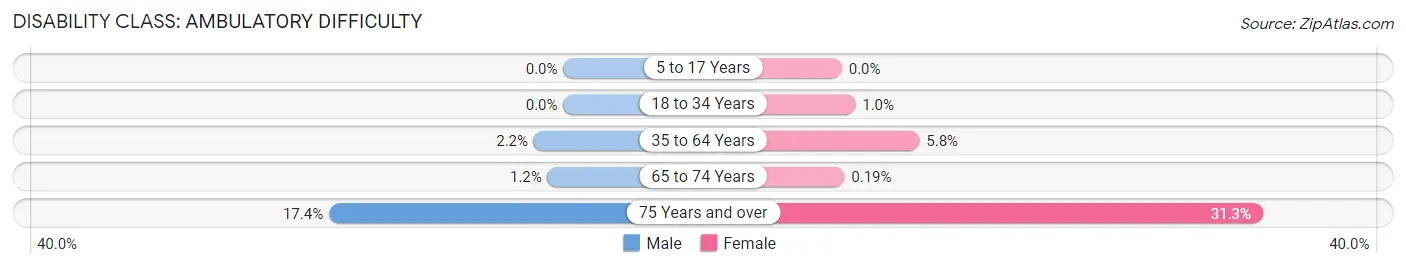
| Age Bracket | Male | Female |
| 5 to 17 Years | 0 (0.0%) | 0 (0.0%) |
| 18 to 34 Years | 0 (0.0%) | 8 (1.0%) |
| 35 to 64 Years | 64 (2.2%) | 149 (5.8%) |
| 65 to 74 Years | 6 (1.2%) | 1 (0.2%) |
| 75 Years and over | 67 (17.4%) | 196 (31.3%) |
Disability Class: Self-Care Difficulty
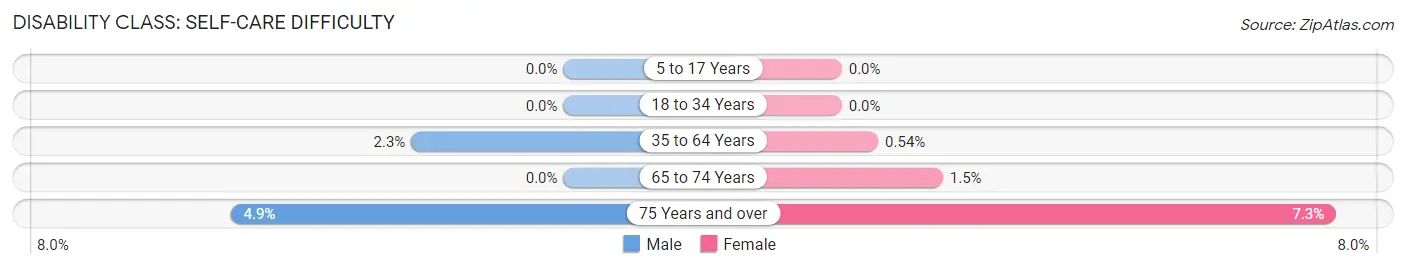
| Age Bracket | Male | Female |
| 5 to 17 Years | 0 (0.0%) | 0 (0.0%) |
| 18 to 34 Years | 0 (0.0%) | 0 (0.0%) |
| 35 to 64 Years | 66 (2.3%) | 14 (0.5%) |
| 65 to 74 Years | 0 (0.0%) | 8 (1.5%) |
| 75 Years and over | 19 (4.9%) | 46 (7.3%) |
Technology Access in James Island
Computing Device Access in James Island
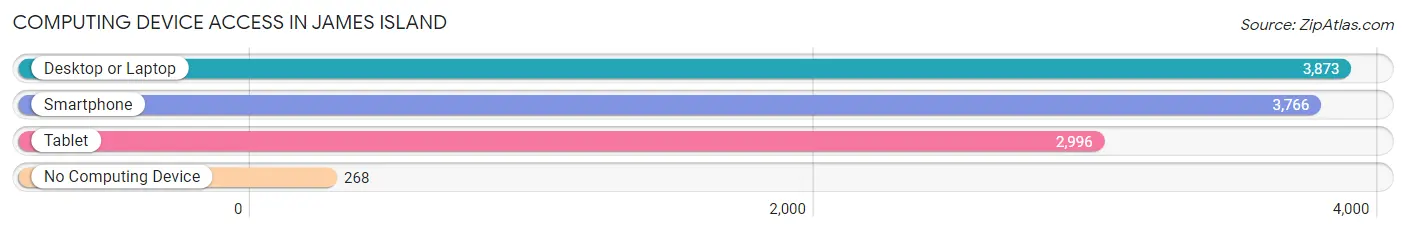
| Device Type | # Households | % Households |
| Desktop or Laptop | 3,873 | 87.6% |
| Smartphone | 3,766 | 85.2% |
| Tablet | 2,996 | 67.7% |
| No Computing Device | 268 | 6.1% |
| Total | 4,422 | 100.0% |
Internet Access in James Island
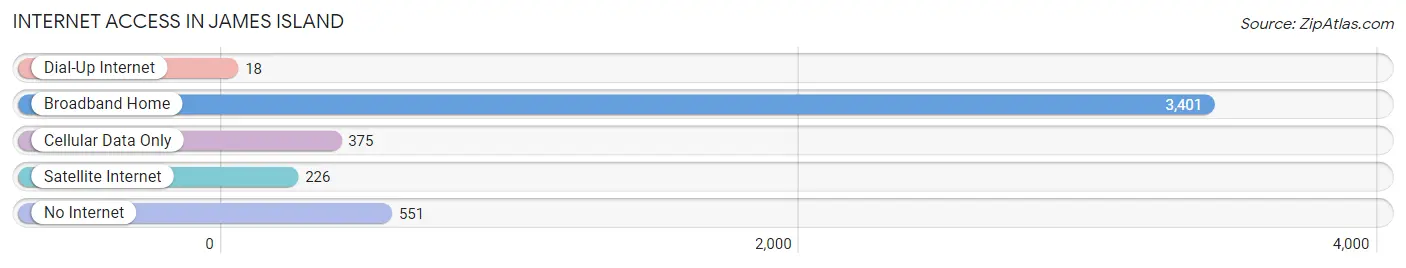
| Internet Type | # Households | % Households |
| Dial-Up Internet | 18 | 0.4% |
| Broadband Home | 3,401 | 76.9% |
| Cellular Data Only | 375 | 8.5% |
| Satellite Internet | 226 | 5.1% |
| No Internet | 551 | 12.5% |
| Total | 4,422 | 100.0% |
James Island Summary
History
James Island is a small island located in Charleston County, South Carolina. It is situated between the Ashley and Stono Rivers, and is connected to the mainland by the James Island Connector. The island was first settled by the English in 1671, and was named after King James II of England. The island was originally used for farming and fishing, and was home to several plantations. During the American Revolution, James Island was the site of several battles, including the Battle of James Island in 1779.
In the 19th century, James Island became a popular summer resort destination for wealthy Charlestonians. The island was home to several grand hotels, including the James Island Hotel, which was built in 1883. The island also became a popular destination for African Americans, who established several churches and businesses on the island.
In the 20th century, James Island experienced rapid growth as the city of Charleston expanded. The island was annexed by the city in 1991, and is now home to a population of over 12,000 people.
Geography
James Island is located in Charleston County, South Carolina. It is situated between the Ashley and Stono Rivers, and is connected to the mainland by the James Island Connector. The island is approximately 8.5 square miles in size, and is home to several parks and nature preserves. The island is bordered by the Ashley River to the north, the Stono River to the south, and the Folly River to the east.
The island is mostly flat, with an elevation of just 10 feet above sea level. The island is home to several creeks and marshes, as well as several small lakes. The island is also home to several beaches, including Folly Beach and Kiawah Island.
Economy
James Island is home to a diverse economy. The island is home to several businesses, including restaurants, retail stores, and professional services. The island is also home to several industrial and manufacturing companies, including the James Island Industrial Park.
The island is also home to several tourist attractions, including the James Island County Park, which features a water park, a nature center, and a golf course. The island is also home to several marinas, which offer boat rentals and fishing charters.
Demographics
As of the 2010 census, James Island had a population of 12,335 people. The population is predominantly white (77.3%), with African Americans making up the second largest racial group (17.2%). The median household income is $50,845, and the median home value is $220,000. The island is home to several churches, including the James Island Presbyterian Church and the James Island Baptist Church.
Common Questions
What is Per Capita Income in James Island?
Per Capita income in James Island is $46,843.
What is the Median Family Income in James Island?
Median Family Income in James Island is $108,611.
What is the Median Household income in James Island?
Median Household Income in James Island is $95,364.
What is Income or Wage Gap in James Island?
Income or Wage Gap in James Island is 14.2%.
Women in James Island earn 85.8 cents for every dollar earned by a man.
What is Inequality or Gini Index in James Island?
Inequality or Gini Index in James Island is 0.39.
What is the Total Population of James Island?
Total Population of James Island is 11,689.
What is the Total Male Population of James Island?
Total Male Population of James Island is 5,914.
What is the Total Female Population of James Island?
Total Female Population of James Island is 5,775.
What is the Ratio of Males per 100 Females in James Island?
There are 102.41 Males per 100 Females in James Island.
What is the Ratio of Females per 100 Males in James Island?
There are 97.65 Females per 100 Males in James Island.
What is the Median Population Age in James Island?
Median Population Age in James Island is 41.4 Years.
What is the Average Family Size in James Island
Average Family Size in James Island is 3.1 People.
What is the Average Household Size in James Island
Average Household Size in James Island is 2.6 People.
How Large is the Labor Force in James Island?
There are 6,540 People in the Labor Forcein in James Island.
What is the Percentage of People in the Labor Force in James Island?
68.6% of People are in the Labor Force in James Island.
What is the Unemployment Rate in James Island?
Unemployment Rate in James Island is 1.7%.