Winnsboro, SC Map & Demographics
Winnsboro Map
Winnsboro Overview
$16,254
PER CAPITA INCOME
$32,026
AVG FAMILY INCOME
$31,194
AVG HOUSEHOLD INCOME
27.9%
WAGE / INCOME GAP [ % ]
72.1¢/ $1
WAGE / INCOME GAP [ $ ]
$11,585
FAMILY INCOME DEFICIT
0.45
INEQUALITY / GINI INDEX
3,239
TOTAL POPULATION
1,470
MALE POPULATION
1,769
FEMALE POPULATION
83.10
MALES / 100 FEMALES
120.34
FEMALES / 100 MALES
34.2
MEDIAN AGE
3.0
AVG FAMILY SIZE
2.4
AVG HOUSEHOLD SIZE
1,201
LABOR FORCE [ PEOPLE ]
52.2%
PERCENT IN LABOR FORCE
10.6%
UNEMPLOYMENT RATE
Winnsboro Zip Codes
Winnsboro Area Codes
Income in Winnsboro
Income Overview in Winnsboro
Per Capita Income in Winnsboro is $16,254, while median incomes of families and households are $32,026 and $31,194 respectively.
| Characteristic | Number | Measure |
| Per Capita Income | 3,239 | $16,254 |
| Median Family Income | 934 | $32,026 |
| Mean Family Income | 934 | $43,750 |
| Median Household Income | 1,331 | $31,194 |
| Mean Household Income | 1,331 | $38,684 |
| Income Deficit | 934 | $11,585 |
| Wage / Income Gap (%) | 3,239 | 27.86% |
| Wage / Income Gap ($) | 3,239 | 72.14¢ per $1 |
| Gini / Inequality Index | 3,239 | 0.45 |
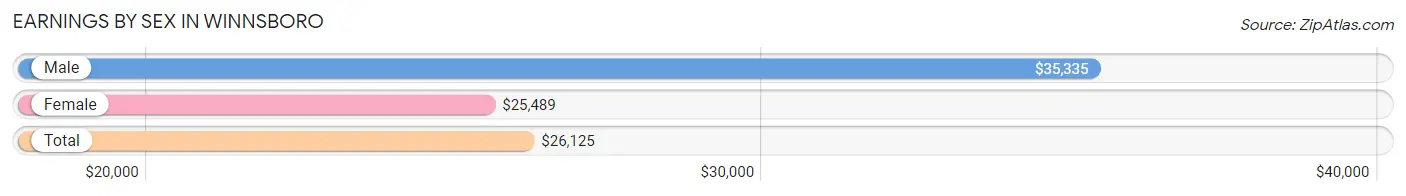
Earnings by Sex in Winnsboro
Average Earnings in Winnsboro are $26,125, $35,335 for men and $25,489 for women, a difference of 27.9%.
| Sex | Number | Average Earnings |
| Male | 429 (36.1%) | $35,335 |
| Female | 758 (63.9%) | $25,489 |
| Total | 1,187 (100.0%) | $26,125 |
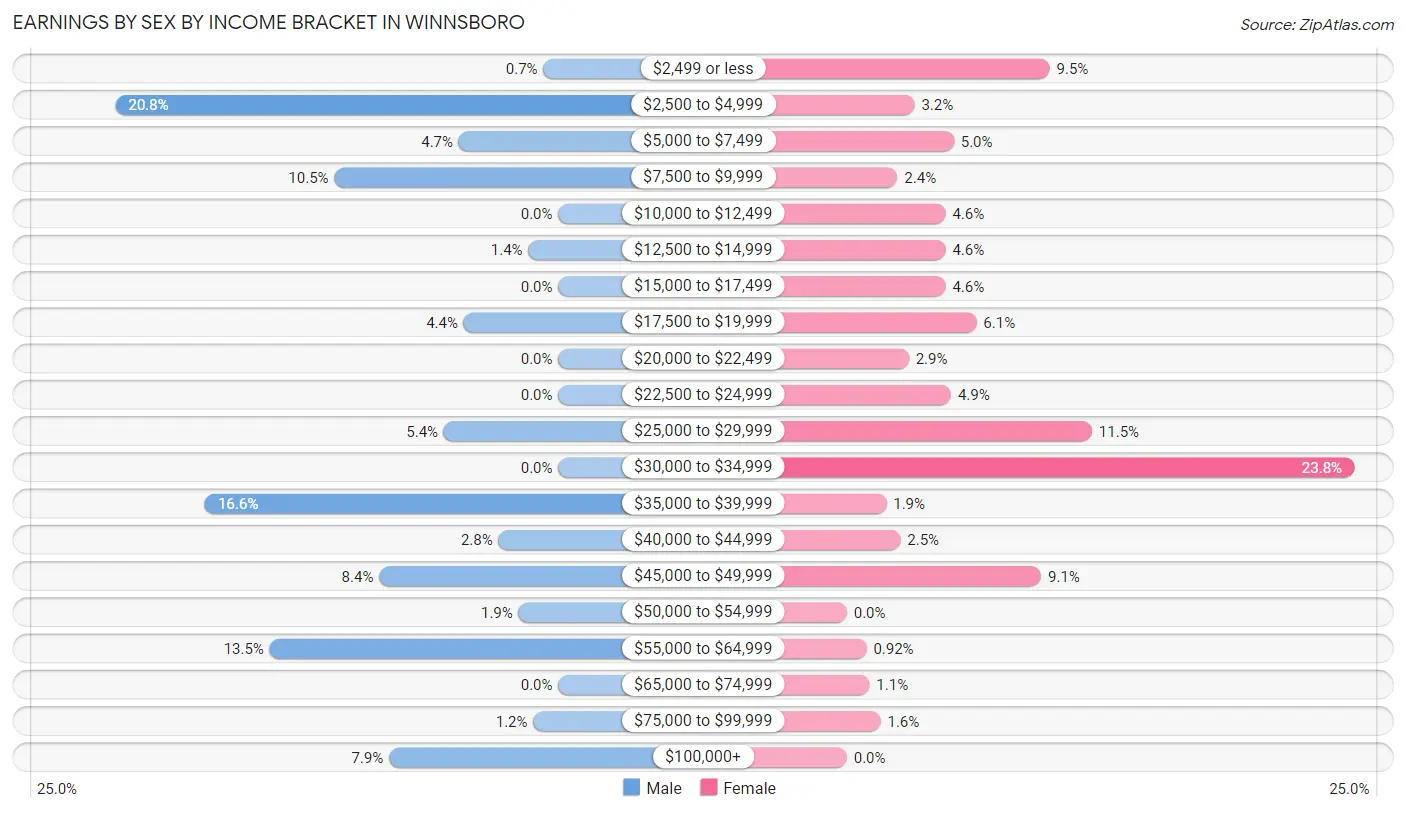
Earnings by Sex by Income Bracket in Winnsboro
The most common earnings brackets in Winnsboro are $2,500 to $4,999 for men (89 | 20.7%) and $30,000 to $34,999 for women (180 | 23.7%).
| Income | Male | Female |
| $2,499 or less | 3 (0.7%) | 72 (9.5%) |
| $2,500 to $4,999 | 89 (20.7%) | 24 (3.2%) |
| $5,000 to $7,499 | 20 (4.7%) | 38 (5.0%) |
| $7,500 to $9,999 | 45 (10.5%) | 18 (2.4%) |
| $10,000 to $12,499 | 0 (0.0%) | 35 (4.6%) |
| $12,500 to $14,999 | 6 (1.4%) | 35 (4.6%) |
| $15,000 to $17,499 | 0 (0.0%) | 35 (4.6%) |
| $17,500 to $19,999 | 19 (4.4%) | 46 (6.1%) |
| $20,000 to $22,499 | 0 (0.0%) | 22 (2.9%) |
| $22,500 to $24,999 | 0 (0.0%) | 37 (4.9%) |
| $25,000 to $29,999 | 23 (5.4%) | 87 (11.5%) |
| $30,000 to $34,999 | 0 (0.0%) | 180 (23.7%) |
| $35,000 to $39,999 | 71 (16.6%) | 14 (1.8%) |
| $40,000 to $44,999 | 12 (2.8%) | 19 (2.5%) |
| $45,000 to $49,999 | 36 (8.4%) | 69 (9.1%) |
| $50,000 to $54,999 | 8 (1.9%) | 0 (0.0%) |
| $55,000 to $64,999 | 58 (13.5%) | 7 (0.9%) |
| $65,000 to $74,999 | 0 (0.0%) | 8 (1.1%) |
| $75,000 to $99,999 | 5 (1.2%) | 12 (1.6%) |
| $100,000+ | 34 (7.9%) | 0 (0.0%) |
| Total | 429 (100.0%) | 758 (100.0%) |
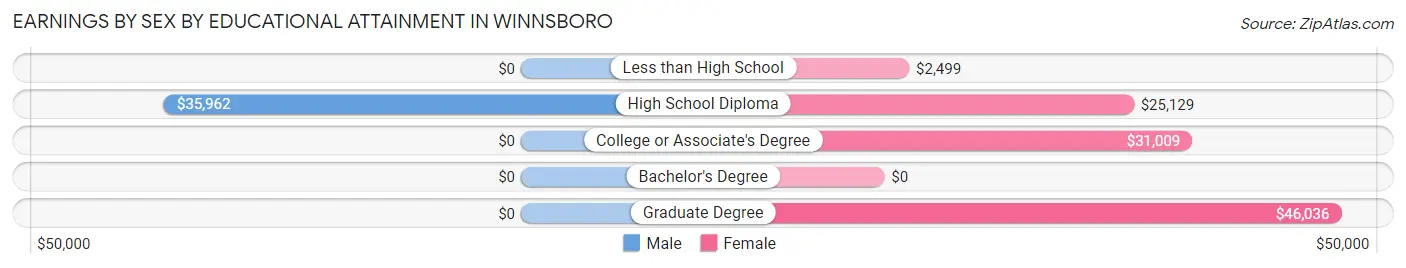
Earnings by Sex by Educational Attainment in Winnsboro
Average earnings in Winnsboro are $36,285 for men and $26,954 for women, a difference of 25.7%. Men with an educational attainment of high school diploma enjoy the highest average annual earnings of $35,962, while those with high school diploma education earn the least with $35,962. Women with an educational attainment of graduate degree earn the most with the average annual earnings of $46,036, while those with less than high school education have the smallest earnings of $2,499.
| Educational Attainment | Male Income | Female Income |
| Less than High School | - | - |
| High School Diploma | $35,962 | $25,129 |
| College or Associate's Degree | - | - |
| Bachelor's Degree | - | - |
| Graduate Degree | - | - |
| Total | $36,285 | $26,954 |
Family Income in Winnsboro
Family Income Brackets in Winnsboro
According to the Winnsboro family income data, there are 368 families falling into the $25,000 to $34,999 income range, which is the most common income bracket and makes up 39.4% of all families. Conversely, the $10,000 to $14,999 income bracket is the least frequent group with only 8 families (0.9%) belonging to this category.
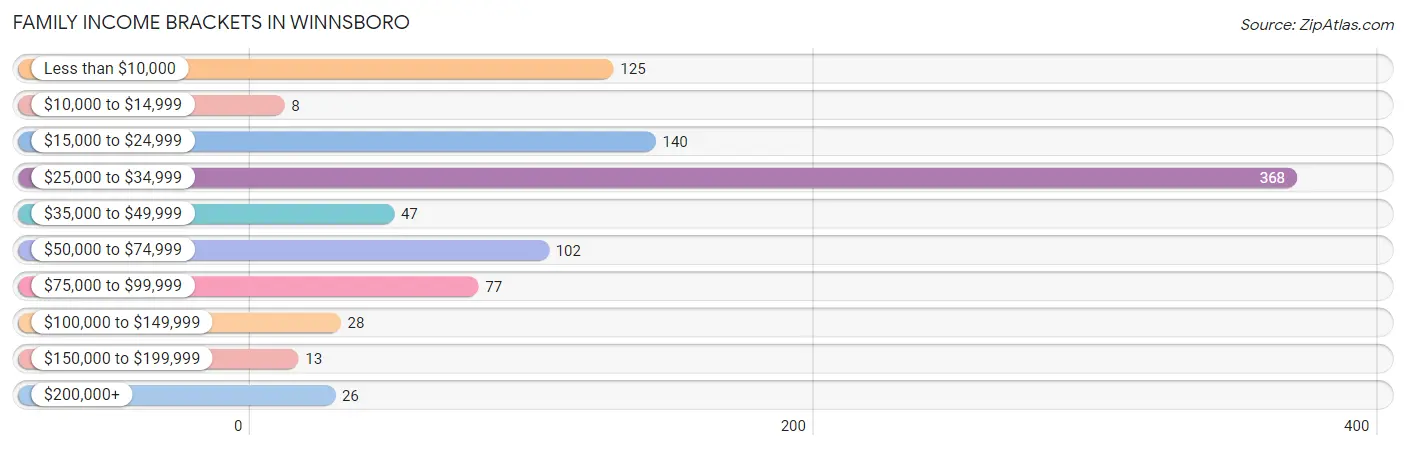
| Income Bracket | # Families | % Families |
| Less than $10,000 | 125 | 13.4% |
| $10,000 to $14,999 | 8 | 0.9% |
| $15,000 to $24,999 | 140 | 15.0% |
| $25,000 to $34,999 | 368 | 39.4% |
| $35,000 to $49,999 | 47 | 5.0% |
| $50,000 to $74,999 | 102 | 10.9% |
| $75,000 to $99,999 | 77 | 8.2% |
| $100,000 to $149,999 | 28 | 3.0% |
| $150,000 to $199,999 | 13 | 1.4% |
| $200,000+ | 26 | 2.8% |
Family Income by Famaliy Size in Winnsboro
2-person families (349 | 37.4%) account for the highest median family income in Winnsboro with $42,566 per family, while 2-person families (349 | 37.4%) have the highest median income of $21,283 per family member.
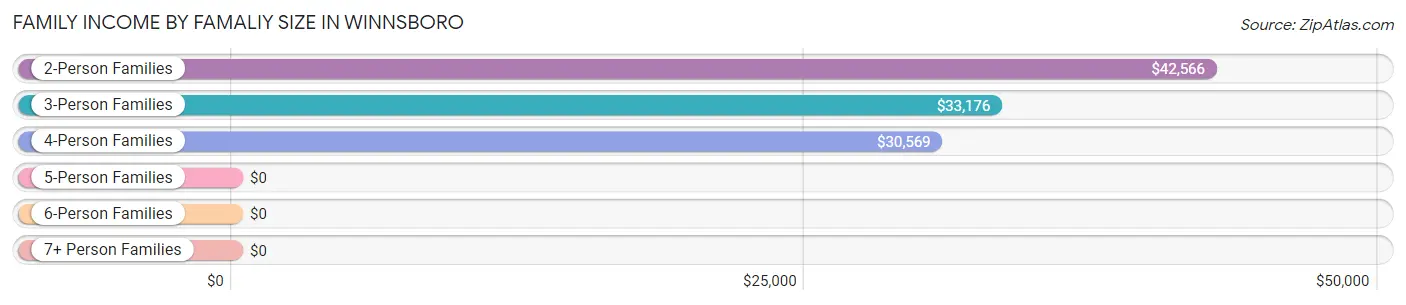
| Income Bracket | # Families | Median Income |
| 2-Person Families | 349 (37.4%) | $42,566 |
| 3-Person Families | 350 (37.5%) | $33,176 |
| 4-Person Families | 172 (18.4%) | $30,569 |
| 5-Person Families | 22 (2.4%) | $0 |
| 6-Person Families | 0 (0.0%) | $0 |
| 7+ Person Families | 41 (4.4%) | $0 |
| Total | 934 (100.0%) | $32,026 |
Family Income by Number of Earners in Winnsboro
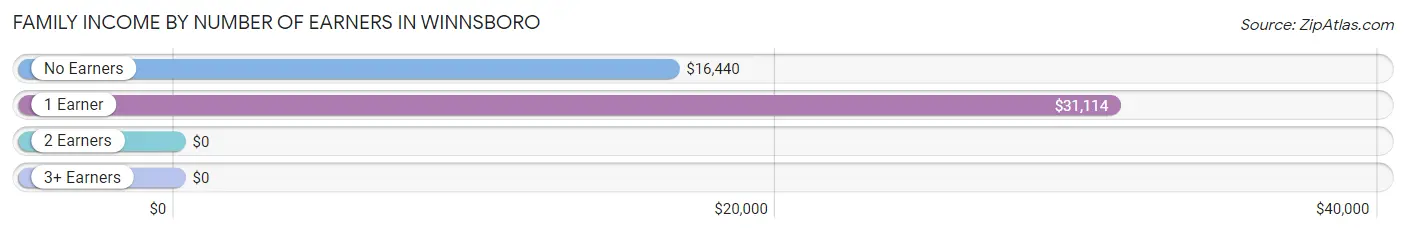
| Number of Earners | # Families | Median Income |
| No Earners | 207 (22.2%) | $16,440 |
| 1 Earner | 470 (50.3%) | $31,114 |
| 2 Earners | 220 (23.5%) | $0 |
| 3+ Earners | 37 (4.0%) | $0 |
| Total | 934 (100.0%) | $32,026 |
Household Income in Winnsboro
Household Income Brackets in Winnsboro
With 433 households falling in the category, the $25,000 to $34,999 income range is the most frequent in Winnsboro, accounting for 32.5% of all households. In contrast, only 13 households (1.0%) fall into the $150,000 to $199,999 income bracket, making it the least populous group.
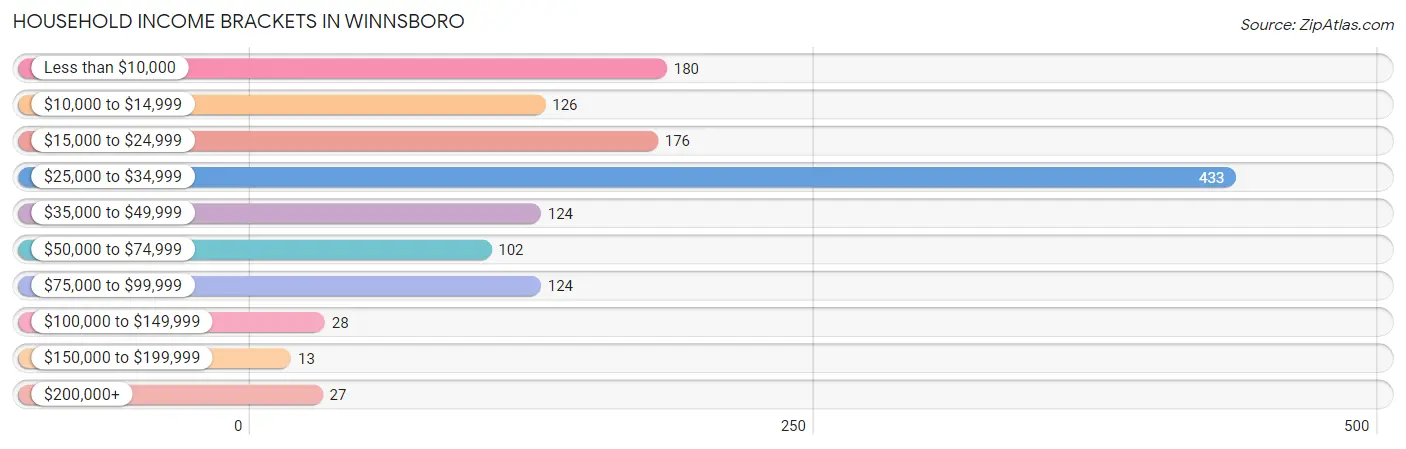
| Income Bracket | # Households | % Households |
| Less than $10,000 | 180 | 13.5% |
| $10,000 to $14,999 | 126 | 9.5% |
| $15,000 to $24,999 | 176 | 13.2% |
| $25,000 to $34,999 | 433 | 32.5% |
| $35,000 to $49,999 | 124 | 9.3% |
| $50,000 to $74,999 | 102 | 7.7% |
| $75,000 to $99,999 | 124 | 9.3% |
| $100,000 to $149,999 | 28 | 2.1% |
| $150,000 to $199,999 | 13 | 1.0% |
| $200,000+ | 27 | 2.0% |
Household Income by Householder Age in Winnsboro
The median household income in Winnsboro is $31,194, with the highest median household income of $32,327 found in the 25 to 44 years age bracket for the primary householder. A total of 483 households (36.3%) fall into this category.
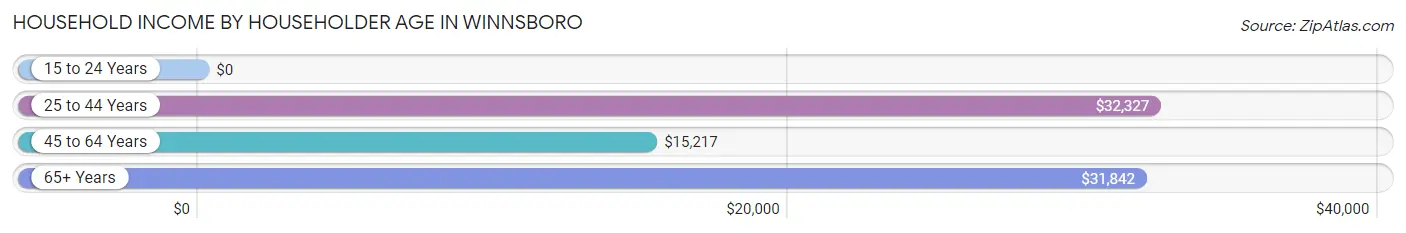
| Income Bracket | # Households | Median Income |
| 15 to 24 Years | 0 (0.0%) | $0 |
| 25 to 44 Years | 483 (36.3%) | $32,327 |
| 45 to 64 Years | 386 (29.0%) | $15,217 |
| 65+ Years | 462 (34.7%) | $31,842 |
| Total | 1,331 (100.0%) | $31,194 |
Poverty in Winnsboro
Income Below Poverty by Sex and Age in Winnsboro
With 31.7% poverty level for males and 26.2% for females among the residents of Winnsboro, 55 to 64 year old males and 55 to 64 year old females are the most vulnerable to poverty, with 149 males (67.7%) and 88 females (46.8%) in their respective age groups living below the poverty level.
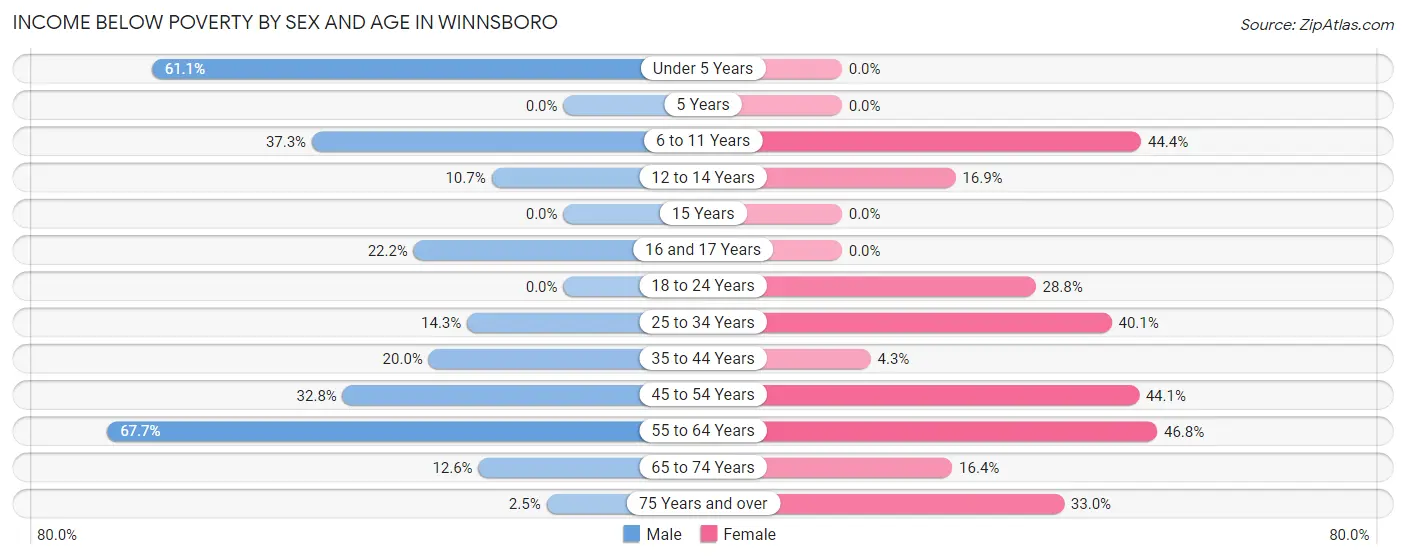
| Age Bracket | Male | Female |
| Under 5 Years | 66 (61.1%) | 0 (0.0%) |
| 5 Years | 0 (0.0%) | 0 (0.0%) |
| 6 to 11 Years | 112 (37.3%) | 44 (44.4%) |
| 12 to 14 Years | 8 (10.7%) | 14 (16.9%) |
| 15 Years | 0 (0.0%) | 0 (0.0%) |
| 16 and 17 Years | 14 (22.2%) | 0 (0.0%) |
| 18 to 24 Years | 0 (0.0%) | 42 (28.8%) |
| 25 to 34 Years | 20 (14.3%) | 131 (40.1%) |
| 35 to 44 Years | 2 (20.0%) | 11 (4.3%) |
| 45 to 54 Years | 78 (32.8%) | 41 (44.1%) |
| 55 to 64 Years | 149 (67.7%) | 88 (46.8%) |
| 65 to 74 Years | 15 (12.6%) | 30 (16.4%) |
| 75 Years and over | 2 (2.5%) | 63 (33.0%) |
| Total | 466 (31.7%) | 464 (26.2%) |
Income Above Poverty by Sex and Age in Winnsboro
According to the poverty statistics in Winnsboro, males aged 15 years and females aged under 5 years are the age groups that are most secure financially, with 100.0% of males and 100.0% of females in these age groups living above the poverty line.
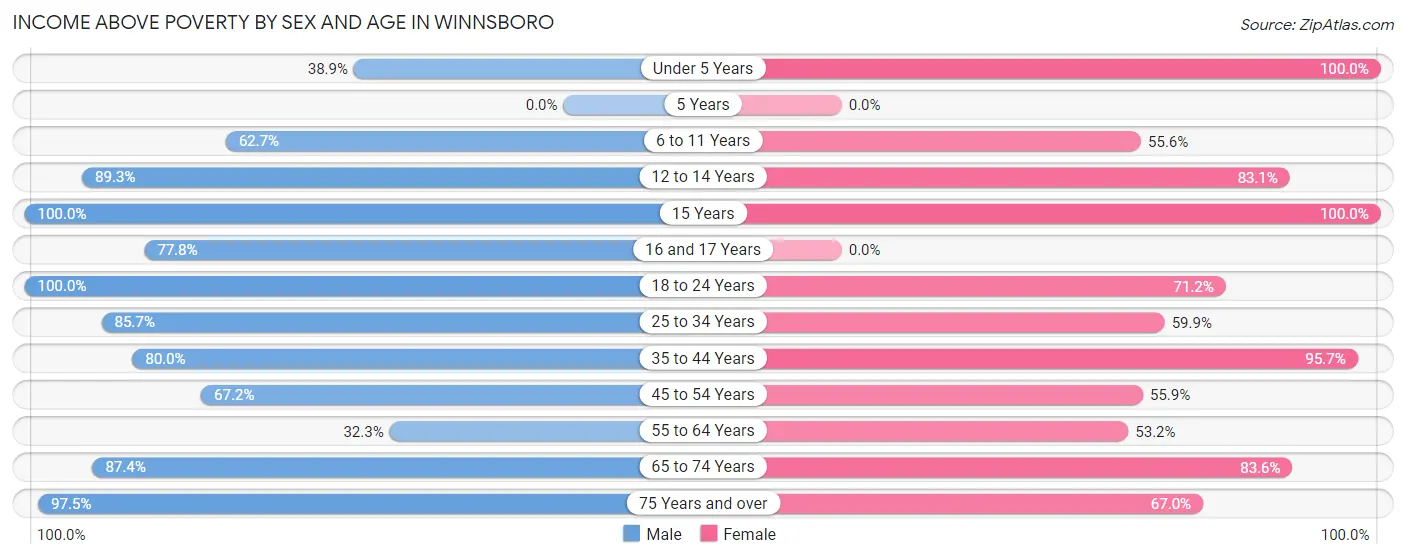
| Age Bracket | Male | Female |
| Under 5 Years | 42 (38.9%) | 157 (100.0%) |
| 5 Years | 0 (0.0%) | 0 (0.0%) |
| 6 to 11 Years | 188 (62.7%) | 55 (55.6%) |
| 12 to 14 Years | 67 (89.3%) | 69 (83.1%) |
| 15 Years | 72 (100.0%) | 45 (100.0%) |
| 16 and 17 Years | 49 (77.8%) | 0 (0.0%) |
| 18 to 24 Years | 45 (100.0%) | 104 (71.2%) |
| 25 to 34 Years | 120 (85.7%) | 196 (59.9%) |
| 35 to 44 Years | 8 (80.0%) | 246 (95.7%) |
| 45 to 54 Years | 160 (67.2%) | 52 (55.9%) |
| 55 to 64 Years | 71 (32.3%) | 100 (53.2%) |
| 65 to 74 Years | 104 (87.4%) | 153 (83.6%) |
| 75 Years and over | 78 (97.5%) | 128 (67.0%) |
| Total | 1,004 (68.3%) | 1,305 (73.8%) |
Income Below Poverty Among Married-Couple Families in Winnsboro
The poverty statistics for married-couple families in Winnsboro show that 25.7% or 92 of the total 358 families live below the poverty line. Families with 1 or 2 children have the highest poverty rate of 61.7%, comprising of 82 families. On the other hand, families with 5 or more children have the lowest poverty rate of 0.0%, which includes 0 families.
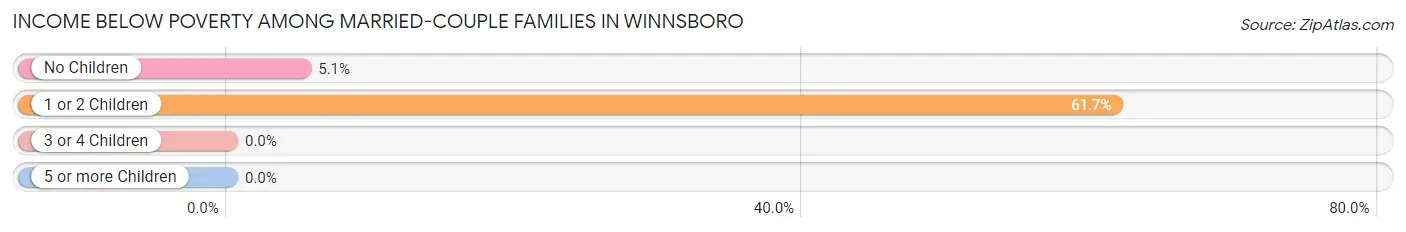
| Children | Above Poverty | Below Poverty |
| No Children | 186 (94.9%) | 10 (5.1%) |
| 1 or 2 Children | 51 (38.4%) | 82 (61.7%) |
| 3 or 4 Children | 0 (0.0%) | 0 (0.0%) |
| 5 or more Children | 29 (100.0%) | 0 (0.0%) |
| Total | 266 (74.3%) | 92 (25.7%) |
Income Below Poverty Among Single-Parent Households in Winnsboro
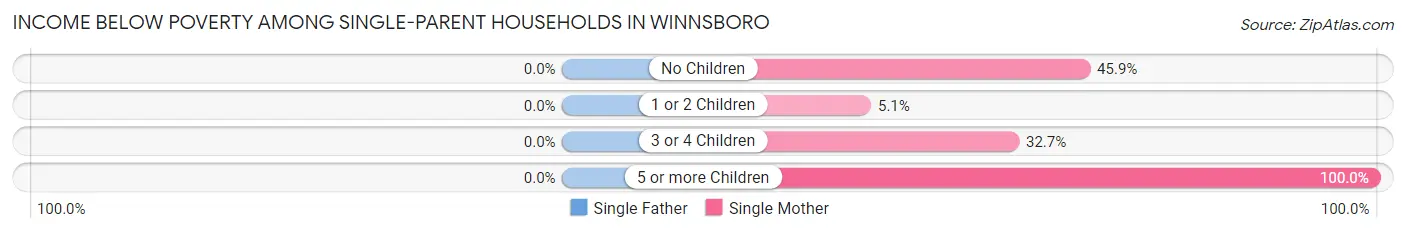
| Children | Single Father | Single Mother |
| No Children | 0 (0.0%) | 73 (45.9%) |
| 1 or 2 Children | 0 (0.0%) | 13 (5.1%) |
| 3 or 4 Children | 0 (0.0%) | 49 (32.7%) |
| 5 or more Children | 0 (0.0%) | 12 (100.0%) |
| Total | 0 (0.0%) | 147 (25.5%) |
Income Below Poverty Among Married-Couple vs Single-Parent Households in Winnsboro
The poverty data for Winnsboro shows that 92 of the married-couple family households (25.7%) and 147 of the single-parent households (25.5%) are living below the poverty level. Within the married-couple family households, those with 1 or 2 children have the highest poverty rate, with 82 households (61.7%) falling below the poverty line. Among the single-parent households, those with 5 or more children have the highest poverty rate, with 12 household (100.0%) living below poverty.
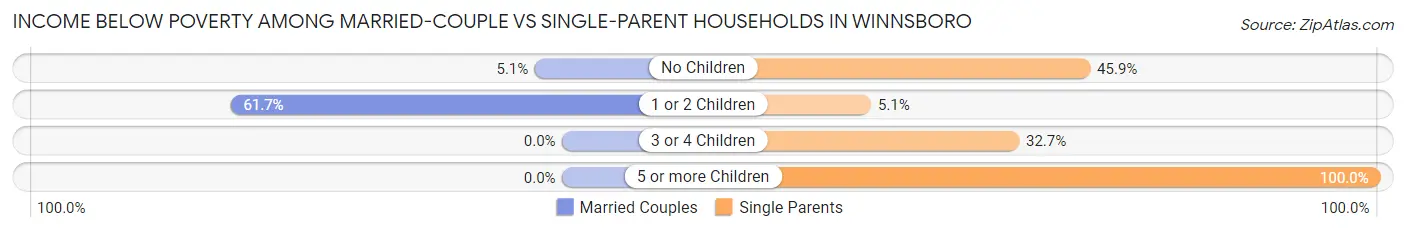
| Children | Married-Couple Families | Single-Parent Households |
| No Children | 10 (5.1%) | 73 (45.9%) |
| 1 or 2 Children | 82 (61.7%) | 13 (5.1%) |
| 3 or 4 Children | 0 (0.0%) | 49 (32.7%) |
| 5 or more Children | 0 (0.0%) | 12 (100.0%) |
| Total | 92 (25.7%) | 147 (25.5%) |
Race in Winnsboro
The most populous races in Winnsboro are Black / African American (2,224 | 68.7%), White / Caucasian (969 | 29.9%), and Hispanic or Latino (46 | 1.4%).
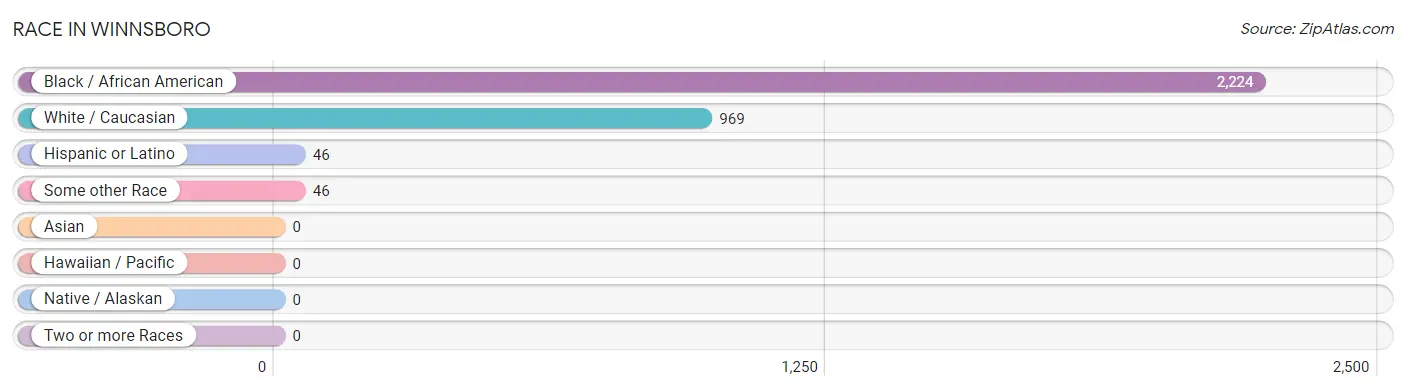
| Race | # Population | % Population |
| Asian | 0 | 0.0% |
| Black / African American | 2,224 | 68.7% |
| Hawaiian / Pacific | 0 | 0.0% |
| Hispanic or Latino | 46 | 1.4% |
| Native / Alaskan | 0 | 0.0% |
| White / Caucasian | 969 | 29.9% |
| Two or more Races | 0 | 0.0% |
| Some other Race | 46 | 1.4% |
| Total | 3,239 | 100.0% |
Ancestry in Winnsboro
The most populous ancestries reported in Winnsboro are English (171 | 5.3%), American (149 | 4.6%), German (75 | 2.3%), Arab (65 | 2.0%), and Moroccan (65 | 2.0%), together accounting for 16.2% of all Winnsboro residents.
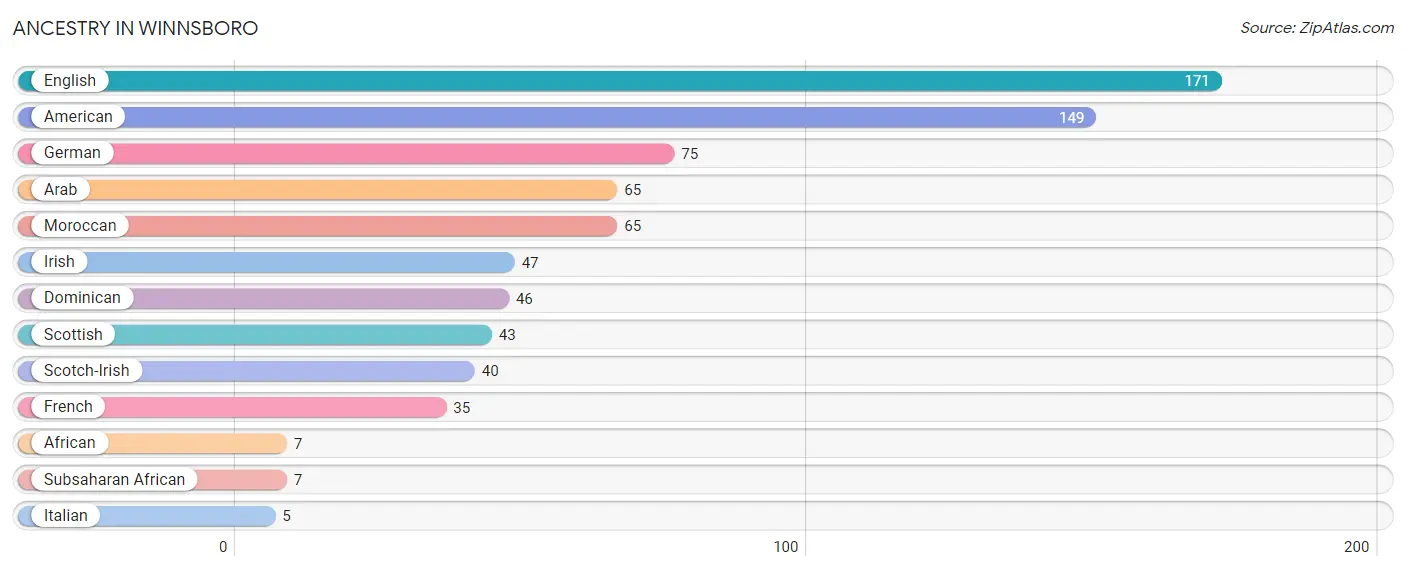
| Ancestry | # Population | % Population |
| African | 7 | 0.2% |
| American | 149 | 4.6% |
| Arab | 65 | 2.0% |
| Dominican | 46 | 1.4% |
| English | 171 | 5.3% |
| French | 35 | 1.1% |
| German | 75 | 2.3% |
| Irish | 47 | 1.5% |
| Italian | 5 | 0.2% |
| Moroccan | 65 | 2.0% |
| Scotch-Irish | 40 | 1.2% |
| Scottish | 43 | 1.3% |
| Subsaharan African | 7 | 0.2% | View All 13 Rows |
Immigrants in Winnsboro

| Immigration Origin | # Population | % Population | View All 0 Rows |
Sex and Age in Winnsboro
Sex and Age in Winnsboro
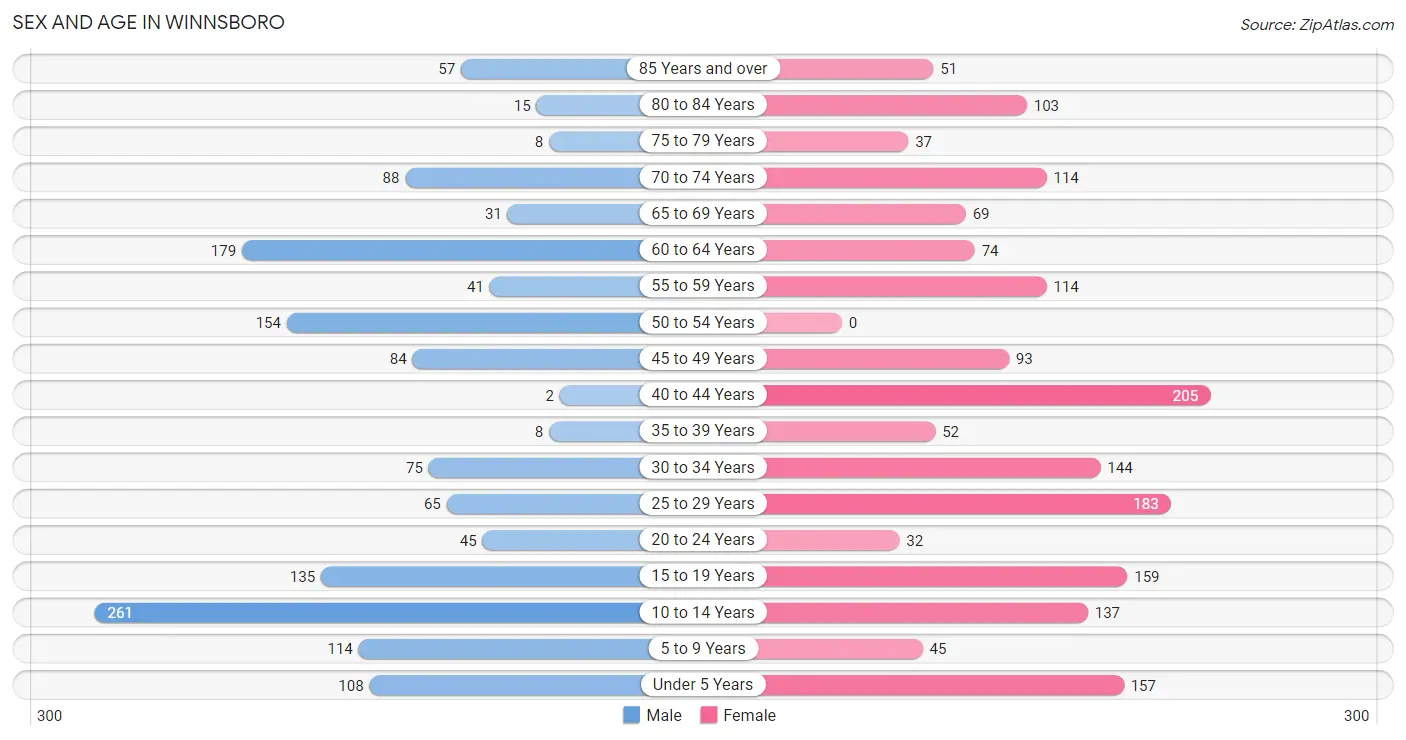
The most populous age groups in Winnsboro are 10 to 14 Years (261 | 17.8%) for men and 40 to 44 Years (205 | 11.6%) for women.
| Age Bracket | Male | Female |
| Under 5 Years | 108 (7.3%) | 157 (8.9%) |
| 5 to 9 Years | 114 (7.8%) | 45 (2.5%) |
| 10 to 14 Years | 261 (17.8%) | 137 (7.7%) |
| 15 to 19 Years | 135 (9.2%) | 159 (9.0%) |
| 20 to 24 Years | 45 (3.1%) | 32 (1.8%) |
| 25 to 29 Years | 65 (4.4%) | 183 (10.3%) |
| 30 to 34 Years | 75 (5.1%) | 144 (8.1%) |
| 35 to 39 Years | 8 (0.5%) | 52 (2.9%) |
| 40 to 44 Years | 2 (0.1%) | 205 (11.6%) |
| 45 to 49 Years | 84 (5.7%) | 93 (5.3%) |
| 50 to 54 Years | 154 (10.5%) | 0 (0.0%) |
| 55 to 59 Years | 41 (2.8%) | 114 (6.4%) |
| 60 to 64 Years | 179 (12.2%) | 74 (4.2%) |
| 65 to 69 Years | 31 (2.1%) | 69 (3.9%) |
| 70 to 74 Years | 88 (6.0%) | 114 (6.4%) |
| 75 to 79 Years | 8 (0.5%) | 37 (2.1%) |
| 80 to 84 Years | 15 (1.0%) | 103 (5.8%) |
| 85 Years and over | 57 (3.9%) | 51 (2.9%) |
| Total | 1,470 (100.0%) | 1,769 (100.0%) |
Families and Households in Winnsboro
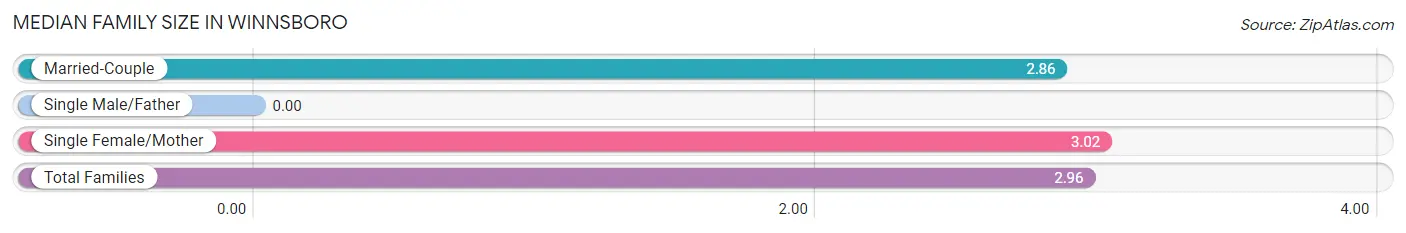
Median Family Size in Winnsboro
| Family Type | # Families | Family Size |
| Married-Couple | 358 (38.3%) | 2.86 |
| Single Male/Father | 0 (0.0%) | - |
| Single Female/Mother | 576 (61.7%) | 3.02 |
| Total Families | 934 (100.0%) | 2.96 |
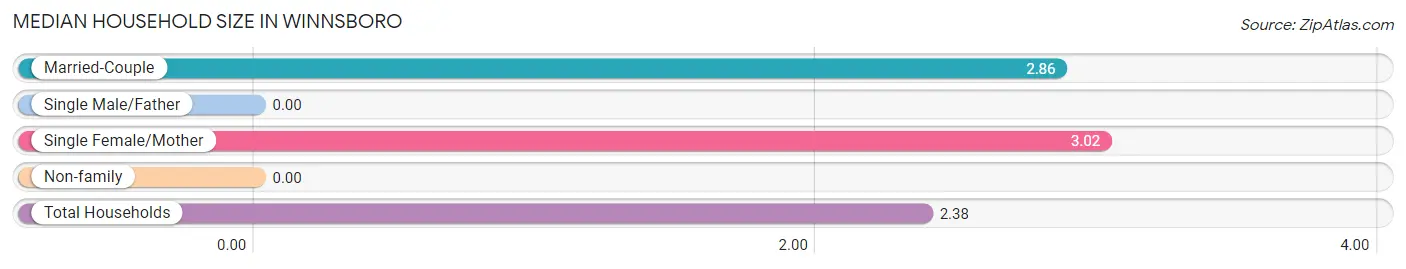
Median Household Size in Winnsboro
| Household Type | # Households | Household Size |
| Married-Couple | 358 (26.9%) | 2.86 |
| Single Male/Father | 0 (0.0%) | - |
| Single Female/Mother | 576 (43.3%) | 3.02 |
| Non-family | 397 (29.8%) | - |
| Total Households | 1,331 (100.0%) | 2.38 |
Household Size by Marriage Status in Winnsboro
Out of a total of 1,331 households in Winnsboro, 934 (70.2%) are family households, while 397 (29.8%) are nonfamily households. The most numerous type of family households are 3-person households, comprising 350, and the most common type of nonfamily households are 1-person households, comprising 397.
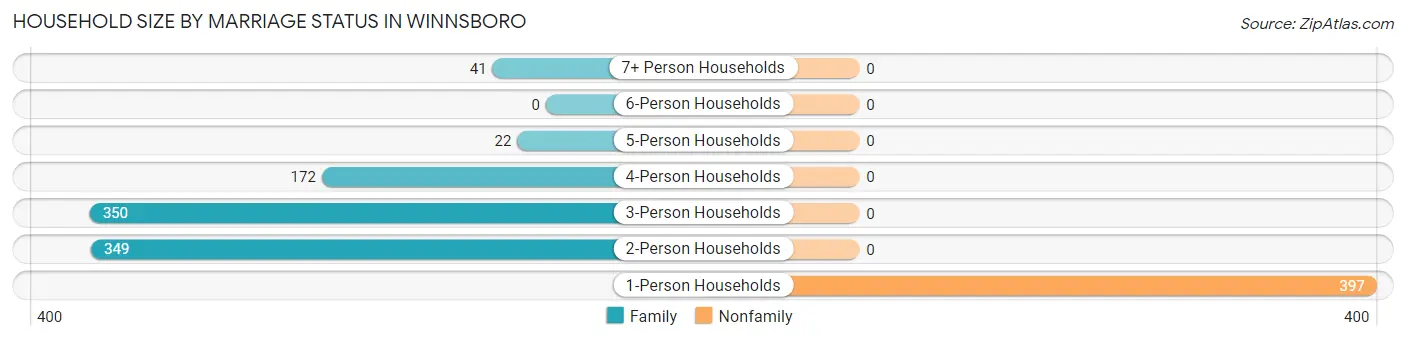
| Household Size | Family Households | Nonfamily Households |
| 1-Person Households | - | 397 (29.8%) |
| 2-Person Households | 349 (26.2%) | 0 (0.0%) |
| 3-Person Households | 350 (26.3%) | 0 (0.0%) |
| 4-Person Households | 172 (12.9%) | 0 (0.0%) |
| 5-Person Households | 22 (1.7%) | 0 (0.0%) |
| 6-Person Households | 0 (0.0%) | 0 (0.0%) |
| 7+ Person Households | 41 (3.1%) | 0 (0.0%) |
| Total | 934 (70.2%) | 397 (29.8%) |
Female Fertility in Winnsboro
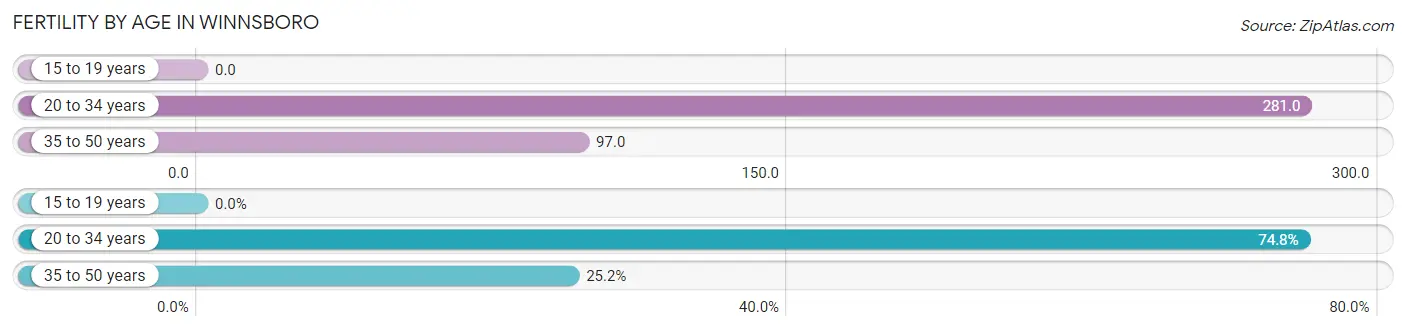
Fertility by Age in Winnsboro
Average fertility rate in Winnsboro is 156.0 births per 1,000 women. Women in the age bracket of 20 to 34 years have the highest fertility rate with 281.0 births per 1,000 women. Women in the age bracket of 20 to 34 years acount for 74.8% of all women with births.
| Age Bracket | Women with Births | Births / 1,000 Women |
| 15 to 19 years | 0 (0.0%) | 0.0 |
| 20 to 34 years | 101 (74.8%) | 281.0 |
| 35 to 50 years | 34 (25.2%) | 97.0 |
| Total | 135 (100.0%) | 156.0 |
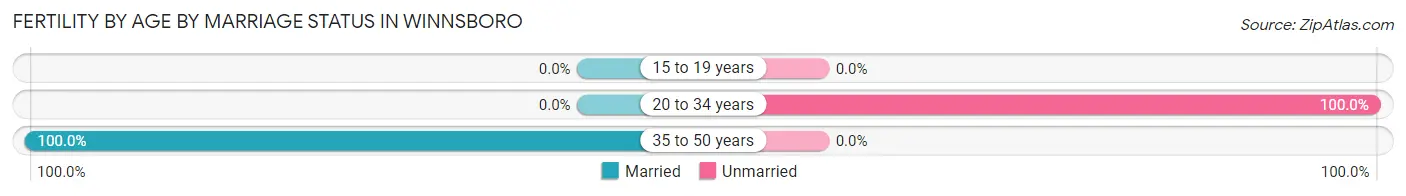
Fertility by Age by Marriage Status in Winnsboro
25.2% of women with births (135) in Winnsboro are married. The highest percentage of unmarried women with births falls into 20 to 34 years age bracket with 100.0% of them unmarried at the time of birth, while the lowest percentage of unmarried women with births belong to 35 to 50 years age bracket with 0.0% of them unmarried.
| Age Bracket | Married | Unmarried |
| 15 to 19 years | 0 (0.0%) | 0 (0.0%) |
| 20 to 34 years | 0 (0.0%) | 101 (100.0%) |
| 35 to 50 years | 34 (100.0%) | 0 (0.0%) |
| Total | 34 (25.2%) | 101 (74.8%) |
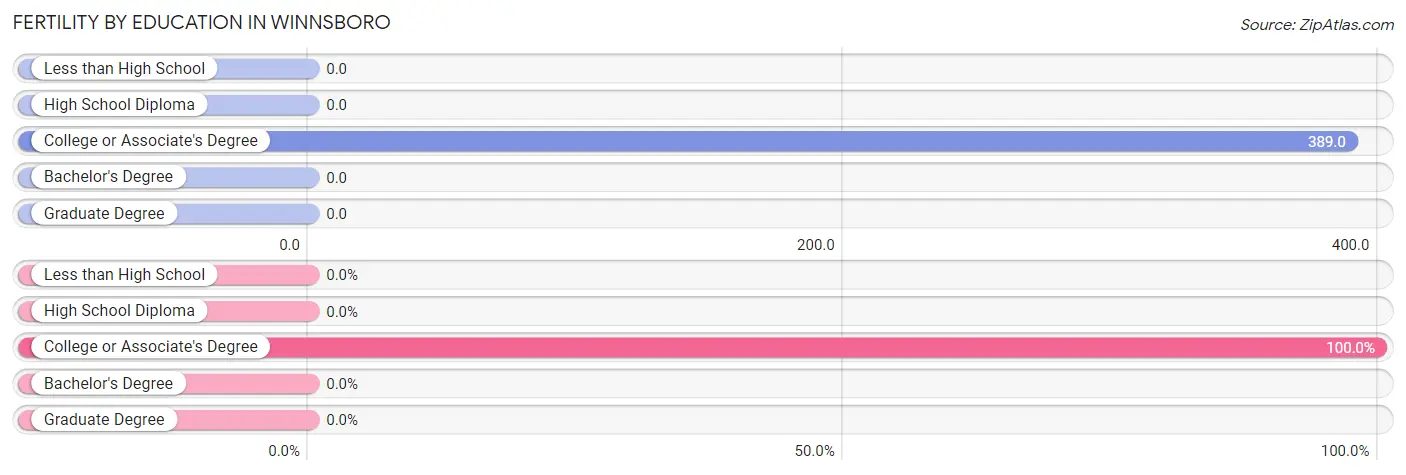
Fertility by Education in Winnsboro
| Educational Attainment | Women with Births | Births / 1,000 Women |
| Less than High School | 0 (0.0%) | 0.0 |
| High School Diploma | 0 (0.0%) | 0.0 |
| College or Associate's Degree | 135 (100.0%) | 389.0 |
| Bachelor's Degree | 0 (0.0%) | 0.0 |
| Graduate Degree | 0 (0.0%) | 0.0 |
| Total | 135 (100.0%) | 156.0 |
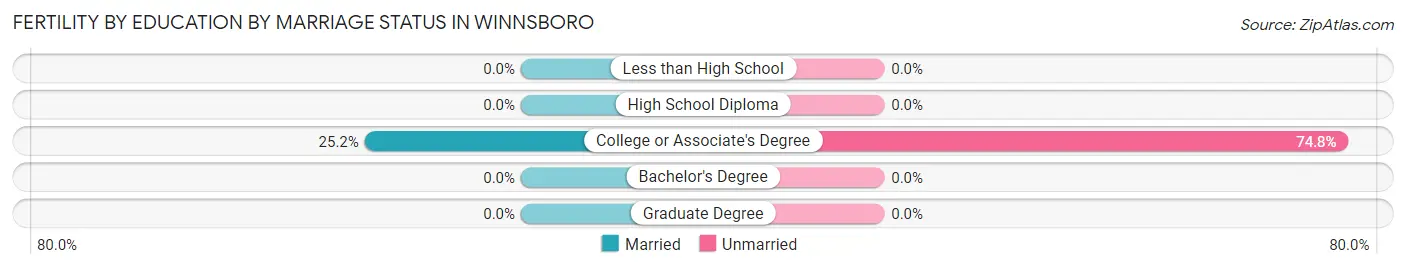
Fertility by Education by Marriage Status in Winnsboro
74.8% of women with births in Winnsboro are unmarried. Women with the educational attainment of college or associate's degree are most likely to be married with 25.2% of them married at childbirth, while women with the educational attainment of college or associate's degree are least likely to be married with 74.8% of them unmarried at childbirth.
| Educational Attainment | Married | Unmarried |
| Less than High School | 0 (0.0%) | 0 (0.0%) |
| High School Diploma | 0 (0.0%) | 0 (0.0%) |
| College or Associate's Degree | 34 (25.2%) | 101 (74.8%) |
| Bachelor's Degree | 0 (0.0%) | 0 (0.0%) |
| Graduate Degree | 0 (0.0%) | 0 (0.0%) |
| Total | 34 (25.2%) | 101 (74.8%) |
Employment Characteristics in Winnsboro
Employment by Class of Employer in Winnsboro
Among the 1,019 employed individuals in Winnsboro, private company employees (741 | 72.7%), federal government employees (74 | 7.3%), and local government employees (73 | 7.2%) make up the most common classes of employment.
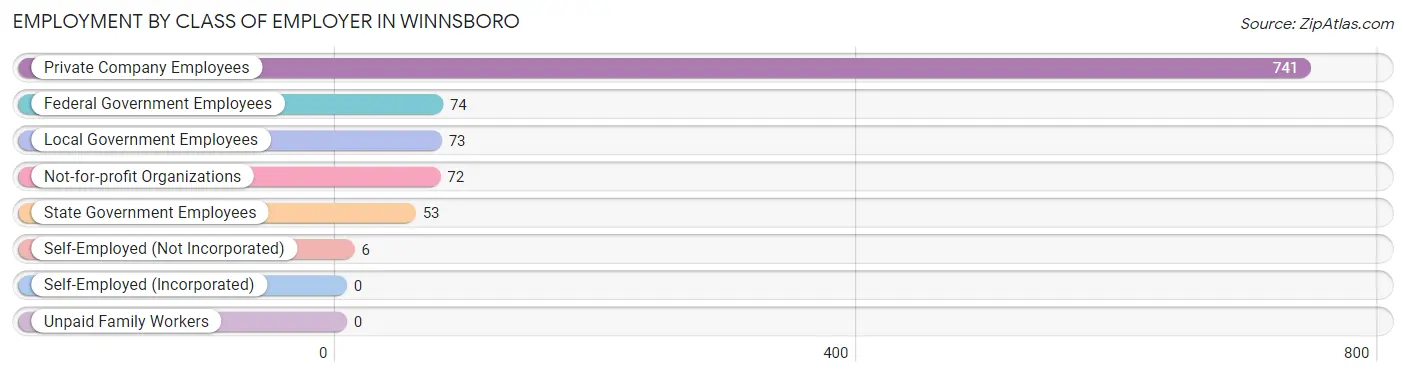
| Employer Class | # Employees | % Employees |
| Private Company Employees | 741 | 72.7% |
| Self-Employed (Incorporated) | 0 | 0.0% |
| Self-Employed (Not Incorporated) | 6 | 0.6% |
| Not-for-profit Organizations | 72 | 7.1% |
| Local Government Employees | 73 | 7.2% |
| State Government Employees | 53 | 5.2% |
| Federal Government Employees | 74 | 7.3% |
| Unpaid Family Workers | 0 | 0.0% |
| Total | 1,019 | 100.0% |
Employment Status by Age in Winnsboro
According to the labor force statistics for Winnsboro, out of the total population over 16 years of age (2,300), 52.2% or 1,201 individuals are in the labor force, with 10.6% or 127 of them unemployed. The age group with the highest labor force participation rate is 20 to 24 years, with 100.0% or 77 individuals in the labor force. Within the labor force, the 16 to 19 years age range has the highest percentage of unemployed individuals, with 70.8% or 85 of them being unemployed.
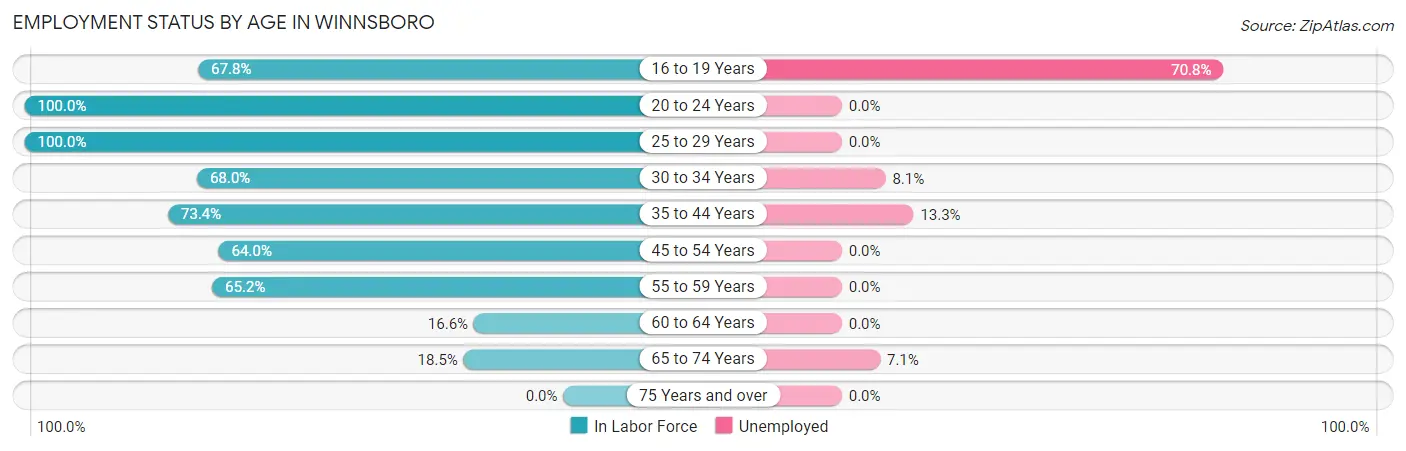
| Age Bracket | In Labor Force | Unemployed |
| 16 to 19 Years | 120 (67.8%) | 85 (70.8%) |
| 20 to 24 Years | 77 (100.0%) | 0 (0.0%) |
| 25 to 29 Years | 248 (100.0%) | 0 (0.0%) |
| 30 to 34 Years | 149 (68.0%) | 12 (8.1%) |
| 35 to 44 Years | 196 (73.4%) | 26 (13.3%) |
| 45 to 54 Years | 212 (64.0%) | 0 (0.0%) |
| 55 to 59 Years | 101 (65.2%) | 0 (0.0%) |
| 60 to 64 Years | 42 (16.6%) | 0 (0.0%) |
| 65 to 74 Years | 56 (18.5%) | 4 (7.1%) |
| 75 Years and over | 0 (0.0%) | 0 (0.0%) |
| Total | 1,201 (52.2%) | 127 (10.6%) |
Employment Status by Educational Attainment in Winnsboro
According to labor force statistics for Winnsboro, 64.4% of individuals (949) out of the total population between 25 and 64 years of age (1,473) are in the labor force, with 4.0% or 38 of them being unemployed. The group with the highest labor force participation rate are those with the educational attainment of bachelor's degree or higher, with 90.1% or 100 individuals in the labor force. Within the labor force, individuals with less than high school education have the highest percentage of unemployment, with 9.4% or 12 of them being unemployed.
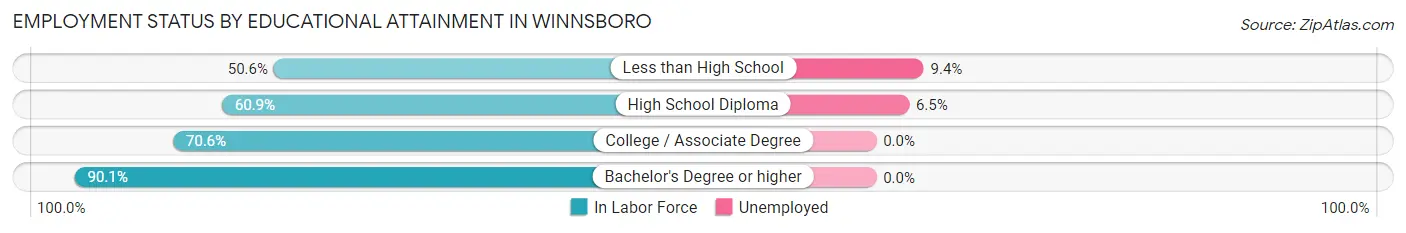
| Educational Attainment | In Labor Force | Unemployed |
| Less than High School | 128 (50.6%) | 24 (9.4%) |
| High School Diploma | 398 (60.9%) | 42 (6.5%) |
| College / Associate Degree | 322 (70.6%) | 0 (0.0%) |
| Bachelor's Degree or higher | 100 (90.1%) | 0 (0.0%) |
| Total | 949 (64.4%) | 59 (4.0%) |
Employment Occupations by Sex in Winnsboro
Management, Business, Science and Arts Occupations
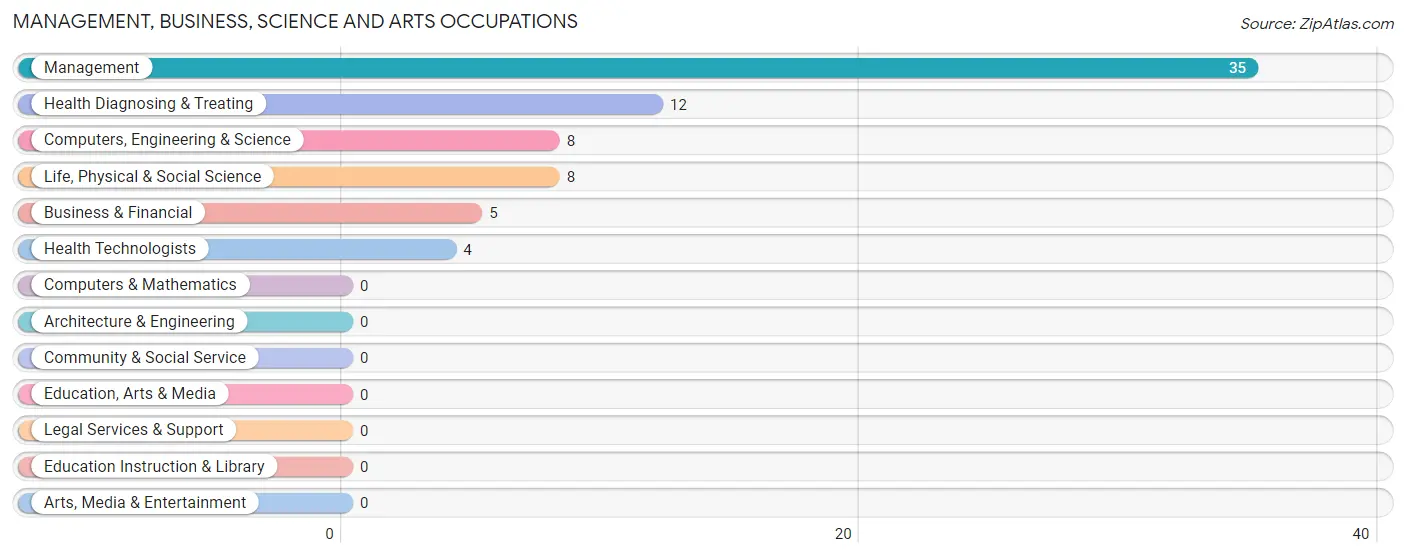
The most common Management, Business, Science and Arts occupations in Winnsboro are Management (35 | 3.3%), Health Diagnosing & Treating (12 | 1.1%), Computers, Engineering & Science (8 | 0.7%), Life, Physical & Social Science (8 | 0.7%), and Business & Financial (5 | 0.5%).
Management, Business, Science and Arts Occupations by Sex
Within the Management, Business, Science and Arts occupations in Winnsboro, the most male-oriented occupations are Business & Financial (100.0%), Computers, Engineering & Science (100.0%), and Life, Physical & Social Science (100.0%), while the most female-oriented occupations are Management (100.0%), Health Diagnosing & Treating (100.0%), and Health Technologists (100.0%).
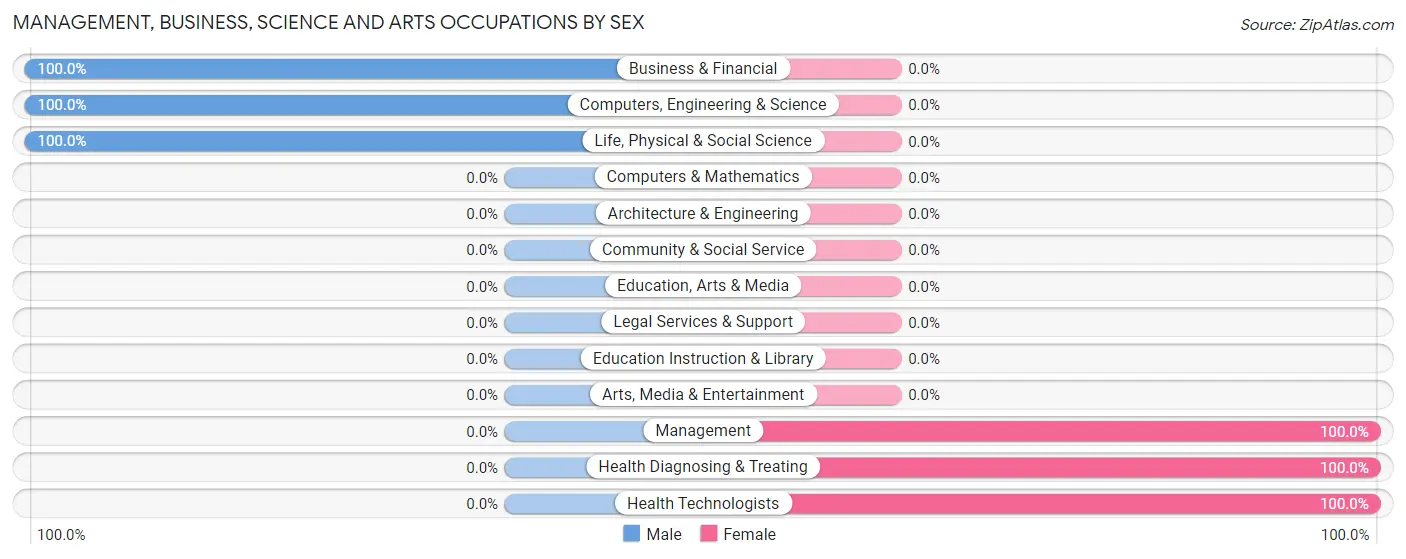
| Occupation | Male | Female |
| Management | 0 (0.0%) | 35 (100.0%) |
| Business & Financial | 5 (100.0%) | 0 (0.0%) |
| Computers, Engineering & Science | 8 (100.0%) | 0 (0.0%) |
| Computers & Mathematics | 0 (0.0%) | 0 (0.0%) |
| Architecture & Engineering | 0 (0.0%) | 0 (0.0%) |
| Life, Physical & Social Science | 8 (100.0%) | 0 (0.0%) |
| Community & Social Service | 0 (0.0%) | 0 (0.0%) |
| Education, Arts & Media | 0 (0.0%) | 0 (0.0%) |
| Legal Services & Support | 0 (0.0%) | 0 (0.0%) |
| Education Instruction & Library | 0 (0.0%) | 0 (0.0%) |
| Arts, Media & Entertainment | 0 (0.0%) | 0 (0.0%) |
| Health Diagnosing & Treating | 0 (0.0%) | 12 (100.0%) |
| Health Technologists | 0 (0.0%) | 4 (100.0%) |
| Total (Category) | 13 (21.7%) | 47 (78.3%) |
| Total (Overall) | 420 (39.1%) | 654 (60.9%) |
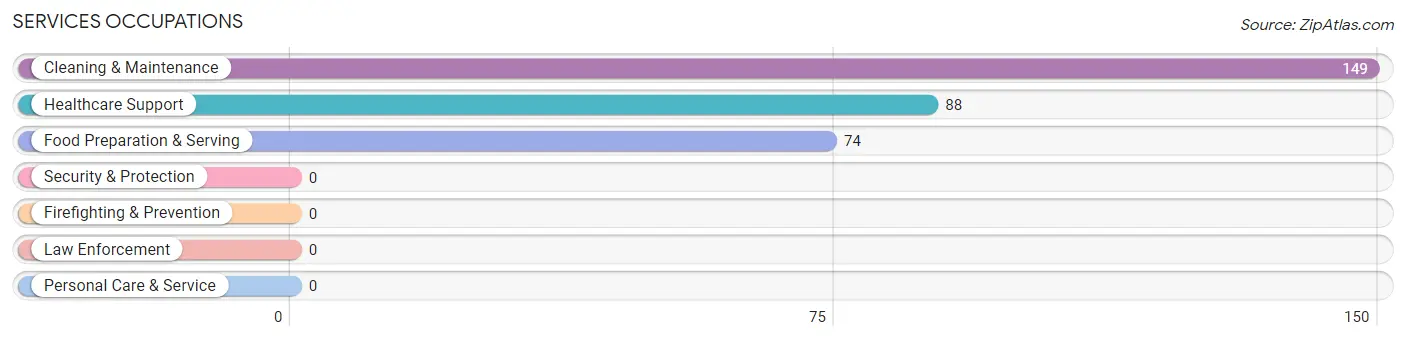
Services Occupations
The most common Services occupations in Winnsboro are Cleaning & Maintenance (149 | 13.9%), Healthcare Support (88 | 8.2%), and Food Preparation & Serving (74 | 6.9%).
Services Occupations by Sex
Within the Services occupations in Winnsboro, the most male-oriented occupations are Food Preparation & Serving (100.0%), and Cleaning & Maintenance (53.7%), while the most female-oriented occupations are Healthcare Support (100.0%), and Cleaning & Maintenance (46.3%).
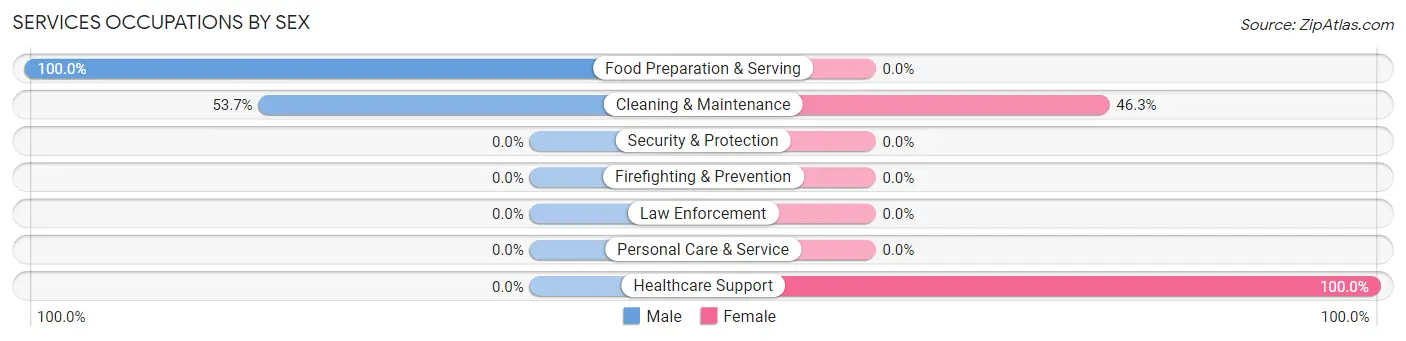
| Occupation | Male | Female |
| Healthcare Support | 0 (0.0%) | 88 (100.0%) |
| Security & Protection | 0 (0.0%) | 0 (0.0%) |
| Firefighting & Prevention | 0 (0.0%) | 0 (0.0%) |
| Law Enforcement | 0 (0.0%) | 0 (0.0%) |
| Food Preparation & Serving | 74 (100.0%) | 0 (0.0%) |
| Cleaning & Maintenance | 80 (53.7%) | 69 (46.3%) |
| Personal Care & Service | 0 (0.0%) | 0 (0.0%) |
| Total (Category) | 154 (49.5%) | 157 (50.5%) |
| Total (Overall) | 420 (39.1%) | 654 (60.9%) |
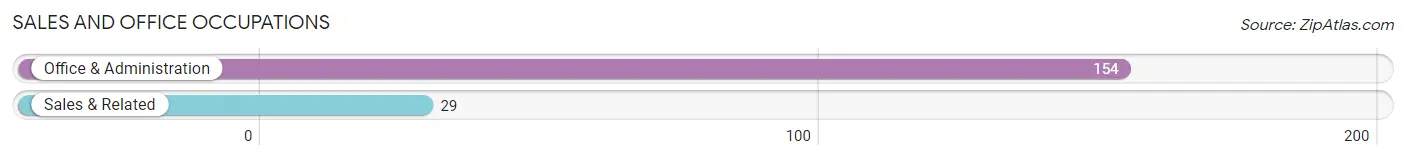
Sales and Office Occupations
The most common Sales and Office occupations in Winnsboro are Office & Administration (154 | 14.3%), and Sales & Related (29 | 2.7%).
Sales and Office Occupations by Sex
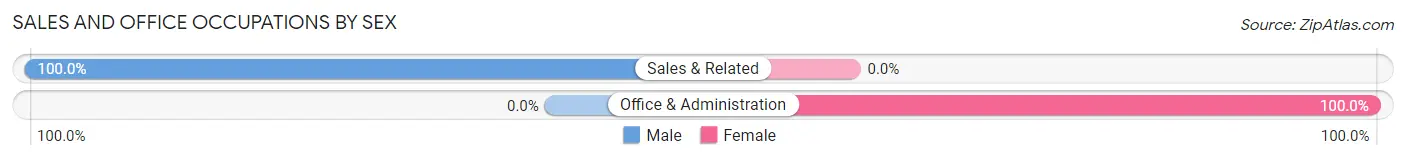
| Occupation | Male | Female |
| Sales & Related | 29 (100.0%) | 0 (0.0%) |
| Office & Administration | 0 (0.0%) | 154 (100.0%) |
| Total (Category) | 29 (15.9%) | 154 (84.2%) |
| Total (Overall) | 420 (39.1%) | 654 (60.9%) |
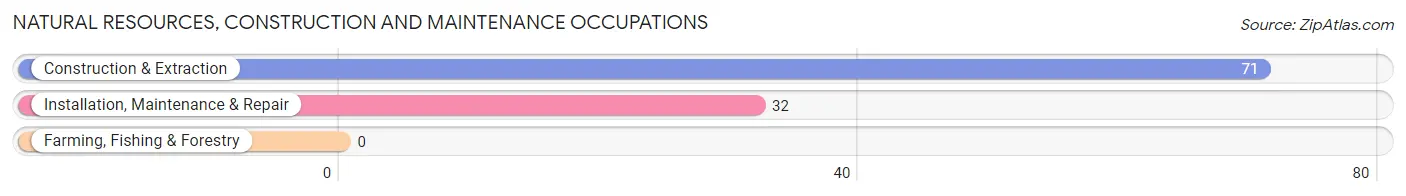
Natural Resources, Construction and Maintenance Occupations
The most common Natural Resources, Construction and Maintenance occupations in Winnsboro are Construction & Extraction (71 | 6.6%), and Installation, Maintenance & Repair (32 | 3.0%).
Natural Resources, Construction and Maintenance Occupations by Sex
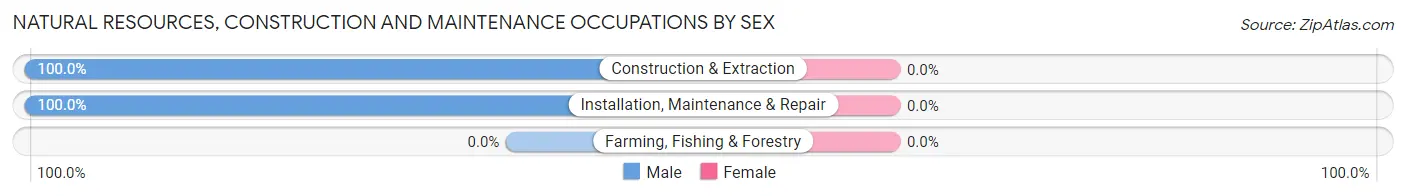
| Occupation | Male | Female |
| Farming, Fishing & Forestry | 0 (0.0%) | 0 (0.0%) |
| Construction & Extraction | 71 (100.0%) | 0 (0.0%) |
| Installation, Maintenance & Repair | 32 (100.0%) | 0 (0.0%) |
| Total (Category) | 103 (100.0%) | 0 (0.0%) |
| Total (Overall) | 420 (39.1%) | 654 (60.9%) |
Production, Transportation and Moving Occupations
The most common Production, Transportation and Moving occupations in Winnsboro are Production (362 | 33.7%), Material Moving (43 | 4.0%), and Transportation (12 | 1.1%).
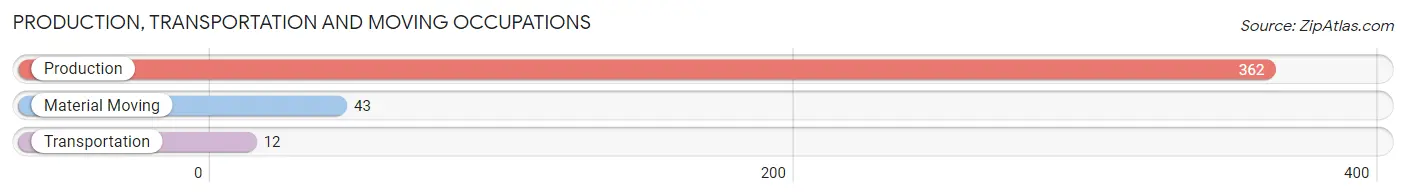
Production, Transportation and Moving Occupations by Sex
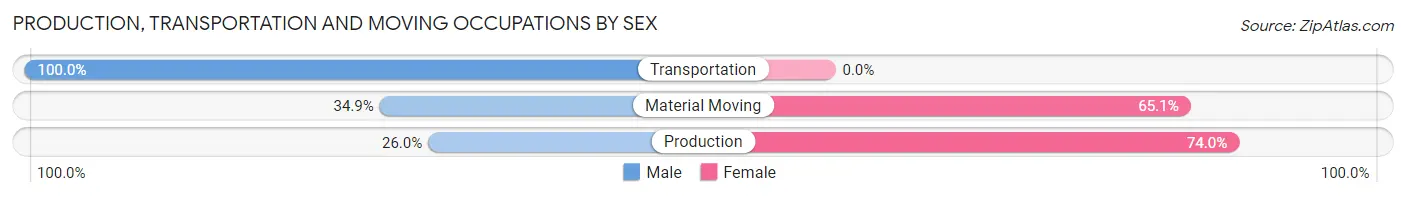
| Occupation | Male | Female |
| Production | 94 (26.0%) | 268 (74.0%) |
| Transportation | 12 (100.0%) | 0 (0.0%) |
| Material Moving | 15 (34.9%) | 28 (65.1%) |
| Total (Category) | 121 (29.0%) | 296 (71.0%) |
| Total (Overall) | 420 (39.1%) | 654 (60.9%) |
Employment Industries by Sex in Winnsboro
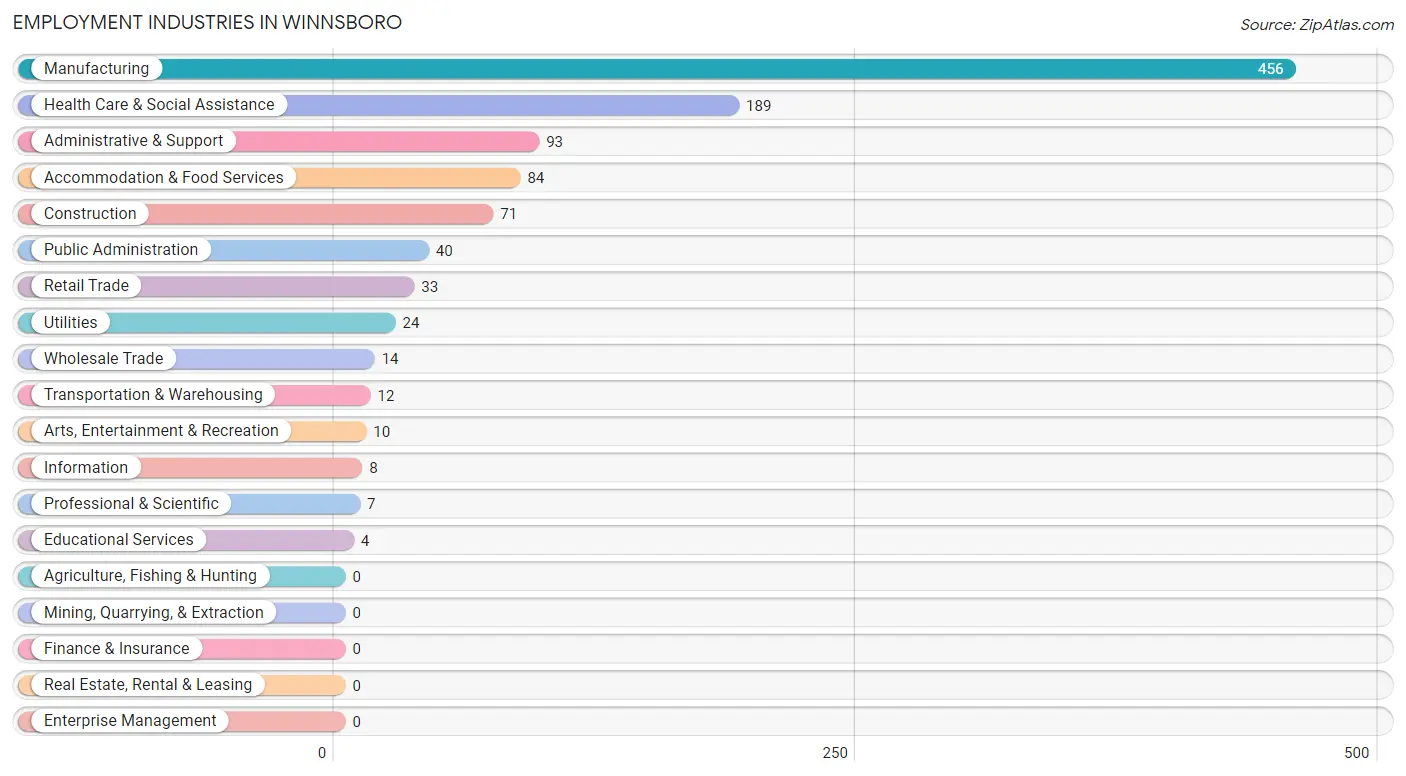
Employment Industries in Winnsboro
The major employment industries in Winnsboro include Manufacturing (456 | 42.5%), Health Care & Social Assistance (189 | 17.6%), Administrative & Support (93 | 8.7%), Accommodation & Food Services (84 | 7.8%), and Construction (71 | 6.6%).
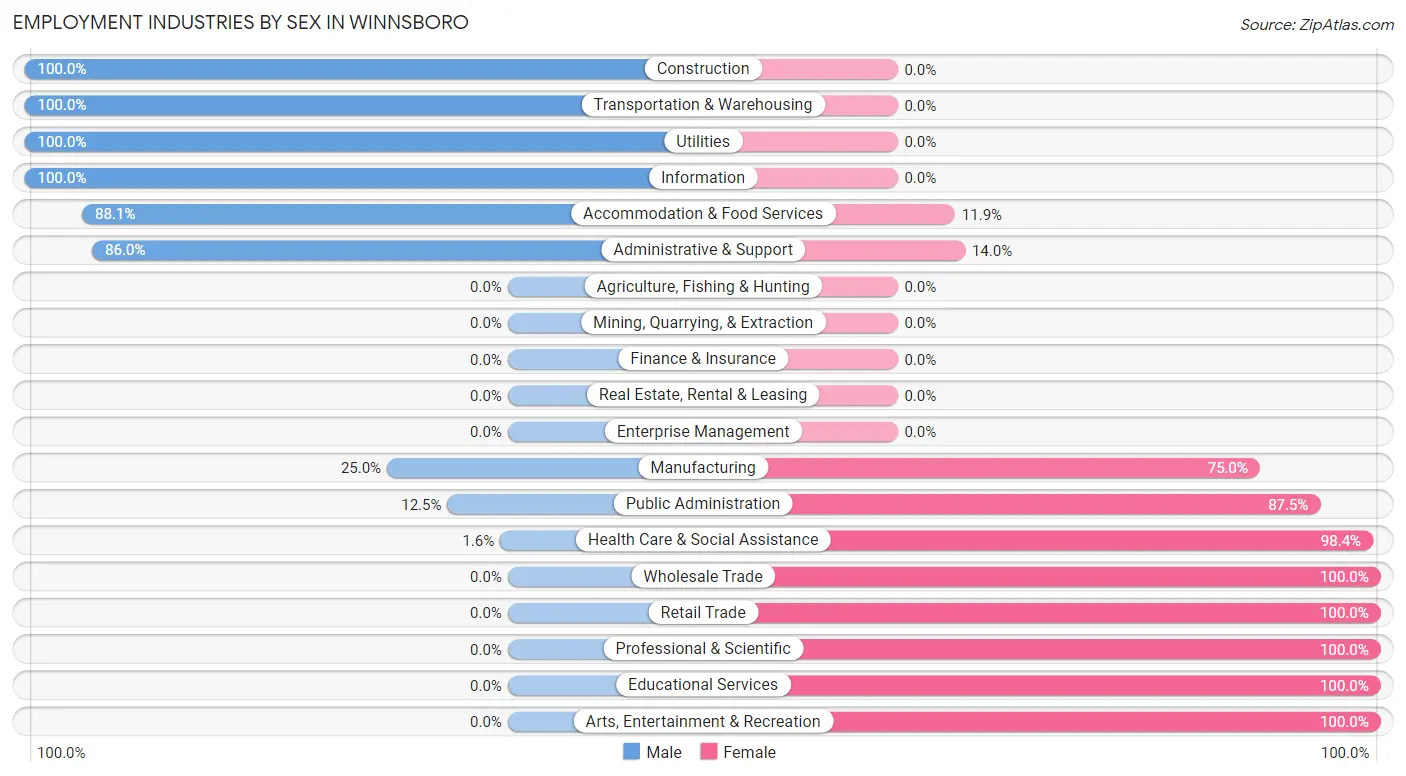
Employment Industries by Sex in Winnsboro
The Winnsboro industries that see more men than women are Construction (100.0%), Transportation & Warehousing (100.0%), and Utilities (100.0%), whereas the industries that tend to have a higher number of women are Wholesale Trade (100.0%), Retail Trade (100.0%), and Professional & Scientific (100.0%).
| Industry | Male | Female |
| Agriculture, Fishing & Hunting | 0 (0.0%) | 0 (0.0%) |
| Mining, Quarrying, & Extraction | 0 (0.0%) | 0 (0.0%) |
| Construction | 71 (100.0%) | 0 (0.0%) |
| Manufacturing | 114 (25.0%) | 342 (75.0%) |
| Wholesale Trade | 0 (0.0%) | 14 (100.0%) |
| Retail Trade | 0 (0.0%) | 33 (100.0%) |
| Transportation & Warehousing | 12 (100.0%) | 0 (0.0%) |
| Utilities | 24 (100.0%) | 0 (0.0%) |
| Information | 8 (100.0%) | 0 (0.0%) |
| Finance & Insurance | 0 (0.0%) | 0 (0.0%) |
| Real Estate, Rental & Leasing | 0 (0.0%) | 0 (0.0%) |
| Professional & Scientific | 0 (0.0%) | 7 (100.0%) |
| Enterprise Management | 0 (0.0%) | 0 (0.0%) |
| Administrative & Support | 80 (86.0%) | 13 (14.0%) |
| Educational Services | 0 (0.0%) | 4 (100.0%) |
| Health Care & Social Assistance | 3 (1.6%) | 186 (98.4%) |
| Arts, Entertainment & Recreation | 0 (0.0%) | 10 (100.0%) |
| Accommodation & Food Services | 74 (88.1%) | 10 (11.9%) |
| Public Administration | 5 (12.5%) | 35 (87.5%) |
| Total | 420 (39.1%) | 654 (60.9%) |
Education in Winnsboro
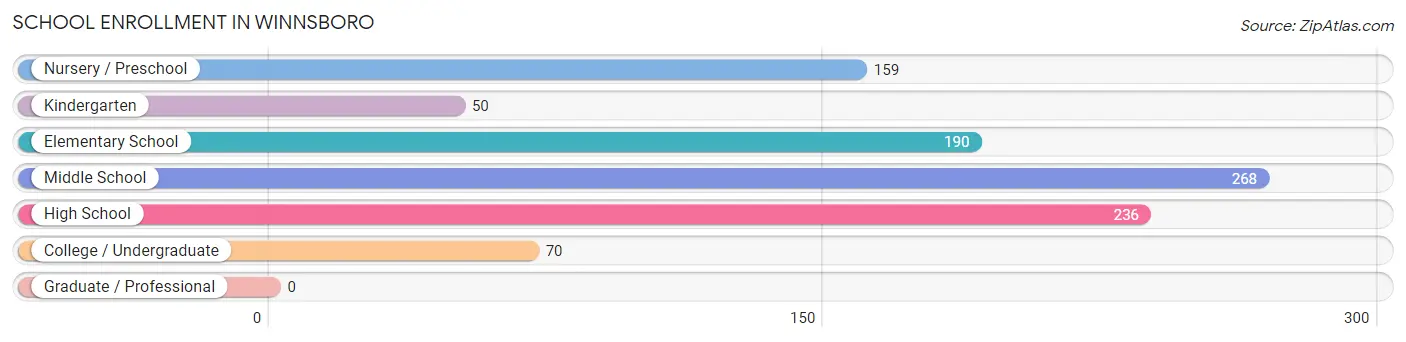
School Enrollment in Winnsboro
The most common levels of schooling among the 973 students in Winnsboro are middle school (268 | 27.5%), high school (236 | 24.2%), and elementary school (190 | 19.5%).
| School Level | # Students | % Students |
| Nursery / Preschool | 159 | 16.3% |
| Kindergarten | 50 | 5.1% |
| Elementary School | 190 | 19.5% |
| Middle School | 268 | 27.5% |
| High School | 236 | 24.2% |
| College / Undergraduate | 70 | 7.2% |
| Graduate / Professional | 0 | 0.0% |
| Total | 973 | 100.0% |
School Enrollment by Age by Funding Source in Winnsboro
Out of a total of 973 students who are enrolled in schools in Winnsboro, 184 (18.9%) attend a private institution, while the remaining 789 (81.1%) are enrolled in public schools. The age group of 20 to 24 year olds has the highest likelihood of being enrolled in private schools, with 32 (100.0% in the age bracket) enrolled. Conversely, the age group of 18 to 19 year olds has the lowest likelihood of being enrolled in a private school, with 34 (100.0% in the age bracket) attending a public institution.
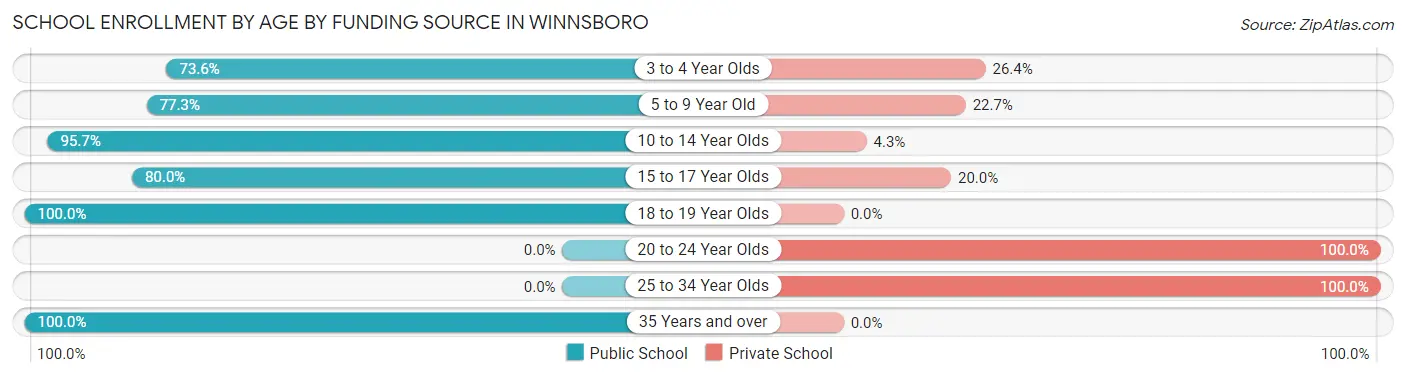
| Age Bracket | Public School | Private School |
| 3 to 4 Year Olds | 117 (73.6%) | 42 (26.4%) |
| 5 to 9 Year Old | 102 (77.3%) | 30 (22.7%) |
| 10 to 14 Year Olds | 381 (95.7%) | 17 (4.3%) |
| 15 to 17 Year Olds | 144 (80.0%) | 36 (20.0%) |
| 18 to 19 Year Olds | 34 (100.0%) | 0 (0.0%) |
| 20 to 24 Year Olds | 0 (0.0%) | 32 (100.0%) |
| 25 to 34 Year Olds | 0 (0.0%) | 27 (100.0%) |
| 35 Years and over | 11 (100.0%) | 0 (0.0%) |
| Total | 789 (81.1%) | 184 (18.9%) |
Educational Attainment by Field of Study in Winnsboro
Business (115 | 37.0%), education (47 | 15.1%), engineering (43 | 13.8%), social sciences (33 | 10.6%), and bio, nature & agricultural (22 | 7.1%) are the most common fields of study among 311 individuals in Winnsboro who have obtained a bachelor's degree or higher.
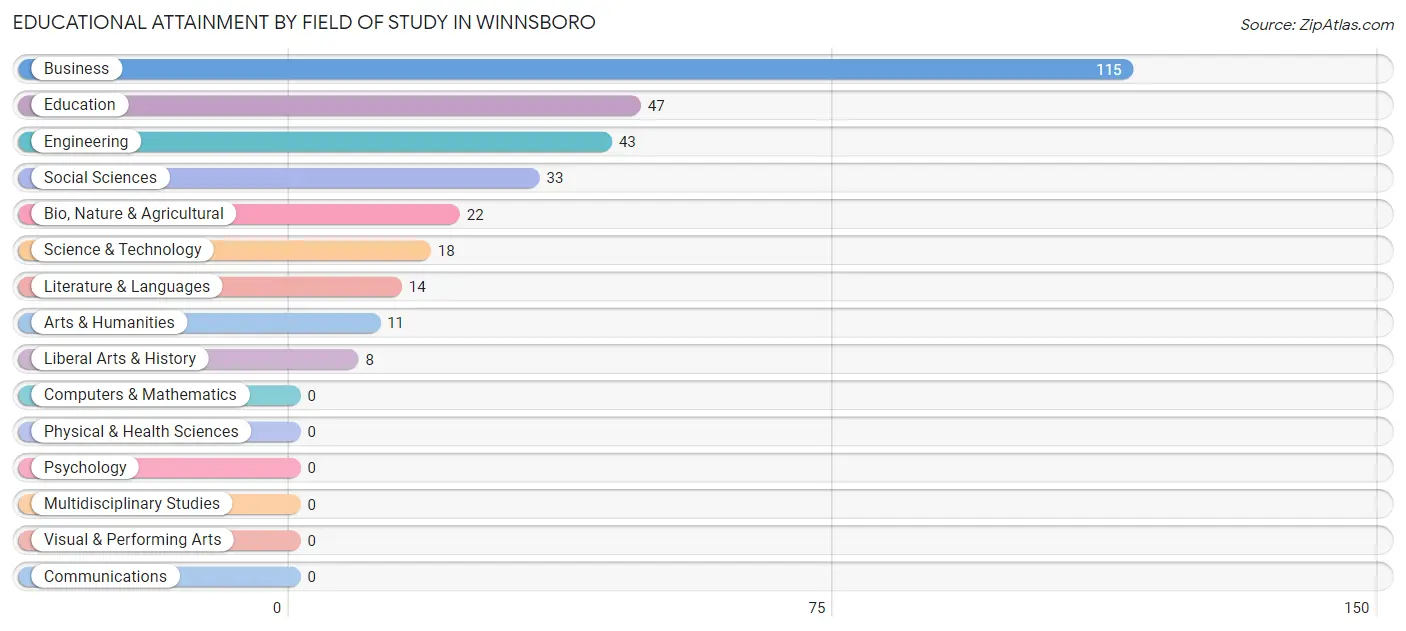
| Field of Study | # Graduates | % Graduates |
| Computers & Mathematics | 0 | 0.0% |
| Bio, Nature & Agricultural | 22 | 7.1% |
| Physical & Health Sciences | 0 | 0.0% |
| Psychology | 0 | 0.0% |
| Social Sciences | 33 | 10.6% |
| Engineering | 43 | 13.8% |
| Multidisciplinary Studies | 0 | 0.0% |
| Science & Technology | 18 | 5.8% |
| Business | 115 | 37.0% |
| Education | 47 | 15.1% |
| Literature & Languages | 14 | 4.5% |
| Liberal Arts & History | 8 | 2.6% |
| Visual & Performing Arts | 0 | 0.0% |
| Communications | 0 | 0.0% |
| Arts & Humanities | 11 | 3.5% |
| Total | 311 | 100.0% |
Transportation & Commute in Winnsboro
Vehicle Availability by Sex in Winnsboro
The most prevalent vehicle ownership categories in Winnsboro are males with 3 vehicles (126, accounting for 33.9%) and females with 3 vehicles (27, making up 20.4%).
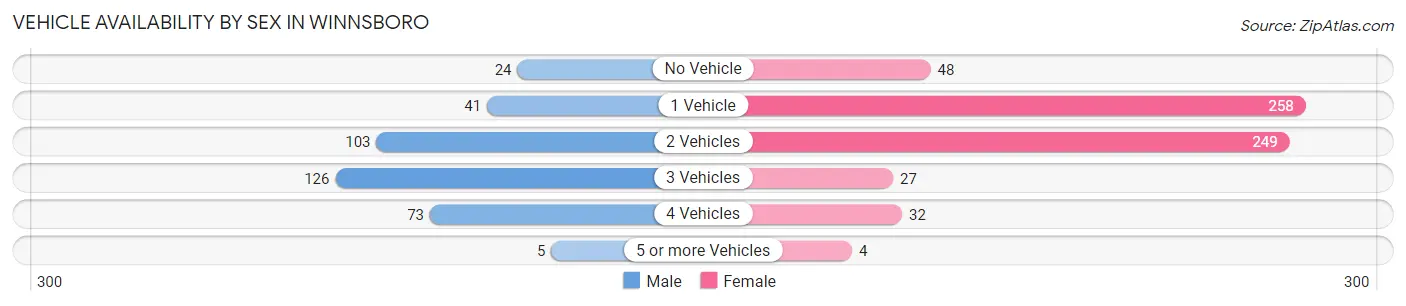
| Vehicles Available | Male | Female |
| No Vehicle | 24 (6.5%) | 48 (7.8%) |
| 1 Vehicle | 41 (11.0%) | 258 (41.7%) |
| 2 Vehicles | 103 (27.7%) | 249 (40.3%) |
| 3 Vehicles | 126 (33.9%) | 27 (4.4%) |
| 4 Vehicles | 73 (19.6%) | 32 (5.2%) |
| 5 or more Vehicles | 5 (1.3%) | 4 (0.6%) |
| Total | 372 (100.0%) | 618 (100.0%) |
Commute Time in Winnsboro
The most frequently occuring commute durations in Winnsboro are 30 to 34 minutes (245 commuters, 24.2%), 25 to 29 minutes (191 commuters, 18.9%), and 5 to 9 minutes (152 commuters, 15.0%).
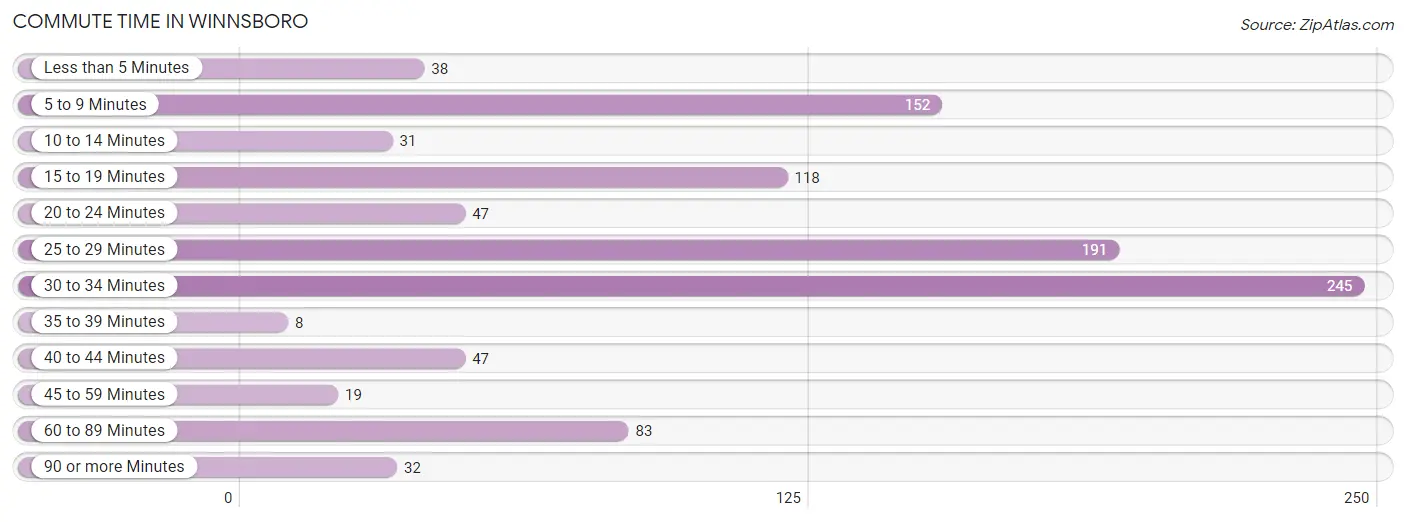
| Commute Time | # Commuters | % Commuters |
| Less than 5 Minutes | 38 | 3.8% |
| 5 to 9 Minutes | 152 | 15.0% |
| 10 to 14 Minutes | 31 | 3.1% |
| 15 to 19 Minutes | 118 | 11.7% |
| 20 to 24 Minutes | 47 | 4.6% |
| 25 to 29 Minutes | 191 | 18.9% |
| 30 to 34 Minutes | 245 | 24.2% |
| 35 to 39 Minutes | 8 | 0.8% |
| 40 to 44 Minutes | 47 | 4.6% |
| 45 to 59 Minutes | 19 | 1.9% |
| 60 to 89 Minutes | 83 | 8.2% |
| 90 or more Minutes | 32 | 3.2% |
Commute Time by Sex in Winnsboro
The most common commute times in Winnsboro are 5 to 9 minutes (111 commuters, 28.2%) for males and 30 to 34 minutes (216 commuters, 34.9%) for females.
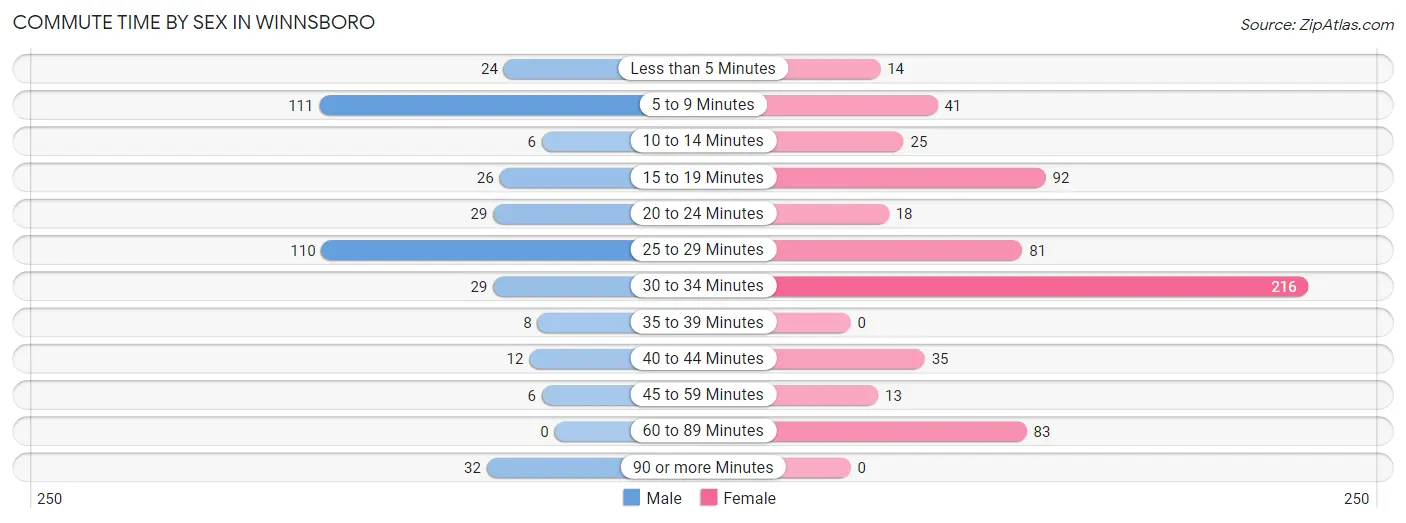
| Commute Time | Male | Female |
| Less than 5 Minutes | 24 (6.1%) | 14 (2.3%) |
| 5 to 9 Minutes | 111 (28.2%) | 41 (6.6%) |
| 10 to 14 Minutes | 6 (1.5%) | 25 (4.1%) |
| 15 to 19 Minutes | 26 (6.6%) | 92 (14.9%) |
| 20 to 24 Minutes | 29 (7.4%) | 18 (2.9%) |
| 25 to 29 Minutes | 110 (28.0%) | 81 (13.1%) |
| 30 to 34 Minutes | 29 (7.4%) | 216 (34.9%) |
| 35 to 39 Minutes | 8 (2.0%) | 0 (0.0%) |
| 40 to 44 Minutes | 12 (3.0%) | 35 (5.7%) |
| 45 to 59 Minutes | 6 (1.5%) | 13 (2.1%) |
| 60 to 89 Minutes | 0 (0.0%) | 83 (13.4%) |
| 90 or more Minutes | 32 (8.1%) | 0 (0.0%) |
Time of Departure to Work by Sex in Winnsboro
The most frequent times of departure to work in Winnsboro are 6:30 AM to 6:59 AM (109, 27.7%) for males and 7:30 AM to 7:59 AM (231, 37.4%) for females.
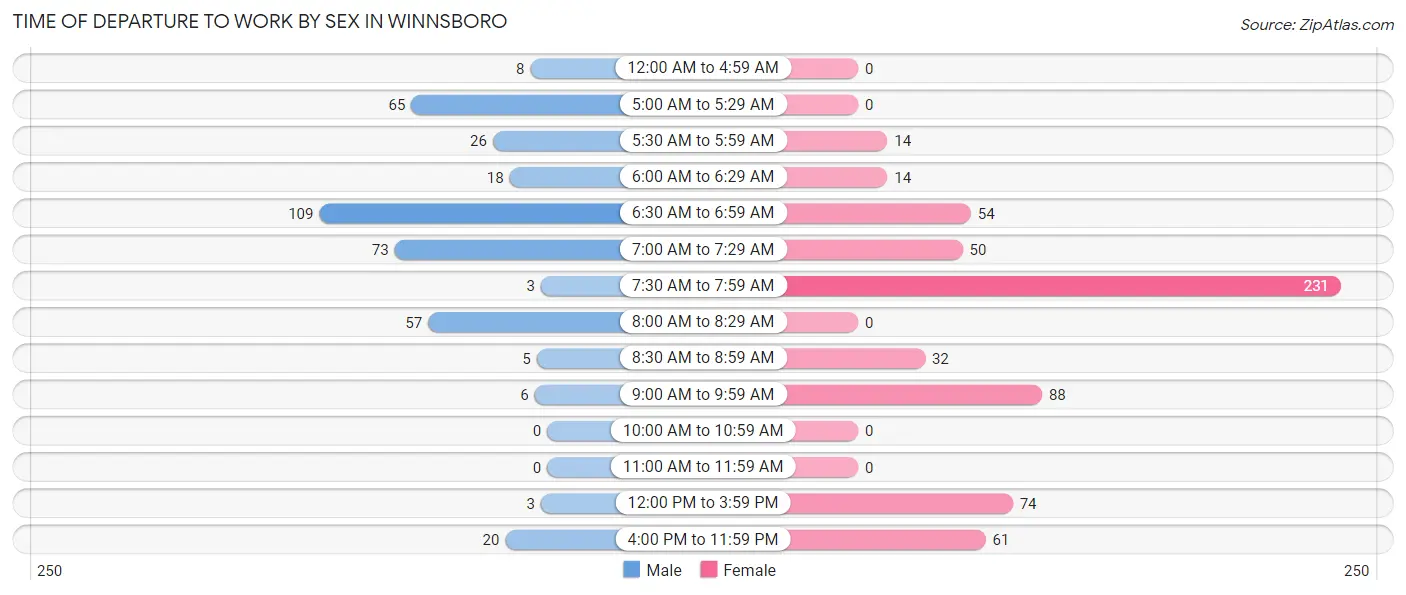
| Time of Departure | Male | Female |
| 12:00 AM to 4:59 AM | 8 (2.0%) | 0 (0.0%) |
| 5:00 AM to 5:29 AM | 65 (16.5%) | 0 (0.0%) |
| 5:30 AM to 5:59 AM | 26 (6.6%) | 14 (2.3%) |
| 6:00 AM to 6:29 AM | 18 (4.6%) | 14 (2.3%) |
| 6:30 AM to 6:59 AM | 109 (27.7%) | 54 (8.7%) |
| 7:00 AM to 7:29 AM | 73 (18.6%) | 50 (8.1%) |
| 7:30 AM to 7:59 AM | 3 (0.8%) | 231 (37.4%) |
| 8:00 AM to 8:29 AM | 57 (14.5%) | 0 (0.0%) |
| 8:30 AM to 8:59 AM | 5 (1.3%) | 32 (5.2%) |
| 9:00 AM to 9:59 AM | 6 (1.5%) | 88 (14.2%) |
| 10:00 AM to 10:59 AM | 0 (0.0%) | 0 (0.0%) |
| 11:00 AM to 11:59 AM | 0 (0.0%) | 0 (0.0%) |
| 12:00 PM to 3:59 PM | 3 (0.8%) | 74 (12.0%) |
| 4:00 PM to 11:59 PM | 20 (5.1%) | 61 (9.9%) |
| Total | 393 (100.0%) | 618 (100.0%) |
Housing Occupancy in Winnsboro
Occupancy by Ownership in Winnsboro
Of the total 1,331 dwellings in Winnsboro, owner-occupied units account for 724 (54.4%), while renter-occupied units make up 607 (45.6%).
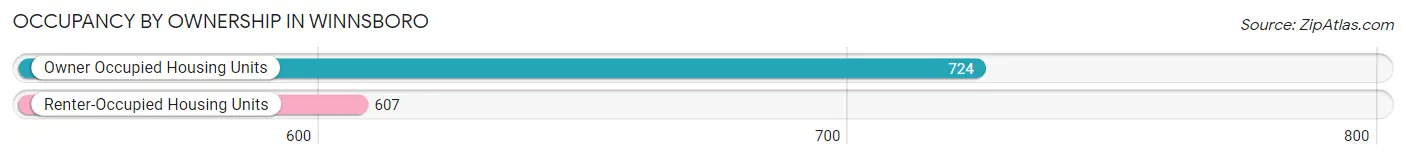
| Occupancy | # Housing Units | % Housing Units |
| Owner Occupied Housing Units | 724 | 54.4% |
| Renter-Occupied Housing Units | 607 | 45.6% |
| Total Occupied Housing Units | 1,331 | 100.0% |
Occupancy by Household Size in Winnsboro
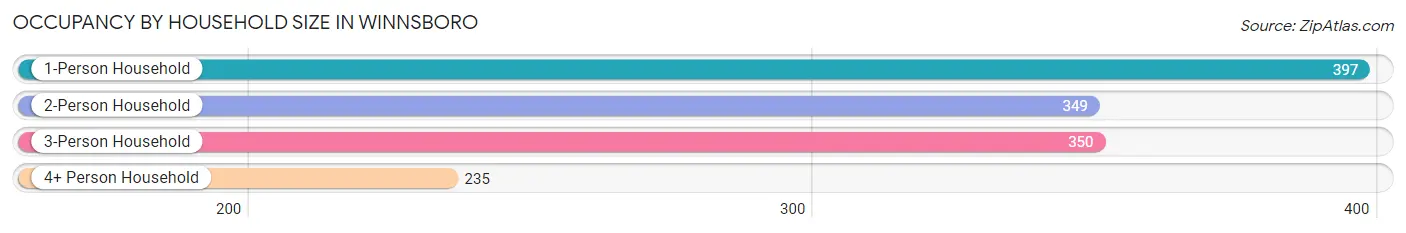
| Household Size | # Housing Units | % Housing Units |
| 1-Person Household | 397 | 29.8% |
| 2-Person Household | 349 | 26.2% |
| 3-Person Household | 350 | 26.3% |
| 4+ Person Household | 235 | 17.7% |
| Total Housing Units | 1,331 | 100.0% |
Occupancy by Ownership by Household Size in Winnsboro
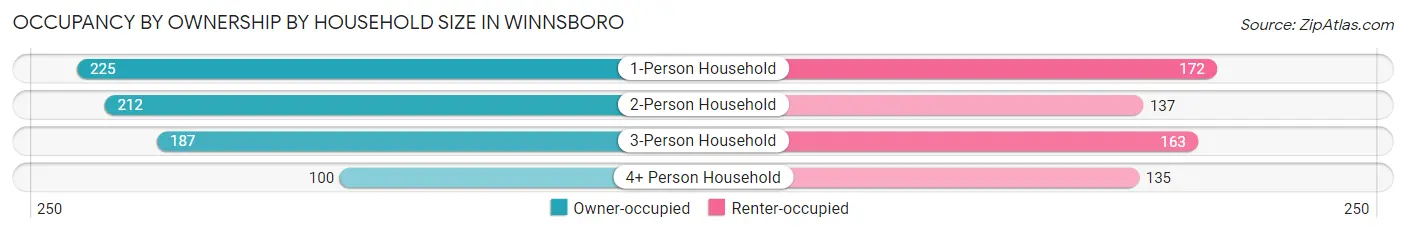
| Household Size | Owner-occupied | Renter-occupied |
| 1-Person Household | 225 (56.7%) | 172 (43.3%) |
| 2-Person Household | 212 (60.7%) | 137 (39.3%) |
| 3-Person Household | 187 (53.4%) | 163 (46.6%) |
| 4+ Person Household | 100 (42.5%) | 135 (57.5%) |
| Total Housing Units | 724 (54.4%) | 607 (45.6%) |
Occupancy by Educational Attainment in Winnsboro
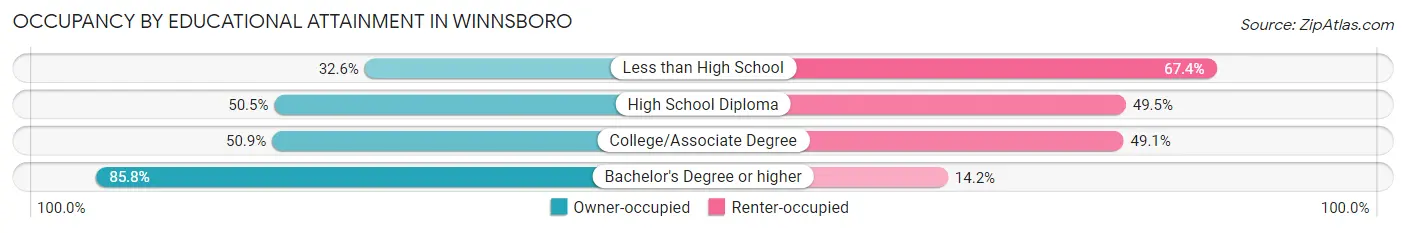
| Household Size | Owner-occupied | Renter-occupied |
| Less than High School | 57 (32.6%) | 118 (67.4%) |
| High School Diploma | 306 (50.5%) | 300 (49.5%) |
| College/Associate Degree | 162 (50.9%) | 156 (49.1%) |
| Bachelor's Degree or higher | 199 (85.8%) | 33 (14.2%) |
Occupancy by Age of Householder in Winnsboro
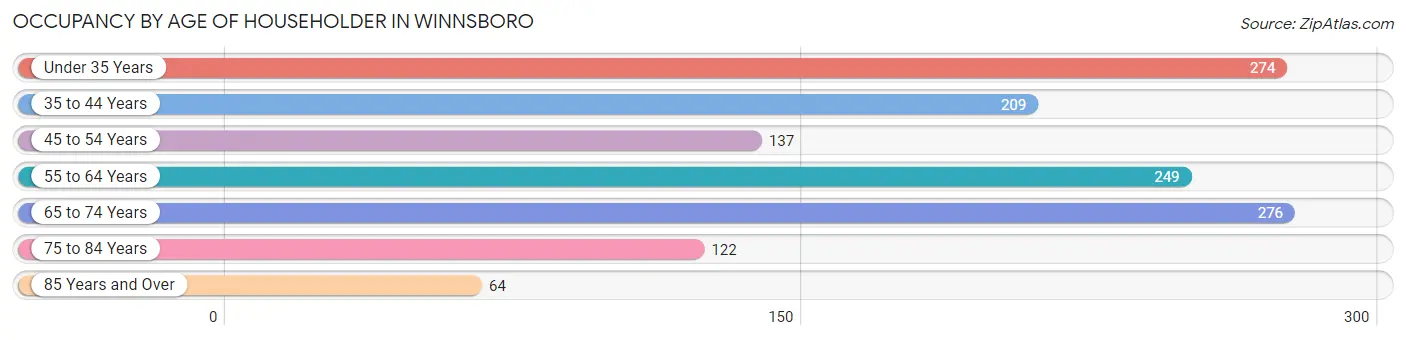
| Age Bracket | # Households | % Households |
| Under 35 Years | 274 | 20.6% |
| 35 to 44 Years | 209 | 15.7% |
| 45 to 54 Years | 137 | 10.3% |
| 55 to 64 Years | 249 | 18.7% |
| 65 to 74 Years | 276 | 20.7% |
| 75 to 84 Years | 122 | 9.2% |
| 85 Years and Over | 64 | 4.8% |
| Total | 1,331 | 100.0% |
Housing Finances in Winnsboro
Median Income by Occupancy in Winnsboro
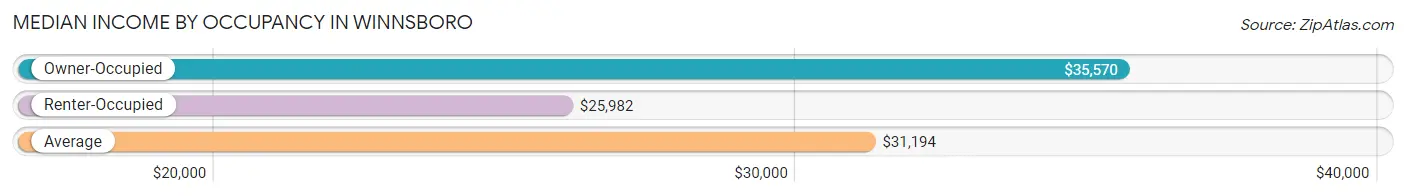
| Occupancy Type | # Households | Median Income |
| Owner-Occupied | 724 (54.4%) | $35,570 |
| Renter-Occupied | 607 (45.6%) | $25,982 |
| Average | 1,331 (100.0%) | $31,194 |
Occupancy by Householder Income Bracket in Winnsboro
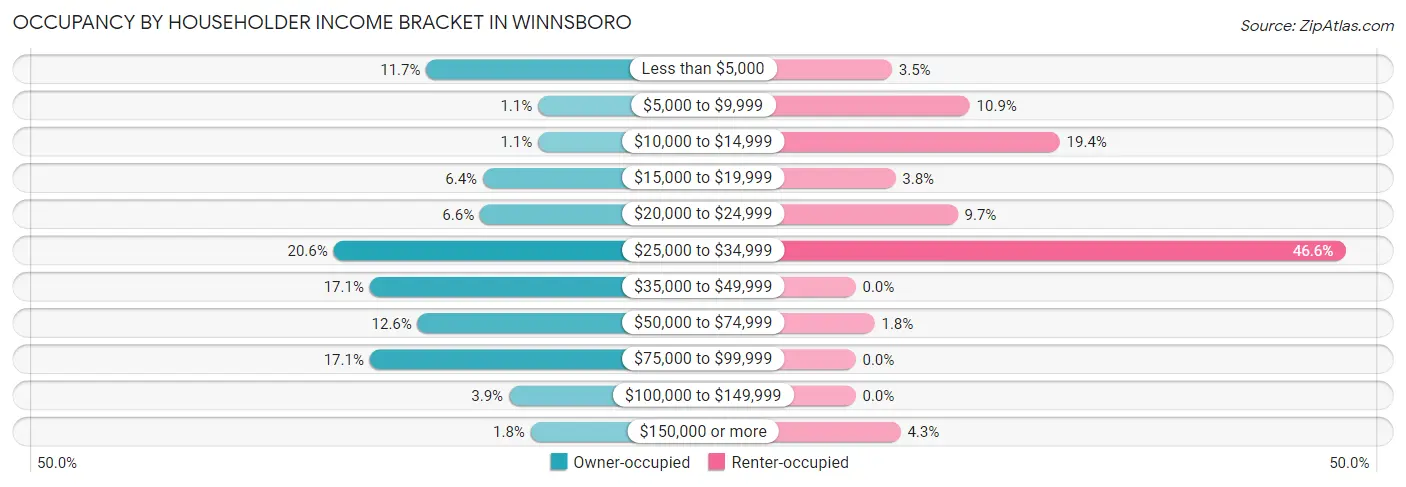
| Income Bracket | Owner-occupied | Renter-occupied |
| Less than $5,000 | 85 (11.7%) | 21 (3.5%) |
| $5,000 to $9,999 | 8 (1.1%) | 66 (10.9%) |
| $10,000 to $14,999 | 8 (1.1%) | 118 (19.4%) |
| $15,000 to $19,999 | 46 (6.4%) | 23 (3.8%) |
| $20,000 to $24,999 | 48 (6.6%) | 59 (9.7%) |
| $25,000 to $34,999 | 149 (20.6%) | 283 (46.6%) |
| $35,000 to $49,999 | 124 (17.1%) | 0 (0.0%) |
| $50,000 to $74,999 | 91 (12.6%) | 11 (1.8%) |
| $75,000 to $99,999 | 124 (17.1%) | 0 (0.0%) |
| $100,000 to $149,999 | 28 (3.9%) | 0 (0.0%) |
| $150,000 or more | 13 (1.8%) | 26 (4.3%) |
| Total | 724 (100.0%) | 607 (100.0%) |
Monthly Housing Cost Tiers in Winnsboro
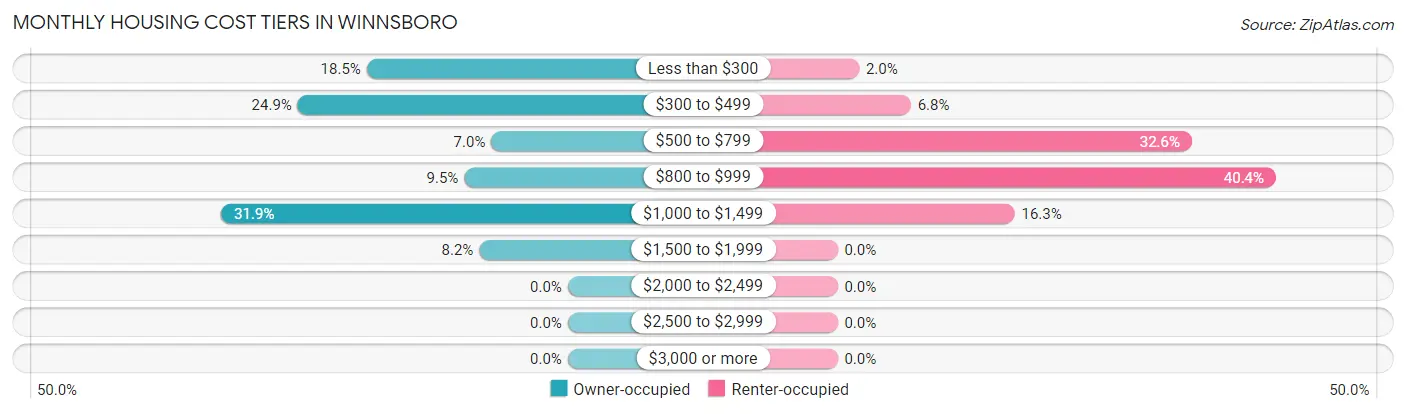
| Monthly Cost | Owner-occupied | Renter-occupied |
| Less than $300 | 134 (18.5%) | 12 (2.0%) |
| $300 to $499 | 180 (24.9%) | 41 (6.8%) |
| $500 to $799 | 51 (7.0%) | 198 (32.6%) |
| $800 to $999 | 69 (9.5%) | 245 (40.4%) |
| $1,000 to $1,499 | 231 (31.9%) | 99 (16.3%) |
| $1,500 to $1,999 | 59 (8.2%) | 0 (0.0%) |
| $2,000 to $2,499 | 0 (0.0%) | 0 (0.0%) |
| $2,500 to $2,999 | 0 (0.0%) | 0 (0.0%) |
| $3,000 or more | 0 (0.0%) | 0 (0.0%) |
| Total | 724 (100.0%) | 607 (100.0%) |
Physical Housing Characteristics in Winnsboro
Housing Structures in Winnsboro
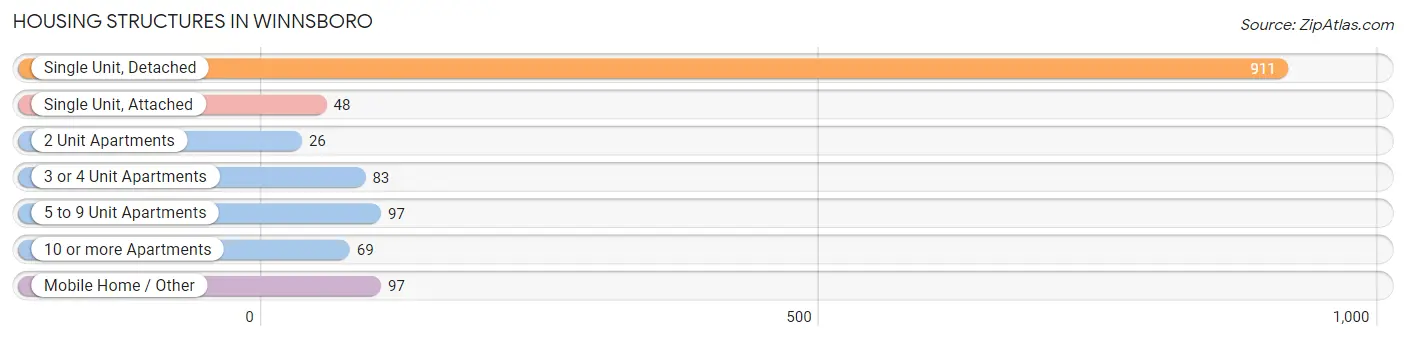
| Structure Type | # Housing Units | % Housing Units |
| Single Unit, Detached | 911 | 68.4% |
| Single Unit, Attached | 48 | 3.6% |
| 2 Unit Apartments | 26 | 1.9% |
| 3 or 4 Unit Apartments | 83 | 6.2% |
| 5 to 9 Unit Apartments | 97 | 7.3% |
| 10 or more Apartments | 69 | 5.2% |
| Mobile Home / Other | 97 | 7.3% |
| Total | 1,331 | 100.0% |
Housing Structures by Occupancy in Winnsboro
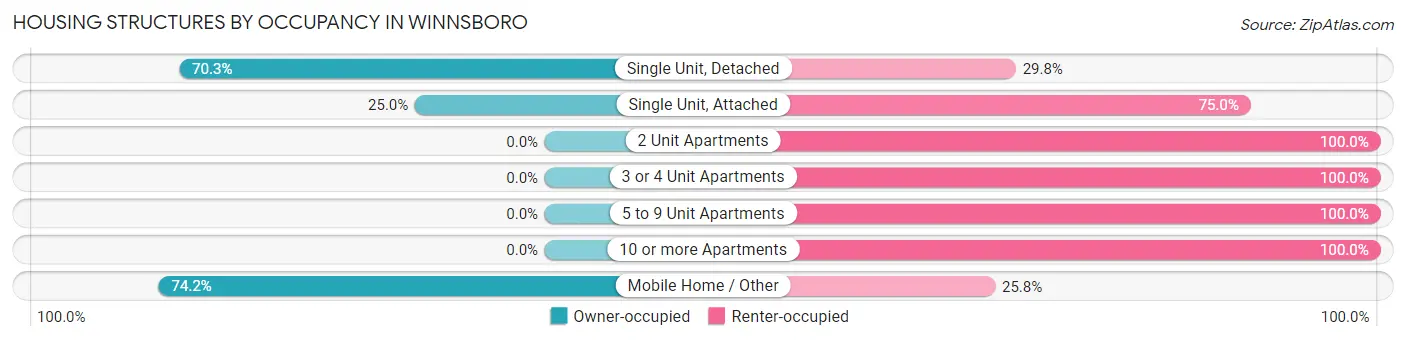
| Structure Type | Owner-occupied | Renter-occupied |
| Single Unit, Detached | 640 (70.3%) | 271 (29.7%) |
| Single Unit, Attached | 12 (25.0%) | 36 (75.0%) |
| 2 Unit Apartments | 0 (0.0%) | 26 (100.0%) |
| 3 or 4 Unit Apartments | 0 (0.0%) | 83 (100.0%) |
| 5 to 9 Unit Apartments | 0 (0.0%) | 97 (100.0%) |
| 10 or more Apartments | 0 (0.0%) | 69 (100.0%) |
| Mobile Home / Other | 72 (74.2%) | 25 (25.8%) |
| Total | 724 (54.4%) | 607 (45.6%) |
Housing Structures by Number of Rooms in Winnsboro
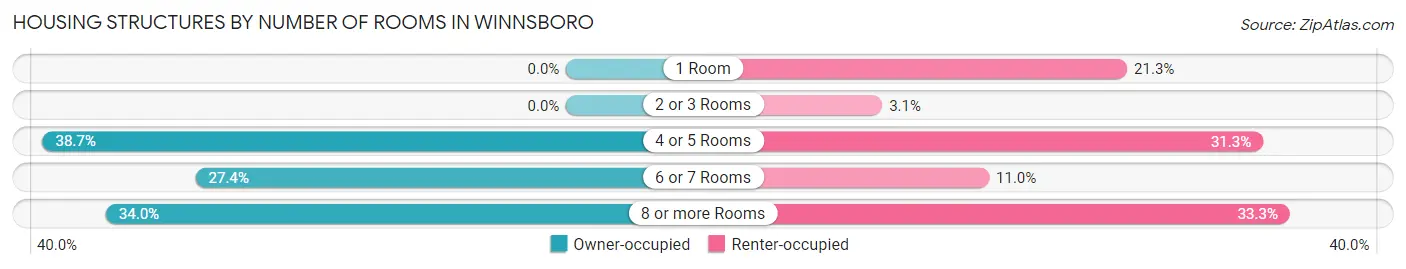
| Number of Rooms | Owner-occupied | Renter-occupied |
| 1 Room | 0 (0.0%) | 129 (21.2%) |
| 2 or 3 Rooms | 0 (0.0%) | 19 (3.1%) |
| 4 or 5 Rooms | 280 (38.7%) | 190 (31.3%) |
| 6 or 7 Rooms | 198 (27.4%) | 67 (11.0%) |
| 8 or more Rooms | 246 (34.0%) | 202 (33.3%) |
| Total | 724 (100.0%) | 607 (100.0%) |
Housing Structure by Heating Type in Winnsboro
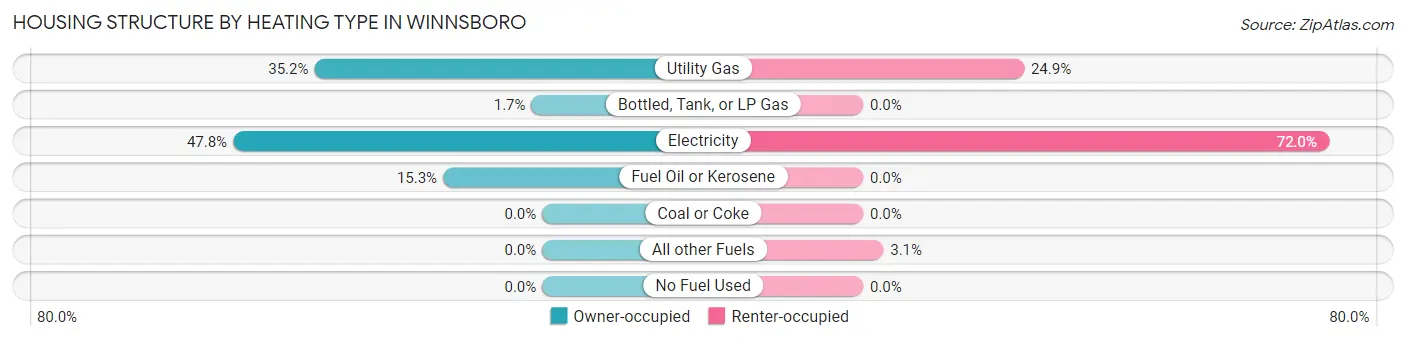
| Heating Type | Owner-occupied | Renter-occupied |
| Utility Gas | 255 (35.2%) | 151 (24.9%) |
| Bottled, Tank, or LP Gas | 12 (1.7%) | 0 (0.0%) |
| Electricity | 346 (47.8%) | 437 (72.0%) |
| Fuel Oil or Kerosene | 111 (15.3%) | 0 (0.0%) |
| Coal or Coke | 0 (0.0%) | 0 (0.0%) |
| All other Fuels | 0 (0.0%) | 19 (3.1%) |
| No Fuel Used | 0 (0.0%) | 0 (0.0%) |
| Total | 724 (100.0%) | 607 (100.0%) |
Household Vehicle Usage in Winnsboro
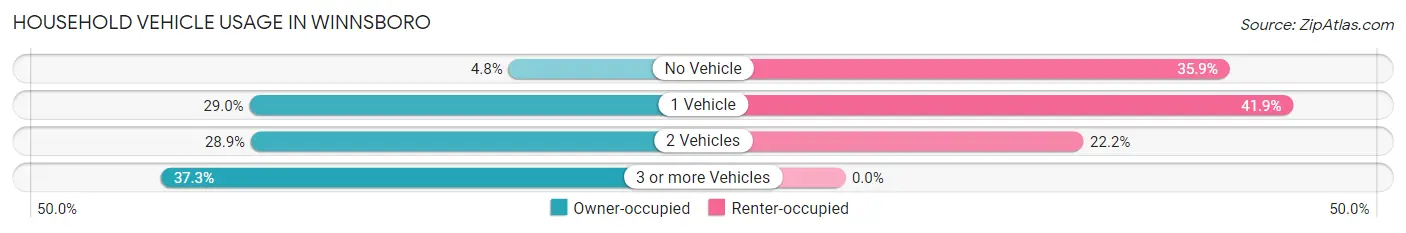
| Vehicles per Household | Owner-occupied | Renter-occupied |
| No Vehicle | 35 (4.8%) | 218 (35.9%) |
| 1 Vehicle | 210 (29.0%) | 254 (41.8%) |
| 2 Vehicles | 209 (28.9%) | 135 (22.2%) |
| 3 or more Vehicles | 270 (37.3%) | 0 (0.0%) |
| Total | 724 (100.0%) | 607 (100.0%) |
Real Estate & Mortgages in Winnsboro
Real Estate and Mortgage Overview in Winnsboro
| Characteristic | Without Mortgage | With Mortgage |
| Housing Units | 400 | 324 |
| Median Property Value | $105,800 | $141,100 |
| Median Household Income | $33,412 | $5 |
| Monthly Housing Costs | $354 | $0 |
| Real Estate Taxes | $374 | $0 |
Property Value by Mortgage Status in Winnsboro
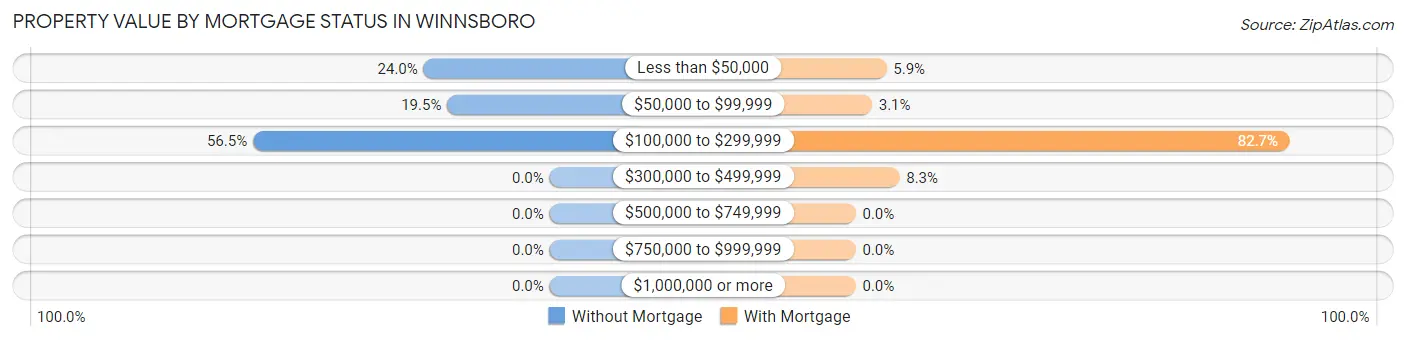
| Property Value | Without Mortgage | With Mortgage |
| Less than $50,000 | 96 (24.0%) | 19 (5.9%) |
| $50,000 to $99,999 | 78 (19.5%) | 10 (3.1%) |
| $100,000 to $299,999 | 226 (56.5%) | 268 (82.7%) |
| $300,000 to $499,999 | 0 (0.0%) | 27 (8.3%) |
| $500,000 to $749,999 | 0 (0.0%) | 0 (0.0%) |
| $750,000 to $999,999 | 0 (0.0%) | 0 (0.0%) |
| $1,000,000 or more | 0 (0.0%) | 0 (0.0%) |
| Total | 400 (100.0%) | 324 (100.0%) |
Household Income by Mortgage Status in Winnsboro
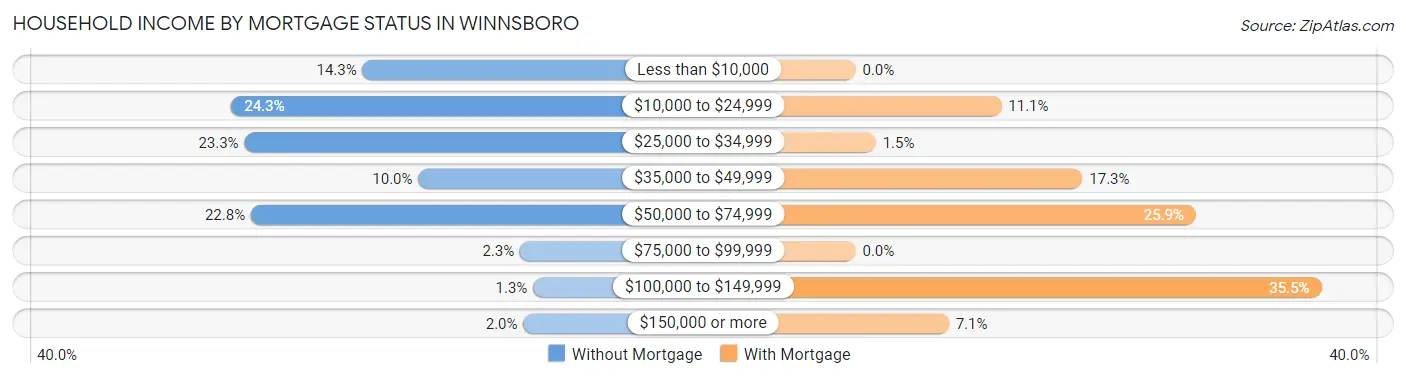
| Household Income | Without Mortgage | With Mortgage |
| Less than $10,000 | 57 (14.2%) | 0 (0.0%) |
| $10,000 to $24,999 | 97 (24.2%) | 36 (11.1%) |
| $25,000 to $34,999 | 93 (23.3%) | 5 (1.5%) |
| $35,000 to $49,999 | 40 (10.0%) | 56 (17.3%) |
| $50,000 to $74,999 | 91 (22.8%) | 84 (25.9%) |
| $75,000 to $99,999 | 9 (2.2%) | 0 (0.0%) |
| $100,000 to $149,999 | 5 (1.3%) | 115 (35.5%) |
| $150,000 or more | 8 (2.0%) | 23 (7.1%) |
| Total | 400 (100.0%) | 324 (100.0%) |
Property Value to Household Income Ratio in Winnsboro
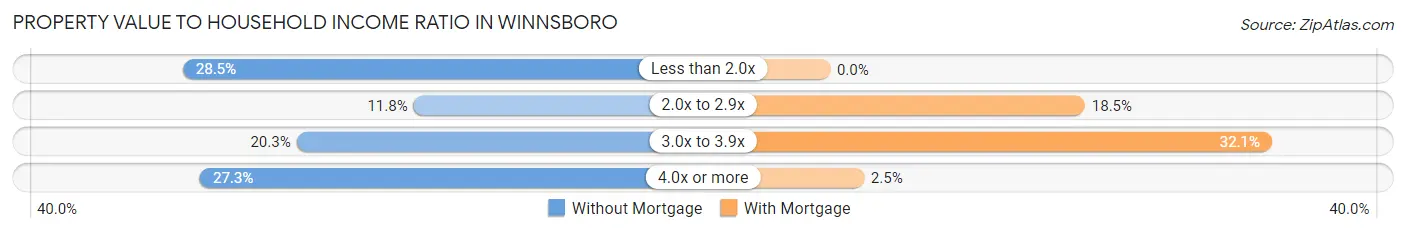
| Value-to-Income Ratio | Without Mortgage | With Mortgage |
| Less than 2.0x | 114 (28.5%) | 0 (0.0%) |
| 2.0x to 2.9x | 47 (11.7%) | 60 (18.5%) |
| 3.0x to 3.9x | 81 (20.3%) | 104 (32.1%) |
| 4.0x or more | 109 (27.3%) | 8 (2.5%) |
| Total | 400 (100.0%) | 324 (100.0%) |
Real Estate Taxes by Mortgage Status in Winnsboro
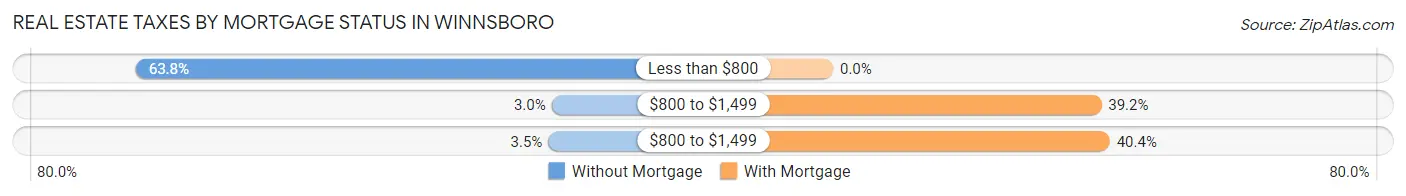
| Property Taxes | Without Mortgage | With Mortgage |
| Less than $800 | 255 (63.7%) | 0 (0.0%) |
| $800 to $1,499 | 12 (3.0%) | 127 (39.2%) |
| $800 to $1,499 | 14 (3.5%) | 131 (40.4%) |
| Total | 400 (100.0%) | 324 (100.0%) |
Health & Disability in Winnsboro
Health Insurance Coverage by Age in Winnsboro
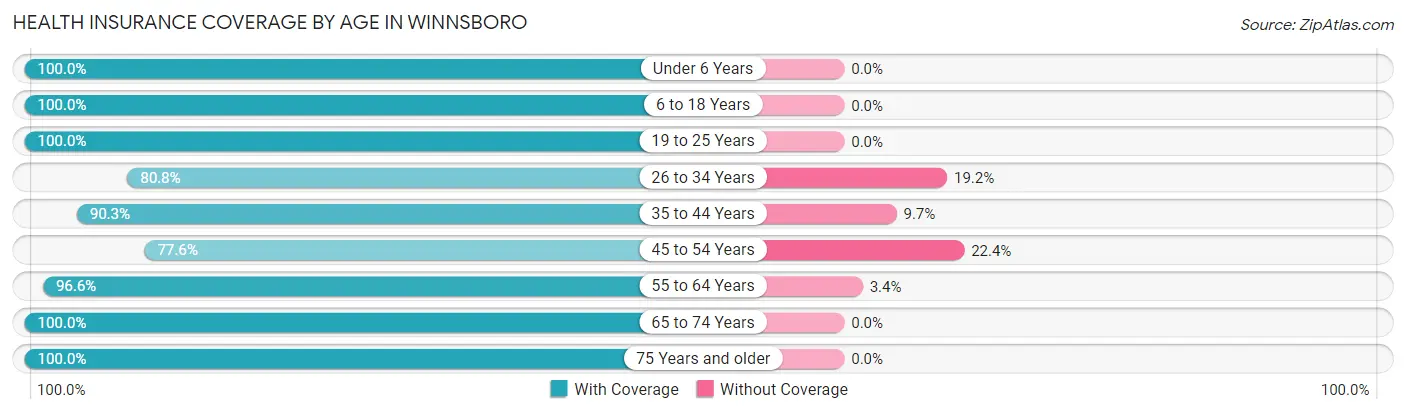
| Age Bracket | With Coverage | Without Coverage |
| Under 6 Years | 265 (100.0%) | 0 (0.0%) |
| 6 to 18 Years | 816 (100.0%) | 0 (0.0%) |
| 19 to 25 Years | 172 (100.0%) | 0 (0.0%) |
| 26 to 34 Years | 329 (80.8%) | 78 (19.2%) |
| 35 to 44 Years | 241 (90.3%) | 26 (9.7%) |
| 45 to 54 Years | 257 (77.6%) | 74 (22.4%) |
| 55 to 64 Years | 394 (96.6%) | 14 (3.4%) |
| 65 to 74 Years | 302 (100.0%) | 0 (0.0%) |
| 75 Years and older | 271 (100.0%) | 0 (0.0%) |
| Total | 3,047 (94.1%) | 192 (5.9%) |
Health Insurance Coverage by Citizenship Status in Winnsboro
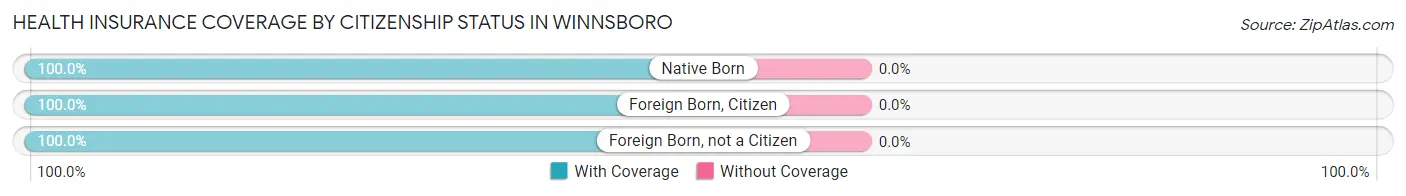
| Citizenship Status | With Coverage | Without Coverage |
| Native Born | 265 (100.0%) | 0 (0.0%) |
| Foreign Born, Citizen | 816 (100.0%) | 0 (0.0%) |
| Foreign Born, not a Citizen | 172 (100.0%) | 0 (0.0%) |
Health Insurance Coverage by Household Income in Winnsboro
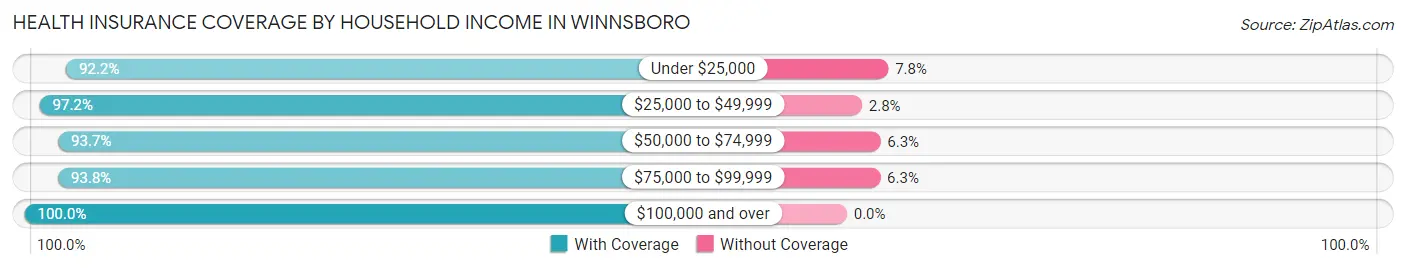
| Household Income | With Coverage | Without Coverage |
| Under $25,000 | 903 (92.2%) | 76 (7.8%) |
| $25,000 to $49,999 | 1,344 (97.2%) | 39 (2.8%) |
| $50,000 to $74,999 | 179 (93.7%) | 12 (6.3%) |
| $75,000 to $99,999 | 390 (93.8%) | 26 (6.2%) |
| $100,000 and over | 193 (100.0%) | 0 (0.0%) |
Public vs Private Health Insurance Coverage by Age in Winnsboro
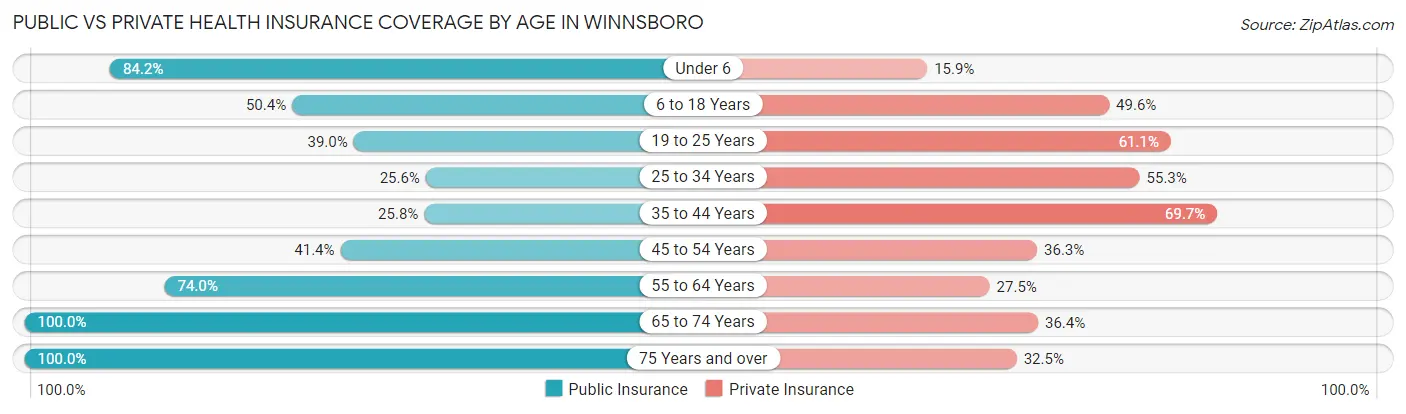
| Age Bracket | Public Insurance | Private Insurance |
| Under 6 | 223 (84.2%) | 42 (15.9%) |
| 6 to 18 Years | 411 (50.4%) | 405 (49.6%) |
| 19 to 25 Years | 67 (39.0%) | 105 (61.1%) |
| 25 to 34 Years | 104 (25.6%) | 225 (55.3%) |
| 35 to 44 Years | 69 (25.8%) | 186 (69.7%) |
| 45 to 54 Years | 137 (41.4%) | 120 (36.2%) |
| 55 to 64 Years | 302 (74.0%) | 112 (27.5%) |
| 65 to 74 Years | 302 (100.0%) | 110 (36.4%) |
| 75 Years and over | 271 (100.0%) | 88 (32.5%) |
| Total | 1,886 (58.2%) | 1,393 (43.0%) |
Disability Status by Sex by Age in Winnsboro
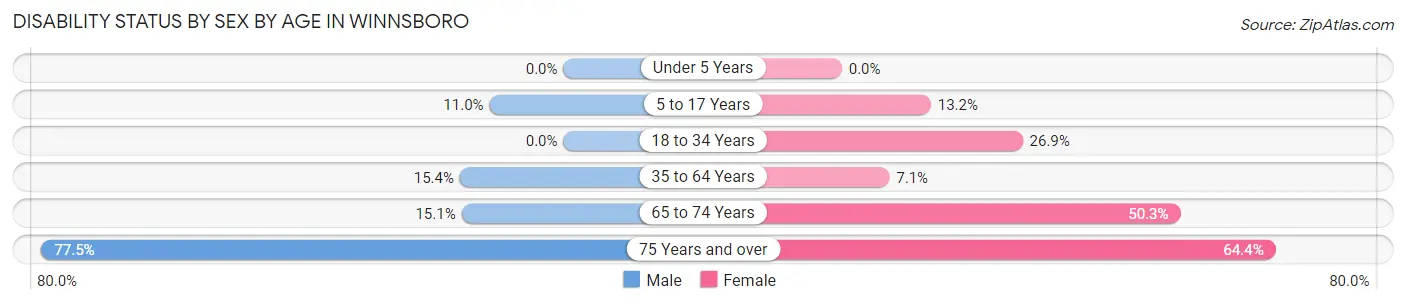
| Age Bracket | Male | Female |
| Under 5 Years | 0 (0.0%) | 0 (0.0%) |
| 5 to 17 Years | 56 (11.0%) | 30 (13.2%) |
| 18 to 34 Years | 0 (0.0%) | 127 (26.9%) |
| 35 to 64 Years | 72 (15.4%) | 38 (7.1%) |
| 65 to 74 Years | 18 (15.1%) | 92 (50.3%) |
| 75 Years and over | 62 (77.5%) | 123 (64.4%) |
Disability Class by Sex by Age in Winnsboro
Disability Class: Hearing Difficulty
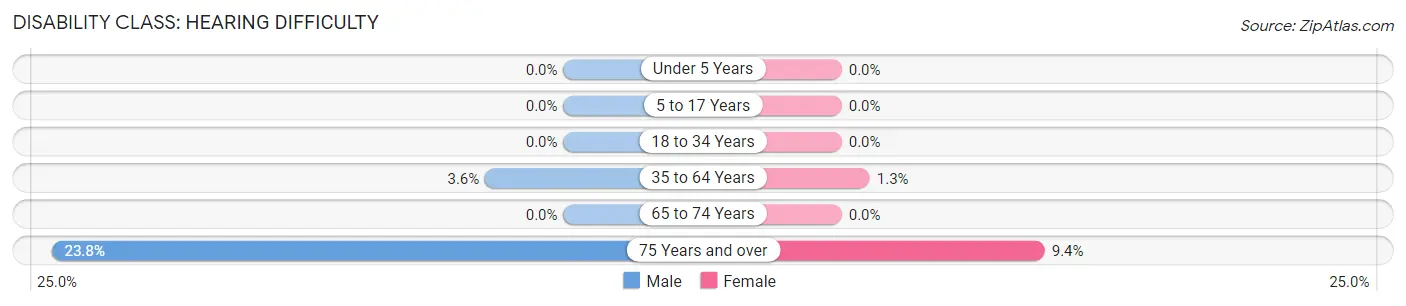
| Age Bracket | Male | Female |
| Under 5 Years | 0 (0.0%) | 0 (0.0%) |
| 5 to 17 Years | 0 (0.0%) | 0 (0.0%) |
| 18 to 34 Years | 0 (0.0%) | 0 (0.0%) |
| 35 to 64 Years | 17 (3.6%) | 7 (1.3%) |
| 65 to 74 Years | 0 (0.0%) | 0 (0.0%) |
| 75 Years and over | 19 (23.7%) | 18 (9.4%) |
Disability Class: Vision Difficulty
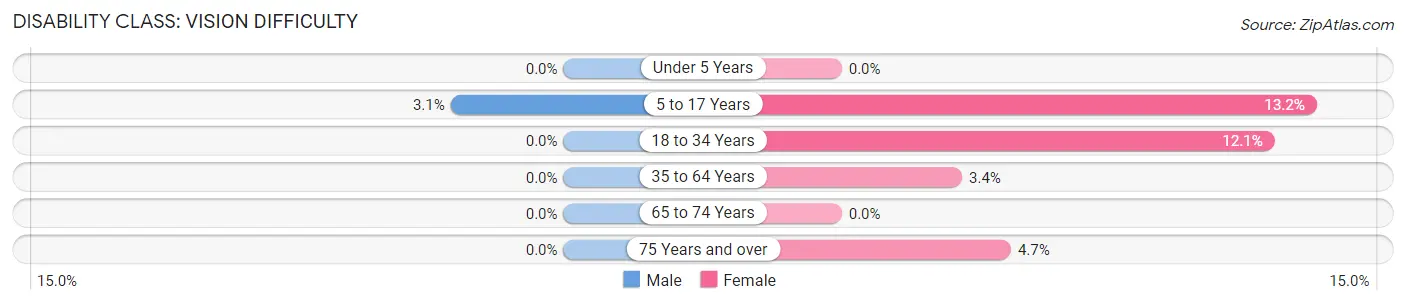
| Age Bracket | Male | Female |
| Under 5 Years | 0 (0.0%) | 0 (0.0%) |
| 5 to 17 Years | 16 (3.1%) | 30 (13.2%) |
| 18 to 34 Years | 0 (0.0%) | 57 (12.0%) |
| 35 to 64 Years | 0 (0.0%) | 18 (3.4%) |
| 65 to 74 Years | 0 (0.0%) | 0 (0.0%) |
| 75 Years and over | 0 (0.0%) | 9 (4.7%) |
Disability Class: Cognitive Difficulty
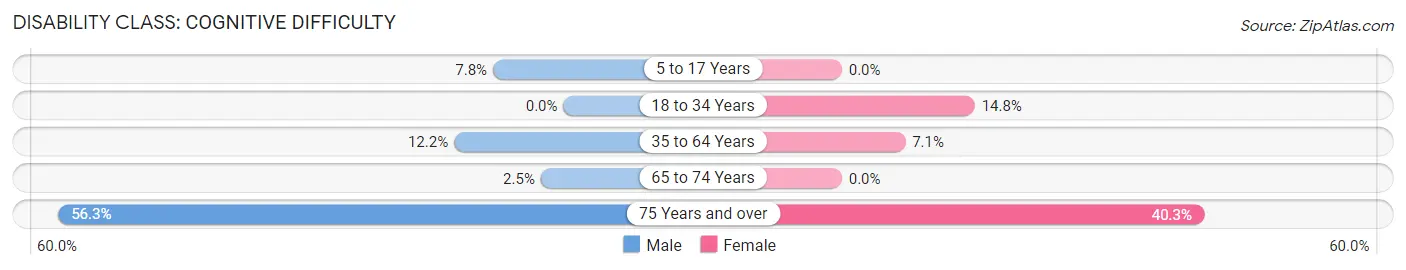
| Age Bracket | Male | Female |
| 5 to 17 Years | 40 (7.8%) | 0 (0.0%) |
| 18 to 34 Years | 0 (0.0%) | 70 (14.8%) |
| 35 to 64 Years | 57 (12.2%) | 38 (7.1%) |
| 65 to 74 Years | 3 (2.5%) | 0 (0.0%) |
| 75 Years and over | 45 (56.2%) | 77 (40.3%) |
Disability Class: Ambulatory Difficulty
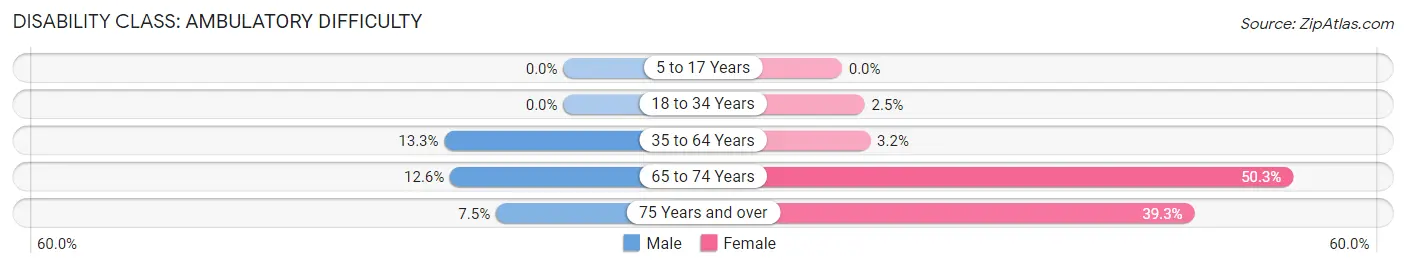
| Age Bracket | Male | Female |
| 5 to 17 Years | 0 (0.0%) | 0 (0.0%) |
| 18 to 34 Years | 0 (0.0%) | 12 (2.5%) |
| 35 to 64 Years | 62 (13.3%) | 17 (3.2%) |
| 65 to 74 Years | 15 (12.6%) | 92 (50.3%) |
| 75 Years and over | 6 (7.5%) | 75 (39.3%) |
Disability Class: Self-Care Difficulty
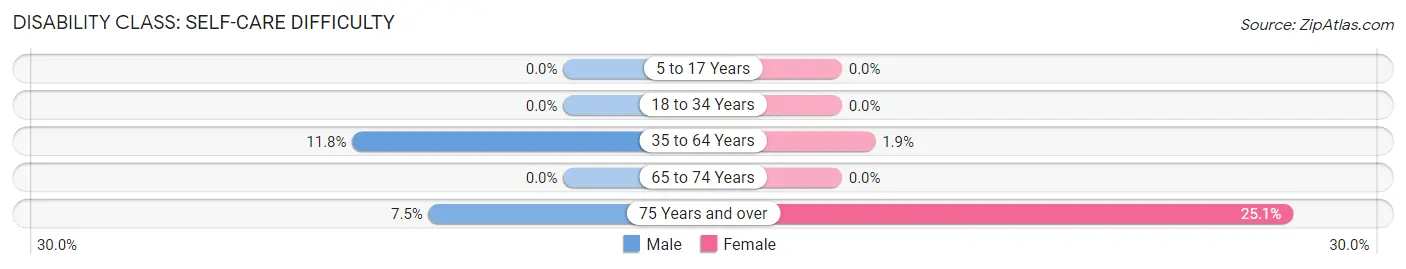
| Age Bracket | Male | Female |
| 5 to 17 Years | 0 (0.0%) | 0 (0.0%) |
| 18 to 34 Years | 0 (0.0%) | 0 (0.0%) |
| 35 to 64 Years | 55 (11.7%) | 10 (1.9%) |
| 65 to 74 Years | 0 (0.0%) | 0 (0.0%) |
| 75 Years and over | 6 (7.5%) | 48 (25.1%) |
Technology Access in Winnsboro
Computing Device Access in Winnsboro
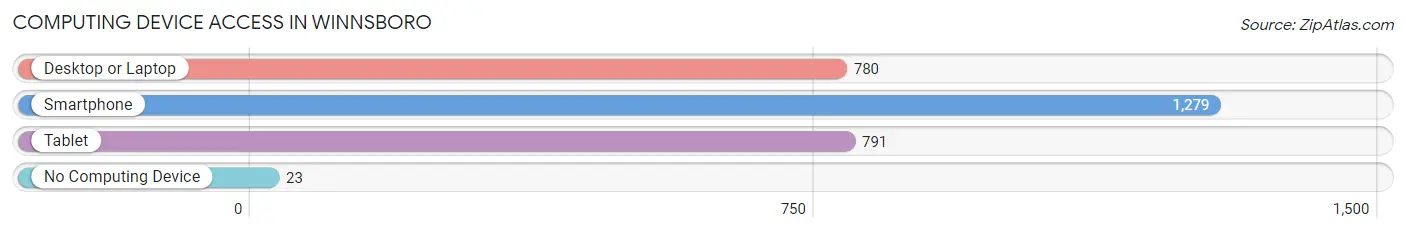
| Device Type | # Households | % Households |
| Desktop or Laptop | 780 | 58.6% |
| Smartphone | 1,279 | 96.1% |
| Tablet | 791 | 59.4% |
| No Computing Device | 23 | 1.7% |
| Total | 1,331 | 100.0% |
Internet Access in Winnsboro
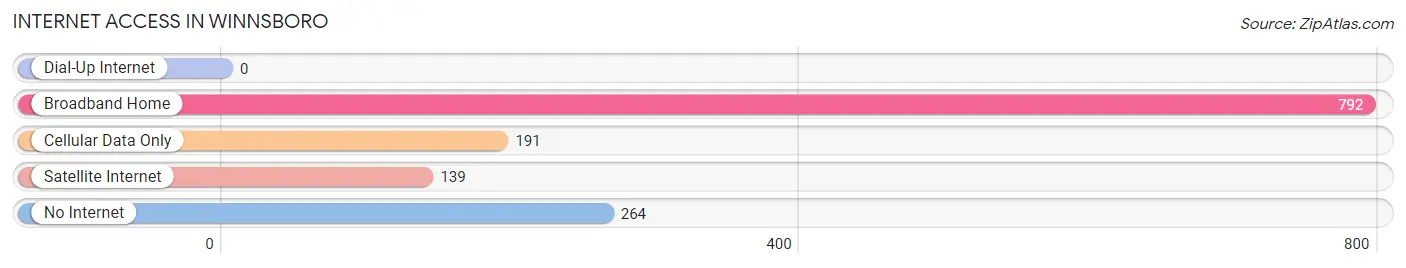
| Internet Type | # Households | % Households |
| Dial-Up Internet | 0 | 0.0% |
| Broadband Home | 792 | 59.5% |
| Cellular Data Only | 191 | 14.3% |
| Satellite Internet | 139 | 10.4% |
| No Internet | 264 | 19.8% |
| Total | 1,331 | 100.0% |
Winnsboro Summary
Winnsboro, South Carolina is a small town located in Fairfield County, South Carolina. It is situated in the Midlands region of the state, approximately 40 miles northwest of Columbia, the state capital. The town is located on the banks of the Broad River and is home to a population of approximately 3,400 people.
History
Winnsboro was founded in 1785 by Colonel Richard Winn, a Revolutionary War hero. The town was named after his father, John Winn, who was a prominent figure in the area. The town was originally known as Winnsborough, but the name was later changed to Winnsboro.
The town was an important trading center during the antebellum period, and it was the site of a major battle during the Civil War. The Battle of Winnsboro was fought on February 17, 1865, and resulted in a Confederate victory.
Geography
Winnsboro is located in the Midlands region of South Carolina, approximately 40 miles northwest of Columbia. The town is situated on the banks of the Broad River, and is surrounded by rolling hills and forests. The town is located in a rural area, and is home to a variety of wildlife, including deer, wild turkeys, and a variety of birds.
Economy
Winnsboro’s economy is largely based on agriculture and manufacturing. The town is home to several large manufacturing plants, including a paper mill, a textile mill, and a furniture factory. The town is also home to several small businesses, including restaurants, shops, and other services.
Demographics
As of the 2010 census, the population of Winnsboro was 3,400. The town is predominantly white, with African Americans making up approximately 25% of the population. The median household income is $35,000, and the median home value is $90,000.
The town is served by the Fairfield County School District, which includes four elementary schools, one middle school, and one high school. The town is also home to a branch of the University of South Carolina.
Winnsboro is a small town with a rich history and a vibrant economy. The town is home to a diverse population, and is a great place to live and work. The town is surrounded by beautiful scenery, and is a great place to visit and explore.
Common Questions
What is Per Capita Income in Winnsboro?
Per Capita income in Winnsboro is $16,254.
What is the Median Family Income in Winnsboro?
Median Family Income in Winnsboro is $32,026.
What is the Median Household income in Winnsboro?
Median Household Income in Winnsboro is $31,194.
What is Income or Wage Gap in Winnsboro?
Income or Wage Gap in Winnsboro is 27.9%.
Women in Winnsboro earn 72.1 cents for every dollar earned by a man.
What is Family Income Deficit in Winnsboro?
Family Income Deficit in Winnsboro is $11,585.
Families that are below poverty line in Winnsboro earn $11,585 less on average than the poverty threshold level.
What is Inequality or Gini Index in Winnsboro?
Inequality or Gini Index in Winnsboro is 0.45.
What is the Total Population of Winnsboro?
Total Population of Winnsboro is 3,239.
What is the Total Male Population of Winnsboro?
Total Male Population of Winnsboro is 1,470.
What is the Total Female Population of Winnsboro?
Total Female Population of Winnsboro is 1,769.
What is the Ratio of Males per 100 Females in Winnsboro?
There are 83.10 Males per 100 Females in Winnsboro.
What is the Ratio of Females per 100 Males in Winnsboro?
There are 120.34 Females per 100 Males in Winnsboro.
What is the Median Population Age in Winnsboro?
Median Population Age in Winnsboro is 34.2 Years.
What is the Average Family Size in Winnsboro
Average Family Size in Winnsboro is 3.0 People.
What is the Average Household Size in Winnsboro
Average Household Size in Winnsboro is 2.4 People.
How Large is the Labor Force in Winnsboro?
There are 1,201 People in the Labor Forcein in Winnsboro.
What is the Percentage of People in the Labor Force in Winnsboro?
52.2% of People are in the Labor Force in Winnsboro.
What is the Unemployment Rate in Winnsboro?
Unemployment Rate in Winnsboro is 10.6%.