New Ellenton, SC Map & Demographics
New Ellenton Map
New Ellenton Overview
$30,469
PER CAPITA INCOME
$54,500
AVG FAMILY INCOME
$56,304
AVG HOUSEHOLD INCOME
24.5%
WAGE / INCOME GAP [ % ]
75.5¢/ $1
WAGE / INCOME GAP [ $ ]
0.39
INEQUALITY / GINI INDEX
2,508
TOTAL POPULATION
1,185
MALE POPULATION
1,323
FEMALE POPULATION
89.57
MALES / 100 FEMALES
111.65
FEMALES / 100 MALES
37.6
MEDIAN AGE
3.1
AVG FAMILY SIZE
2.6
AVG HOUSEHOLD SIZE
1,320
LABOR FORCE [ PEOPLE ]
63.9%
PERCENT IN LABOR FORCE
4.2%
UNEMPLOYMENT RATE
New Ellenton Zip Codes
New Ellenton Area Codes
Income in New Ellenton
Income Overview in New Ellenton
Per Capita Income in New Ellenton is $30,469, while median incomes of families and households are $54,500 and $56,304 respectively.
| Characteristic | Number | Measure |
| Per Capita Income | 2,508 | $30,469 |
| Median Family Income | 682 | $54,500 |
| Mean Family Income | 682 | $72,835 |
| Median Household Income | 968 | $56,304 |
| Mean Household Income | 968 | $75,487 |
| Income Deficit | 682 | $0 |
| Wage / Income Gap (%) | 2,508 | 24.47% |
| Wage / Income Gap ($) | 2,508 | 75.53¢ per $1 |
| Gini / Inequality Index | 2,508 | 0.39 |
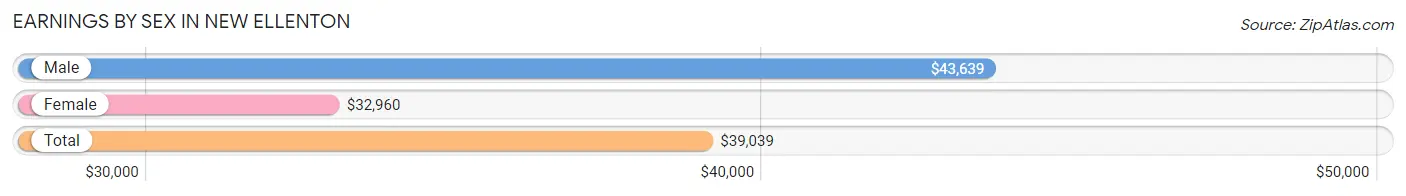
Earnings by Sex in New Ellenton
Average Earnings in New Ellenton are $39,039, $43,639 for men and $32,960 for women, a difference of 24.5%.
| Sex | Number | Average Earnings |
| Male | 692 (50.6%) | $43,639 |
| Female | 675 (49.4%) | $32,960 |
| Total | 1,367 (100.0%) | $39,039 |
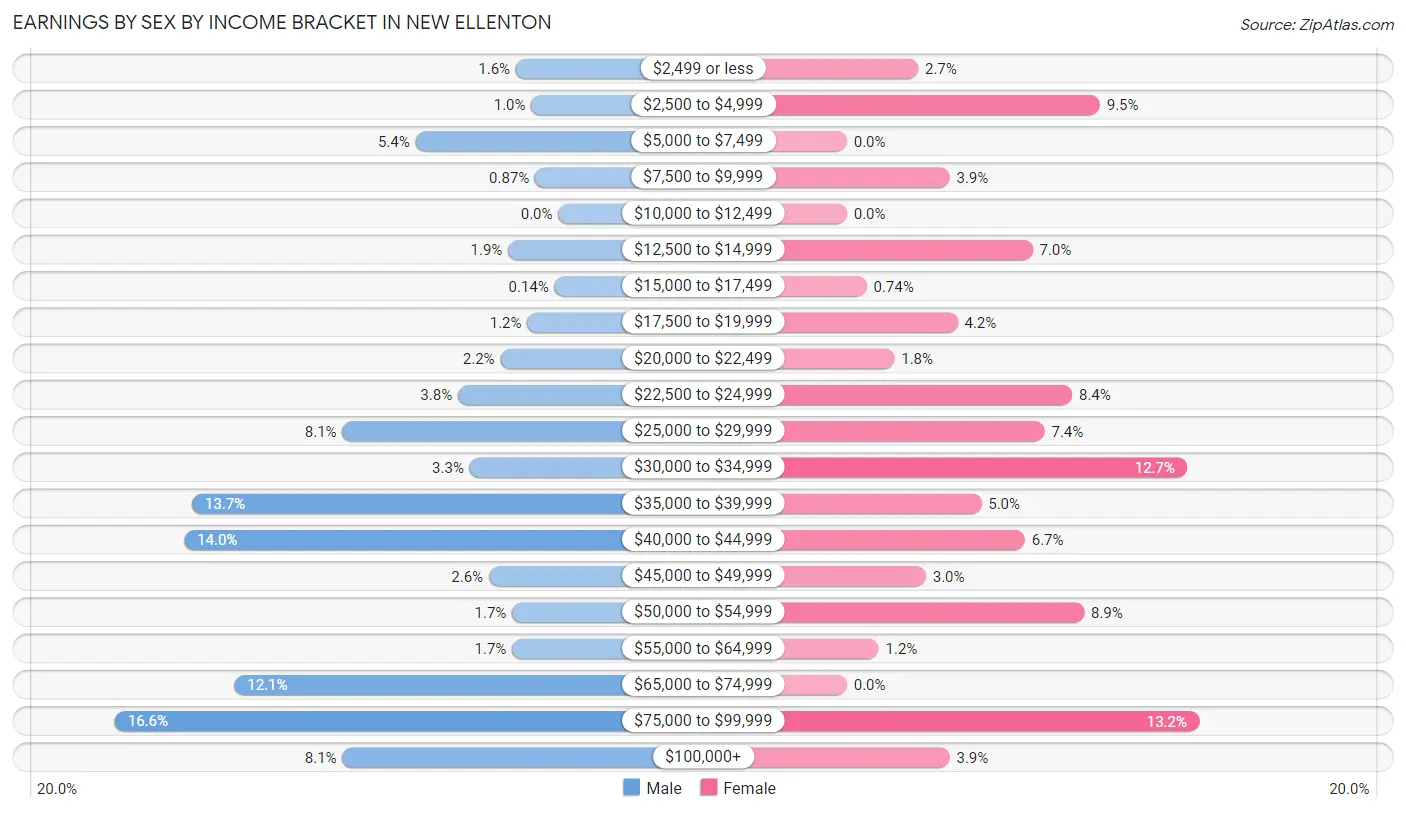
Earnings by Sex by Income Bracket in New Ellenton
The most common earnings brackets in New Ellenton are $75,000 to $99,999 for men (115 | 16.6%) and $75,000 to $99,999 for women (89 | 13.2%).
| Income | Male | Female |
| $2,499 or less | 11 (1.6%) | 18 (2.7%) |
| $2,500 to $4,999 | 7 (1.0%) | 64 (9.5%) |
| $5,000 to $7,499 | 37 (5.3%) | 0 (0.0%) |
| $7,500 to $9,999 | 6 (0.9%) | 26 (3.8%) |
| $10,000 to $12,499 | 0 (0.0%) | 0 (0.0%) |
| $12,500 to $14,999 | 13 (1.9%) | 47 (7.0%) |
| $15,000 to $17,499 | 1 (0.1%) | 5 (0.7%) |
| $17,500 to $19,999 | 8 (1.2%) | 28 (4.2%) |
| $20,000 to $22,499 | 15 (2.2%) | 12 (1.8%) |
| $22,500 to $24,999 | 26 (3.8%) | 57 (8.4%) |
| $25,000 to $29,999 | 56 (8.1%) | 50 (7.4%) |
| $30,000 to $34,999 | 23 (3.3%) | 86 (12.7%) |
| $35,000 to $39,999 | 95 (13.7%) | 34 (5.0%) |
| $40,000 to $44,999 | 97 (14.0%) | 45 (6.7%) |
| $45,000 to $49,999 | 18 (2.6%) | 20 (3.0%) |
| $50,000 to $54,999 | 12 (1.7%) | 60 (8.9%) |
| $55,000 to $64,999 | 12 (1.7%) | 8 (1.2%) |
| $65,000 to $74,999 | 84 (12.1%) | 0 (0.0%) |
| $75,000 to $99,999 | 115 (16.6%) | 89 (13.2%) |
| $100,000+ | 56 (8.1%) | 26 (3.8%) |
| Total | 692 (100.0%) | 675 (100.0%) |
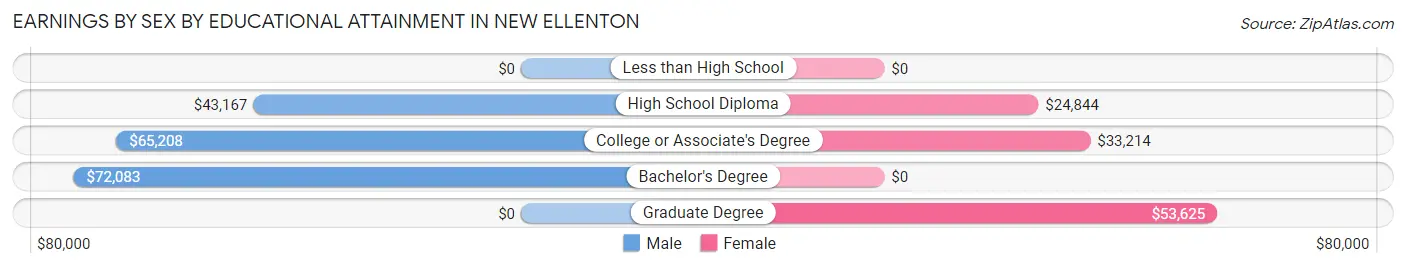
Earnings by Sex by Educational Attainment in New Ellenton
Average earnings in New Ellenton are $44,667 for men and $34,173 for women, a difference of 23.5%. Men with an educational attainment of bachelor's degree enjoy the highest average annual earnings of $72,083, while those with high school diploma education earn the least with $43,167. Women with an educational attainment of graduate degree earn the most with the average annual earnings of $53,625, while those with high school diploma education have the smallest earnings of $24,844.
| Educational Attainment | Male Income | Female Income |
| Less than High School | - | - |
| High School Diploma | $43,167 | $24,844 |
| College or Associate's Degree | $65,208 | $33,214 |
| Bachelor's Degree | $72,083 | $0 |
| Graduate Degree | - | - |
| Total | $44,667 | $34,173 |
Family Income in New Ellenton
Family Income Brackets in New Ellenton
According to the New Ellenton family income data, there are 141 families falling into the $35,000 to $49,999 income range, which is the most common income bracket and makes up 20.7% of all families.
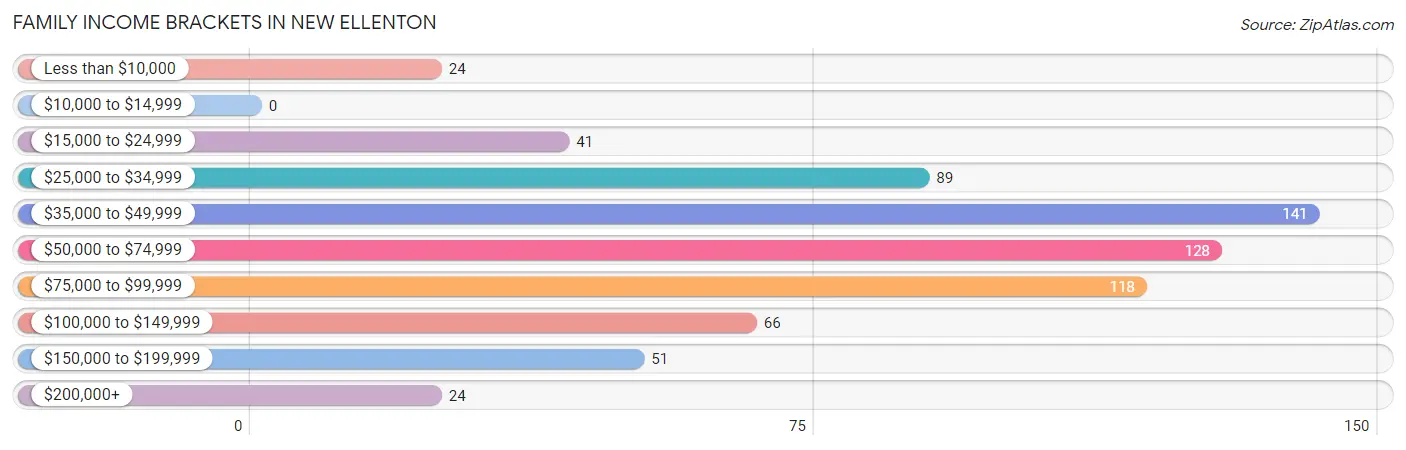
| Income Bracket | # Families | % Families |
| Less than $10,000 | 24 | 3.5% |
| $10,000 to $14,999 | 0 | 0.0% |
| $15,000 to $24,999 | 41 | 6.0% |
| $25,000 to $34,999 | 89 | 13.0% |
| $35,000 to $49,999 | 141 | 20.7% |
| $50,000 to $74,999 | 128 | 18.8% |
| $75,000 to $99,999 | 118 | 17.3% |
| $100,000 to $149,999 | 66 | 9.7% |
| $150,000 to $199,999 | 51 | 7.5% |
| $200,000+ | 24 | 3.5% |
Family Income by Famaliy Size in New Ellenton
5-person families (60 | 8.8%) account for the highest median family income in New Ellenton with $94,052 per family, while 2-person families (426 | 62.5%) have the highest median income of $26,350 per family member.
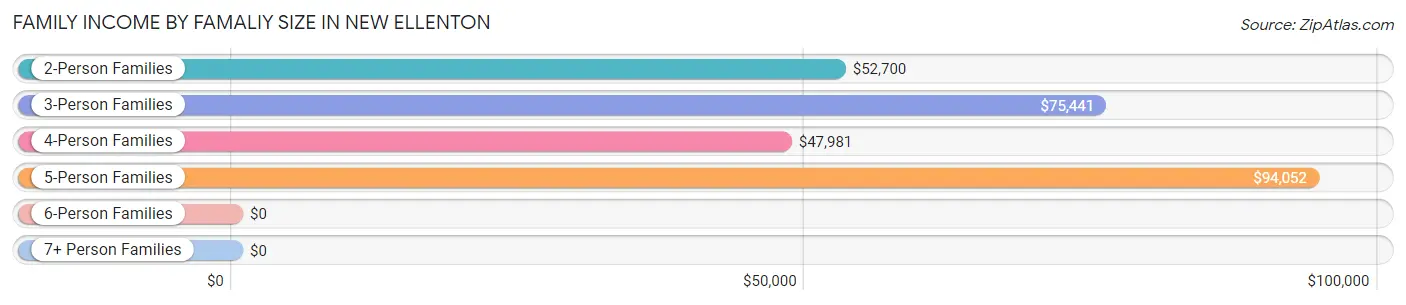
| Income Bracket | # Families | Median Income |
| 2-Person Families | 426 (62.5%) | $52,700 |
| 3-Person Families | 72 (10.6%) | $75,441 |
| 4-Person Families | 107 (15.7%) | $47,981 |
| 5-Person Families | 60 (8.8%) | $94,052 |
| 6-Person Families | 9 (1.3%) | $0 |
| 7+ Person Families | 8 (1.2%) | $0 |
| Total | 682 (100.0%) | $54,500 |
Family Income by Number of Earners in New Ellenton
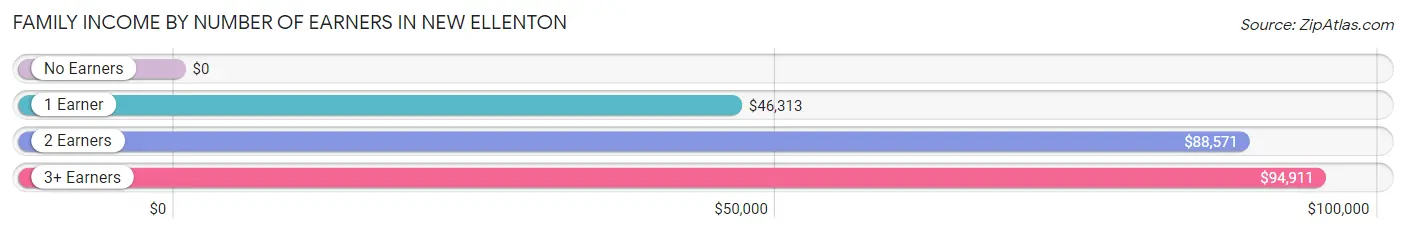
| Number of Earners | # Families | Median Income |
| No Earners | 115 (16.9%) | $0 |
| 1 Earner | 285 (41.8%) | $46,313 |
| 2 Earners | 212 (31.1%) | $88,571 |
| 3+ Earners | 70 (10.3%) | $94,911 |
| Total | 682 (100.0%) | $54,500 |
Household Income in New Ellenton
Household Income Brackets in New Ellenton
With 217 households falling in the category, the $75,000 to $99,999 income range is the most frequent in New Ellenton, accounting for 22.4% of all households. In contrast, only 21 households (2.2%) fall into the $10,000 to $14,999 income bracket, making it the least populous group.
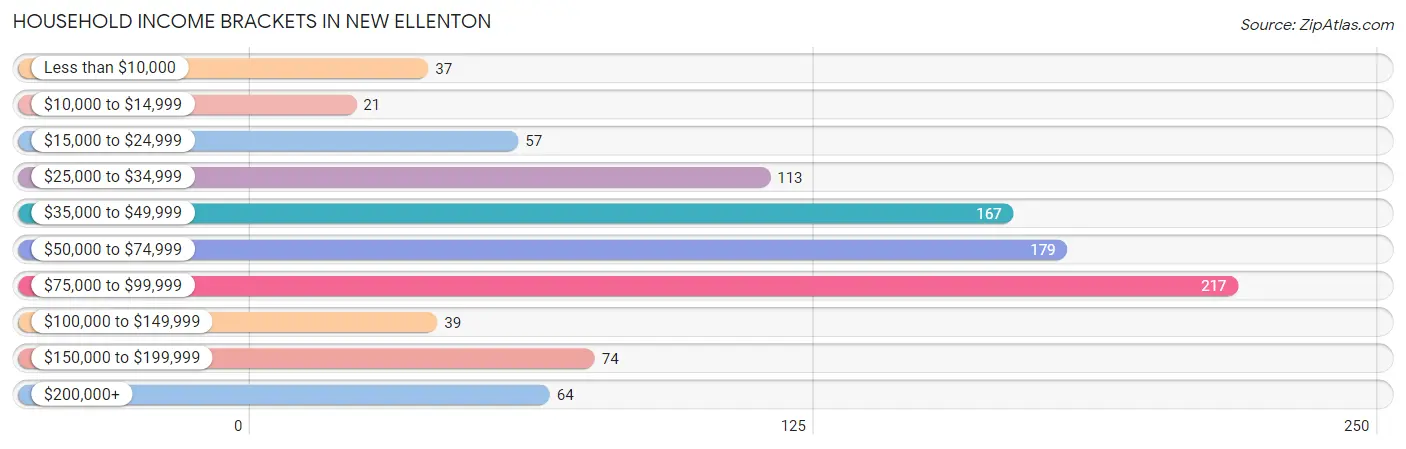
| Income Bracket | # Households | % Households |
| Less than $10,000 | 37 | 3.8% |
| $10,000 to $14,999 | 21 | 2.2% |
| $15,000 to $24,999 | 57 | 5.9% |
| $25,000 to $34,999 | 113 | 11.7% |
| $35,000 to $49,999 | 167 | 17.3% |
| $50,000 to $74,999 | 179 | 18.5% |
| $75,000 to $99,999 | 217 | 22.4% |
| $100,000 to $149,999 | 39 | 4.0% |
| $150,000 to $199,999 | 74 | 7.6% |
| $200,000+ | 64 | 6.6% |
Household Income by Householder Age in New Ellenton
The median household income in New Ellenton is $56,304, with the highest median household income of $82,750 found in the 45 to 64 years age bracket for the primary householder. A total of 231 households (23.9%) fall into this category. Meanwhile, the 15 to 24 years age bracket for the primary householder has the lowest median household income of $0, with 25 households (2.6%) in this group.
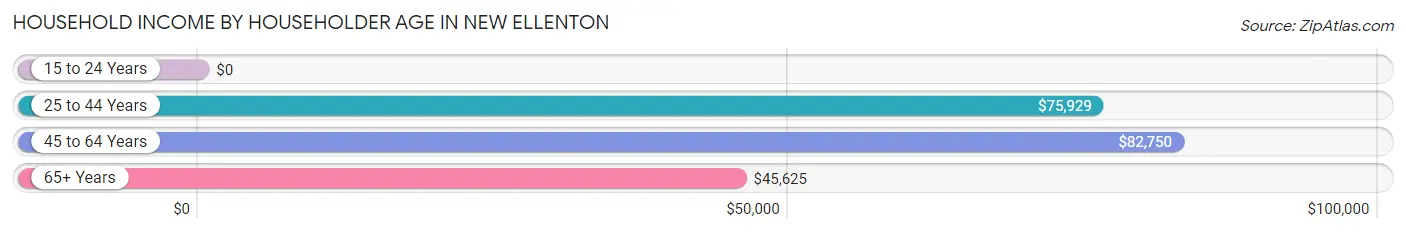
| Income Bracket | # Households | Median Income |
| 15 to 24 Years | 25 (2.6%) | $0 |
| 25 to 44 Years | 394 (40.7%) | $75,929 |
| 45 to 64 Years | 231 (23.9%) | $82,750 |
| 65+ Years | 318 (32.9%) | $45,625 |
| Total | 968 (100.0%) | $56,304 |
Poverty in New Ellenton
Income Below Poverty by Sex and Age in New Ellenton
With 11.6% poverty level for males and 13.9% for females among the residents of New Ellenton, 5 year old males and 18 to 24 year old females are the most vulnerable to poverty, with 20 males (80.0%) and 67 females (65.7%) in their respective age groups living below the poverty level.
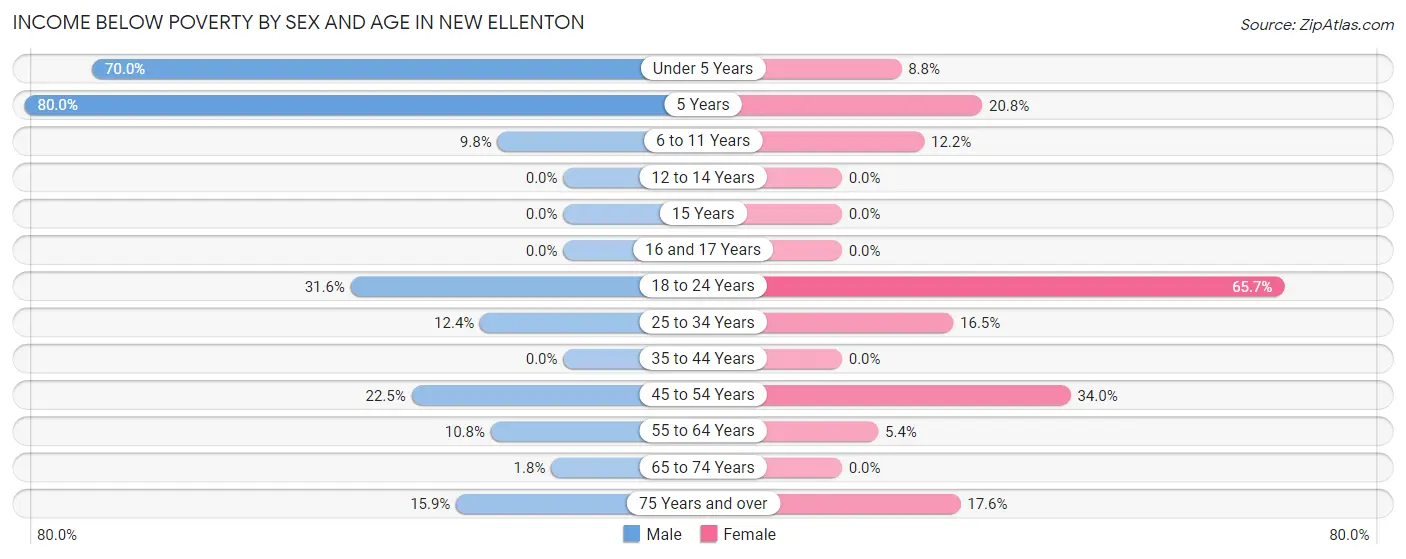
| Age Bracket | Male | Female |
| Under 5 Years | 14 (70.0%) | 6 (8.8%) |
| 5 Years | 20 (80.0%) | 5 (20.8%) |
| 6 to 11 Years | 9 (9.8%) | 21 (12.2%) |
| 12 to 14 Years | 0 (0.0%) | 0 (0.0%) |
| 15 Years | 0 (0.0%) | 0 (0.0%) |
| 16 and 17 Years | 0 (0.0%) | 0 (0.0%) |
| 18 to 24 Years | 36 (31.6%) | 67 (65.7%) |
| 25 to 34 Years | 21 (12.3%) | 39 (16.5%) |
| 35 to 44 Years | 0 (0.0%) | 0 (0.0%) |
| 45 to 54 Years | 16 (22.5%) | 18 (34.0%) |
| 55 to 64 Years | 11 (10.8%) | 9 (5.4%) |
| 65 to 74 Years | 3 (1.8%) | 0 (0.0%) |
| 75 Years and over | 7 (15.9%) | 19 (17.6%) |
| Total | 137 (11.6%) | 184 (13.9%) |
Income Above Poverty by Sex and Age in New Ellenton
According to the poverty statistics in New Ellenton, males aged 12 to 14 years and females aged 12 to 14 years are the age groups that are most secure financially, with 100.0% of males and 100.0% of females in these age groups living above the poverty line.
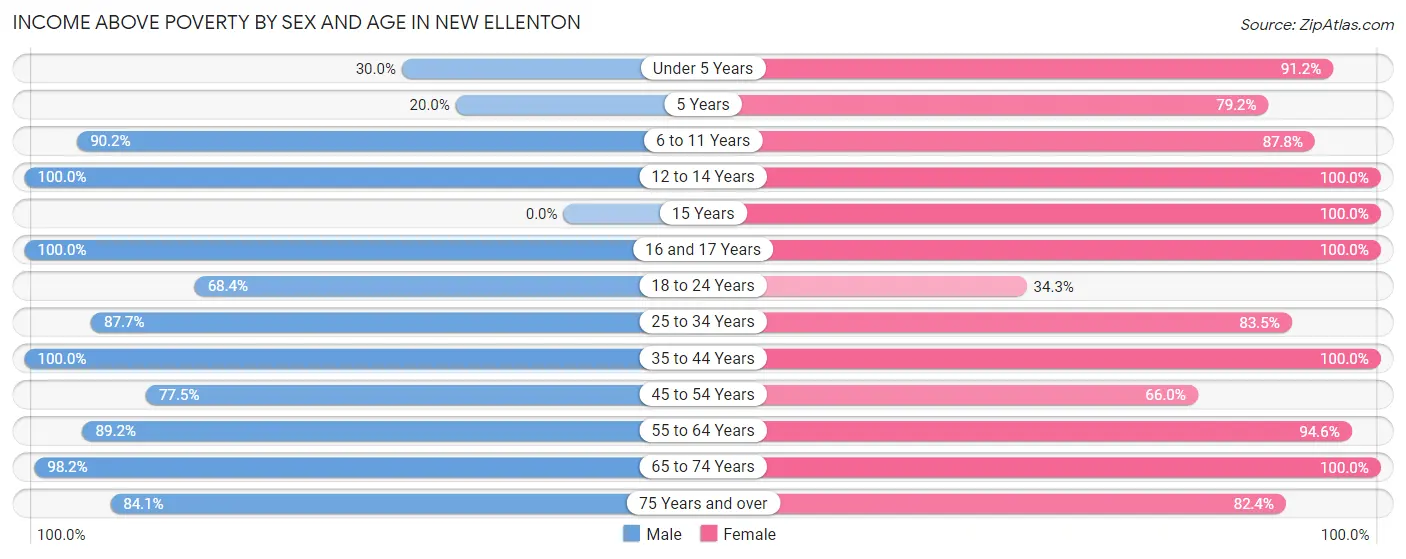
| Age Bracket | Male | Female |
| Under 5 Years | 6 (30.0%) | 62 (91.2%) |
| 5 Years | 5 (20.0%) | 19 (79.2%) |
| 6 to 11 Years | 83 (90.2%) | 151 (87.8%) |
| 12 to 14 Years | 19 (100.0%) | 5 (100.0%) |
| 15 Years | 0 (0.0%) | 17 (100.0%) |
| 16 and 17 Years | 84 (100.0%) | 11 (100.0%) |
| 18 to 24 Years | 78 (68.4%) | 35 (34.3%) |
| 25 to 34 Years | 149 (87.6%) | 197 (83.5%) |
| 35 to 44 Years | 277 (100.0%) | 213 (100.0%) |
| 45 to 54 Years | 55 (77.5%) | 35 (66.0%) |
| 55 to 64 Years | 91 (89.2%) | 158 (94.6%) |
| 65 to 74 Years | 164 (98.2%) | 147 (100.0%) |
| 75 Years and over | 37 (84.1%) | 89 (82.4%) |
| Total | 1,048 (88.4%) | 1,139 (86.1%) |
Income Below Poverty Among Married-Couple Families in New Ellenton
The poverty statistics for married-couple families in New Ellenton show that 1.6% or 5 of the total 313 families live below the poverty line. Families with 1 or 2 children have the highest poverty rate of 7.6%, comprising of 5 families. On the other hand, families with no children have the lowest poverty rate of 0.0%, which includes 0 families.
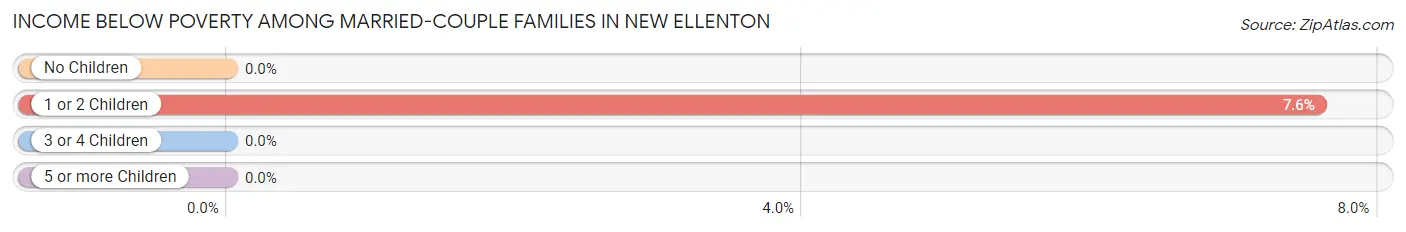
| Children | Above Poverty | Below Poverty |
| No Children | 223 (100.0%) | 0 (0.0%) |
| 1 or 2 Children | 61 (92.4%) | 5 (7.6%) |
| 3 or 4 Children | 24 (100.0%) | 0 (0.0%) |
| 5 or more Children | 0 (0.0%) | 0 (0.0%) |
| Total | 308 (98.4%) | 5 (1.6%) |
Income Below Poverty Among Single-Parent Households in New Ellenton
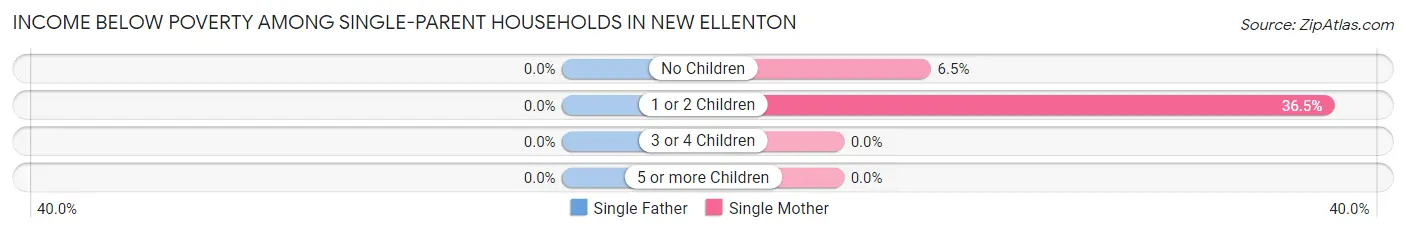
| Children | Single Father | Single Mother |
| No Children | 0 (0.0%) | 7 (6.5%) |
| 1 or 2 Children | 0 (0.0%) | 61 (36.5%) |
| 3 or 4 Children | 0 (0.0%) | 0 (0.0%) |
| 5 or more Children | 0 (0.0%) | 0 (0.0%) |
| Total | 0 (0.0%) | 68 (24.1%) |
Income Below Poverty Among Married-Couple vs Single-Parent Households in New Ellenton
The poverty data for New Ellenton shows that 5 of the married-couple family households (1.6%) and 68 of the single-parent households (18.4%) are living below the poverty level. Within the married-couple family households, those with 1 or 2 children have the highest poverty rate, with 5 households (7.6%) falling below the poverty line. Among the single-parent households, those with 1 or 2 children have the highest poverty rate, with 61 household (34.5%) living below poverty.
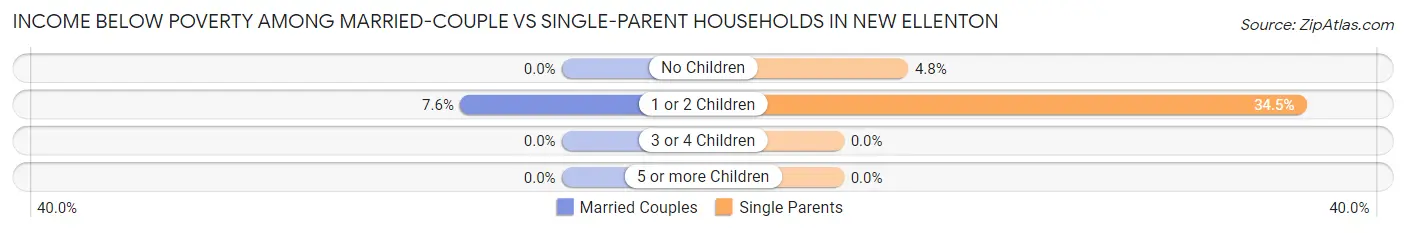
| Children | Married-Couple Families | Single-Parent Households |
| No Children | 0 (0.0%) | 7 (4.8%) |
| 1 or 2 Children | 5 (7.6%) | 61 (34.5%) |
| 3 or 4 Children | 0 (0.0%) | 0 (0.0%) |
| 5 or more Children | 0 (0.0%) | 0 (0.0%) |
| Total | 5 (1.6%) | 68 (18.4%) |
Race in New Ellenton
The most populous races in New Ellenton are Black / African American (1,212 | 48.3%), White / Caucasian (1,131 | 45.1%), and Some other Race (117 | 4.7%).
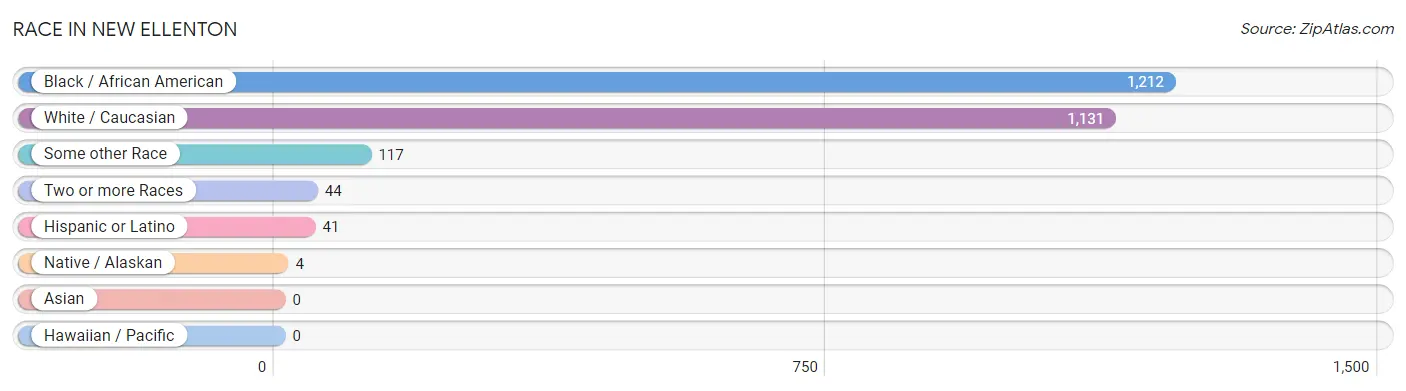
| Race | # Population | % Population |
| Asian | 0 | 0.0% |
| Black / African American | 1,212 | 48.3% |
| Hawaiian / Pacific | 0 | 0.0% |
| Hispanic or Latino | 41 | 1.6% |
| Native / Alaskan | 4 | 0.2% |
| White / Caucasian | 1,131 | 45.1% |
| Two or more Races | 44 | 1.8% |
| Some other Race | 117 | 4.7% |
| Total | 2,508 | 100.0% |
Ancestry in New Ellenton
The most populous ancestries reported in New Ellenton are American (627 | 25.0%), English (282 | 11.2%), German (202 | 8.1%), Irish (146 | 5.8%), and Arab (117 | 4.7%), together accounting for 54.8% of all New Ellenton residents.
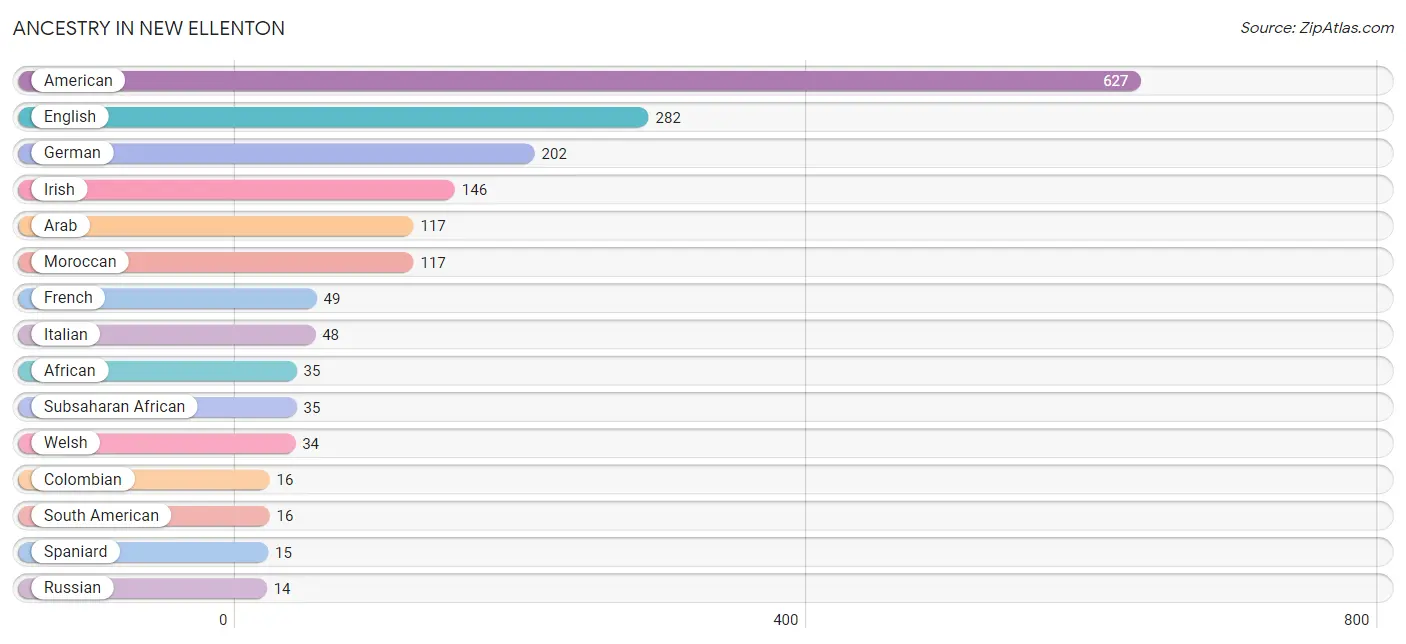
| Ancestry | # Population | % Population |
| African | 35 | 1.4% |
| American | 627 | 25.0% |
| Arab | 117 | 4.7% |
| British | 3 | 0.1% |
| Colombian | 16 | 0.6% |
| Dutch | 3 | 0.1% |
| English | 282 | 11.2% |
| European | 11 | 0.4% |
| French | 49 | 1.9% |
| French American Indian | 6 | 0.2% |
| German | 202 | 8.1% |
| Hungarian | 2 | 0.1% |
| Irish | 146 | 5.8% |
| Italian | 48 | 1.9% |
| Lumbee | 4 | 0.2% |
| Mexican | 5 | 0.2% |
| Moroccan | 117 | 4.7% |
| Polish | 11 | 0.4% |
| Russian | 14 | 0.6% |
| Scotch-Irish | 13 | 0.5% |
| Scottish | 6 | 0.2% |
| South American | 16 | 0.6% |
| Spaniard | 15 | 0.6% |
| Spanish | 5 | 0.2% |
| Subsaharan African | 35 | 1.4% |
| Swedish | 13 | 0.5% |
| Welsh | 34 | 1.4% | View All 27 Rows |
Immigrants in New Ellenton
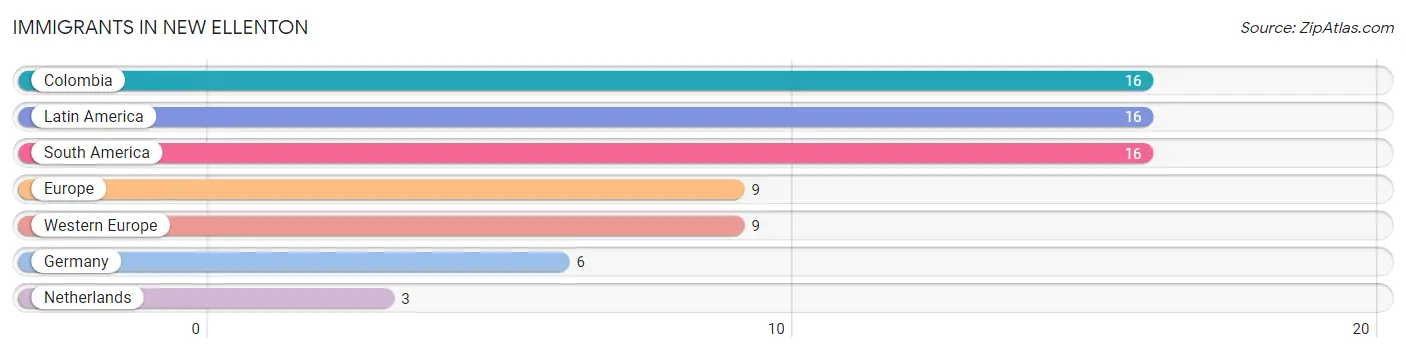
The most numerous immigrant groups reported in New Ellenton came from Colombia (16 | 0.6%), Latin America (16 | 0.6%), South America (16 | 0.6%), Europe (9 | 0.4%), and Western Europe (9 | 0.4%), together accounting for 2.6% of all New Ellenton residents.
| Immigration Origin | # Population | % Population |
| Colombia | 16 | 0.6% |
| Europe | 9 | 0.4% |
| Germany | 6 | 0.2% |
| Latin America | 16 | 0.6% |
| Netherlands | 3 | 0.1% |
| South America | 16 | 0.6% |
| Western Europe | 9 | 0.4% | View All 7 Rows |
Sex and Age in New Ellenton
Sex and Age in New Ellenton
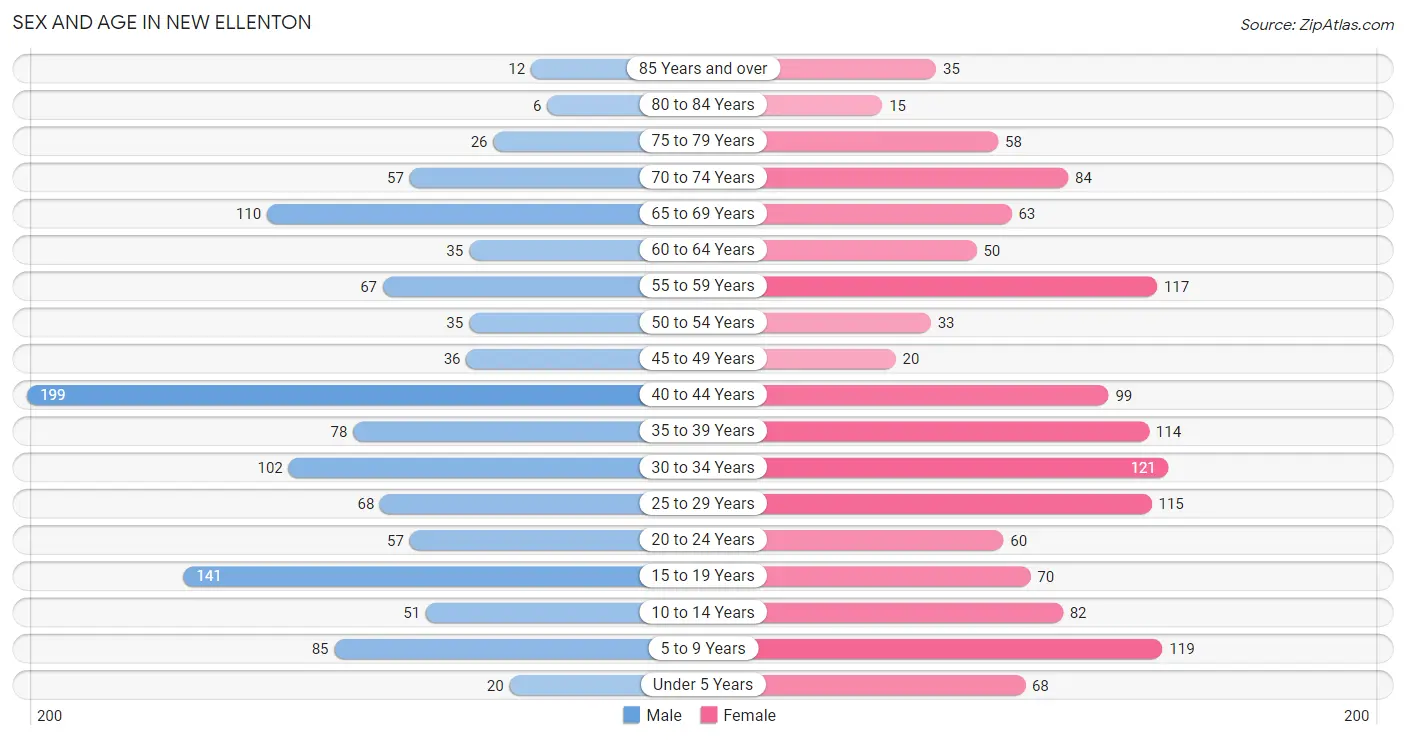
The most populous age groups in New Ellenton are 40 to 44 Years (199 | 16.8%) for men and 30 to 34 Years (121 | 9.1%) for women.
| Age Bracket | Male | Female |
| Under 5 Years | 20 (1.7%) | 68 (5.1%) |
| 5 to 9 Years | 85 (7.2%) | 119 (9.0%) |
| 10 to 14 Years | 51 (4.3%) | 82 (6.2%) |
| 15 to 19 Years | 141 (11.9%) | 70 (5.3%) |
| 20 to 24 Years | 57 (4.8%) | 60 (4.5%) |
| 25 to 29 Years | 68 (5.7%) | 115 (8.7%) |
| 30 to 34 Years | 102 (8.6%) | 121 (9.1%) |
| 35 to 39 Years | 78 (6.6%) | 114 (8.6%) |
| 40 to 44 Years | 199 (16.8%) | 99 (7.5%) |
| 45 to 49 Years | 36 (3.0%) | 20 (1.5%) |
| 50 to 54 Years | 35 (2.9%) | 33 (2.5%) |
| 55 to 59 Years | 67 (5.7%) | 117 (8.8%) |
| 60 to 64 Years | 35 (2.9%) | 50 (3.8%) |
| 65 to 69 Years | 110 (9.3%) | 63 (4.8%) |
| 70 to 74 Years | 57 (4.8%) | 84 (6.4%) |
| 75 to 79 Years | 26 (2.2%) | 58 (4.4%) |
| 80 to 84 Years | 6 (0.5%) | 15 (1.1%) |
| 85 Years and over | 12 (1.0%) | 35 (2.6%) |
| Total | 1,185 (100.0%) | 1,323 (100.0%) |
Families and Households in New Ellenton
Median Family Size in New Ellenton
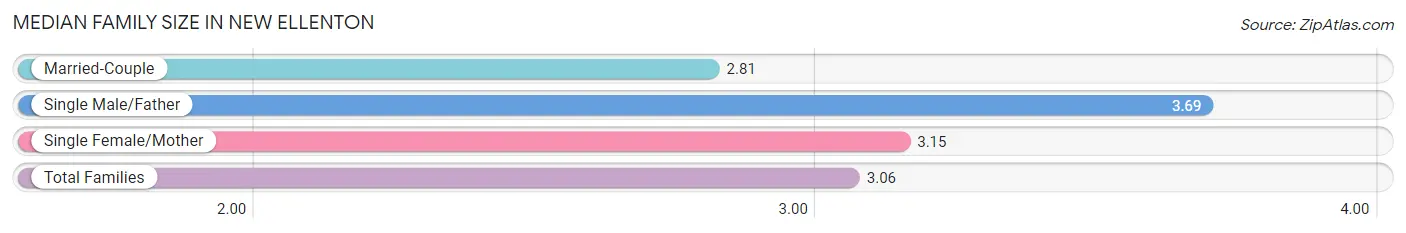
The median family size in New Ellenton is 3.06 persons per family, with single male/father families (87 | 12.8%) accounting for the largest median family size of 3.69 persons per family. On the other hand, married-couple families (313 | 45.9%) represent the smallest median family size with 2.81 persons per family.
| Family Type | # Families | Family Size |
| Married-Couple | 313 (45.9%) | 2.81 |
| Single Male/Father | 87 (12.8%) | 3.69 |
| Single Female/Mother | 282 (41.3%) | 3.15 |
| Total Families | 682 (100.0%) | 3.06 |
Median Household Size in New Ellenton
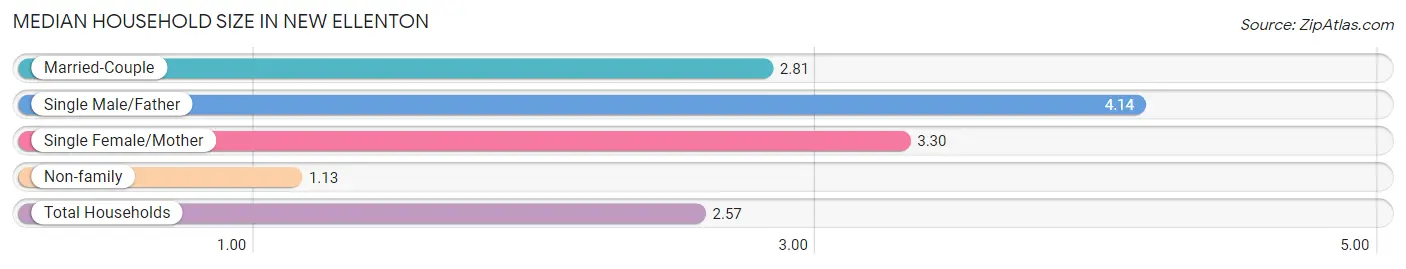
The median household size in New Ellenton is 2.57 persons per household, with single male/father households (87 | 9.0%) accounting for the largest median household size of 4.14 persons per household. non-family households (286 | 29.5%) represent the smallest median household size with 1.13 persons per household.
| Household Type | # Households | Household Size |
| Married-Couple | 313 (32.3%) | 2.81 |
| Single Male/Father | 87 (9.0%) | 4.14 |
| Single Female/Mother | 282 (29.1%) | 3.30 |
| Non-family | 286 (29.5%) | 1.13 |
| Total Households | 968 (100.0%) | 2.57 |
Household Size by Marriage Status in New Ellenton
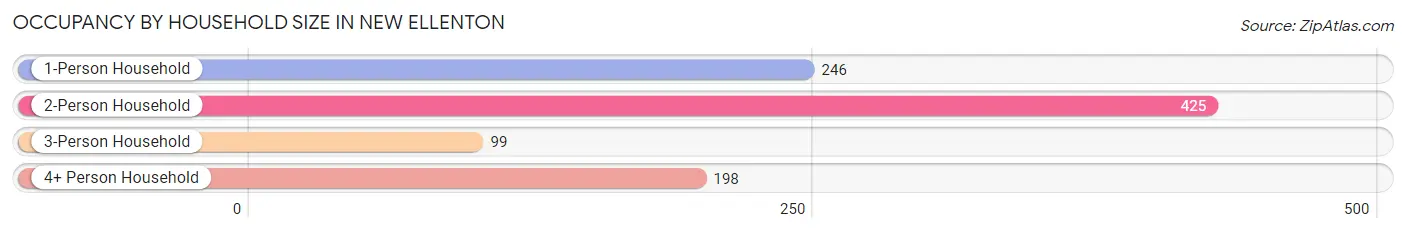
Out of a total of 968 households in New Ellenton, 682 (70.5%) are family households, while 286 (29.5%) are nonfamily households. The most numerous type of family households are 2-person households, comprising 385, and the most common type of nonfamily households are 1-person households, comprising 246.
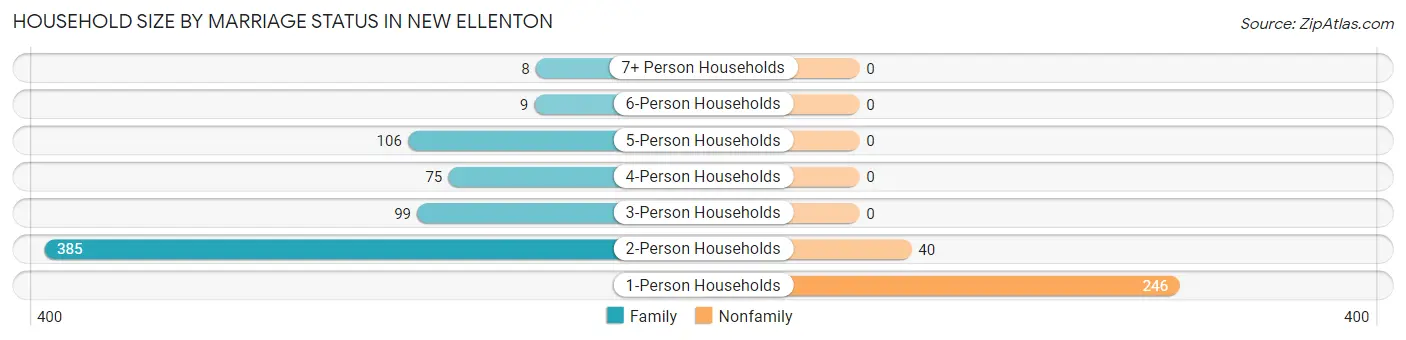
| Household Size | Family Households | Nonfamily Households |
| 1-Person Households | - | 246 (25.4%) |
| 2-Person Households | 385 (39.8%) | 40 (4.1%) |
| 3-Person Households | 99 (10.2%) | 0 (0.0%) |
| 4-Person Households | 75 (7.7%) | 0 (0.0%) |
| 5-Person Households | 106 (11.0%) | 0 (0.0%) |
| 6-Person Households | 9 (0.9%) | 0 (0.0%) |
| 7+ Person Households | 8 (0.8%) | 0 (0.0%) |
| Total | 682 (70.5%) | 286 (29.5%) |
Female Fertility in New Ellenton
Fertility by Age in New Ellenton
| Age Bracket | Women with Births | Births / 1,000 Women |
| 15 to 19 years | 0 (0.0%) | 0.0 |
| 20 to 34 years | 0 (0.0%) | 0.0 |
| 35 to 50 years | 0 (0.0%) | 0.0 |
| Total | 0 (0.0%) | 0.0 |
Fertility by Age by Marriage Status in New Ellenton
| Age Bracket | Married | Unmarried |
| 15 to 19 years | 0 (0.0%) | 0 (0.0%) |
| 20 to 34 years | 0 (0.0%) | 0 (0.0%) |
| 35 to 50 years | 0 (0.0%) | 0 (0.0%) |
| Total | 0 (0.0%) | 0 (0.0%) |
Fertility by Education in New Ellenton
| Educational Attainment | Women with Births | Births / 1,000 Women |
| Less than High School | 0 (0.0%) | 0.0 |
| High School Diploma | 0 (0.0%) | 0.0 |
| College or Associate's Degree | 0 (0.0%) | 0.0 |
| Bachelor's Degree | 0 (0.0%) | 0.0 |
| Graduate Degree | 0 (0.0%) | 0.0 |
| Total | 0 (0.0%) | 0.0 |
Fertility by Education by Marriage Status in New Ellenton
| Educational Attainment | Married | Unmarried |
| Less than High School | 0 (0.0%) | 0 (0.0%) |
| High School Diploma | 0 (0.0%) | 0 (0.0%) |
| College or Associate's Degree | 0 (0.0%) | 0 (0.0%) |
| Bachelor's Degree | 0 (0.0%) | 0 (0.0%) |
| Graduate Degree | 0 (0.0%) | 0 (0.0%) |
| Total | 0 (0.0%) | 0 (0.0%) |
Employment Characteristics in New Ellenton
Employment by Class of Employer in New Ellenton
Among the 1,245 employed individuals in New Ellenton, private company employees (812 | 65.2%), local government employees (155 | 12.4%), and federal government employees (141 | 11.3%) make up the most common classes of employment.
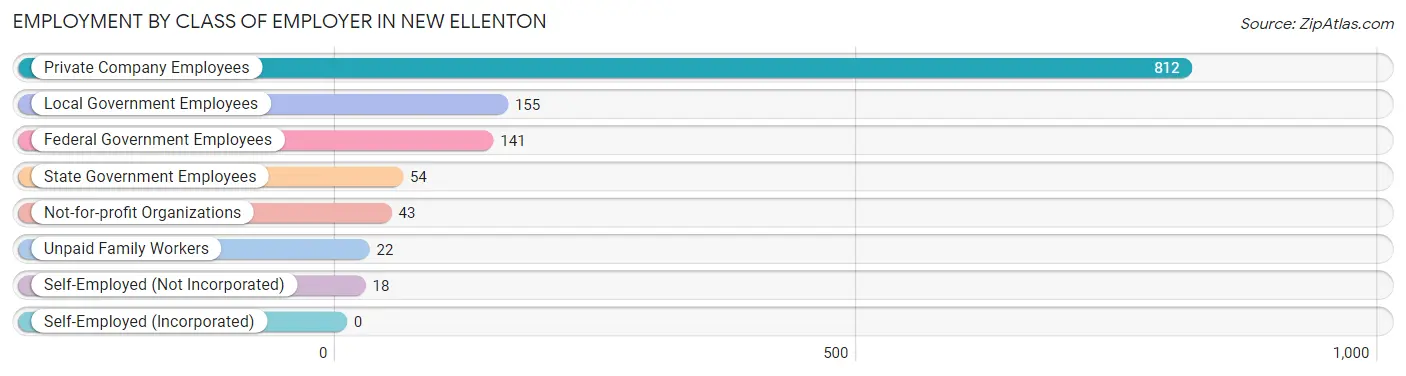
| Employer Class | # Employees | % Employees |
| Private Company Employees | 812 | 65.2% |
| Self-Employed (Incorporated) | 0 | 0.0% |
| Self-Employed (Not Incorporated) | 18 | 1.5% |
| Not-for-profit Organizations | 43 | 3.5% |
| Local Government Employees | 155 | 12.4% |
| State Government Employees | 54 | 4.3% |
| Federal Government Employees | 141 | 11.3% |
| Unpaid Family Workers | 22 | 1.8% |
| Total | 1,245 | 100.0% |
Employment Status by Age in New Ellenton
According to the labor force statistics for New Ellenton, out of the total population over 16 years of age (2,066), 63.9% or 1,320 individuals are in the labor force, with 4.2% or 55 of them unemployed. The age group with the highest labor force participation rate is 30 to 34 years, with 100.0% or 223 individuals in the labor force. Within the labor force, the 20 to 24 years age range has the highest percentage of unemployed individuals, with 35.6% or 26 of them being unemployed.
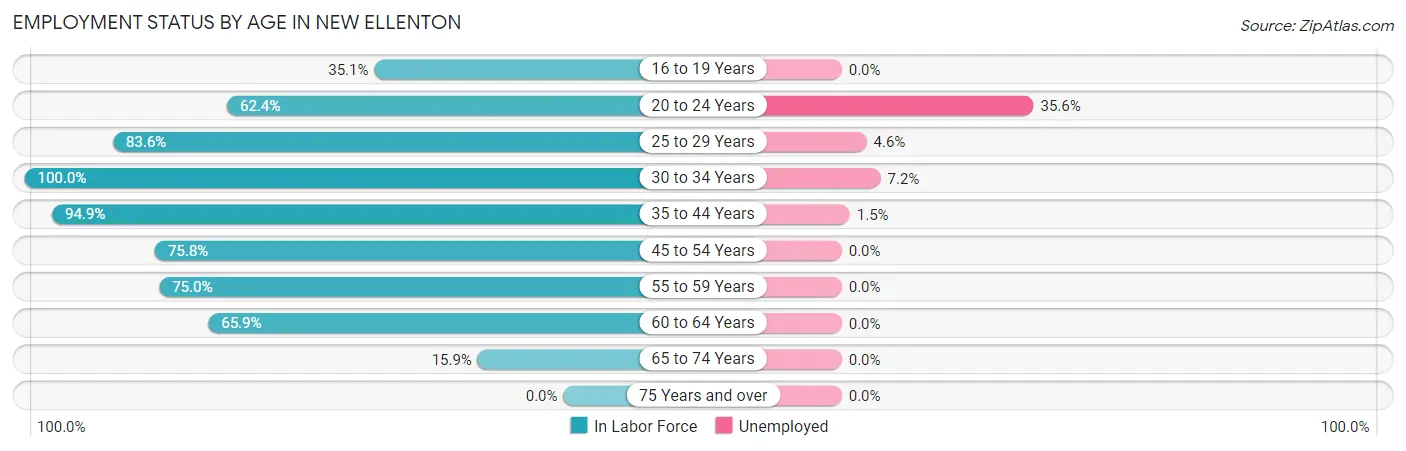
| Age Bracket | In Labor Force | Unemployed |
| 16 to 19 Years | 68 (35.1%) | 0 (0.0%) |
| 20 to 24 Years | 73 (62.4%) | 26 (35.6%) |
| 25 to 29 Years | 153 (83.6%) | 7 (4.6%) |
| 30 to 34 Years | 223 (100.0%) | 16 (7.2%) |
| 35 to 44 Years | 465 (94.9%) | 7 (1.5%) |
| 45 to 54 Years | 94 (75.8%) | 0 (0.0%) |
| 55 to 59 Years | 138 (75.0%) | 0 (0.0%) |
| 60 to 64 Years | 56 (65.9%) | 0 (0.0%) |
| 65 to 74 Years | 50 (15.9%) | 0 (0.0%) |
| 75 Years and over | 0 (0.0%) | 0 (0.0%) |
| Total | 1,320 (63.9%) | 55 (4.2%) |
Employment Status by Educational Attainment in New Ellenton
According to labor force statistics for New Ellenton, 87.6% of individuals (1,129) out of the total population between 25 and 64 years of age (1,289) are in the labor force, with 2.7% or 30 of them being unemployed. The group with the highest labor force participation rate are those with the educational attainment of bachelor's degree or higher, with 96.0% or 339 individuals in the labor force. Within the labor force, individuals with less than high school education have the highest percentage of unemployment, with 25.6% or 11 of them being unemployed.
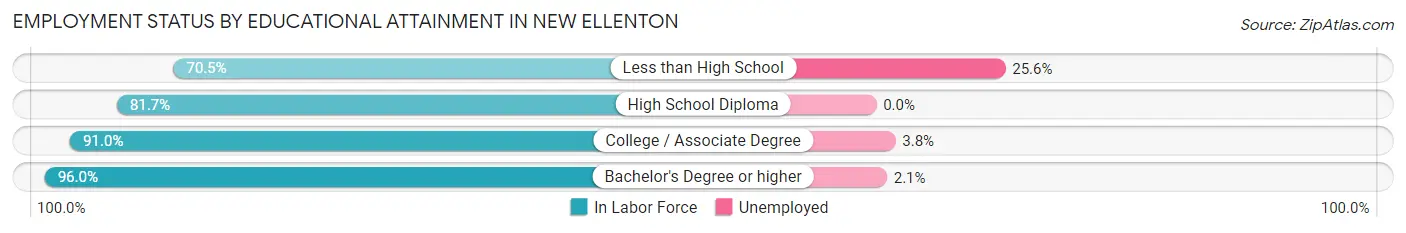
| Educational Attainment | In Labor Force | Unemployed |
| Less than High School | 43 (70.5%) | 16 (25.6%) |
| High School Diploma | 432 (81.7%) | 0 (0.0%) |
| College / Associate Degree | 315 (91.0%) | 13 (3.8%) |
| Bachelor's Degree or higher | 339 (96.0%) | 7 (2.1%) |
| Total | 1,129 (87.6%) | 35 (2.7%) |
Employment Occupations by Sex in New Ellenton
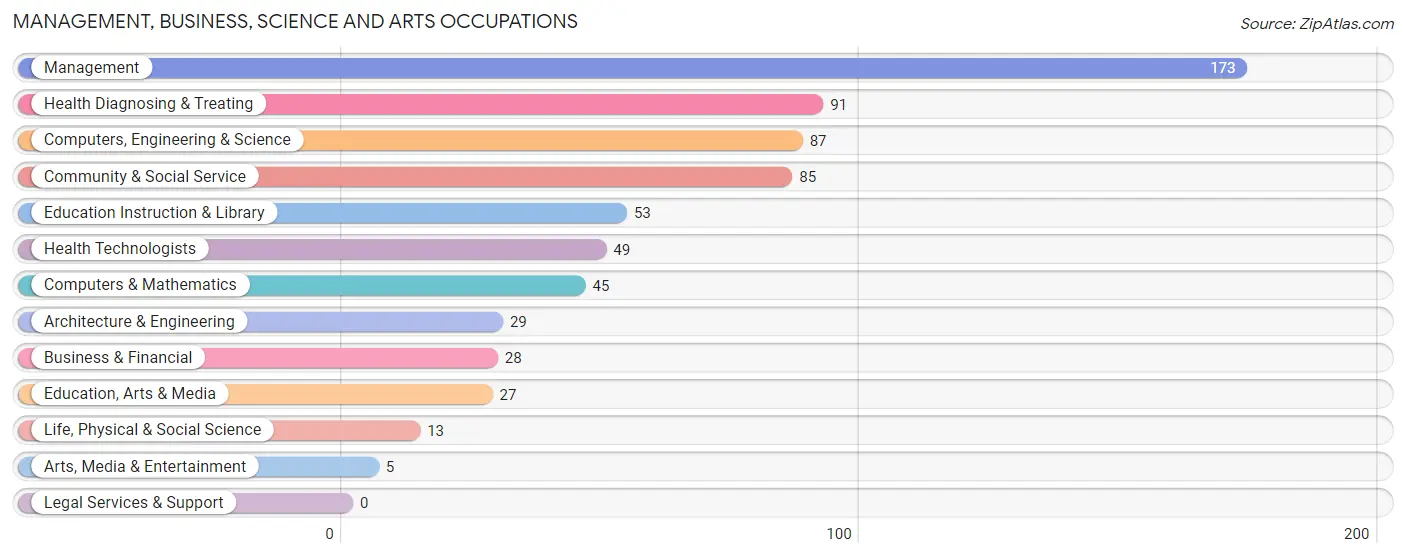
Management, Business, Science and Arts Occupations
The most common Management, Business, Science and Arts occupations in New Ellenton are Management (173 | 13.7%), Health Diagnosing & Treating (91 | 7.2%), Computers, Engineering & Science (87 | 6.9%), Community & Social Service (85 | 6.7%), and Education Instruction & Library (53 | 4.2%).
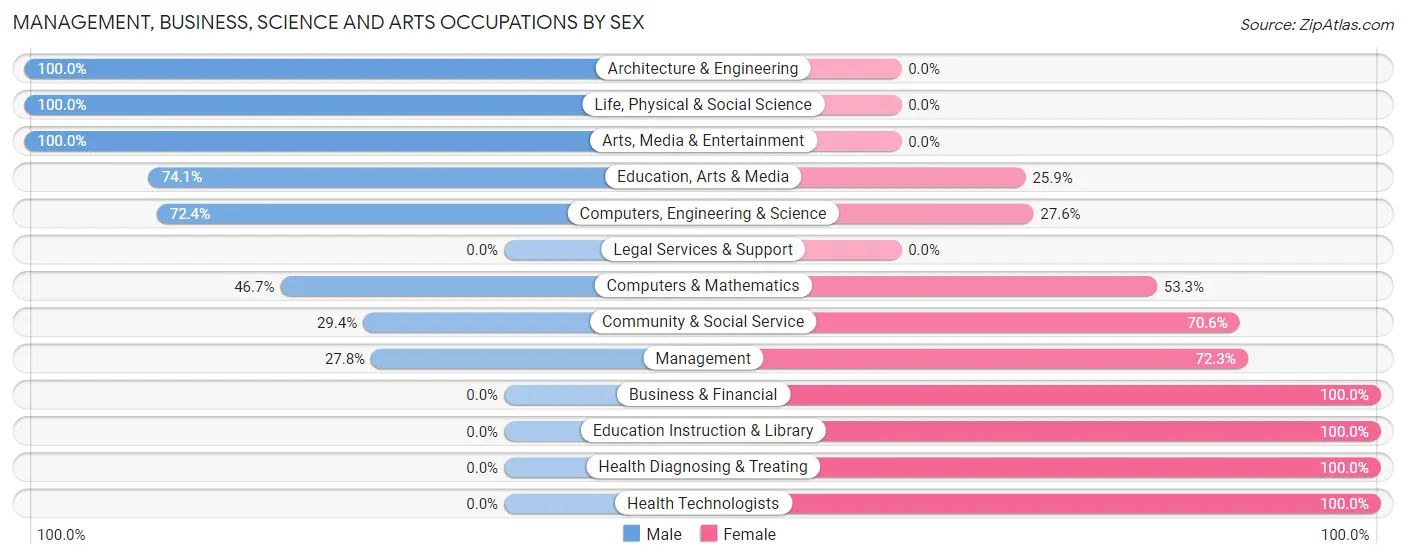
Management, Business, Science and Arts Occupations by Sex
Within the Management, Business, Science and Arts occupations in New Ellenton, the most male-oriented occupations are Architecture & Engineering (100.0%), Life, Physical & Social Science (100.0%), and Arts, Media & Entertainment (100.0%), while the most female-oriented occupations are Business & Financial (100.0%), Education Instruction & Library (100.0%), and Health Diagnosing & Treating (100.0%).
| Occupation | Male | Female |
| Management | 48 (27.8%) | 125 (72.3%) |
| Business & Financial | 0 (0.0%) | 28 (100.0%) |
| Computers, Engineering & Science | 63 (72.4%) | 24 (27.6%) |
| Computers & Mathematics | 21 (46.7%) | 24 (53.3%) |
| Architecture & Engineering | 29 (100.0%) | 0 (0.0%) |
| Life, Physical & Social Science | 13 (100.0%) | 0 (0.0%) |
| Community & Social Service | 25 (29.4%) | 60 (70.6%) |
| Education, Arts & Media | 20 (74.1%) | 7 (25.9%) |
| Legal Services & Support | 0 (0.0%) | 0 (0.0%) |
| Education Instruction & Library | 0 (0.0%) | 53 (100.0%) |
| Arts, Media & Entertainment | 5 (100.0%) | 0 (0.0%) |
| Health Diagnosing & Treating | 0 (0.0%) | 91 (100.0%) |
| Health Technologists | 0 (0.0%) | 49 (100.0%) |
| Total (Category) | 136 (29.3%) | 328 (70.7%) |
| Total (Overall) | 643 (50.9%) | 621 (49.1%) |
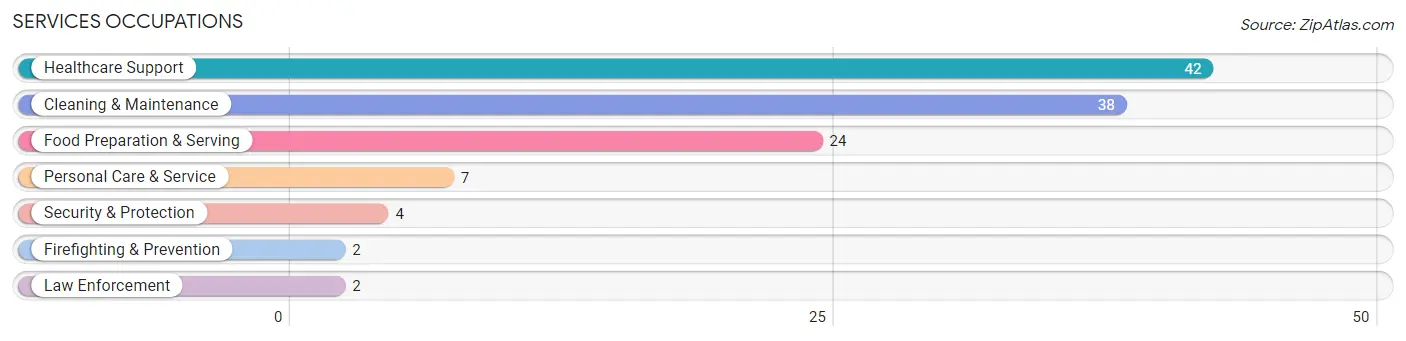
Services Occupations
The most common Services occupations in New Ellenton are Healthcare Support (42 | 3.3%), Cleaning & Maintenance (38 | 3.0%), Food Preparation & Serving (24 | 1.9%), Personal Care & Service (7 | 0.5%), and Security & Protection (4 | 0.3%).
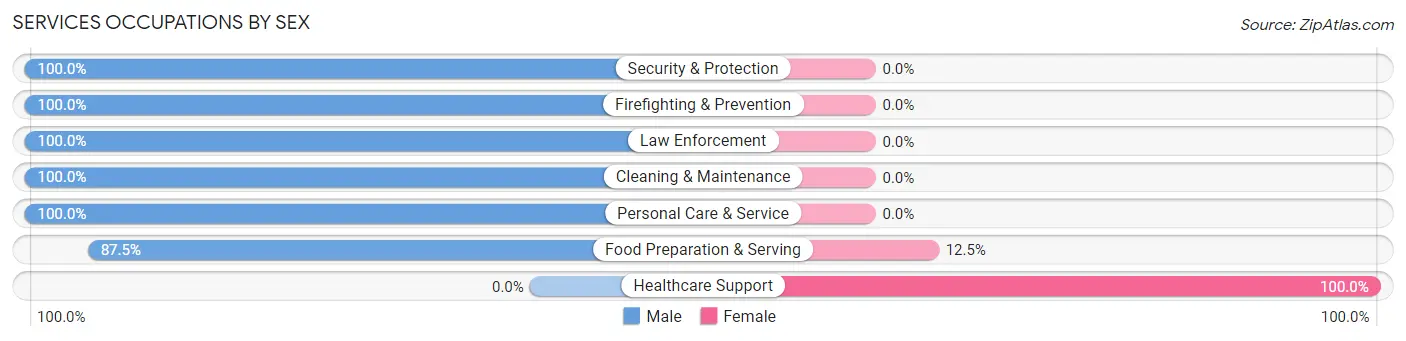
Services Occupations by Sex
Within the Services occupations in New Ellenton, the most male-oriented occupations are Security & Protection (100.0%), Firefighting & Prevention (100.0%), and Law Enforcement (100.0%), while the most female-oriented occupations are Healthcare Support (100.0%), and Food Preparation & Serving (12.5%).
| Occupation | Male | Female |
| Healthcare Support | 0 (0.0%) | 42 (100.0%) |
| Security & Protection | 4 (100.0%) | 0 (0.0%) |
| Firefighting & Prevention | 2 (100.0%) | 0 (0.0%) |
| Law Enforcement | 2 (100.0%) | 0 (0.0%) |
| Food Preparation & Serving | 21 (87.5%) | 3 (12.5%) |
| Cleaning & Maintenance | 38 (100.0%) | 0 (0.0%) |
| Personal Care & Service | 7 (100.0%) | 0 (0.0%) |
| Total (Category) | 70 (60.9%) | 45 (39.1%) |
| Total (Overall) | 643 (50.9%) | 621 (49.1%) |
Sales and Office Occupations
The most common Sales and Office occupations in New Ellenton are Sales & Related (127 | 10.1%), and Office & Administration (126 | 10.0%).
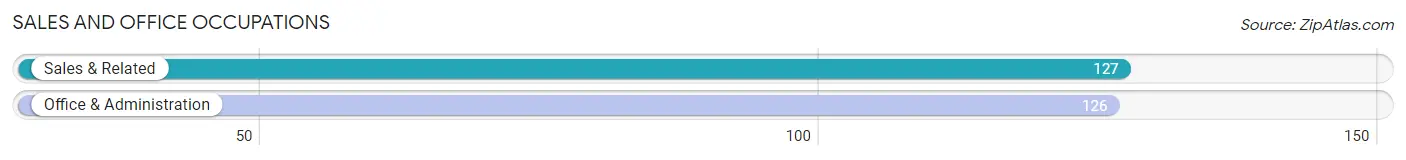
Sales and Office Occupations by Sex
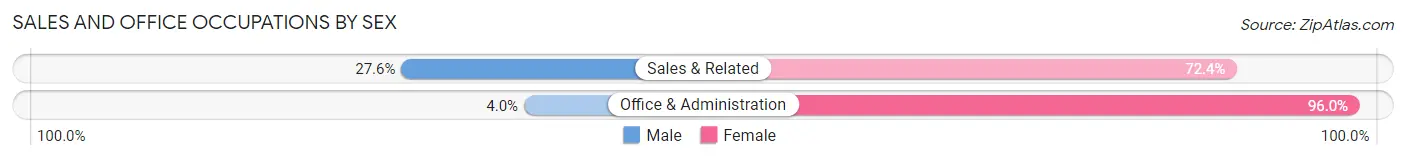
| Occupation | Male | Female |
| Sales & Related | 35 (27.6%) | 92 (72.4%) |
| Office & Administration | 5 (4.0%) | 121 (96.0%) |
| Total (Category) | 40 (15.8%) | 213 (84.2%) |
| Total (Overall) | 643 (50.9%) | 621 (49.1%) |
Natural Resources, Construction and Maintenance Occupations
The most common Natural Resources, Construction and Maintenance occupations in New Ellenton are Installation, Maintenance & Repair (79 | 6.2%), and Construction & Extraction (42 | 3.3%).
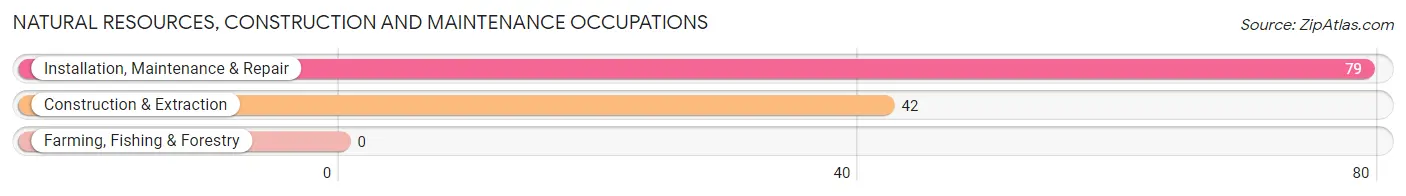
Natural Resources, Construction and Maintenance Occupations by Sex
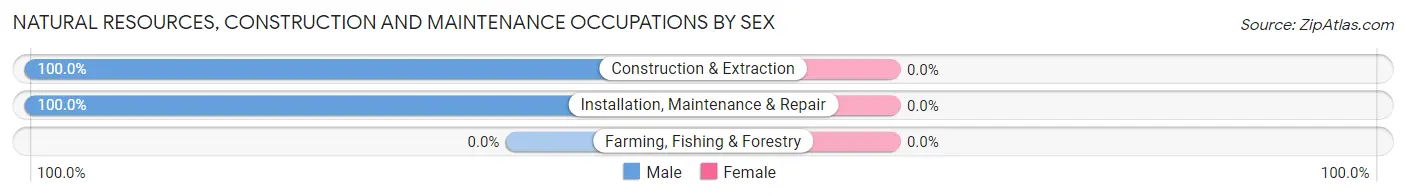
| Occupation | Male | Female |
| Farming, Fishing & Forestry | 0 (0.0%) | 0 (0.0%) |
| Construction & Extraction | 42 (100.0%) | 0 (0.0%) |
| Installation, Maintenance & Repair | 79 (100.0%) | 0 (0.0%) |
| Total (Category) | 121 (100.0%) | 0 (0.0%) |
| Total (Overall) | 643 (50.9%) | 621 (49.1%) |
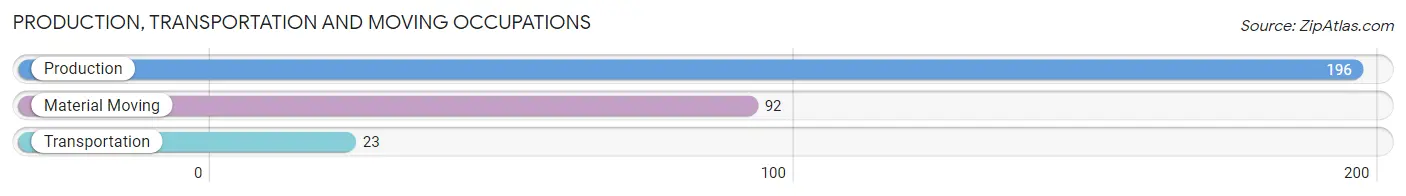
Production, Transportation and Moving Occupations
The most common Production, Transportation and Moving occupations in New Ellenton are Production (196 | 15.5%), Material Moving (92 | 7.3%), and Transportation (23 | 1.8%).
Production, Transportation and Moving Occupations by Sex
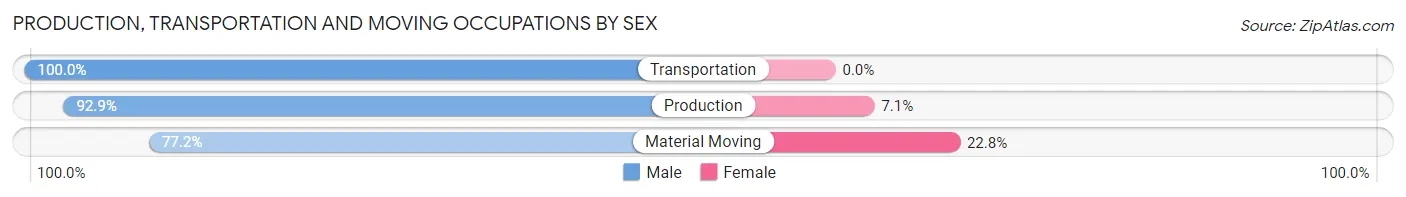
| Occupation | Male | Female |
| Production | 182 (92.9%) | 14 (7.1%) |
| Transportation | 23 (100.0%) | 0 (0.0%) |
| Material Moving | 71 (77.2%) | 21 (22.8%) |
| Total (Category) | 276 (88.7%) | 35 (11.3%) |
| Total (Overall) | 643 (50.9%) | 621 (49.1%) |
Employment Industries by Sex in New Ellenton
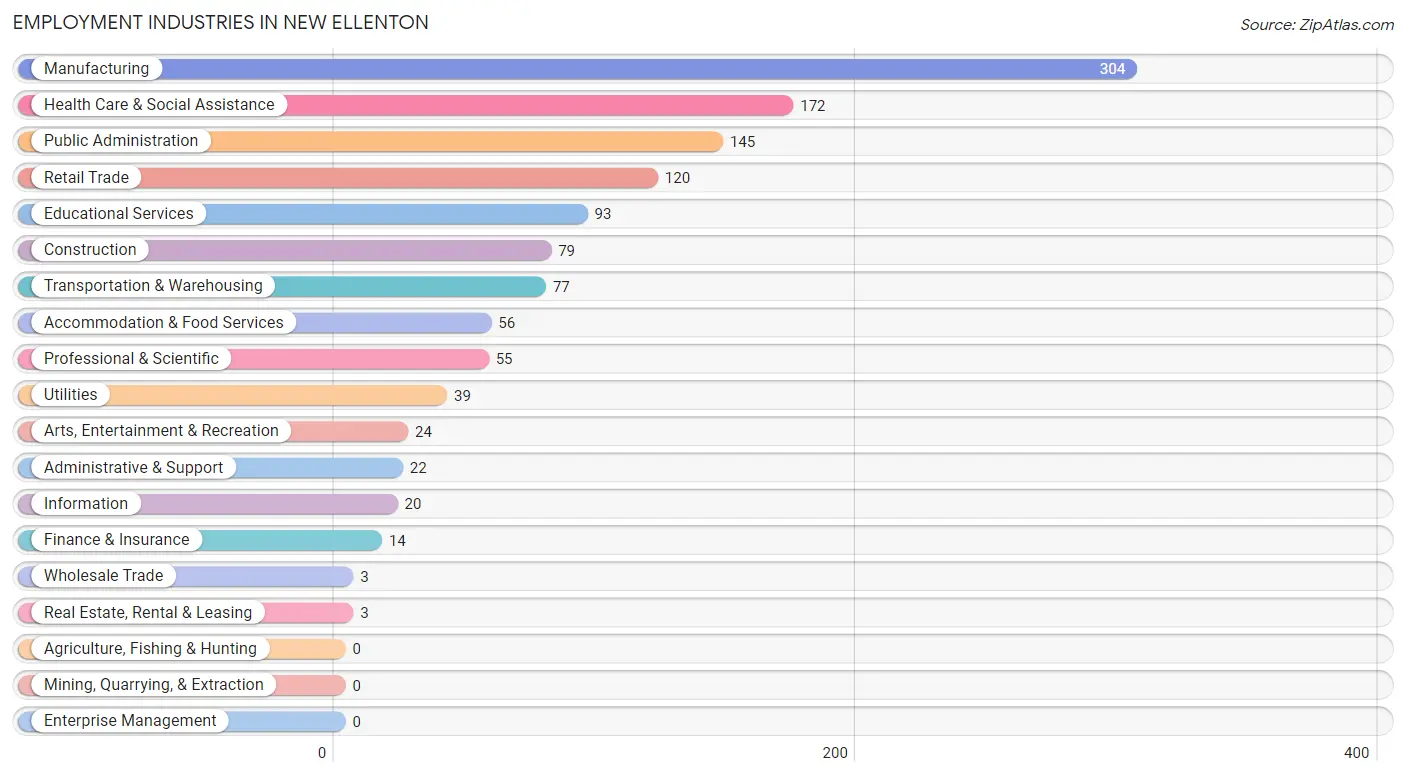
Employment Industries in New Ellenton
The major employment industries in New Ellenton include Manufacturing (304 | 24.0%), Health Care & Social Assistance (172 | 13.6%), Public Administration (145 | 11.5%), Retail Trade (120 | 9.5%), and Educational Services (93 | 7.4%).
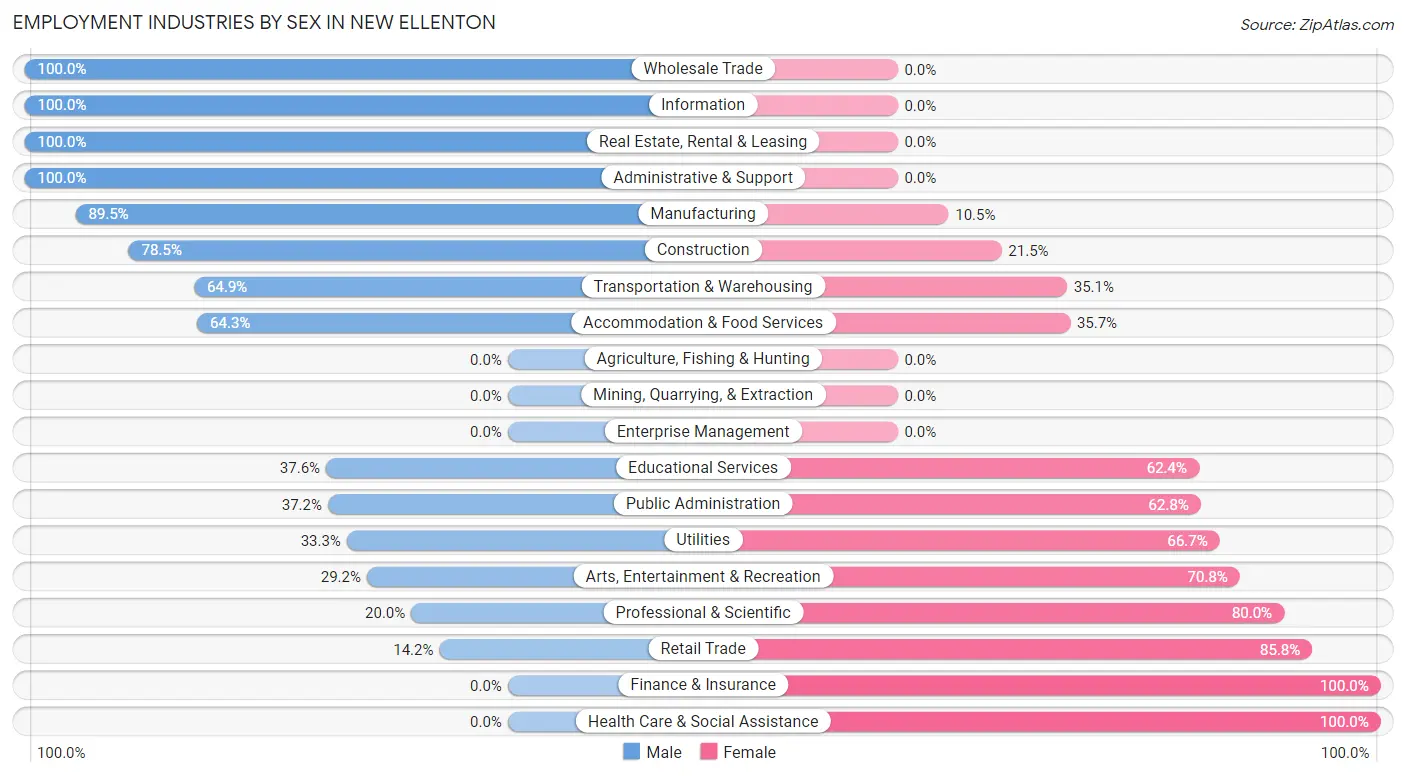
Employment Industries by Sex in New Ellenton
The New Ellenton industries that see more men than women are Wholesale Trade (100.0%), Information (100.0%), and Real Estate, Rental & Leasing (100.0%), whereas the industries that tend to have a higher number of women are Finance & Insurance (100.0%), Health Care & Social Assistance (100.0%), and Retail Trade (85.8%).
| Industry | Male | Female |
| Agriculture, Fishing & Hunting | 0 (0.0%) | 0 (0.0%) |
| Mining, Quarrying, & Extraction | 0 (0.0%) | 0 (0.0%) |
| Construction | 62 (78.5%) | 17 (21.5%) |
| Manufacturing | 272 (89.5%) | 32 (10.5%) |
| Wholesale Trade | 3 (100.0%) | 0 (0.0%) |
| Retail Trade | 17 (14.2%) | 103 (85.8%) |
| Transportation & Warehousing | 50 (64.9%) | 27 (35.1%) |
| Utilities | 13 (33.3%) | 26 (66.7%) |
| Information | 20 (100.0%) | 0 (0.0%) |
| Finance & Insurance | 0 (0.0%) | 14 (100.0%) |
| Real Estate, Rental & Leasing | 3 (100.0%) | 0 (0.0%) |
| Professional & Scientific | 11 (20.0%) | 44 (80.0%) |
| Enterprise Management | 0 (0.0%) | 0 (0.0%) |
| Administrative & Support | 22 (100.0%) | 0 (0.0%) |
| Educational Services | 35 (37.6%) | 58 (62.4%) |
| Health Care & Social Assistance | 0 (0.0%) | 172 (100.0%) |
| Arts, Entertainment & Recreation | 7 (29.2%) | 17 (70.8%) |
| Accommodation & Food Services | 36 (64.3%) | 20 (35.7%) |
| Public Administration | 54 (37.2%) | 91 (62.8%) |
| Total | 643 (50.9%) | 621 (49.1%) |
Education in New Ellenton
School Enrollment in New Ellenton
The most common levels of schooling among the 547 students in New Ellenton are elementary school (133 | 24.3%), middle school (133 | 24.3%), and high school (124 | 22.7%).
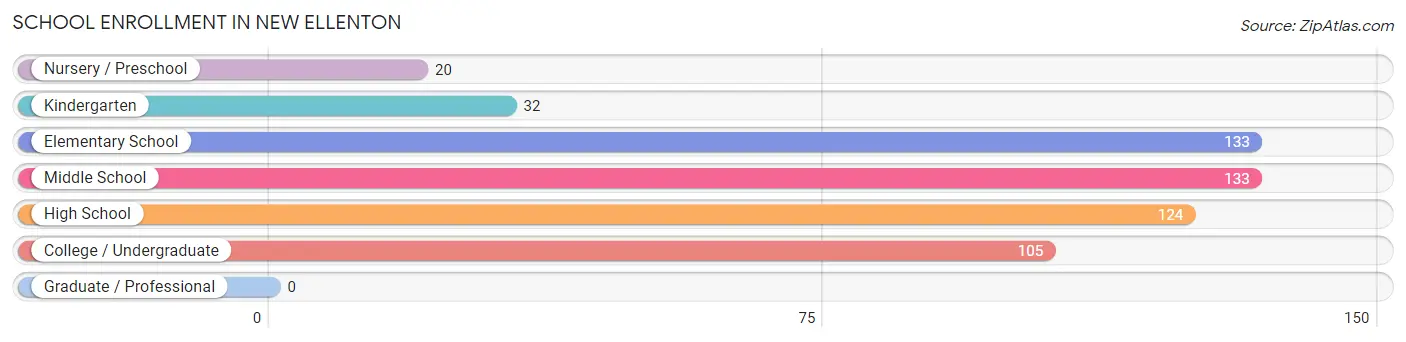
| School Level | # Students | % Students |
| Nursery / Preschool | 20 | 3.7% |
| Kindergarten | 32 | 5.9% |
| Elementary School | 133 | 24.3% |
| Middle School | 133 | 24.3% |
| High School | 124 | 22.7% |
| College / Undergraduate | 105 | 19.2% |
| Graduate / Professional | 0 | 0.0% |
| Total | 547 | 100.0% |
School Enrollment by Age by Funding Source in New Ellenton
Out of a total of 547 students who are enrolled in schools in New Ellenton, 28 (5.1%) attend a private institution, while the remaining 519 (94.9%) are enrolled in public schools. The age group of 5 to 9 year old has the highest likelihood of being enrolled in private schools, with 25 (13.5% in the age bracket) enrolled. Conversely, the age group of 15 to 17 year olds has the lowest likelihood of being enrolled in a private school, with 112 (100.0% in the age bracket) attending a public institution.
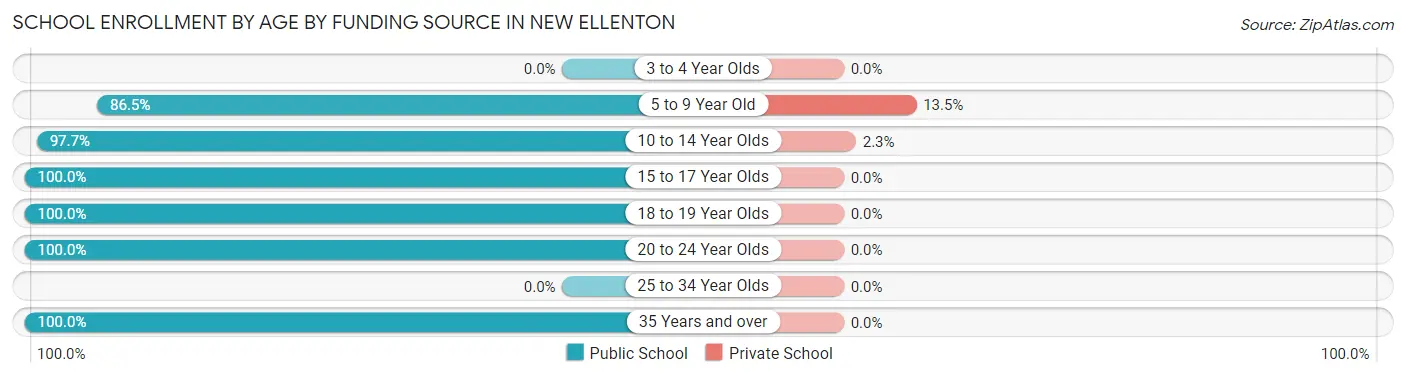
| Age Bracket | Public School | Private School |
| 3 to 4 Year Olds | 0 (0.0%) | 0 (0.0%) |
| 5 to 9 Year Old | 160 (86.5%) | 25 (13.5%) |
| 10 to 14 Year Olds | 130 (97.7%) | 3 (2.3%) |
| 15 to 17 Year Olds | 112 (100.0%) | 0 (0.0%) |
| 18 to 19 Year Olds | 61 (100.0%) | 0 (0.0%) |
| 20 to 24 Year Olds | 29 (100.0%) | 0 (0.0%) |
| 25 to 34 Year Olds | 0 (0.0%) | 0 (0.0%) |
| 35 Years and over | 27 (100.0%) | 0 (0.0%) |
| Total | 519 (94.9%) | 28 (5.1%) |
Educational Attainment by Field of Study in New Ellenton
Business (93 | 21.5%), education (78 | 18.1%), arts & humanities (72 | 16.7%), engineering (43 | 10.0%), and social sciences (34 | 7.9%) are the most common fields of study among 432 individuals in New Ellenton who have obtained a bachelor's degree or higher.
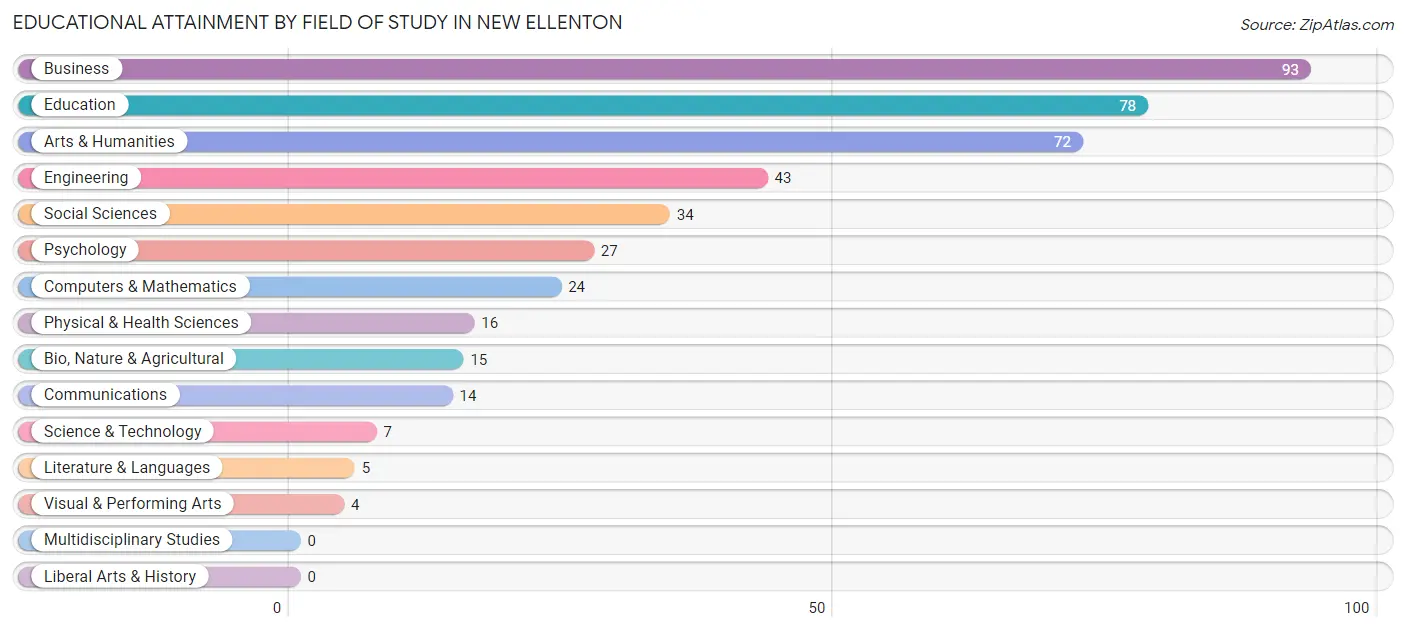
| Field of Study | # Graduates | % Graduates |
| Computers & Mathematics | 24 | 5.6% |
| Bio, Nature & Agricultural | 15 | 3.5% |
| Physical & Health Sciences | 16 | 3.7% |
| Psychology | 27 | 6.2% |
| Social Sciences | 34 | 7.9% |
| Engineering | 43 | 10.0% |
| Multidisciplinary Studies | 0 | 0.0% |
| Science & Technology | 7 | 1.6% |
| Business | 93 | 21.5% |
| Education | 78 | 18.1% |
| Literature & Languages | 5 | 1.2% |
| Liberal Arts & History | 0 | 0.0% |
| Visual & Performing Arts | 4 | 0.9% |
| Communications | 14 | 3.2% |
| Arts & Humanities | 72 | 16.7% |
| Total | 432 | 100.0% |
Transportation & Commute in New Ellenton
Vehicle Availability by Sex in New Ellenton
The most prevalent vehicle ownership categories in New Ellenton are males with 2 vehicles (260, accounting for 41.7%) and females with 2 vehicles (151, making up 41.9%).
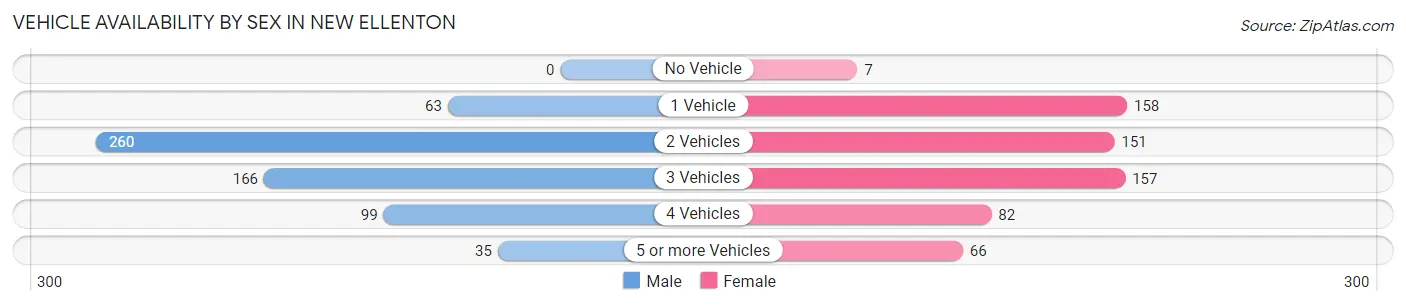
| Vehicles Available | Male | Female |
| No Vehicle | 0 (0.0%) | 7 (1.1%) |
| 1 Vehicle | 63 (10.1%) | 158 (25.4%) |
| 2 Vehicles | 260 (41.7%) | 151 (24.3%) |
| 3 Vehicles | 166 (26.7%) | 157 (25.3%) |
| 4 Vehicles | 99 (15.9%) | 82 (13.2%) |
| 5 or more Vehicles | 35 (5.6%) | 66 (10.6%) |
| Total | 623 (100.0%) | 621 (100.0%) |
Commute Time in New Ellenton
The most frequently occuring commute durations in New Ellenton are 30 to 34 minutes (332 commuters, 27.9%), 10 to 14 minutes (178 commuters, 15.0%), and 15 to 19 minutes (162 commuters, 13.6%).
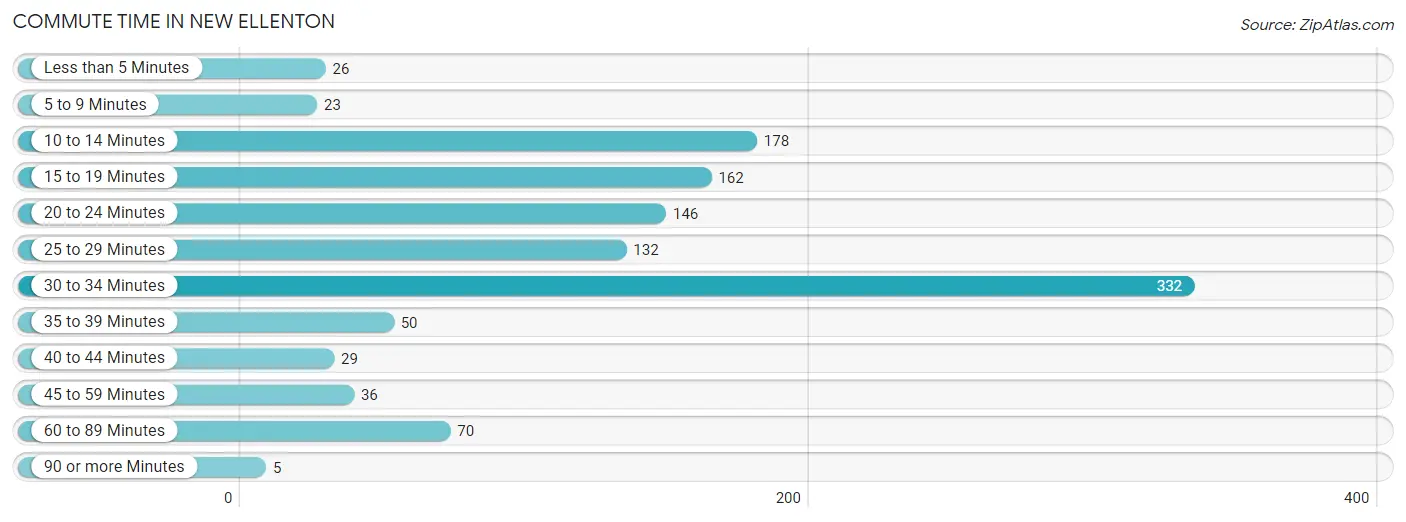
| Commute Time | # Commuters | % Commuters |
| Less than 5 Minutes | 26 | 2.2% |
| 5 to 9 Minutes | 23 | 1.9% |
| 10 to 14 Minutes | 178 | 15.0% |
| 15 to 19 Minutes | 162 | 13.6% |
| 20 to 24 Minutes | 146 | 12.3% |
| 25 to 29 Minutes | 132 | 11.1% |
| 30 to 34 Minutes | 332 | 27.9% |
| 35 to 39 Minutes | 50 | 4.2% |
| 40 to 44 Minutes | 29 | 2.4% |
| 45 to 59 Minutes | 36 | 3.0% |
| 60 to 89 Minutes | 70 | 5.9% |
| 90 or more Minutes | 5 | 0.4% |
Commute Time by Sex in New Ellenton
The most common commute times in New Ellenton are 30 to 34 minutes (292 commuters, 47.9%) for males and 10 to 14 minutes (130 commuters, 22.5%) for females.
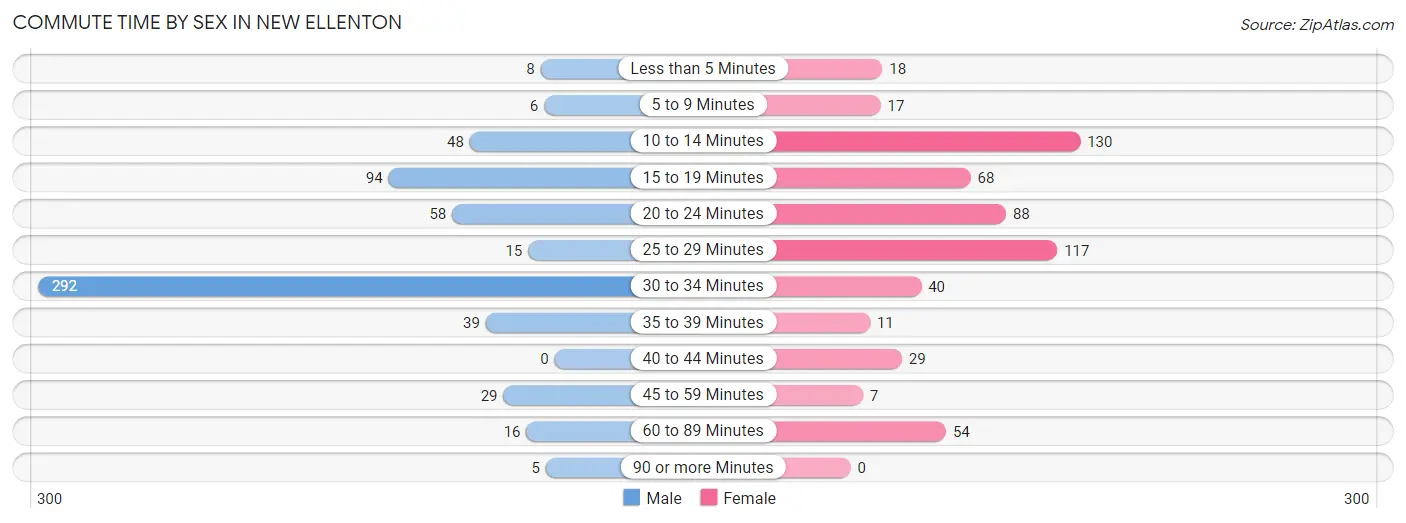
| Commute Time | Male | Female |
| Less than 5 Minutes | 8 (1.3%) | 18 (3.1%) |
| 5 to 9 Minutes | 6 (1.0%) | 17 (2.9%) |
| 10 to 14 Minutes | 48 (7.9%) | 130 (22.5%) |
| 15 to 19 Minutes | 94 (15.4%) | 68 (11.7%) |
| 20 to 24 Minutes | 58 (9.5%) | 88 (15.2%) |
| 25 to 29 Minutes | 15 (2.5%) | 117 (20.2%) |
| 30 to 34 Minutes | 292 (47.9%) | 40 (6.9%) |
| 35 to 39 Minutes | 39 (6.4%) | 11 (1.9%) |
| 40 to 44 Minutes | 0 (0.0%) | 29 (5.0%) |
| 45 to 59 Minutes | 29 (4.8%) | 7 (1.2%) |
| 60 to 89 Minutes | 16 (2.6%) | 54 (9.3%) |
| 90 or more Minutes | 5 (0.8%) | 0 (0.0%) |
Time of Departure to Work by Sex in New Ellenton
The most frequent times of departure to work in New Ellenton are 6:00 AM to 6:29 AM (113, 18.5%) for males and 6:00 AM to 6:29 AM (134, 23.1%) for females.
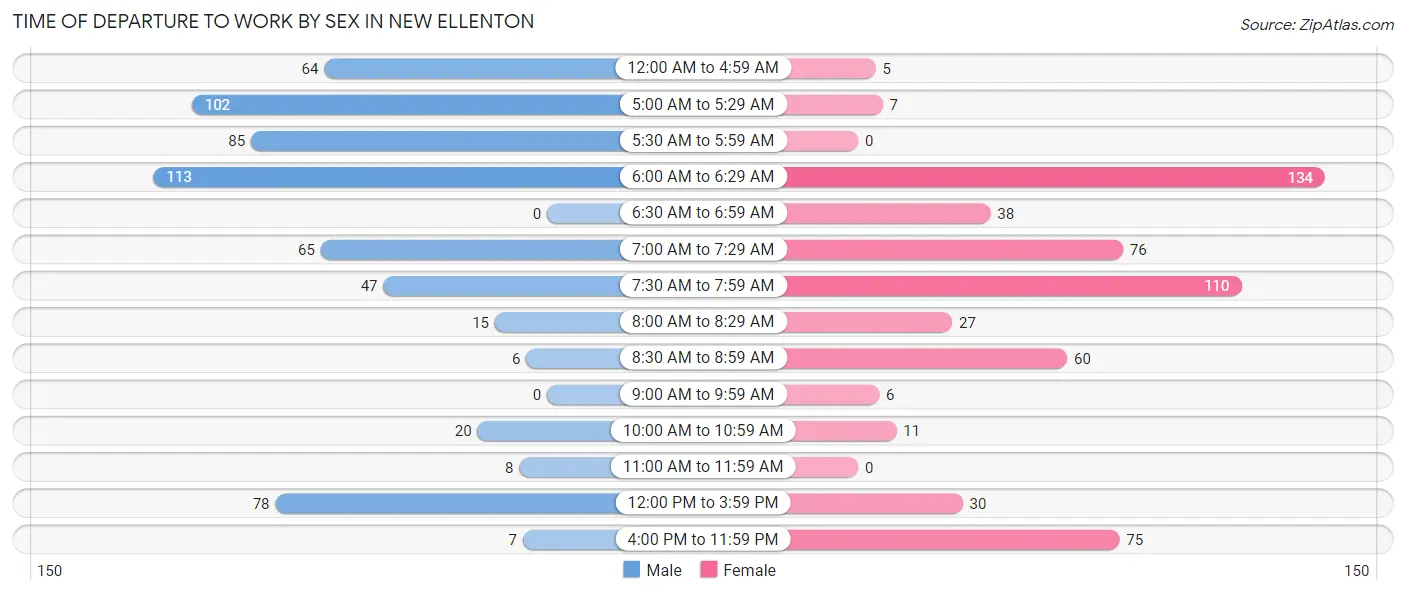
| Time of Departure | Male | Female |
| 12:00 AM to 4:59 AM | 64 (10.5%) | 5 (0.9%) |
| 5:00 AM to 5:29 AM | 102 (16.7%) | 7 (1.2%) |
| 5:30 AM to 5:59 AM | 85 (13.9%) | 0 (0.0%) |
| 6:00 AM to 6:29 AM | 113 (18.5%) | 134 (23.1%) |
| 6:30 AM to 6:59 AM | 0 (0.0%) | 38 (6.6%) |
| 7:00 AM to 7:29 AM | 65 (10.7%) | 76 (13.1%) |
| 7:30 AM to 7:59 AM | 47 (7.7%) | 110 (19.0%) |
| 8:00 AM to 8:29 AM | 15 (2.5%) | 27 (4.7%) |
| 8:30 AM to 8:59 AM | 6 (1.0%) | 60 (10.4%) |
| 9:00 AM to 9:59 AM | 0 (0.0%) | 6 (1.0%) |
| 10:00 AM to 10:59 AM | 20 (3.3%) | 11 (1.9%) |
| 11:00 AM to 11:59 AM | 8 (1.3%) | 0 (0.0%) |
| 12:00 PM to 3:59 PM | 78 (12.8%) | 30 (5.2%) |
| 4:00 PM to 11:59 PM | 7 (1.1%) | 75 (13.0%) |
| Total | 610 (100.0%) | 579 (100.0%) |
Housing Occupancy in New Ellenton
Occupancy by Ownership in New Ellenton
Of the total 968 dwellings in New Ellenton, owner-occupied units account for 705 (72.8%), while renter-occupied units make up 263 (27.2%).
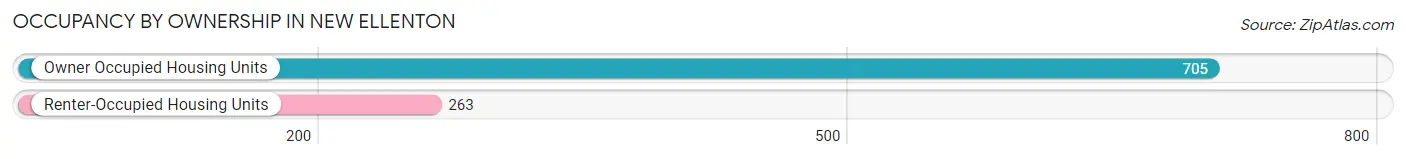
| Occupancy | # Housing Units | % Housing Units |
| Owner Occupied Housing Units | 705 | 72.8% |
| Renter-Occupied Housing Units | 263 | 27.2% |
| Total Occupied Housing Units | 968 | 100.0% |
Occupancy by Household Size in New Ellenton
| Household Size | # Housing Units | % Housing Units |
| 1-Person Household | 246 | 25.4% |
| 2-Person Household | 425 | 43.9% |
| 3-Person Household | 99 | 10.2% |
| 4+ Person Household | 198 | 20.4% |
| Total Housing Units | 968 | 100.0% |
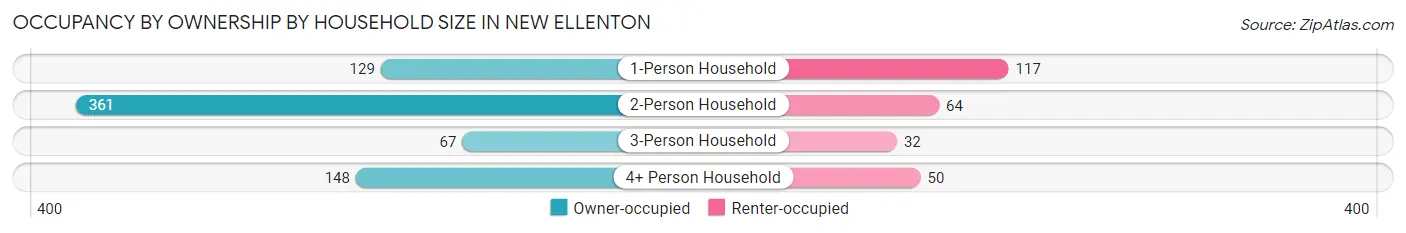
Occupancy by Ownership by Household Size in New Ellenton
| Household Size | Owner-occupied | Renter-occupied |
| 1-Person Household | 129 (52.4%) | 117 (47.6%) |
| 2-Person Household | 361 (84.9%) | 64 (15.1%) |
| 3-Person Household | 67 (67.7%) | 32 (32.3%) |
| 4+ Person Household | 148 (74.8%) | 50 (25.3%) |
| Total Housing Units | 705 (72.8%) | 263 (27.2%) |
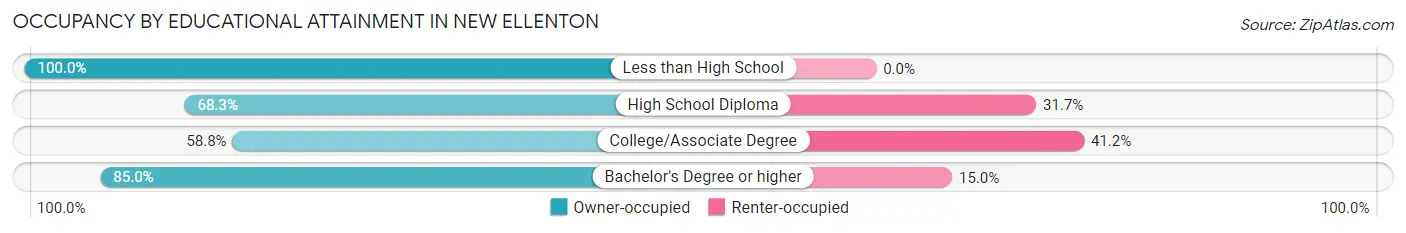
Occupancy by Educational Attainment in New Ellenton
| Household Size | Owner-occupied | Renter-occupied |
| Less than High School | 69 (100.0%) | 0 (0.0%) |
| High School Diploma | 310 (68.3%) | 144 (31.7%) |
| College/Associate Degree | 117 (58.8%) | 82 (41.2%) |
| Bachelor's Degree or higher | 209 (85.0%) | 37 (15.0%) |
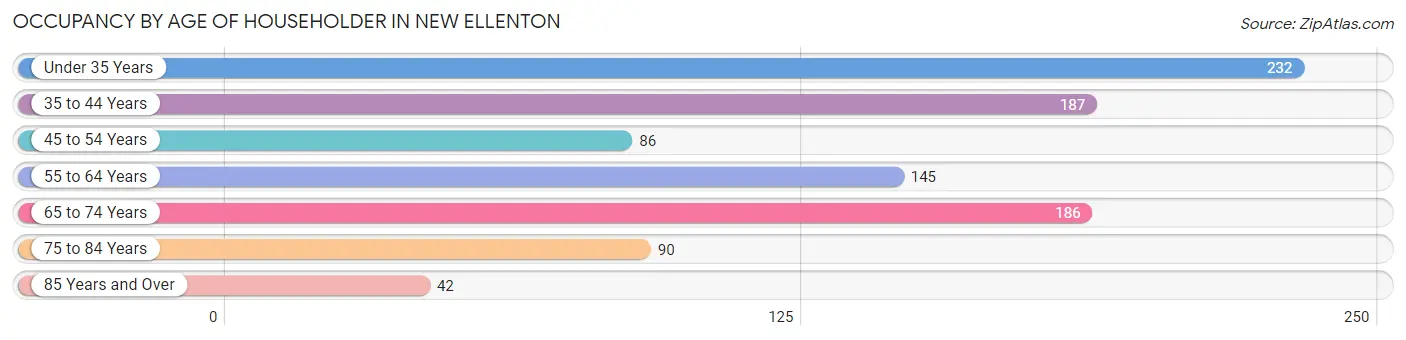
Occupancy by Age of Householder in New Ellenton
| Age Bracket | # Households | % Households |
| Under 35 Years | 232 | 24.0% |
| 35 to 44 Years | 187 | 19.3% |
| 45 to 54 Years | 86 | 8.9% |
| 55 to 64 Years | 145 | 15.0% |
| 65 to 74 Years | 186 | 19.2% |
| 75 to 84 Years | 90 | 9.3% |
| 85 Years and Over | 42 | 4.3% |
| Total | 968 | 100.0% |
Housing Finances in New Ellenton
Median Income by Occupancy in New Ellenton
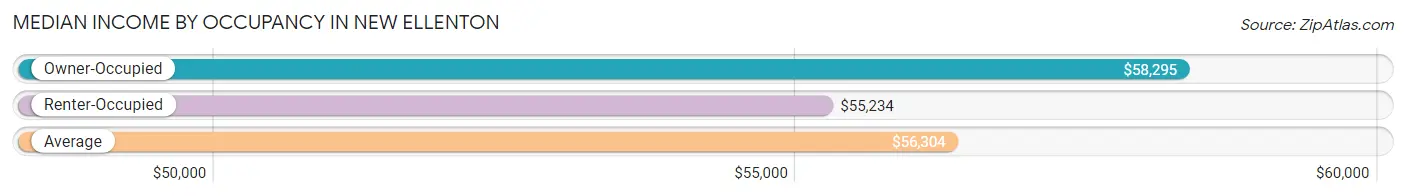
| Occupancy Type | # Households | Median Income |
| Owner-Occupied | 705 (72.8%) | $58,295 |
| Renter-Occupied | 263 (27.2%) | $55,234 |
| Average | 968 (100.0%) | $56,304 |
Occupancy by Householder Income Bracket in New Ellenton
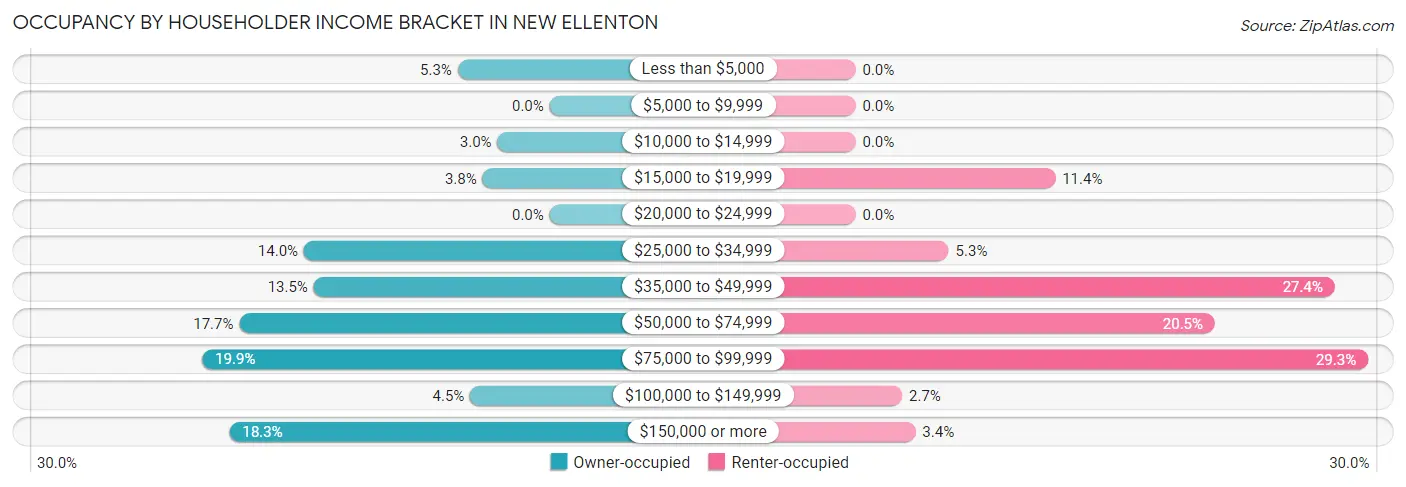
| Income Bracket | Owner-occupied | Renter-occupied |
| Less than $5,000 | 37 (5.2%) | 0 (0.0%) |
| $5,000 to $9,999 | 0 (0.0%) | 0 (0.0%) |
| $10,000 to $14,999 | 21 (3.0%) | 0 (0.0%) |
| $15,000 to $19,999 | 27 (3.8%) | 30 (11.4%) |
| $20,000 to $24,999 | 0 (0.0%) | 0 (0.0%) |
| $25,000 to $34,999 | 99 (14.0%) | 14 (5.3%) |
| $35,000 to $49,999 | 95 (13.5%) | 72 (27.4%) |
| $50,000 to $74,999 | 125 (17.7%) | 54 (20.5%) |
| $75,000 to $99,999 | 140 (19.9%) | 77 (29.3%) |
| $100,000 to $149,999 | 32 (4.5%) | 7 (2.7%) |
| $150,000 or more | 129 (18.3%) | 9 (3.4%) |
| Total | 705 (100.0%) | 263 (100.0%) |
Monthly Housing Cost Tiers in New Ellenton
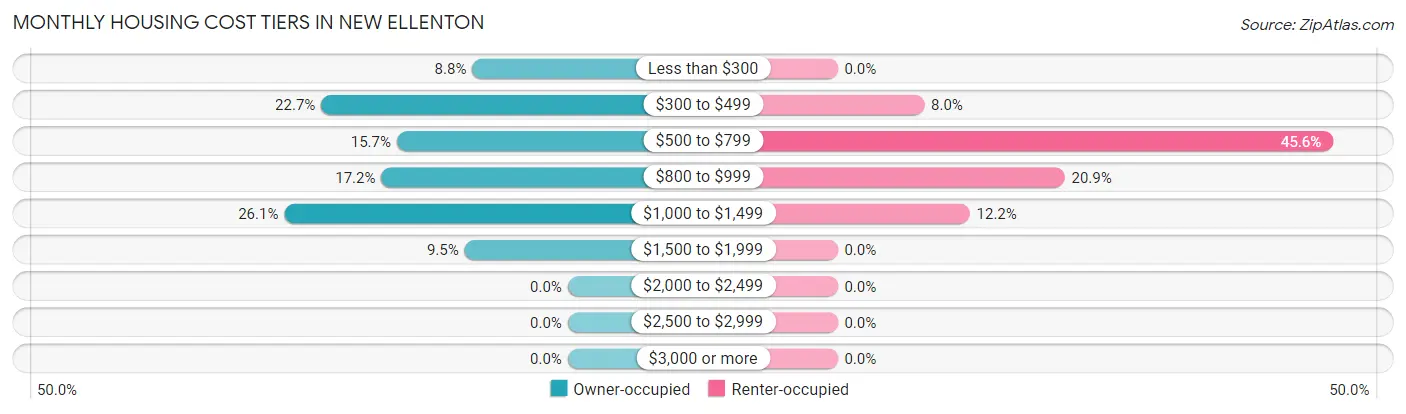
| Monthly Cost | Owner-occupied | Renter-occupied |
| Less than $300 | 62 (8.8%) | 0 (0.0%) |
| $300 to $499 | 160 (22.7%) | 21 (8.0%) |
| $500 to $799 | 111 (15.7%) | 120 (45.6%) |
| $800 to $999 | 121 (17.2%) | 55 (20.9%) |
| $1,000 to $1,499 | 184 (26.1%) | 32 (12.2%) |
| $1,500 to $1,999 | 67 (9.5%) | 0 (0.0%) |
| $2,000 to $2,499 | 0 (0.0%) | 0 (0.0%) |
| $2,500 to $2,999 | 0 (0.0%) | 0 (0.0%) |
| $3,000 or more | 0 (0.0%) | 0 (0.0%) |
| Total | 705 (100.0%) | 263 (100.0%) |
Physical Housing Characteristics in New Ellenton
Housing Structures in New Ellenton
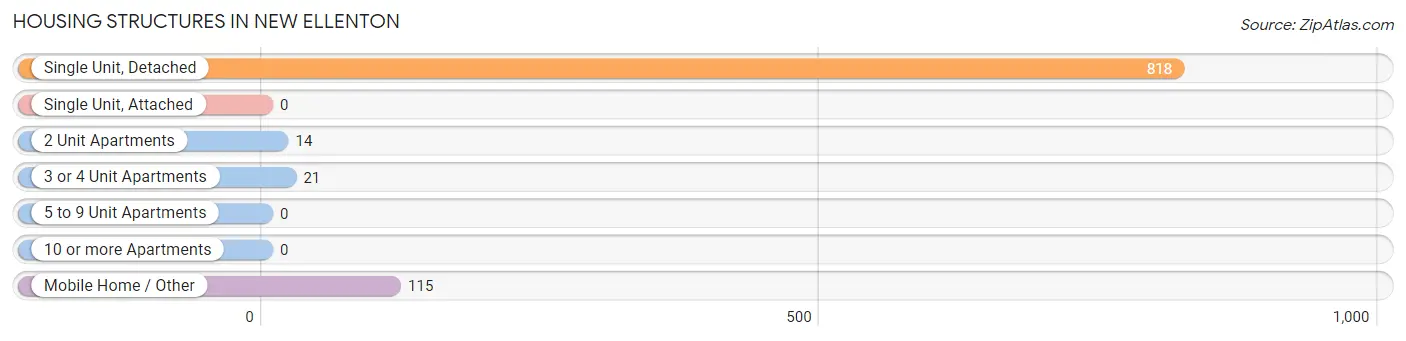
| Structure Type | # Housing Units | % Housing Units |
| Single Unit, Detached | 818 | 84.5% |
| Single Unit, Attached | 0 | 0.0% |
| 2 Unit Apartments | 14 | 1.5% |
| 3 or 4 Unit Apartments | 21 | 2.2% |
| 5 to 9 Unit Apartments | 0 | 0.0% |
| 10 or more Apartments | 0 | 0.0% |
| Mobile Home / Other | 115 | 11.9% |
| Total | 968 | 100.0% |
Housing Structures by Occupancy in New Ellenton
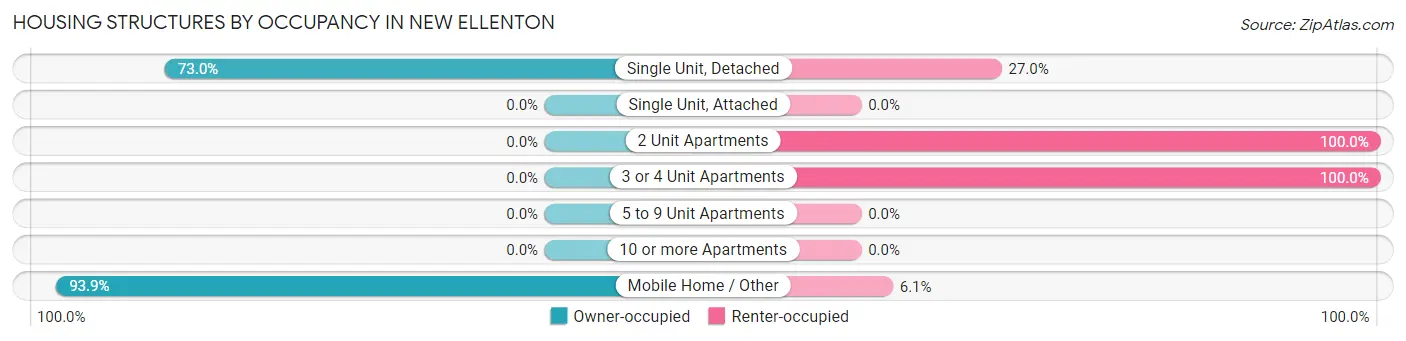
| Structure Type | Owner-occupied | Renter-occupied |
| Single Unit, Detached | 597 (73.0%) | 221 (27.0%) |
| Single Unit, Attached | 0 (0.0%) | 0 (0.0%) |
| 2 Unit Apartments | 0 (0.0%) | 14 (100.0%) |
| 3 or 4 Unit Apartments | 0 (0.0%) | 21 (100.0%) |
| 5 to 9 Unit Apartments | 0 (0.0%) | 0 (0.0%) |
| 10 or more Apartments | 0 (0.0%) | 0 (0.0%) |
| Mobile Home / Other | 108 (93.9%) | 7 (6.1%) |
| Total | 705 (72.8%) | 263 (27.2%) |
Housing Structures by Number of Rooms in New Ellenton
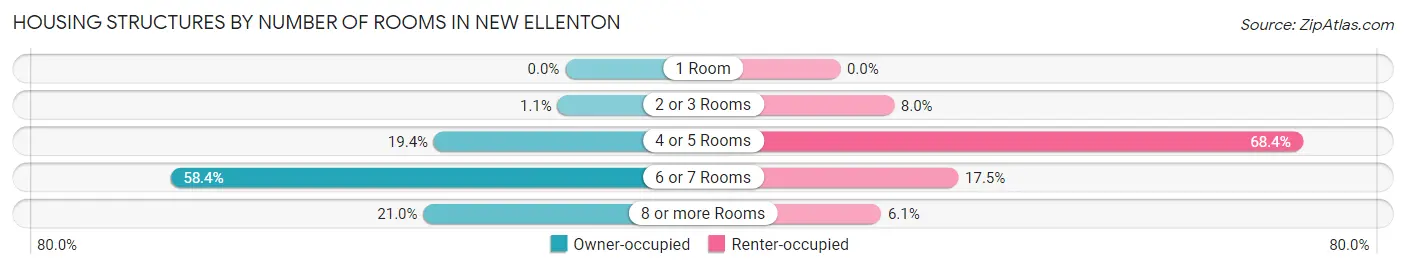
| Number of Rooms | Owner-occupied | Renter-occupied |
| 1 Room | 0 (0.0%) | 0 (0.0%) |
| 2 or 3 Rooms | 8 (1.1%) | 21 (8.0%) |
| 4 or 5 Rooms | 137 (19.4%) | 180 (68.4%) |
| 6 or 7 Rooms | 412 (58.4%) | 46 (17.5%) |
| 8 or more Rooms | 148 (21.0%) | 16 (6.1%) |
| Total | 705 (100.0%) | 263 (100.0%) |
Housing Structure by Heating Type in New Ellenton
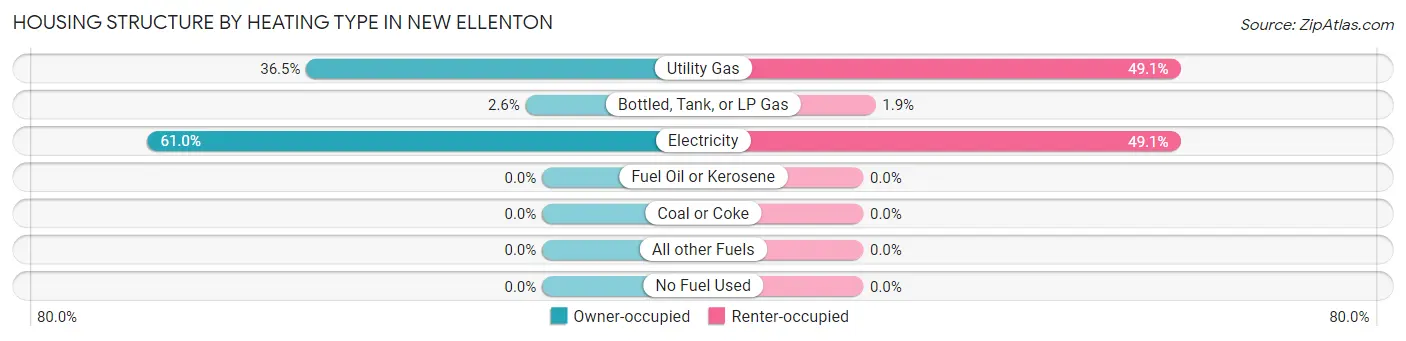
| Heating Type | Owner-occupied | Renter-occupied |
| Utility Gas | 257 (36.4%) | 129 (49.0%) |
| Bottled, Tank, or LP Gas | 18 (2.5%) | 5 (1.9%) |
| Electricity | 430 (61.0%) | 129 (49.0%) |
| Fuel Oil or Kerosene | 0 (0.0%) | 0 (0.0%) |
| Coal or Coke | 0 (0.0%) | 0 (0.0%) |
| All other Fuels | 0 (0.0%) | 0 (0.0%) |
| No Fuel Used | 0 (0.0%) | 0 (0.0%) |
| Total | 705 (100.0%) | 263 (100.0%) |
Household Vehicle Usage in New Ellenton
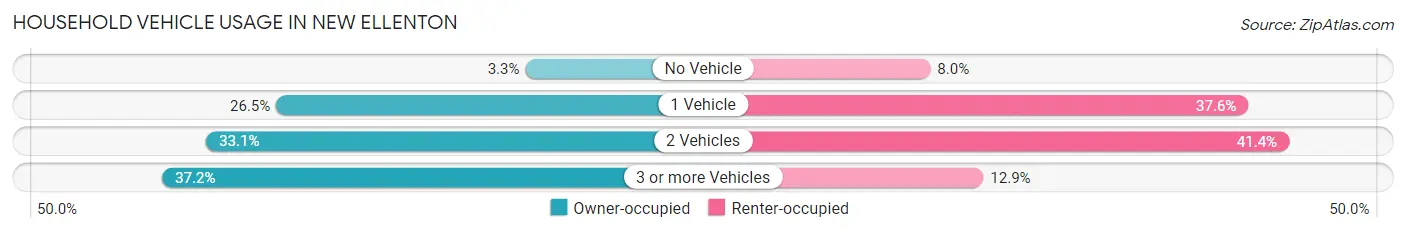
| Vehicles per Household | Owner-occupied | Renter-occupied |
| No Vehicle | 23 (3.3%) | 21 (8.0%) |
| 1 Vehicle | 187 (26.5%) | 99 (37.6%) |
| 2 Vehicles | 233 (33.1%) | 109 (41.4%) |
| 3 or more Vehicles | 262 (37.2%) | 34 (12.9%) |
| Total | 705 (100.0%) | 263 (100.0%) |
Real Estate & Mortgages in New Ellenton
Real Estate and Mortgage Overview in New Ellenton
| Characteristic | Without Mortgage | With Mortgage |
| Housing Units | 261 | 444 |
| Median Property Value | $125,700 | $175,200 |
| Median Household Income | $42,946 | $108 |
| Monthly Housing Costs | $419 | $0 |
| Real Estate Taxes | $610 | $0 |
Property Value by Mortgage Status in New Ellenton
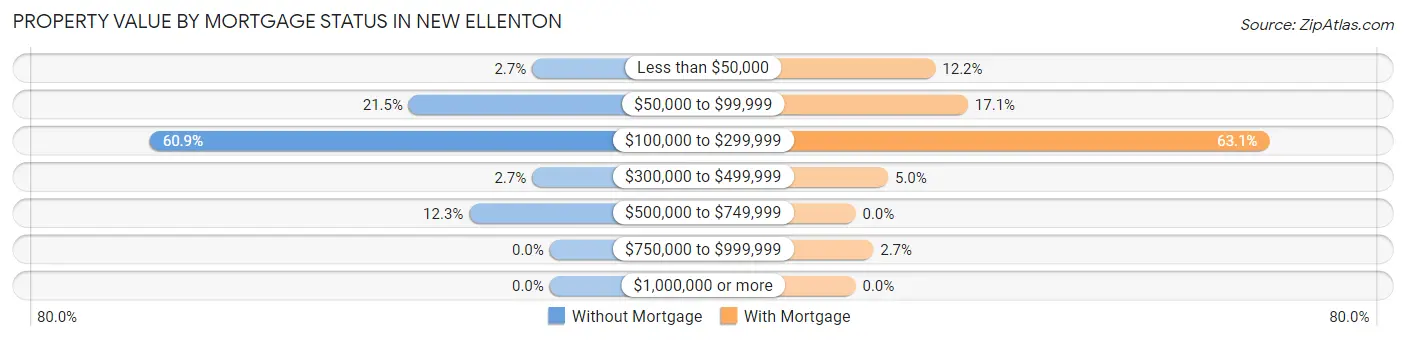
| Property Value | Without Mortgage | With Mortgage |
| Less than $50,000 | 7 (2.7%) | 54 (12.2%) |
| $50,000 to $99,999 | 56 (21.5%) | 76 (17.1%) |
| $100,000 to $299,999 | 159 (60.9%) | 280 (63.1%) |
| $300,000 to $499,999 | 7 (2.7%) | 22 (5.0%) |
| $500,000 to $749,999 | 32 (12.3%) | 0 (0.0%) |
| $750,000 to $999,999 | 0 (0.0%) | 12 (2.7%) |
| $1,000,000 or more | 0 (0.0%) | 0 (0.0%) |
| Total | 261 (100.0%) | 444 (100.0%) |
Household Income by Mortgage Status in New Ellenton
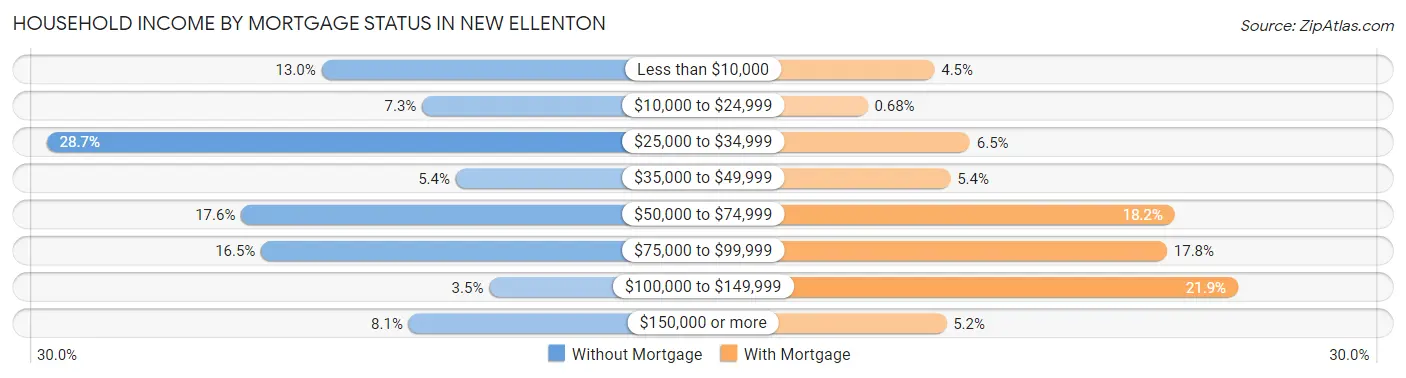
| Household Income | Without Mortgage | With Mortgage |
| Less than $10,000 | 34 (13.0%) | 20 (4.5%) |
| $10,000 to $24,999 | 19 (7.3%) | 3 (0.7%) |
| $25,000 to $34,999 | 75 (28.7%) | 29 (6.5%) |
| $35,000 to $49,999 | 14 (5.4%) | 24 (5.4%) |
| $50,000 to $74,999 | 46 (17.6%) | 81 (18.2%) |
| $75,000 to $99,999 | 43 (16.5%) | 79 (17.8%) |
| $100,000 to $149,999 | 9 (3.5%) | 97 (21.8%) |
| $150,000 or more | 21 (8.1%) | 23 (5.2%) |
| Total | 261 (100.0%) | 444 (100.0%) |
Property Value to Household Income Ratio in New Ellenton
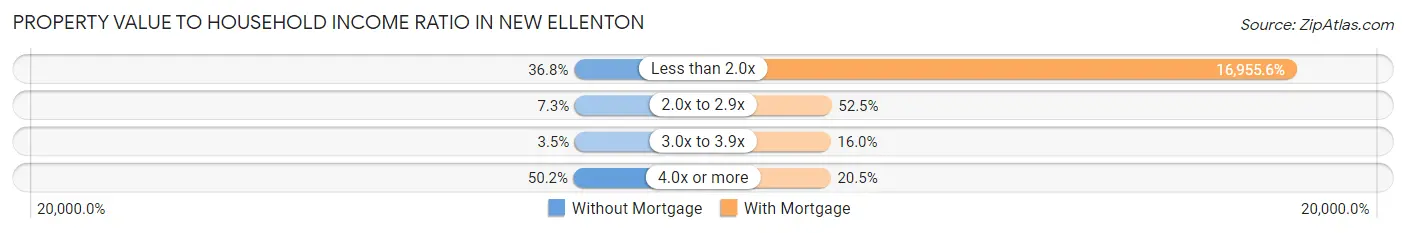
| Value-to-Income Ratio | Without Mortgage | With Mortgage |
| Less than 2.0x | 96 (36.8%) | 75,283 (16,955.6%) |
| 2.0x to 2.9x | 19 (7.3%) | 233 (52.5%) |
| 3.0x to 3.9x | 9 (3.5%) | 71 (16.0%) |
| 4.0x or more | 131 (50.2%) | 91 (20.5%) |
| Total | 261 (100.0%) | 444 (100.0%) |
Real Estate Taxes by Mortgage Status in New Ellenton
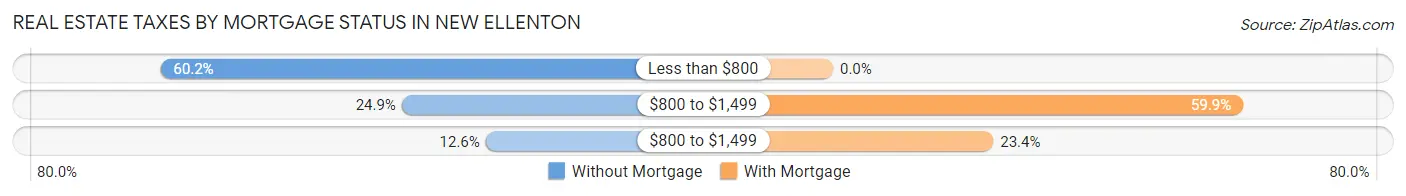
| Property Taxes | Without Mortgage | With Mortgage |
| Less than $800 | 157 (60.2%) | 0 (0.0%) |
| $800 to $1,499 | 65 (24.9%) | 266 (59.9%) |
| $800 to $1,499 | 33 (12.6%) | 104 (23.4%) |
| Total | 261 (100.0%) | 444 (100.0%) |
Health & Disability in New Ellenton
Health Insurance Coverage by Age in New Ellenton
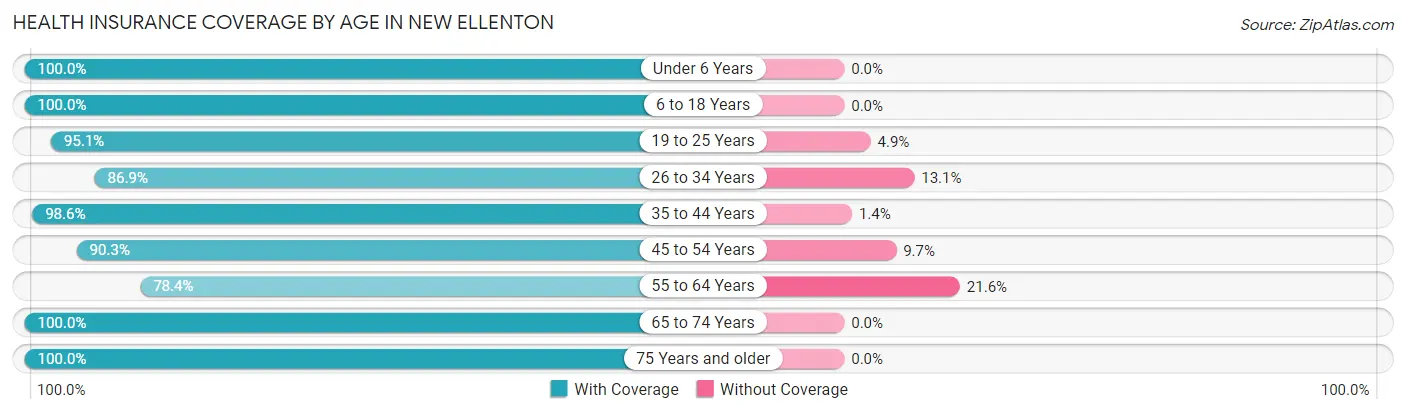
| Age Bracket | With Coverage | Without Coverage |
| Under 6 Years | 137 (100.0%) | 0 (0.0%) |
| 6 to 18 Years | 461 (100.0%) | 0 (0.0%) |
| 19 to 25 Years | 213 (95.1%) | 11 (4.9%) |
| 26 to 34 Years | 293 (86.9%) | 44 (13.1%) |
| 35 to 44 Years | 483 (98.6%) | 7 (1.4%) |
| 45 to 54 Years | 112 (90.3%) | 12 (9.7%) |
| 55 to 64 Years | 211 (78.4%) | 58 (21.6%) |
| 65 to 74 Years | 314 (100.0%) | 0 (0.0%) |
| 75 Years and older | 152 (100.0%) | 0 (0.0%) |
| Total | 2,376 (94.7%) | 132 (5.3%) |
Health Insurance Coverage by Citizenship Status in New Ellenton
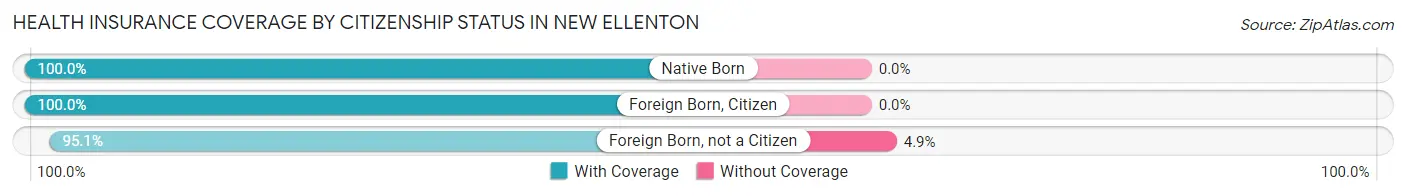
| Citizenship Status | With Coverage | Without Coverage |
| Native Born | 137 (100.0%) | 0 (0.0%) |
| Foreign Born, Citizen | 461 (100.0%) | 0 (0.0%) |
| Foreign Born, not a Citizen | 213 (95.1%) | 11 (4.9%) |
Health Insurance Coverage by Household Income in New Ellenton
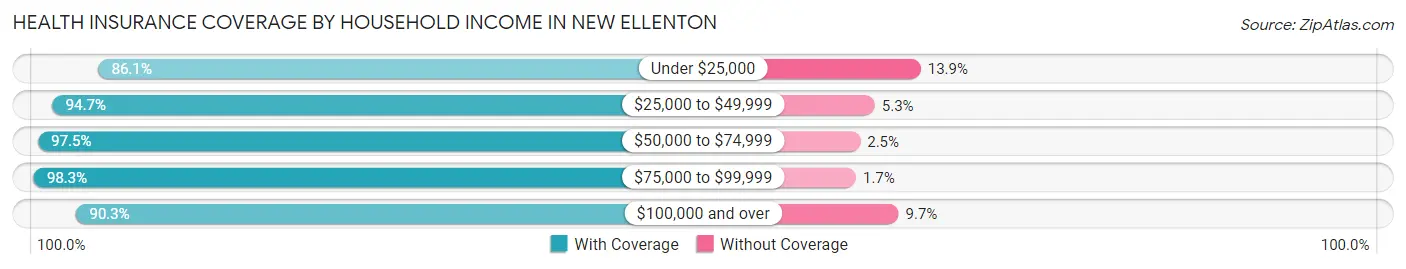
| Household Income | With Coverage | Without Coverage |
| Under $25,000 | 174 (86.1%) | 28 (13.9%) |
| $25,000 to $49,999 | 613 (94.7%) | 34 (5.3%) |
| $50,000 to $74,999 | 462 (97.5%) | 12 (2.5%) |
| $75,000 to $99,999 | 683 (98.3%) | 12 (1.7%) |
| $100,000 and over | 428 (90.3%) | 46 (9.7%) |
Public vs Private Health Insurance Coverage by Age in New Ellenton
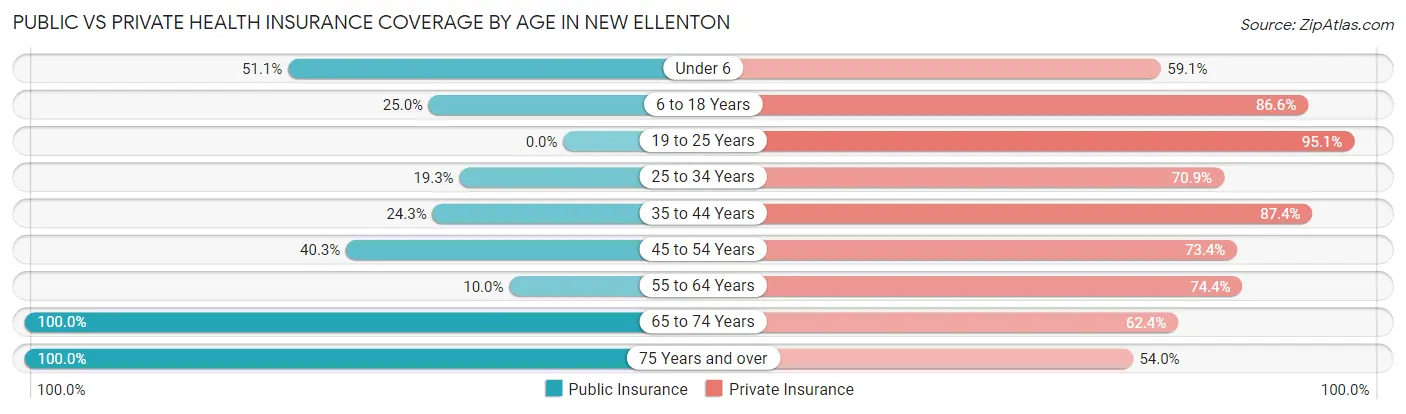
| Age Bracket | Public Insurance | Private Insurance |
| Under 6 | 70 (51.1%) | 81 (59.1%) |
| 6 to 18 Years | 115 (24.9%) | 399 (86.6%) |
| 19 to 25 Years | 0 (0.0%) | 213 (95.1%) |
| 25 to 34 Years | 65 (19.3%) | 239 (70.9%) |
| 35 to 44 Years | 119 (24.3%) | 428 (87.4%) |
| 45 to 54 Years | 50 (40.3%) | 91 (73.4%) |
| 55 to 64 Years | 27 (10.0%) | 200 (74.4%) |
| 65 to 74 Years | 314 (100.0%) | 196 (62.4%) |
| 75 Years and over | 152 (100.0%) | 82 (53.9%) |
| Total | 912 (36.4%) | 1,929 (76.9%) |
Disability Status by Sex by Age in New Ellenton
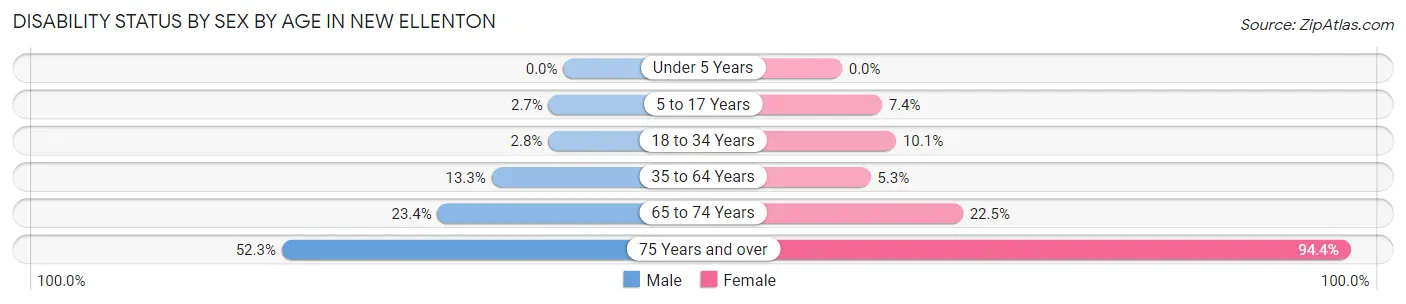
| Age Bracket | Male | Female |
| Under 5 Years | 0 (0.0%) | 0 (0.0%) |
| 5 to 17 Years | 6 (2.7%) | 17 (7.4%) |
| 18 to 34 Years | 8 (2.8%) | 34 (10.1%) |
| 35 to 64 Years | 60 (13.3%) | 23 (5.3%) |
| 65 to 74 Years | 39 (23.4%) | 33 (22.5%) |
| 75 Years and over | 23 (52.3%) | 102 (94.4%) |
Disability Class by Sex by Age in New Ellenton
Disability Class: Hearing Difficulty
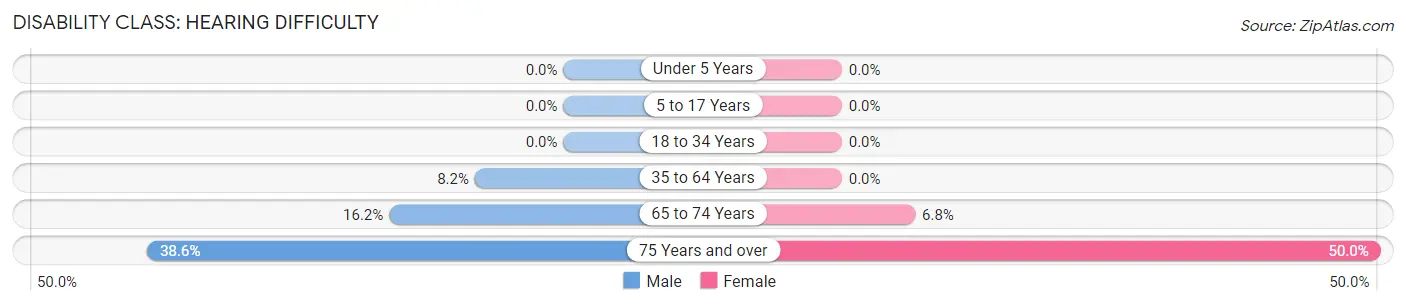
| Age Bracket | Male | Female |
| Under 5 Years | 0 (0.0%) | 0 (0.0%) |
| 5 to 17 Years | 0 (0.0%) | 0 (0.0%) |
| 18 to 34 Years | 0 (0.0%) | 0 (0.0%) |
| 35 to 64 Years | 37 (8.2%) | 0 (0.0%) |
| 65 to 74 Years | 27 (16.2%) | 10 (6.8%) |
| 75 Years and over | 17 (38.6%) | 54 (50.0%) |
Disability Class: Vision Difficulty
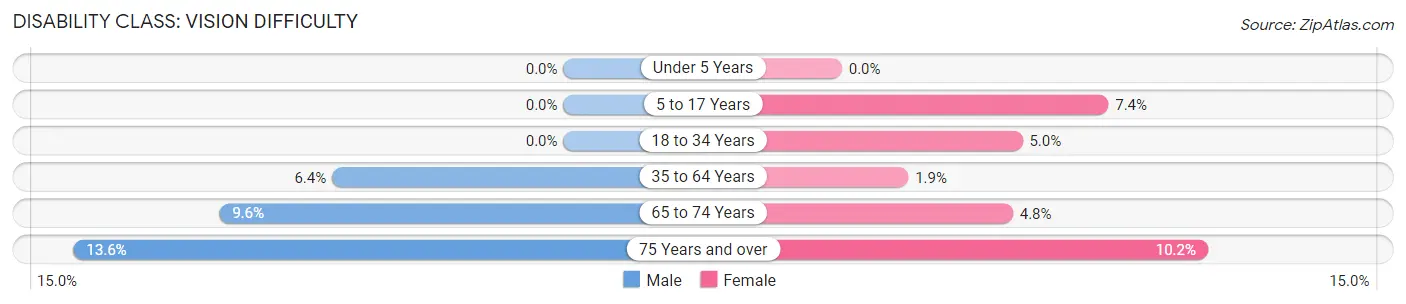
| Age Bracket | Male | Female |
| Under 5 Years | 0 (0.0%) | 0 (0.0%) |
| 5 to 17 Years | 0 (0.0%) | 17 (7.4%) |
| 18 to 34 Years | 0 (0.0%) | 17 (5.0%) |
| 35 to 64 Years | 29 (6.4%) | 8 (1.8%) |
| 65 to 74 Years | 16 (9.6%) | 7 (4.8%) |
| 75 Years and over | 6 (13.6%) | 11 (10.2%) |
Disability Class: Cognitive Difficulty
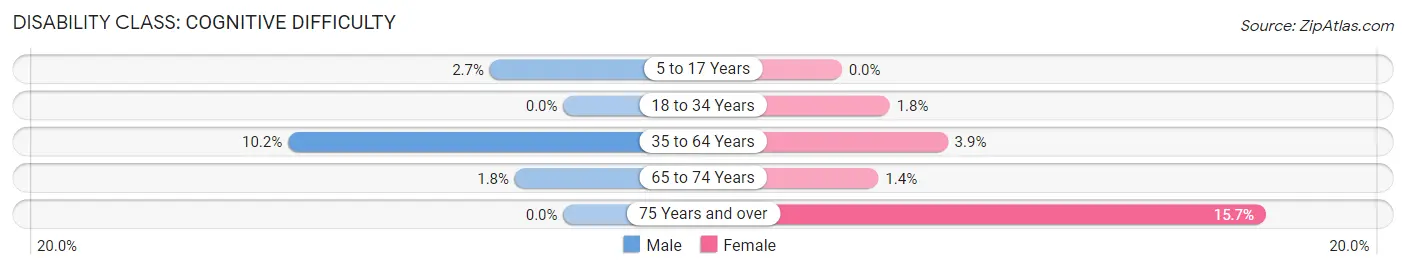
| Age Bracket | Male | Female |
| 5 to 17 Years | 6 (2.7%) | 0 (0.0%) |
| 18 to 34 Years | 0 (0.0%) | 6 (1.8%) |
| 35 to 64 Years | 46 (10.2%) | 17 (3.9%) |
| 65 to 74 Years | 3 (1.8%) | 2 (1.4%) |
| 75 Years and over | 0 (0.0%) | 17 (15.7%) |
Disability Class: Ambulatory Difficulty
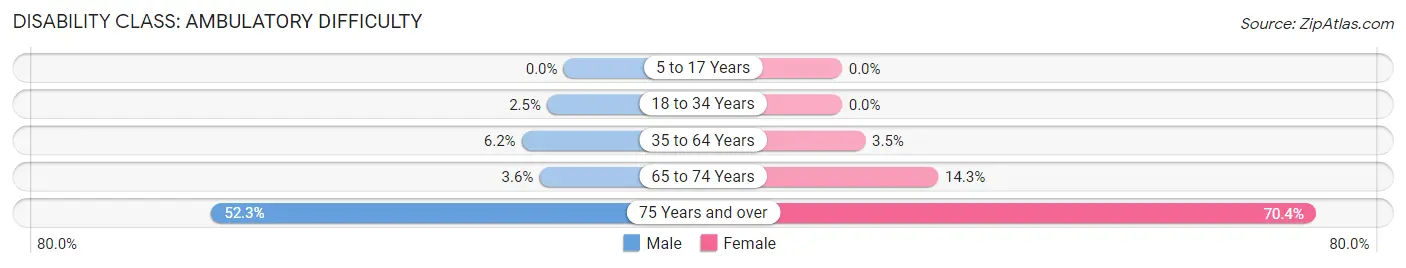
| Age Bracket | Male | Female |
| 5 to 17 Years | 0 (0.0%) | 0 (0.0%) |
| 18 to 34 Years | 7 (2.5%) | 0 (0.0%) |
| 35 to 64 Years | 28 (6.2%) | 15 (3.5%) |
| 65 to 74 Years | 6 (3.6%) | 21 (14.3%) |
| 75 Years and over | 23 (52.3%) | 76 (70.4%) |
Disability Class: Self-Care Difficulty
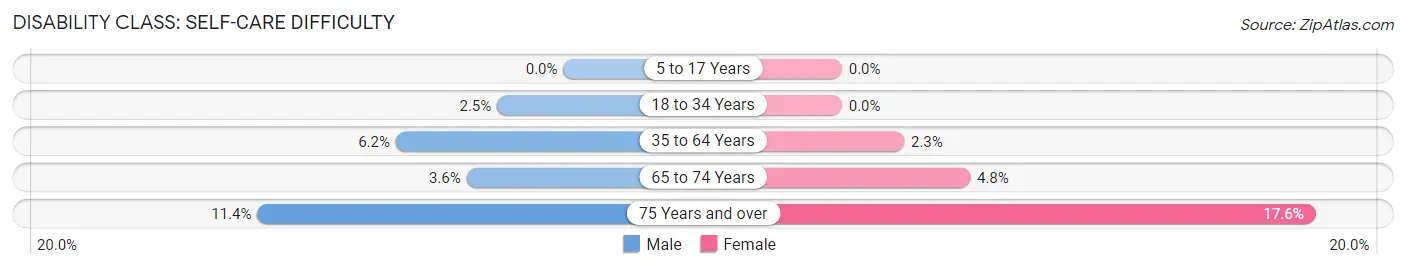
| Age Bracket | Male | Female |
| 5 to 17 Years | 0 (0.0%) | 0 (0.0%) |
| 18 to 34 Years | 7 (2.5%) | 0 (0.0%) |
| 35 to 64 Years | 28 (6.2%) | 10 (2.3%) |
| 65 to 74 Years | 6 (3.6%) | 7 (4.8%) |
| 75 Years and over | 5 (11.4%) | 19 (17.6%) |
Technology Access in New Ellenton
Computing Device Access in New Ellenton
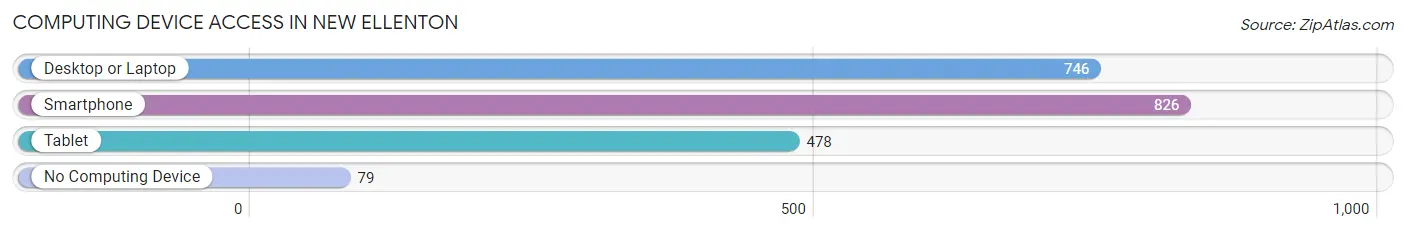
| Device Type | # Households | % Households |
| Desktop or Laptop | 746 | 77.1% |
| Smartphone | 826 | 85.3% |
| Tablet | 478 | 49.4% |
| No Computing Device | 79 | 8.2% |
| Total | 968 | 100.0% |
Internet Access in New Ellenton
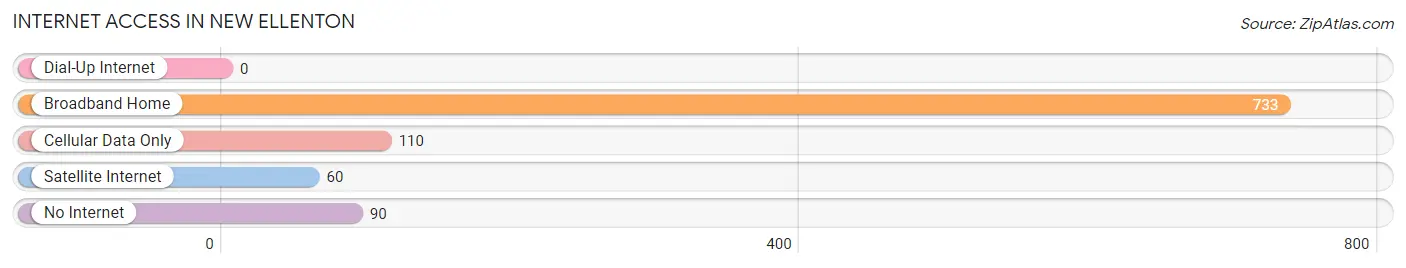
| Internet Type | # Households | % Households |
| Dial-Up Internet | 0 | 0.0% |
| Broadband Home | 733 | 75.7% |
| Cellular Data Only | 110 | 11.4% |
| Satellite Internet | 60 | 6.2% |
| No Internet | 90 | 9.3% |
| Total | 968 | 100.0% |
New Ellenton Summary
Ellenton, South Carolina is a small town located in Aiken County, South Carolina. It is situated on the banks of the Savannah River, just south of the city of Aiken. The town was founded in 1872 and was named after the Ellenton family, who were early settlers in the area. The town has a population of approximately 1,500 people and is part of the Augusta-Aiken metropolitan area.
History
The area that is now Ellenton was originally inhabited by the Catawba Indians. The first European settlers arrived in the area in the late 1700s. The town was founded in 1872 by the Ellenton family, who were early settlers in the area. The town was originally known as Ellenton Station, as it was a stop on the South Carolina Railroad. The town was officially incorporated in 1887.
In the early 1900s, Ellenton was a thriving agricultural community. The town was home to several cotton mills, as well as a sawmill and a gristmill. The town also had a hotel, a bank, and several stores.
In the 1950s, the town began to decline as the cotton mills closed and the population began to decline. The town was revitalized in the 1970s when the Savannah River Site was built nearby. The site is a nuclear power plant and is the largest employer in the area.
Geography
Ellenton is located in Aiken County, South Carolina. It is situated on the banks of the Savannah River, just south of the city of Aiken. The town is located in the Piedmont region of South Carolina, which is characterized by rolling hills and forests. The town is located about 25 miles from Augusta, Georgia and about 50 miles from Columbia, South Carolina.
Economy
The economy of Ellenton is largely based on the Savannah River Site, which is the largest employer in the area. The site is a nuclear power plant and provides jobs for many of the residents of Ellenton. Other major employers in the area include the Aiken County School District, the Aiken County Government, and the Aiken County Hospital.
The town also has several small businesses, including restaurants, retail stores, and service providers. The town also has several farms, which produce a variety of crops, including cotton, corn, and soybeans.
Demographics
As of the 2010 census, the population of Ellenton was 1,500. The racial makeup of the town was 79.2% White, 17.3% African American, 0.7% Native American, 0.7% Asian, 0.3% from other races, and 1.9% from two or more races. Hispanic or Latino of any race were 1.3% of the population.
The median income for a household in Ellenton was $37,500, and the median income for a family was $45,000. The per capita income for the town was $18,000. About 15.3% of families and 18.2% of the population were below the poverty line, including 25.3% of those under age 18 and 8.3% of those age 65 or over.
Ellenton is a small town with a rich history and a bright future. The town is home to a diverse population and is a great place to live and work. The town is home to several businesses and is a great place to raise a family. Ellenton is a great place to call home.
Common Questions
What is Per Capita Income in New Ellenton?
Per Capita income in New Ellenton is $30,469.
What is the Median Family Income in New Ellenton?
Median Family Income in New Ellenton is $54,500.
What is the Median Household income in New Ellenton?
Median Household Income in New Ellenton is $56,304.
What is Income or Wage Gap in New Ellenton?
Income or Wage Gap in New Ellenton is 24.5%.
Women in New Ellenton earn 75.5 cents for every dollar earned by a man.
What is Inequality or Gini Index in New Ellenton?
Inequality or Gini Index in New Ellenton is 0.39.
What is the Total Population of New Ellenton?
Total Population of New Ellenton is 2,508.
What is the Total Male Population of New Ellenton?
Total Male Population of New Ellenton is 1,185.
What is the Total Female Population of New Ellenton?
Total Female Population of New Ellenton is 1,323.
What is the Ratio of Males per 100 Females in New Ellenton?
There are 89.57 Males per 100 Females in New Ellenton.
What is the Ratio of Females per 100 Males in New Ellenton?
There are 111.65 Females per 100 Males in New Ellenton.
What is the Median Population Age in New Ellenton?
Median Population Age in New Ellenton is 37.6 Years.
What is the Average Family Size in New Ellenton
Average Family Size in New Ellenton is 3.1 People.
What is the Average Household Size in New Ellenton
Average Household Size in New Ellenton is 2.6 People.
How Large is the Labor Force in New Ellenton?
There are 1,320 People in the Labor Forcein in New Ellenton.
What is the Percentage of People in the Labor Force in New Ellenton?
63.9% of People are in the Labor Force in New Ellenton.
What is the Unemployment Rate in New Ellenton?
Unemployment Rate in New Ellenton is 4.2%.