Privateer, SC Map & Demographics
Privateer Map
Privateer Overview
$25,148
PER CAPITA INCOME
$79,688
AVG FAMILY INCOME
$59,116
AVG HOUSEHOLD INCOME
62.7%
WAGE / INCOME GAP [ % ]
37.3¢/ $1
WAGE / INCOME GAP [ $ ]
0.41
INEQUALITY / GINI INDEX
2,191
TOTAL POPULATION
1,119
MALE POPULATION
1,072
FEMALE POPULATION
104.38
MALES / 100 FEMALES
95.80
FEMALES / 100 MALES
40.2
MEDIAN AGE
3.8
AVG FAMILY SIZE
3.0
AVG HOUSEHOLD SIZE
877
LABOR FORCE [ PEOPLE ]
54.2%
PERCENT IN LABOR FORCE
11.2%
UNEMPLOYMENT RATE
Income in Privateer
Income Overview in Privateer
Per Capita Income in Privateer is $25,148, while median incomes of families and households are $79,688 and $59,116 respectively.
| Characteristic | Number | Measure |
| Per Capita Income | 2,191 | $25,148 |
| Median Family Income | 492 | $79,688 |
| Mean Family Income | 492 | $87,636 |
| Median Household Income | 741 | $59,116 |
| Mean Household Income | 741 | $71,209 |
| Income Deficit | 492 | $0 |
| Wage / Income Gap (%) | 2,191 | 62.69% |
| Wage / Income Gap ($) | 2,191 | 37.31¢ per $1 |
| Gini / Inequality Index | 2,191 | 0.41 |
Earnings by Sex in Privateer
Average Earnings in Privateer are $44,038, $58,851 for men and $21,959 for women, a difference of 62.7%.
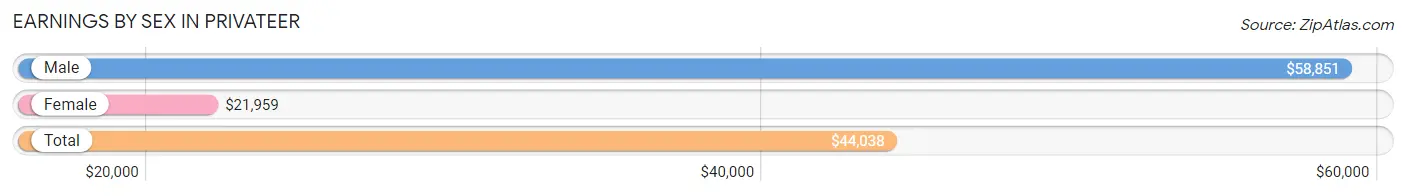
| Sex | Number | Average Earnings |
| Male | 540 (65.4%) | $58,851 |
| Female | 286 (34.6%) | $21,959 |
| Total | 826 (100.0%) | $44,038 |
Earnings by Sex by Income Bracket in Privateer
The most common earnings brackets in Privateer are $55,000 to $64,999 for men (178 | 33.0%) and $75,000 to $99,999 for women (66 | 23.1%).
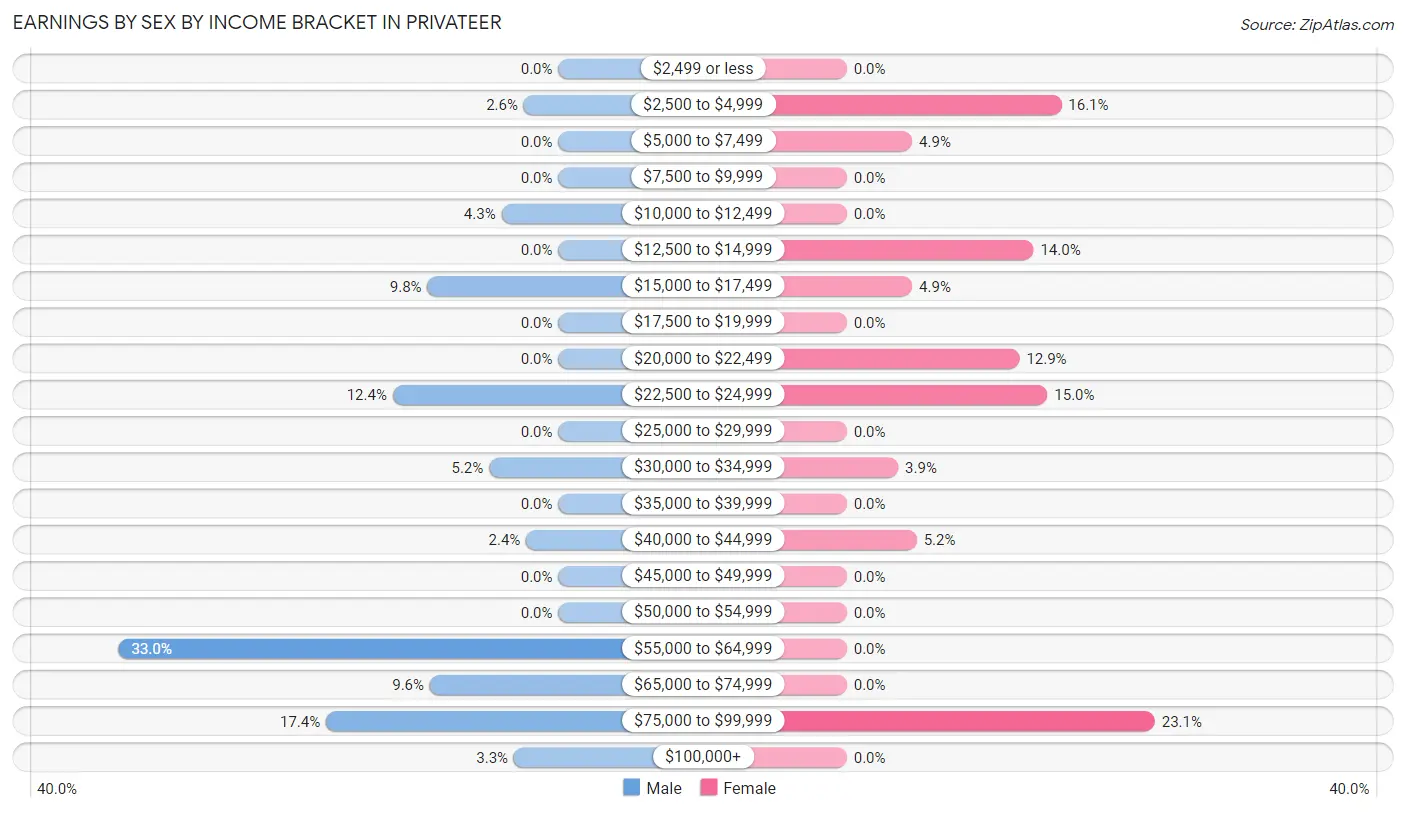
| Income | Male | Female |
| $2,499 or less | 0 (0.0%) | 0 (0.0%) |
| $2,500 to $4,999 | 14 (2.6%) | 46 (16.1%) |
| $5,000 to $7,499 | 0 (0.0%) | 14 (4.9%) |
| $7,500 to $9,999 | 0 (0.0%) | 0 (0.0%) |
| $10,000 to $12,499 | 23 (4.3%) | 0 (0.0%) |
| $12,500 to $14,999 | 0 (0.0%) | 40 (14.0%) |
| $15,000 to $17,499 | 53 (9.8%) | 14 (4.9%) |
| $17,500 to $19,999 | 0 (0.0%) | 0 (0.0%) |
| $20,000 to $22,499 | 0 (0.0%) | 37 (12.9%) |
| $22,500 to $24,999 | 67 (12.4%) | 43 (15.0%) |
| $25,000 to $29,999 | 0 (0.0%) | 0 (0.0%) |
| $30,000 to $34,999 | 28 (5.2%) | 11 (3.8%) |
| $35,000 to $39,999 | 0 (0.0%) | 0 (0.0%) |
| $40,000 to $44,999 | 13 (2.4%) | 15 (5.2%) |
| $45,000 to $49,999 | 0 (0.0%) | 0 (0.0%) |
| $50,000 to $54,999 | 0 (0.0%) | 0 (0.0%) |
| $55,000 to $64,999 | 178 (33.0%) | 0 (0.0%) |
| $65,000 to $74,999 | 52 (9.6%) | 0 (0.0%) |
| $75,000 to $99,999 | 94 (17.4%) | 66 (23.1%) |
| $100,000+ | 18 (3.3%) | 0 (0.0%) |
| Total | 540 (100.0%) | 286 (100.0%) |
Earnings by Sex by Educational Attainment in Privateer
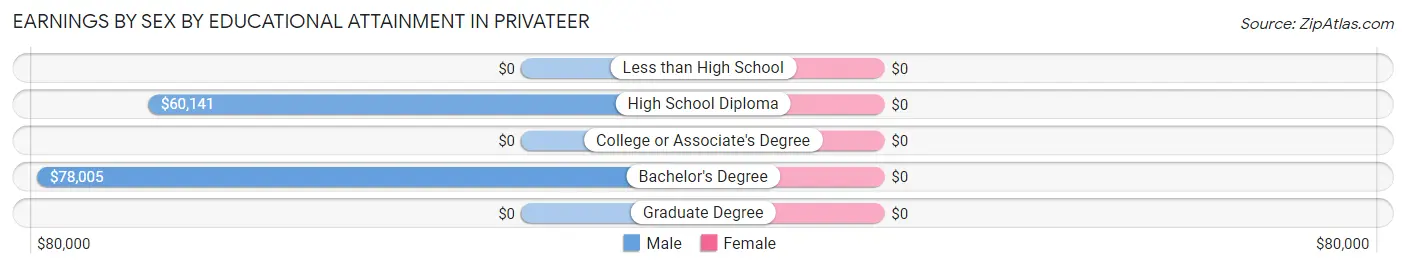
| Educational Attainment | Male Income | Female Income |
| Less than High School | - | - |
| High School Diploma | $60,141 | $0 |
| College or Associate's Degree | - | - |
| Bachelor's Degree | $78,005 | $0 |
| Graduate Degree | - | - |
| Total | $59,611 | $20,507 |
Family Income in Privateer
Family Income Brackets in Privateer
According to the Privateer family income data, there are 98 families falling into the $100,000 to $149,999 income range, which is the most common income bracket and makes up 19.9% of all families.
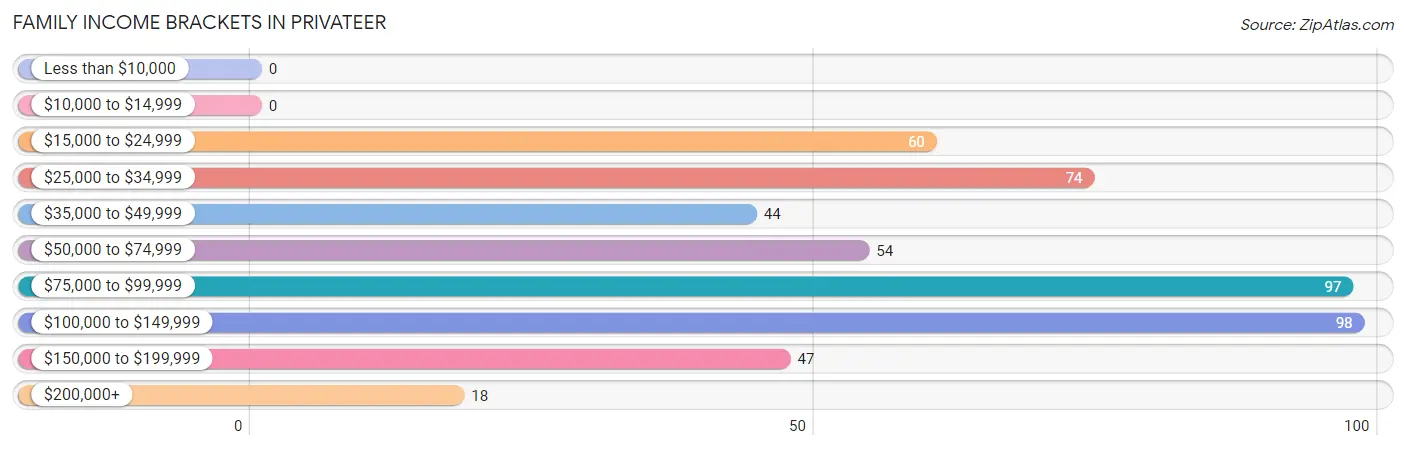
| Income Bracket | # Families | % Families |
| Less than $10,000 | 0 | 0.0% |
| $10,000 to $14,999 | 0 | 0.0% |
| $15,000 to $24,999 | 60 | 12.2% |
| $25,000 to $34,999 | 74 | 15.0% |
| $35,000 to $49,999 | 44 | 8.9% |
| $50,000 to $74,999 | 54 | 11.0% |
| $75,000 to $99,999 | 97 | 19.7% |
| $100,000 to $149,999 | 98 | 19.9% |
| $150,000 to $199,999 | 47 | 9.6% |
| $200,000+ | 18 | 3.7% |
Family Income by Famaliy Size in Privateer
4-person families (171 | 34.8%) account for the highest median family income in Privateer with $84,306 per family, while 3-person families (106 | 21.5%) have the highest median income of $23,444 per family member.
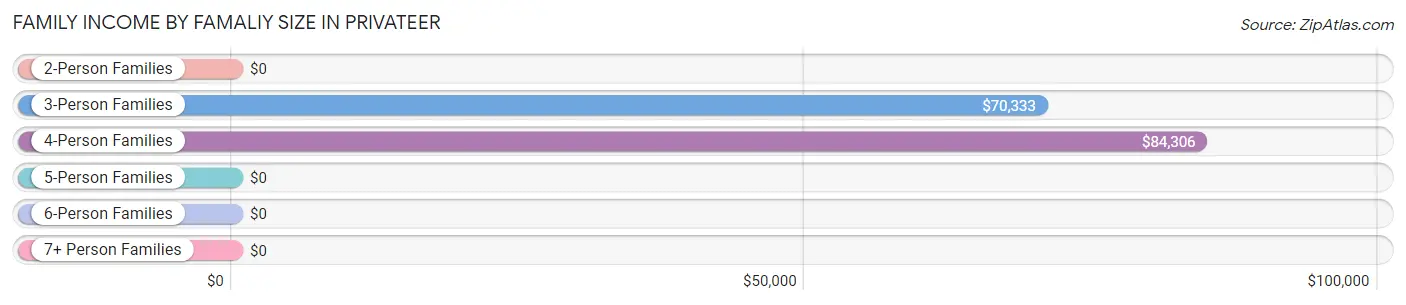
| Income Bracket | # Families | Median Income |
| 2-Person Families | 186 (37.8%) | $0 |
| 3-Person Families | 106 (21.5%) | $70,333 |
| 4-Person Families | 171 (34.8%) | $84,306 |
| 5-Person Families | 29 (5.9%) | $0 |
| 6-Person Families | 0 (0.0%) | $0 |
| 7+ Person Families | 0 (0.0%) | $0 |
| Total | 492 (100.0%) | $79,688 |
Family Income by Number of Earners in Privateer
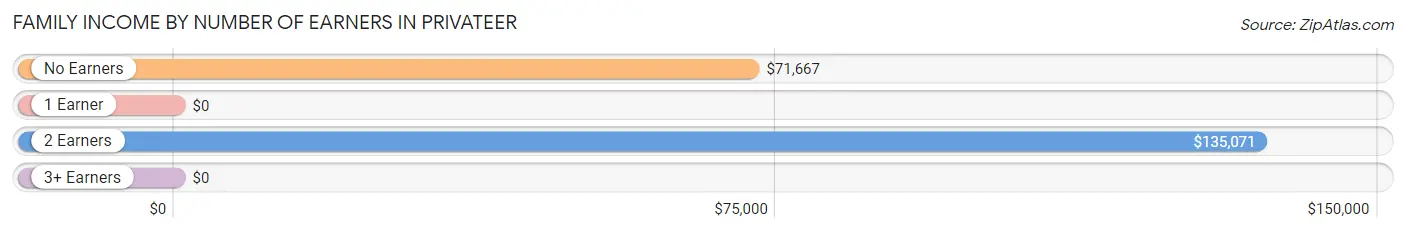
| Number of Earners | # Families | Median Income |
| No Earners | 62 (12.6%) | $71,667 |
| 1 Earner | 276 (56.1%) | $0 |
| 2 Earners | 139 (28.2%) | $135,071 |
| 3+ Earners | 15 (3.0%) | $0 |
| Total | 492 (100.0%) | $79,688 |
Household Income in Privateer
Household Income Brackets in Privateer
With 132 households falling in the category, the $50,000 to $74,999 income range is the most frequent in Privateer, accounting for 17.8% of all households.
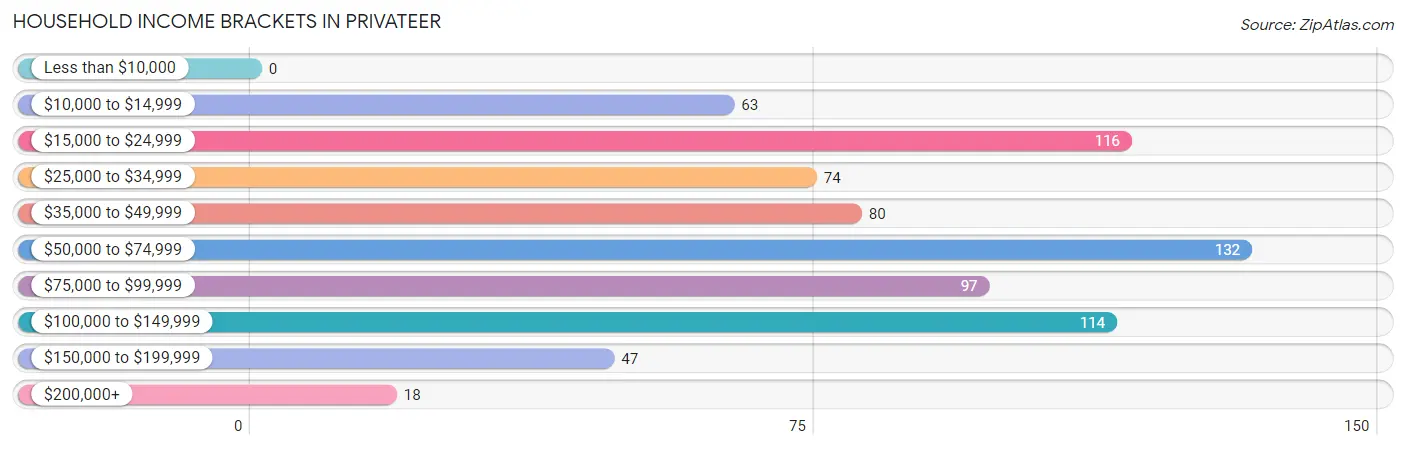
| Income Bracket | # Households | % Households |
| Less than $10,000 | 0 | 0.0% |
| $10,000 to $14,999 | 63 | 8.5% |
| $15,000 to $24,999 | 116 | 15.7% |
| $25,000 to $34,999 | 74 | 10.0% |
| $35,000 to $49,999 | 80 | 10.8% |
| $50,000 to $74,999 | 132 | 17.8% |
| $75,000 to $99,999 | 97 | 13.1% |
| $100,000 to $149,999 | 114 | 15.4% |
| $150,000 to $199,999 | 47 | 6.3% |
| $200,000+ | 18 | 2.4% |
Household Income by Householder Age in Privateer
The median household income in Privateer is $59,116, with the highest median household income of $82,917 found in the 25 to 44 years age bracket for the primary householder. A total of 227 households (30.6%) fall into this category. Meanwhile, the 15 to 24 years age bracket for the primary householder has the lowest median household income of $0, with 43 households (5.8%) in this group.
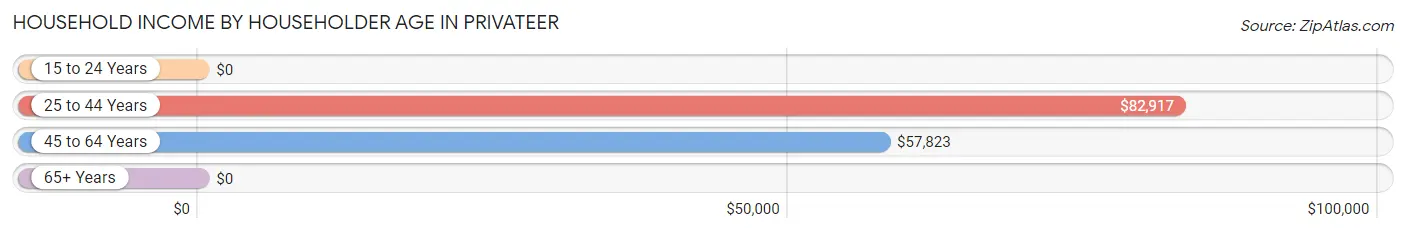
| Income Bracket | # Households | Median Income |
| 15 to 24 Years | 43 (5.8%) | $0 |
| 25 to 44 Years | 227 (30.6%) | $82,917 |
| 45 to 64 Years | 289 (39.0%) | $57,823 |
| 65+ Years | 182 (24.6%) | $0 |
| Total | 741 (100.0%) | $59,116 |
Poverty in Privateer
Income Below Poverty by Sex and Age in Privateer
With 8.8% poverty level for males and 15.2% for females among the residents of Privateer, 75 year old and over males and 75 year old and over females are the most vulnerable to poverty, with 8 males (34.8%) and 21 females (61.8%) in their respective age groups living below the poverty level.
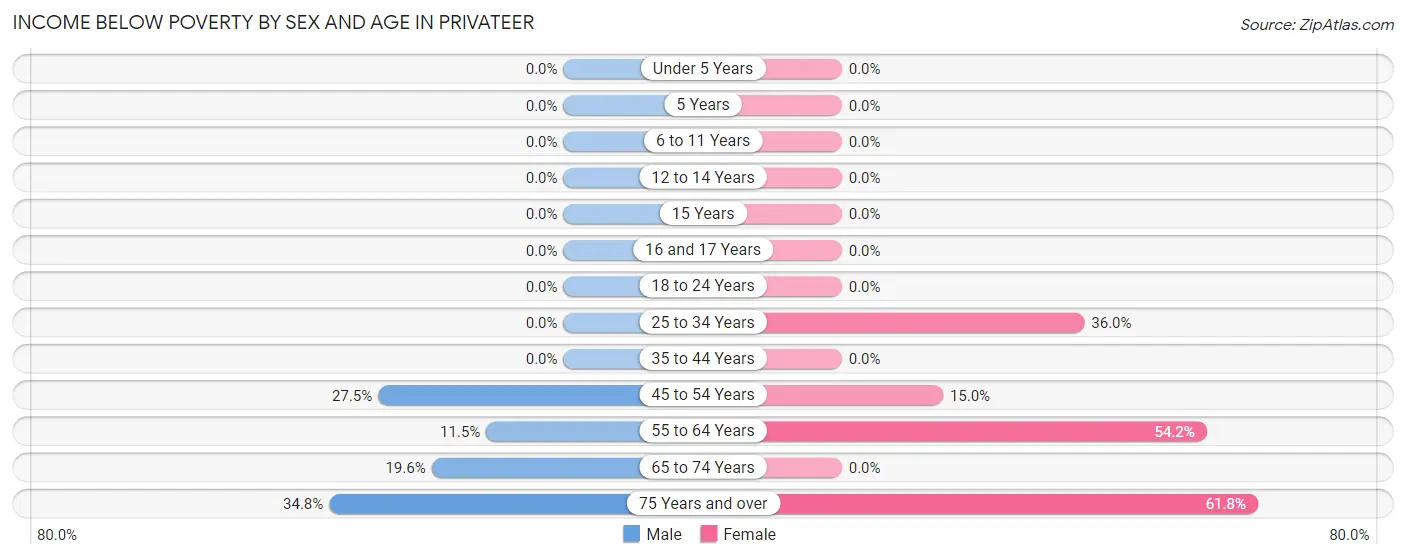
| Age Bracket | Male | Female |
| Under 5 Years | 0 (0.0%) | 0 (0.0%) |
| 5 Years | 0 (0.0%) | 0 (0.0%) |
| 6 to 11 Years | 0 (0.0%) | 0 (0.0%) |
| 12 to 14 Years | 0 (0.0%) | 0 (0.0%) |
| 15 Years | 0 (0.0%) | 0 (0.0%) |
| 16 and 17 Years | 0 (0.0%) | 0 (0.0%) |
| 18 to 24 Years | 0 (0.0%) | 0 (0.0%) |
| 25 to 34 Years | 0 (0.0%) | 58 (36.0%) |
| 35 to 44 Years | 0 (0.0%) | 0 (0.0%) |
| 45 to 54 Years | 52 (27.5%) | 32 (15.0%) |
| 55 to 64 Years | 11 (11.5%) | 52 (54.2%) |
| 65 to 74 Years | 28 (19.6%) | 0 (0.0%) |
| 75 Years and over | 8 (34.8%) | 21 (61.8%) |
| Total | 99 (8.8%) | 163 (15.2%) |
Income Above Poverty by Sex and Age in Privateer
According to the poverty statistics in Privateer, males aged under 5 years and females aged 6 to 11 years are the age groups that are most secure financially, with 100.0% of males and 100.0% of females in these age groups living above the poverty line.
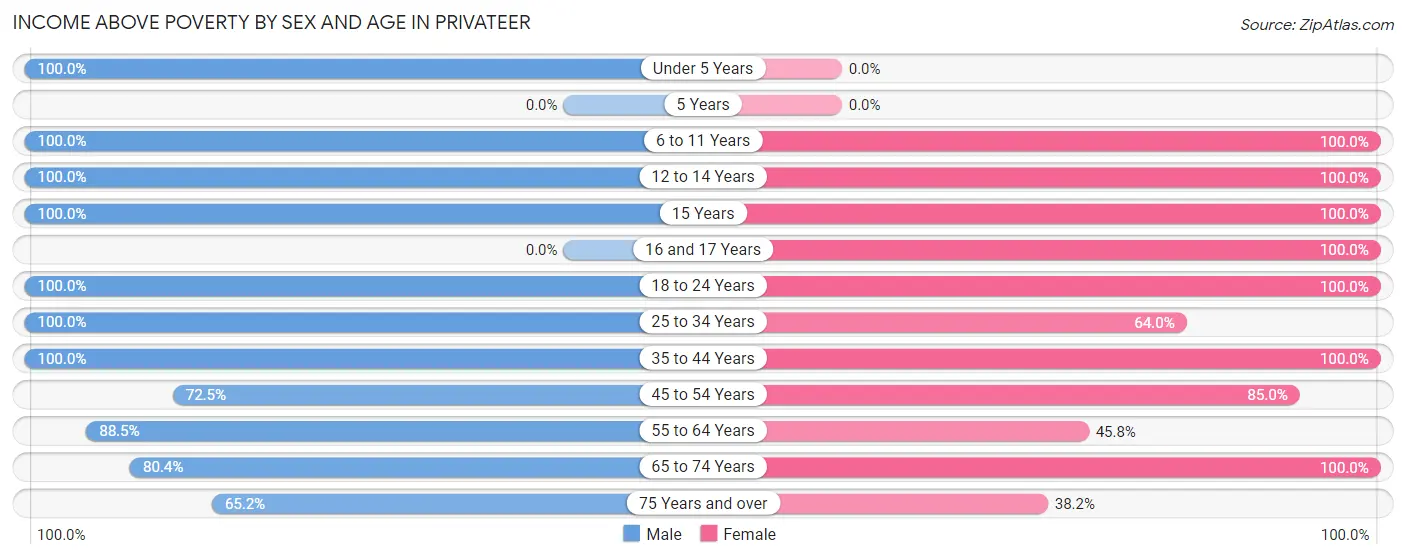
| Age Bracket | Male | Female |
| Under 5 Years | 158 (100.0%) | 0 (0.0%) |
| 5 Years | 0 (0.0%) | 0 (0.0%) |
| 6 to 11 Years | 141 (100.0%) | 89 (100.0%) |
| 12 to 14 Years | 45 (100.0%) | 101 (100.0%) |
| 15 Years | 22 (100.0%) | 16 (100.0%) |
| 16 and 17 Years | 0 (0.0%) | 10 (100.0%) |
| 18 to 24 Years | 45 (100.0%) | 93 (100.0%) |
| 25 to 34 Years | 144 (100.0%) | 103 (64.0%) |
| 35 to 44 Years | 113 (100.0%) | 123 (100.0%) |
| 45 to 54 Years | 137 (72.5%) | 181 (85.0%) |
| 55 to 64 Years | 85 (88.5%) | 44 (45.8%) |
| 65 to 74 Years | 115 (80.4%) | 136 (100.0%) |
| 75 Years and over | 15 (65.2%) | 13 (38.2%) |
| Total | 1,020 (91.1%) | 909 (84.8%) |
Income Below Poverty Among Married-Couple Families in Privateer
The poverty statistics for married-couple families in Privateer show that 10.2% or 40 of the total 393 families live below the poverty line. Families with no children have the highest poverty rate of 18.3%, comprising of 40 families. On the other hand, families with 1 or 2 children have the lowest poverty rate of 0.0%, which includes 0 families.
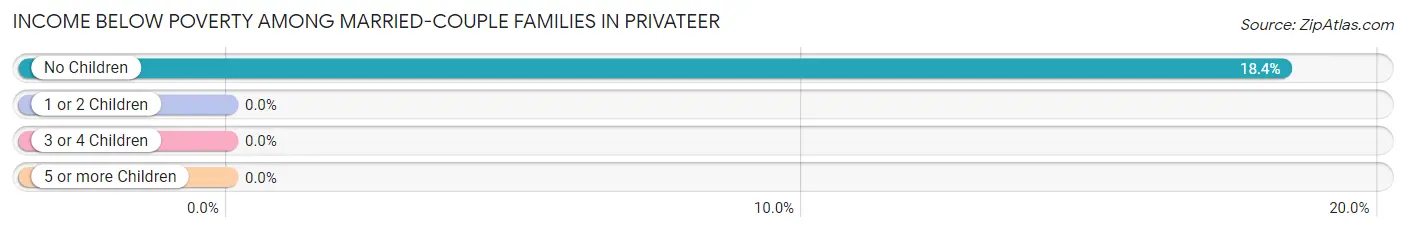
| Children | Above Poverty | Below Poverty |
| No Children | 178 (81.7%) | 40 (18.3%) |
| 1 or 2 Children | 175 (100.0%) | 0 (0.0%) |
| 3 or 4 Children | 0 (0.0%) | 0 (0.0%) |
| 5 or more Children | 0 (0.0%) | 0 (0.0%) |
| Total | 353 (89.8%) | 40 (10.2%) |
Income Below Poverty Among Single-Parent Households in Privateer
| Children | Single Father | Single Mother |
| No Children | 0 (0.0%) | 0 (0.0%) |
| 1 or 2 Children | 0 (0.0%) | 0 (0.0%) |
| 3 or 4 Children | 0 (0.0%) | 0 (0.0%) |
| 5 or more Children | 0 (0.0%) | 0 (0.0%) |
| Total | 0 (0.0%) | 0 (0.0%) |
Income Below Poverty Among Married-Couple vs Single-Parent Households in Privateer
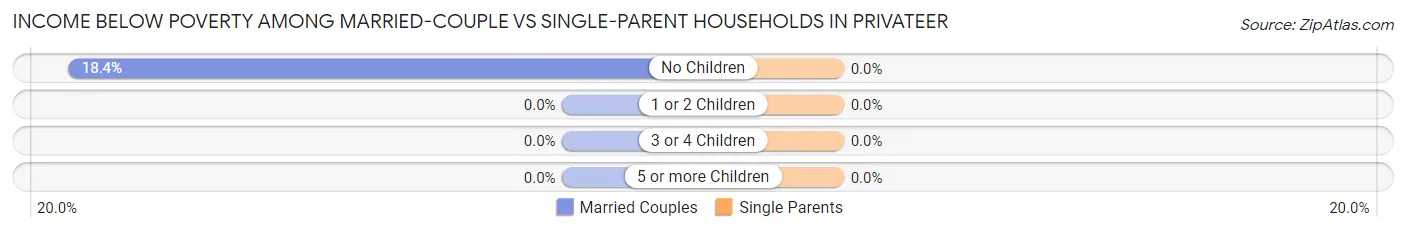
| Children | Married-Couple Families | Single-Parent Households |
| No Children | 40 (18.3%) | 0 (0.0%) |
| 1 or 2 Children | 0 (0.0%) | 0 (0.0%) |
| 3 or 4 Children | 0 (0.0%) | 0 (0.0%) |
| 5 or more Children | 0 (0.0%) | 0 (0.0%) |
| Total | 40 (10.2%) | 0 (0.0%) |
Race in Privateer
The most populous races in Privateer are White / Caucasian (1,972 | 90.0%), Black / African American (144 | 6.6%), and Two or more Races (75 | 3.4%).
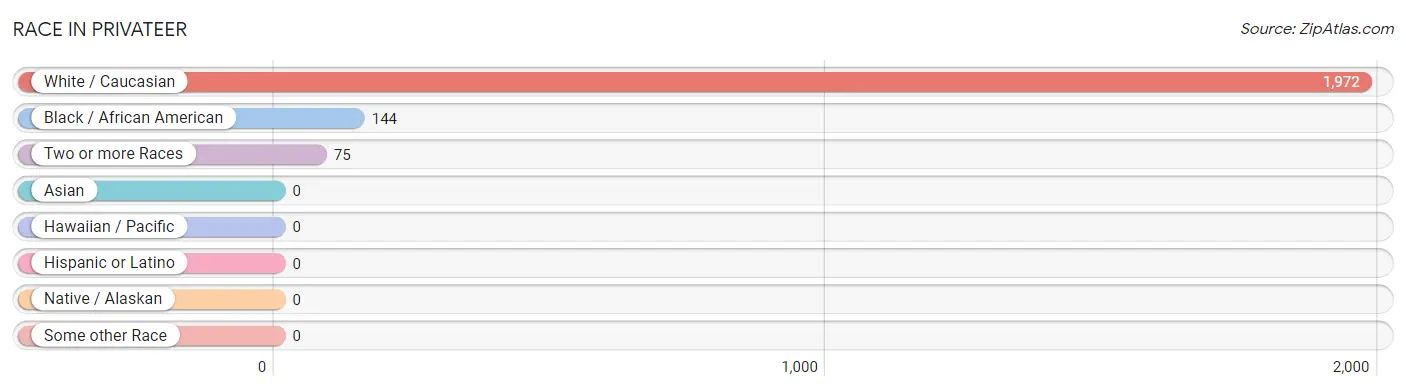
| Race | # Population | % Population |
| Asian | 0 | 0.0% |
| Black / African American | 144 | 6.6% |
| Hawaiian / Pacific | 0 | 0.0% |
| Hispanic or Latino | 0 | 0.0% |
| Native / Alaskan | 0 | 0.0% |
| White / Caucasian | 1,972 | 90.0% |
| Two or more Races | 75 | 3.4% |
| Some other Race | 0 | 0.0% |
| Total | 2,191 | 100.0% |
Ancestry in Privateer
The most populous ancestries reported in Privateer are Irish (217 | 9.9%), European (188 | 8.6%), English (168 | 7.7%), American (164 | 7.5%), and Italian (121 | 5.5%), together accounting for 39.2% of all Privateer residents.
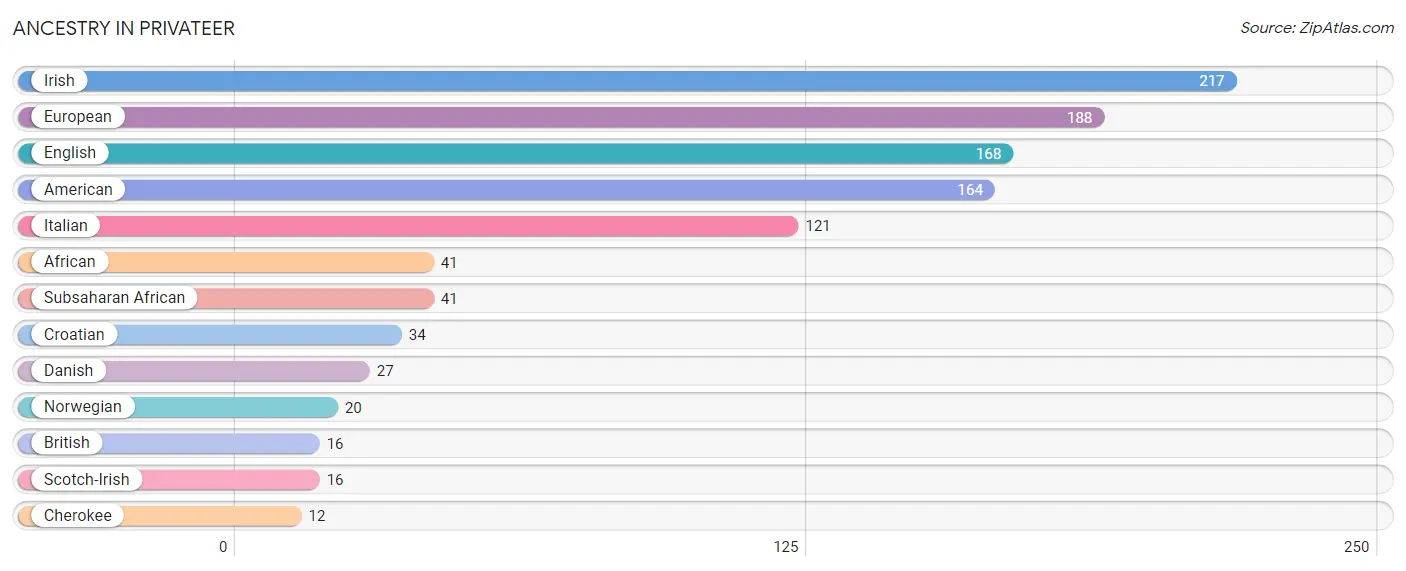
| Ancestry | # Population | % Population |
| African | 41 | 1.9% |
| American | 164 | 7.5% |
| British | 16 | 0.7% |
| Cherokee | 12 | 0.5% |
| Croatian | 34 | 1.5% |
| Danish | 27 | 1.2% |
| English | 168 | 7.7% |
| European | 188 | 8.6% |
| Irish | 217 | 9.9% |
| Italian | 121 | 5.5% |
| Norwegian | 20 | 0.9% |
| Scotch-Irish | 16 | 0.7% |
| Subsaharan African | 41 | 1.9% | View All 13 Rows |
Immigrants in Privateer

| Immigration Origin | # Population | % Population | View All 0 Rows |
Sex and Age in Privateer
Sex and Age in Privateer
The most populous age groups in Privateer are Under 5 Years (158 | 14.1%) for men and 50 to 54 Years (156 | 14.5%) for women.
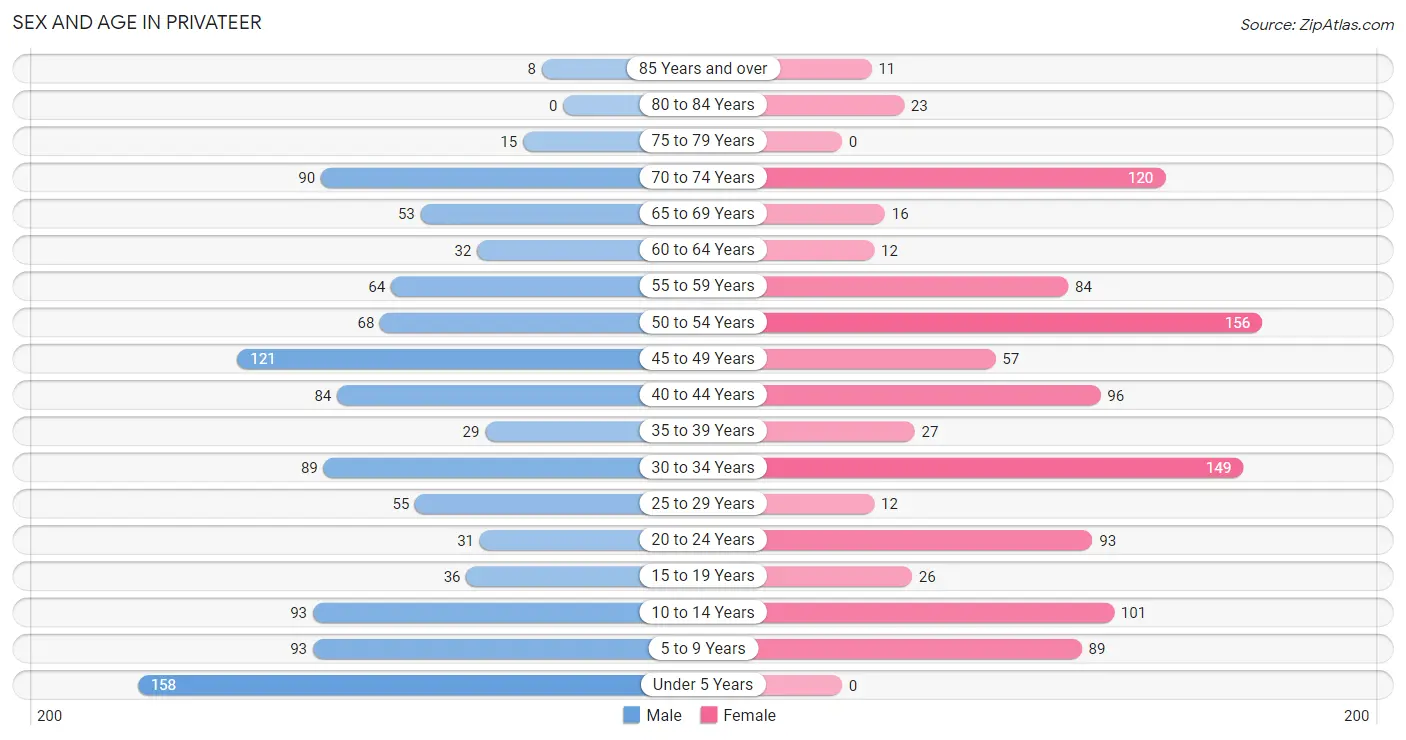
| Age Bracket | Male | Female |
| Under 5 Years | 158 (14.1%) | 0 (0.0%) |
| 5 to 9 Years | 93 (8.3%) | 89 (8.3%) |
| 10 to 14 Years | 93 (8.3%) | 101 (9.4%) |
| 15 to 19 Years | 36 (3.2%) | 26 (2.4%) |
| 20 to 24 Years | 31 (2.8%) | 93 (8.7%) |
| 25 to 29 Years | 55 (4.9%) | 12 (1.1%) |
| 30 to 34 Years | 89 (8.0%) | 149 (13.9%) |
| 35 to 39 Years | 29 (2.6%) | 27 (2.5%) |
| 40 to 44 Years | 84 (7.5%) | 96 (9.0%) |
| 45 to 49 Years | 121 (10.8%) | 57 (5.3%) |
| 50 to 54 Years | 68 (6.1%) | 156 (14.5%) |
| 55 to 59 Years | 64 (5.7%) | 84 (7.8%) |
| 60 to 64 Years | 32 (2.9%) | 12 (1.1%) |
| 65 to 69 Years | 53 (4.7%) | 16 (1.5%) |
| 70 to 74 Years | 90 (8.0%) | 120 (11.2%) |
| 75 to 79 Years | 15 (1.3%) | 0 (0.0%) |
| 80 to 84 Years | 0 (0.0%) | 23 (2.1%) |
| 85 Years and over | 8 (0.7%) | 11 (1.0%) |
| Total | 1,119 (100.0%) | 1,072 (100.0%) |
Families and Households in Privateer
Median Family Size in Privateer
The median family size in Privateer is 3.79 persons per family, with single female/mother families (71 | 14.4%) accounting for the largest median family size of 5.94 persons per family. On the other hand, single male/father families (28 | 5.7%) represent the smallest median family size with 2.14 persons per family.
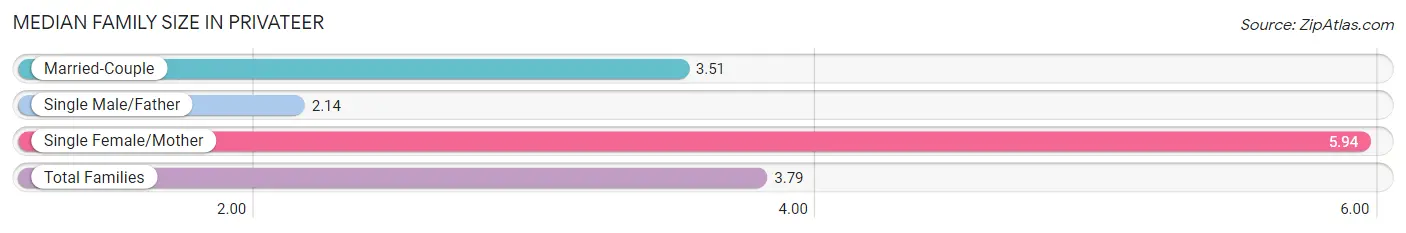
| Family Type | # Families | Family Size |
| Married-Couple | 393 (79.9%) | 3.51 |
| Single Male/Father | 28 (5.7%) | 2.14 |
| Single Female/Mother | 71 (14.4%) | 5.94 |
| Total Families | 492 (100.0%) | 3.79 |
Median Household Size in Privateer
The median household size in Privateer is 2.96 persons per household, with single female/mother households (71 | 9.6%) accounting for the largest median household size of 6.45 persons per household. non-family households (249 | 33.6%) represent the smallest median household size with 1.12 persons per household.
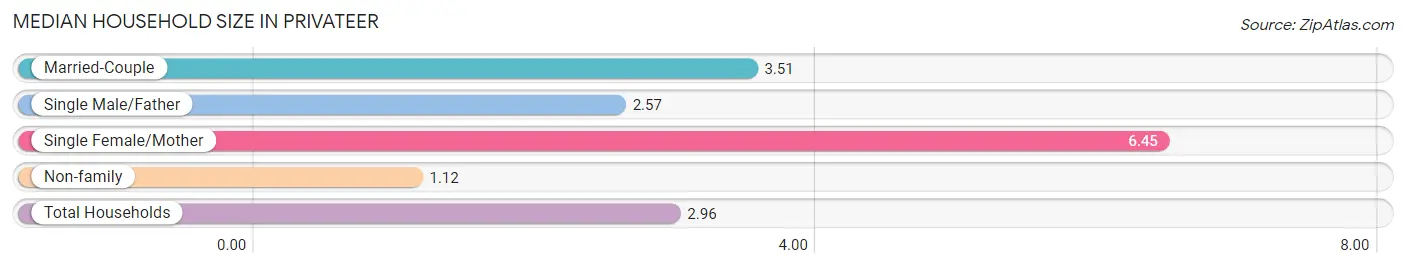
| Household Type | # Households | Household Size |
| Married-Couple | 393 (53.0%) | 3.51 |
| Single Male/Father | 28 (3.8%) | 2.57 |
| Single Female/Mother | 71 (9.6%) | 6.45 |
| Non-family | 249 (33.6%) | 1.12 |
| Total Households | 741 (100.0%) | 2.96 |
Household Size by Marriage Status in Privateer
Out of a total of 741 households in Privateer, 492 (66.4%) are family households, while 249 (33.6%) are nonfamily households. The most numerous type of family households are 2-person households, comprising 162, and the most common type of nonfamily households are 1-person households, comprising 206.
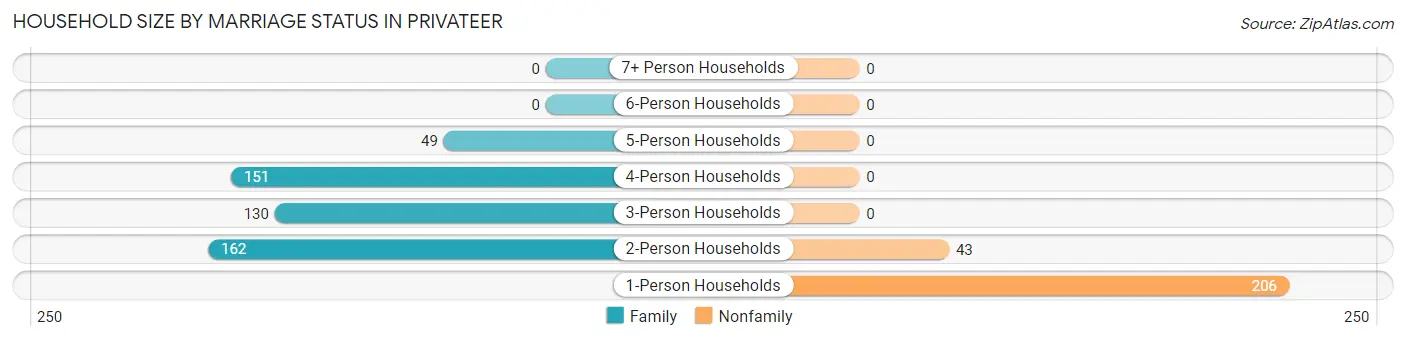
| Household Size | Family Households | Nonfamily Households |
| 1-Person Households | - | 206 (27.8%) |
| 2-Person Households | 162 (21.9%) | 43 (5.8%) |
| 3-Person Households | 130 (17.5%) | 0 (0.0%) |
| 4-Person Households | 151 (20.4%) | 0 (0.0%) |
| 5-Person Households | 49 (6.6%) | 0 (0.0%) |
| 6-Person Households | 0 (0.0%) | 0 (0.0%) |
| 7+ Person Households | 0 (0.0%) | 0 (0.0%) |
| Total | 492 (66.4%) | 249 (33.6%) |
Female Fertility in Privateer
Fertility by Age in Privateer
Average fertility rate in Privateer is 202.0 births per 1,000 women. Women in the age bracket of 20 to 34 years have the highest fertility rate with 366.0 births per 1,000 women. Women in the age bracket of 20 to 34 years acount for 100.0% of all women with births.
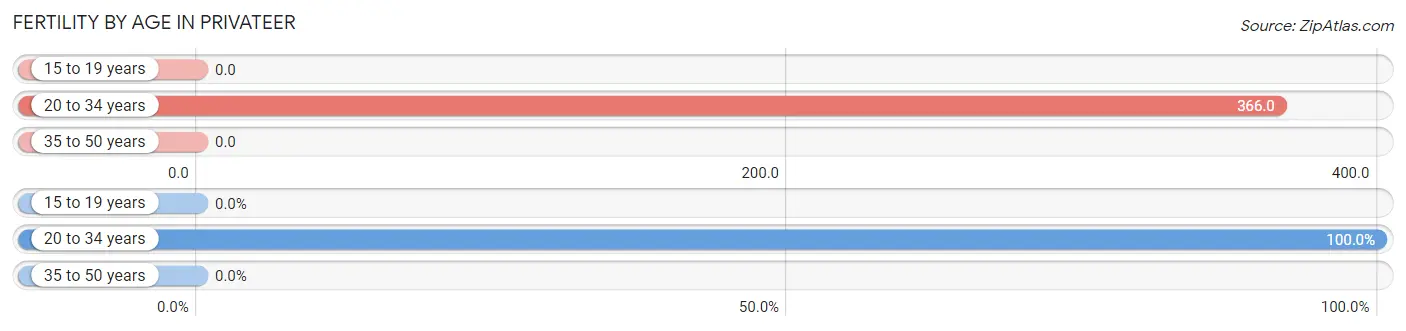
| Age Bracket | Women with Births | Births / 1,000 Women |
| 15 to 19 years | 0 (0.0%) | 0.0 |
| 20 to 34 years | 93 (100.0%) | 366.0 |
| 35 to 50 years | 0 (0.0%) | 0.0 |
| Total | 93 (100.0%) | 202.0 |
Fertility by Age by Marriage Status in Privateer
53.8% of women with births (93) in Privateer are married. The highest percentage of unmarried women with births falls into 20 to 34 years age bracket with 46.2% of them unmarried at the time of birth, while the lowest percentage of unmarried women with births belong to 20 to 34 years age bracket with 46.2% of them unmarried.
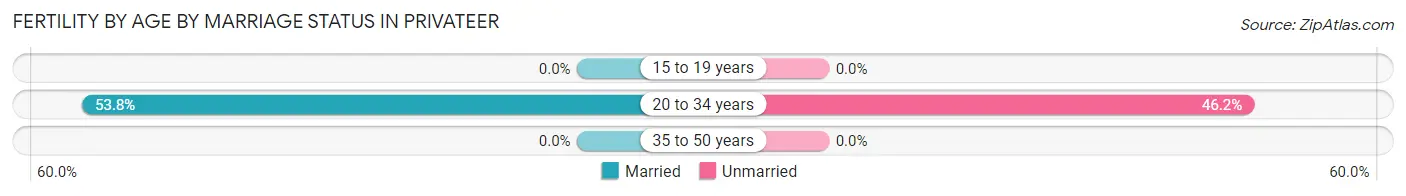
| Age Bracket | Married | Unmarried |
| 15 to 19 years | 0 (0.0%) | 0 (0.0%) |
| 20 to 34 years | 50 (53.8%) | 43 (46.2%) |
| 35 to 50 years | 0 (0.0%) | 0 (0.0%) |
| Total | 50 (53.8%) | 43 (46.2%) |
Fertility by Education in Privateer
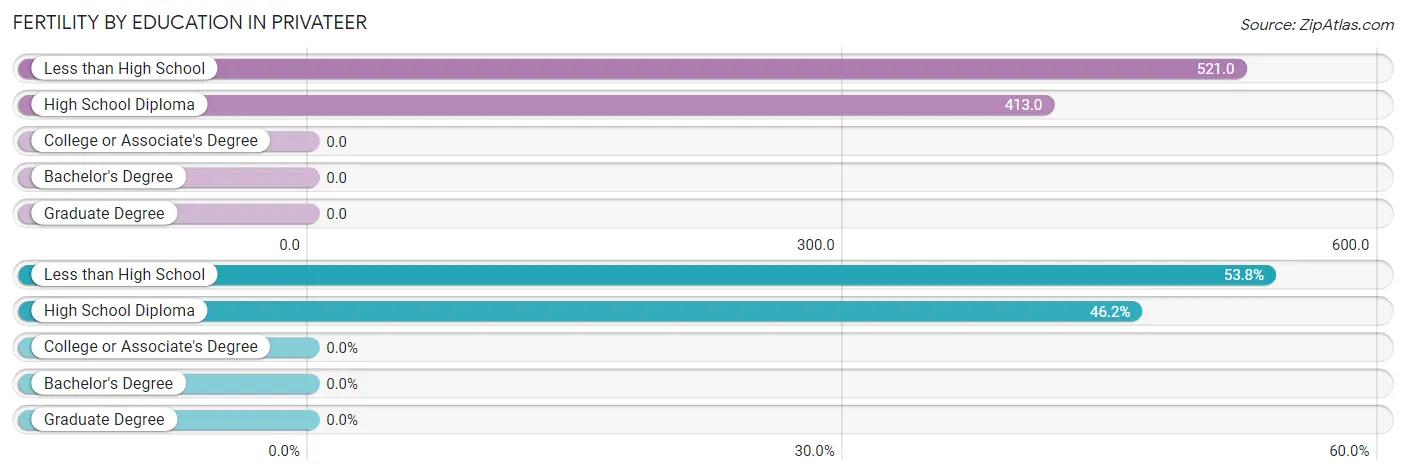
| Educational Attainment | Women with Births | Births / 1,000 Women |
| Less than High School | 50 (53.8%) | 521.0 |
| High School Diploma | 43 (46.2%) | 413.0 |
| College or Associate's Degree | 0 (0.0%) | 0.0 |
| Bachelor's Degree | 0 (0.0%) | 0.0 |
| Graduate Degree | 0 (0.0%) | 0.0 |
| Total | 93 (100.0%) | 202.0 |
Fertility by Education by Marriage Status in Privateer
46.2% of women with births in Privateer are unmarried. Women with the educational attainment of less than high school are most likely to be married with 100.0% of them married at childbirth, while women with the educational attainment of high school diploma are least likely to be married with 100.0% of them unmarried at childbirth.
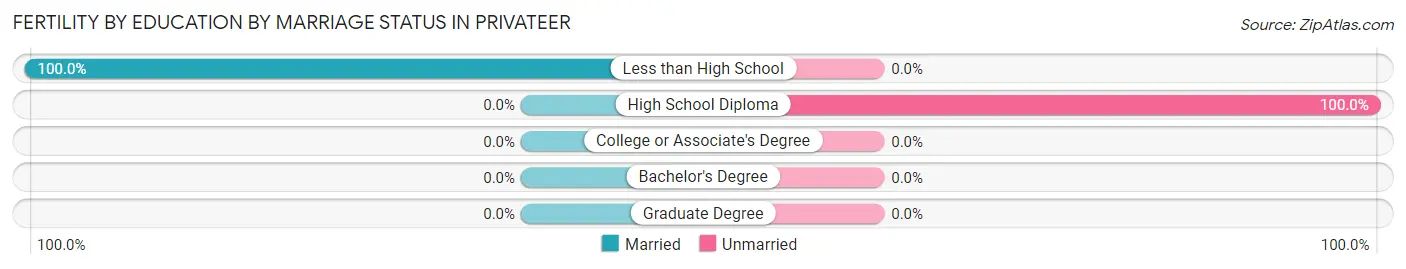
| Educational Attainment | Married | Unmarried |
| Less than High School | 50 (100.0%) | 0 (0.0%) |
| High School Diploma | 0 (0.0%) | 43 (100.0%) |
| College or Associate's Degree | 0 (0.0%) | 0 (0.0%) |
| Bachelor's Degree | 0 (0.0%) | 0 (0.0%) |
| Graduate Degree | 0 (0.0%) | 0 (0.0%) |
| Total | 50 (53.8%) | 43 (46.2%) |
Employment Characteristics in Privateer
Employment by Class of Employer in Privateer
Among the 758 employed individuals in Privateer, private company employees (496 | 65.4%), self-employed (not incorporated) (70 | 9.2%), and not-for-profit organizations (59 | 7.8%) make up the most common classes of employment.
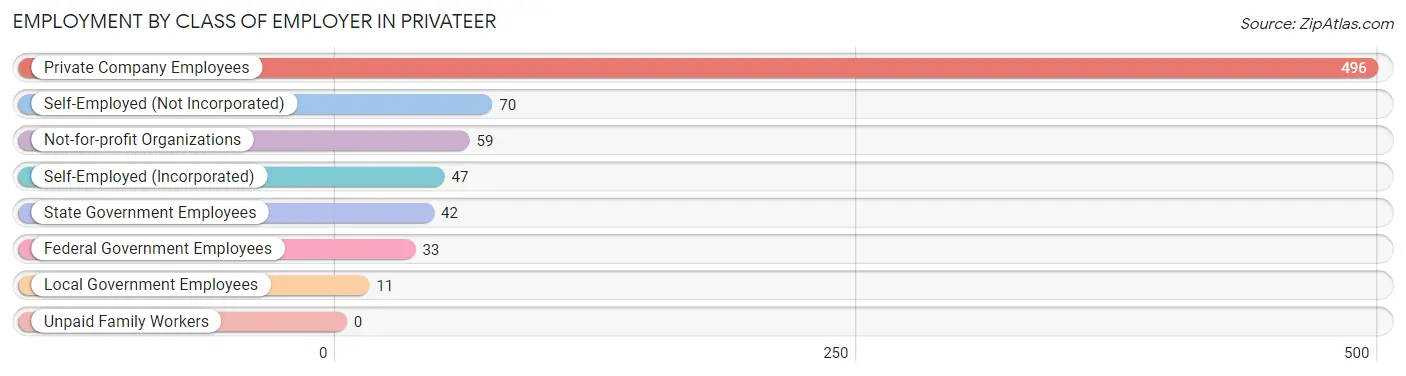
| Employer Class | # Employees | % Employees |
| Private Company Employees | 496 | 65.4% |
| Self-Employed (Incorporated) | 47 | 6.2% |
| Self-Employed (Not Incorporated) | 70 | 9.2% |
| Not-for-profit Organizations | 59 | 7.8% |
| Local Government Employees | 11 | 1.5% |
| State Government Employees | 42 | 5.5% |
| Federal Government Employees | 33 | 4.3% |
| Unpaid Family Workers | 0 | 0.0% |
| Total | 758 | 100.0% |
Employment Status by Age in Privateer
According to the labor force statistics for Privateer, out of the total population over 16 years of age (1,619), 54.2% or 877 individuals are in the labor force, with 11.2% or 98 of them unemployed. The age group with the highest labor force participation rate is 30 to 34 years, with 93.7% or 223 individuals in the labor force. Within the labor force, the 16 to 19 years age range has the highest percentage of unemployed individuals, with 100.0% or 14 of them being unemployed.
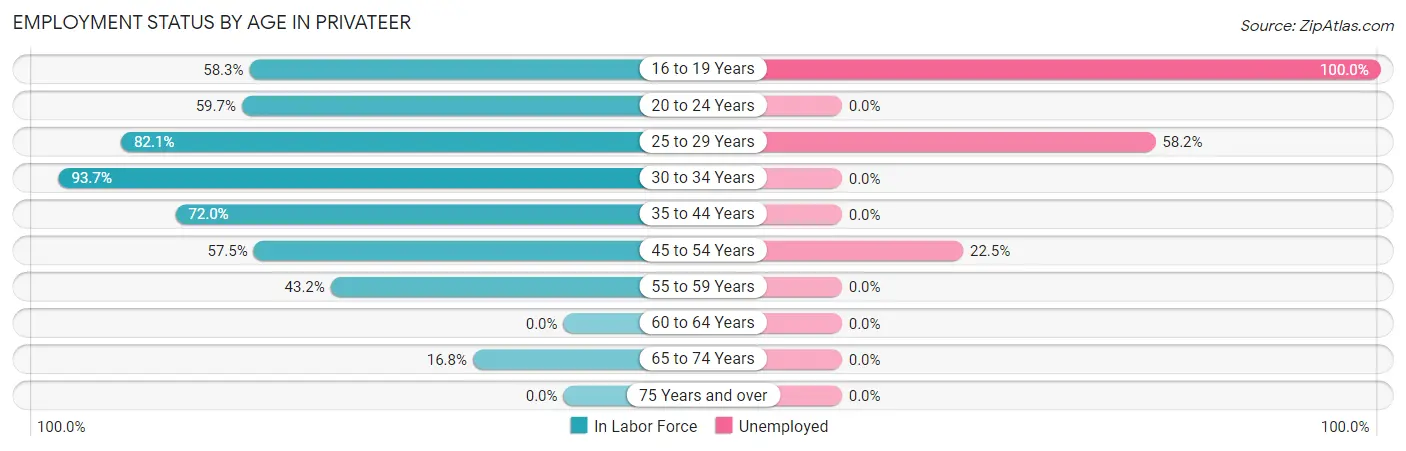
| Age Bracket | In Labor Force | Unemployed |
| 16 to 19 Years | 14 (58.3%) | 14 (100.0%) |
| 20 to 24 Years | 74 (59.7%) | 0 (0.0%) |
| 25 to 29 Years | 55 (82.1%) | 32 (58.2%) |
| 30 to 34 Years | 223 (93.7%) | 0 (0.0%) |
| 35 to 44 Years | 170 (72.0%) | 0 (0.0%) |
| 45 to 54 Years | 231 (57.5%) | 52 (22.5%) |
| 55 to 59 Years | 64 (43.2%) | 0 (0.0%) |
| 60 to 64 Years | 0 (0.0%) | 0 (0.0%) |
| 65 to 74 Years | 47 (16.8%) | 0 (0.0%) |
| 75 Years and over | 0 (0.0%) | 0 (0.0%) |
| Total | 877 (54.2%) | 98 (11.2%) |
Employment Status by Educational Attainment in Privateer
According to labor force statistics for Privateer, 65.5% of individuals (743) out of the total population between 25 and 64 years of age (1,135) are in the labor force, with 11.3% or 84 of them being unemployed. The group with the highest labor force participation rate are those with the educational attainment of bachelor's degree or higher, with 87.2% or 68 individuals in the labor force. Within the labor force, individuals with less than high school education have the highest percentage of unemployment, with 19.4% or 32 of them being unemployed.
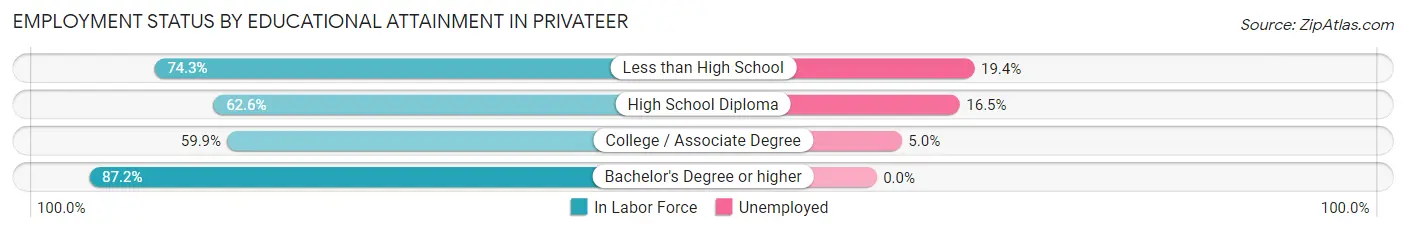
| Educational Attainment | In Labor Force | Unemployed |
| Less than High School | 165 (74.3%) | 43 (19.4%) |
| High School Diploma | 231 (62.6%) | 61 (16.5%) |
| College / Associate Degree | 279 (59.9%) | 23 (5.0%) |
| Bachelor's Degree or higher | 68 (87.2%) | 0 (0.0%) |
| Total | 743 (65.5%) | 128 (11.3%) |
Employment Occupations by Sex in Privateer
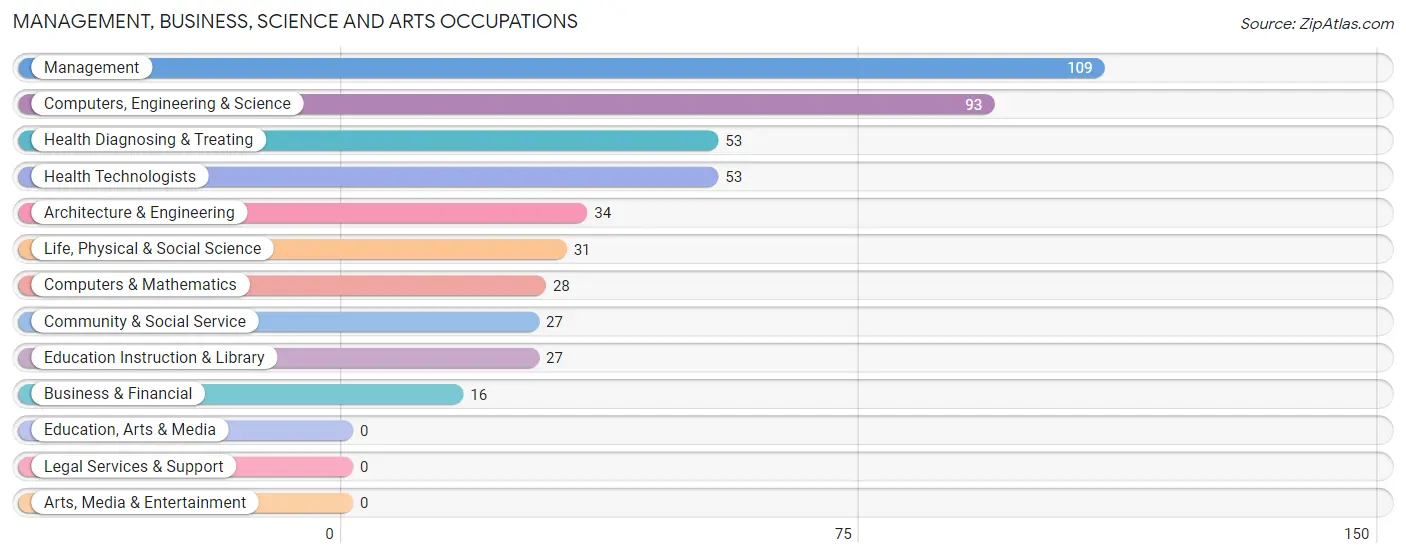
Management, Business, Science and Arts Occupations
The most common Management, Business, Science and Arts occupations in Privateer are Management (109 | 14.0%), Computers, Engineering & Science (93 | 11.9%), Health Diagnosing & Treating (53 | 6.8%), Health Technologists (53 | 6.8%), and Architecture & Engineering (34 | 4.4%).
Management, Business, Science and Arts Occupations by Sex
Within the Management, Business, Science and Arts occupations in Privateer, the most male-oriented occupations are Management (100.0%), Business & Financial (100.0%), and Architecture & Engineering (100.0%), while the most female-oriented occupations are Community & Social Service (100.0%), Education Instruction & Library (100.0%), and Health Diagnosing & Treating (100.0%).
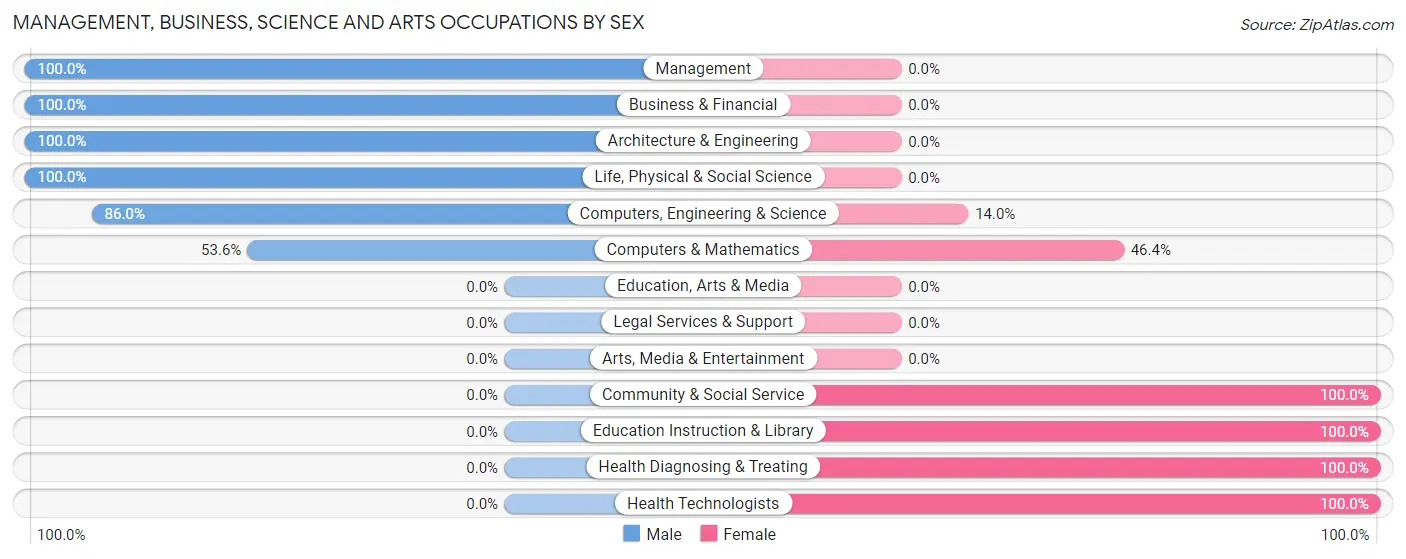
| Occupation | Male | Female |
| Management | 109 (100.0%) | 0 (0.0%) |
| Business & Financial | 16 (100.0%) | 0 (0.0%) |
| Computers, Engineering & Science | 80 (86.0%) | 13 (14.0%) |
| Computers & Mathematics | 15 (53.6%) | 13 (46.4%) |
| Architecture & Engineering | 34 (100.0%) | 0 (0.0%) |
| Life, Physical & Social Science | 31 (100.0%) | 0 (0.0%) |
| Community & Social Service | 0 (0.0%) | 27 (100.0%) |
| Education, Arts & Media | 0 (0.0%) | 0 (0.0%) |
| Legal Services & Support | 0 (0.0%) | 0 (0.0%) |
| Education Instruction & Library | 0 (0.0%) | 27 (100.0%) |
| Arts, Media & Entertainment | 0 (0.0%) | 0 (0.0%) |
| Health Diagnosing & Treating | 0 (0.0%) | 53 (100.0%) |
| Health Technologists | 0 (0.0%) | 53 (100.0%) |
| Total (Category) | 205 (68.8%) | 93 (31.2%) |
| Total (Overall) | 494 (63.3%) | 286 (36.7%) |
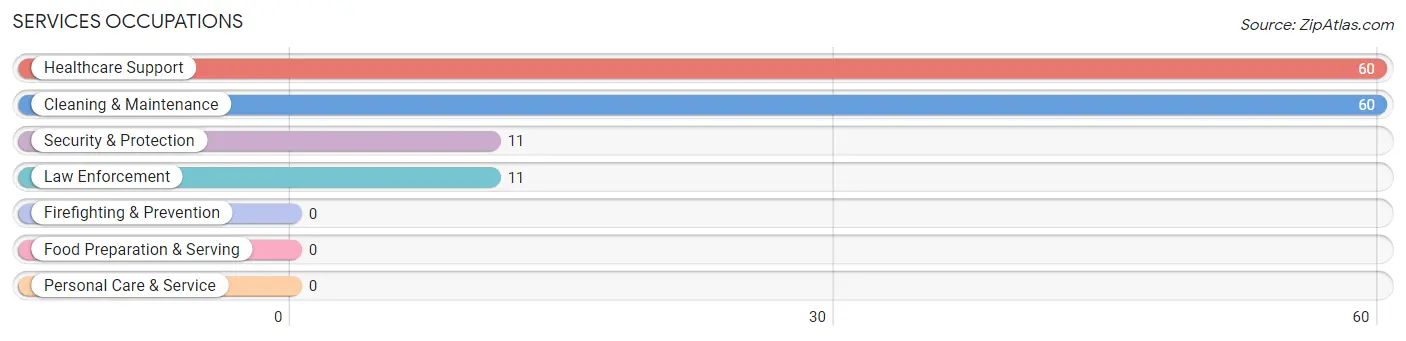
Services Occupations
The most common Services occupations in Privateer are Healthcare Support (60 | 7.7%), Cleaning & Maintenance (60 | 7.7%), Security & Protection (11 | 1.4%), and Law Enforcement (11 | 1.4%).
Services Occupations by Sex
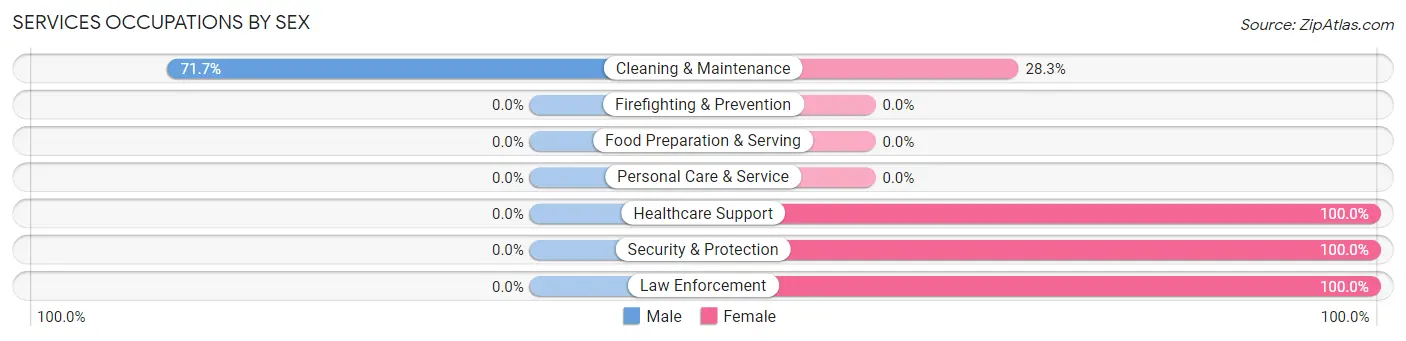
| Occupation | Male | Female |
| Healthcare Support | 0 (0.0%) | 60 (100.0%) |
| Security & Protection | 0 (0.0%) | 11 (100.0%) |
| Firefighting & Prevention | 0 (0.0%) | 0 (0.0%) |
| Law Enforcement | 0 (0.0%) | 11 (100.0%) |
| Food Preparation & Serving | 0 (0.0%) | 0 (0.0%) |
| Cleaning & Maintenance | 43 (71.7%) | 17 (28.3%) |
| Personal Care & Service | 0 (0.0%) | 0 (0.0%) |
| Total (Category) | 43 (32.8%) | 88 (67.2%) |
| Total (Overall) | 494 (63.3%) | 286 (36.7%) |
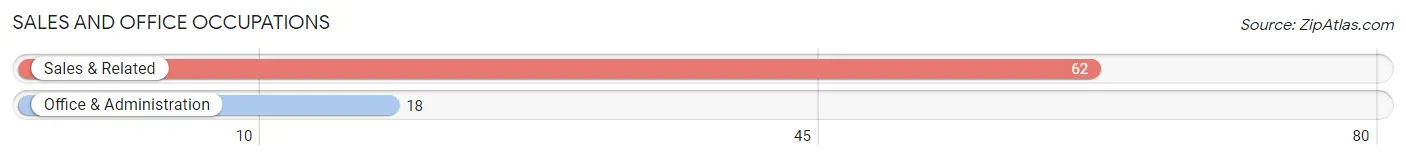
Sales and Office Occupations
The most common Sales and Office occupations in Privateer are Sales & Related (62 | 8.0%), and Office & Administration (18 | 2.3%).
Sales and Office Occupations by Sex
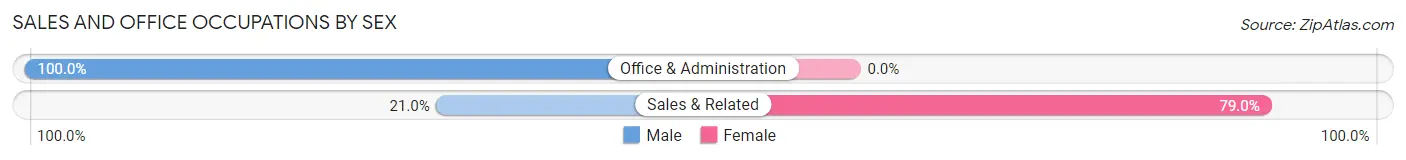
| Occupation | Male | Female |
| Sales & Related | 13 (21.0%) | 49 (79.0%) |
| Office & Administration | 18 (100.0%) | 0 (0.0%) |
| Total (Category) | 31 (38.8%) | 49 (61.3%) |
| Total (Overall) | 494 (63.3%) | 286 (36.7%) |
Natural Resources, Construction and Maintenance Occupations
The most common Natural Resources, Construction and Maintenance occupations in Privateer are Construction & Extraction (128 | 16.4%), and Installation, Maintenance & Repair (92 | 11.8%).
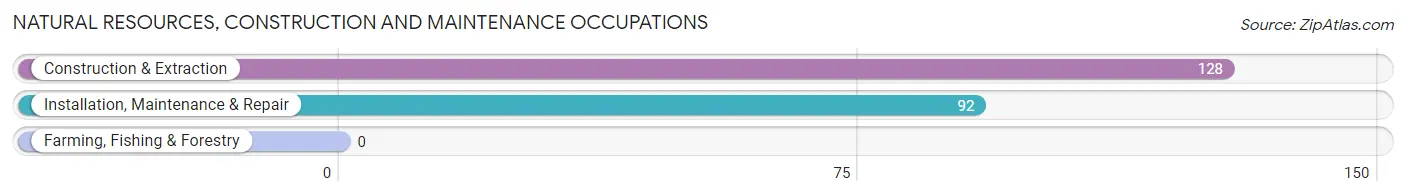
Natural Resources, Construction and Maintenance Occupations by Sex
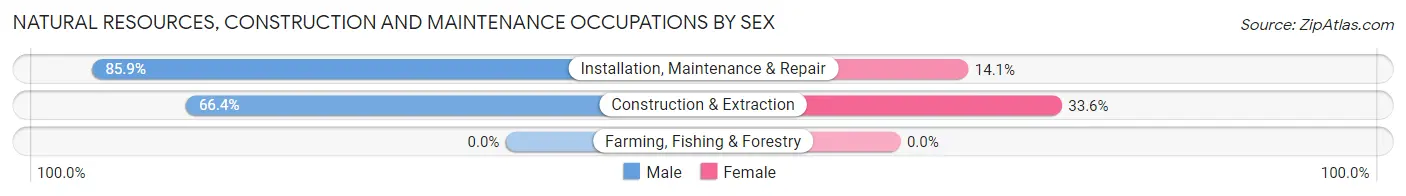
| Occupation | Male | Female |
| Farming, Fishing & Forestry | 0 (0.0%) | 0 (0.0%) |
| Construction & Extraction | 85 (66.4%) | 43 (33.6%) |
| Installation, Maintenance & Repair | 79 (85.9%) | 13 (14.1%) |
| Total (Category) | 164 (74.6%) | 56 (25.5%) |
| Total (Overall) | 494 (63.3%) | 286 (36.7%) |
Production, Transportation and Moving Occupations
The most common Production, Transportation and Moving occupations in Privateer are Material Moving (23 | 2.9%), Transportation (18 | 2.3%), and Production (10 | 1.3%).
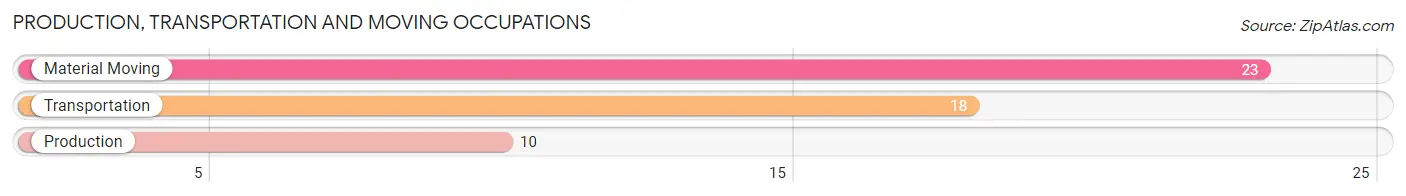
Production, Transportation and Moving Occupations by Sex
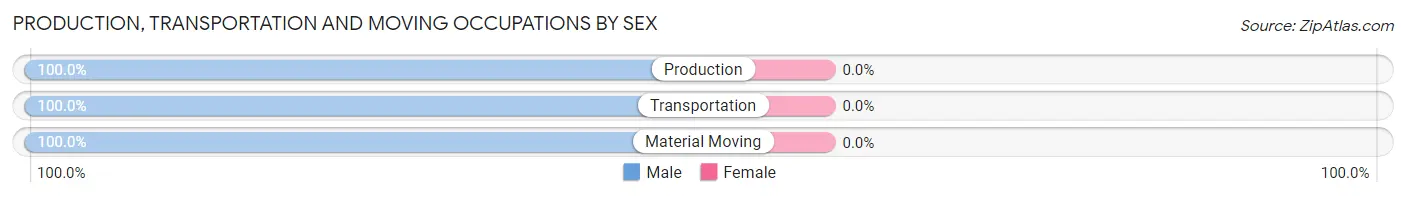
| Occupation | Male | Female |
| Production | 10 (100.0%) | 0 (0.0%) |
| Transportation | 18 (100.0%) | 0 (0.0%) |
| Material Moving | 23 (100.0%) | 0 (0.0%) |
| Total (Category) | 51 (100.0%) | 0 (0.0%) |
| Total (Overall) | 494 (63.3%) | 286 (36.7%) |
Employment Industries by Sex in Privateer
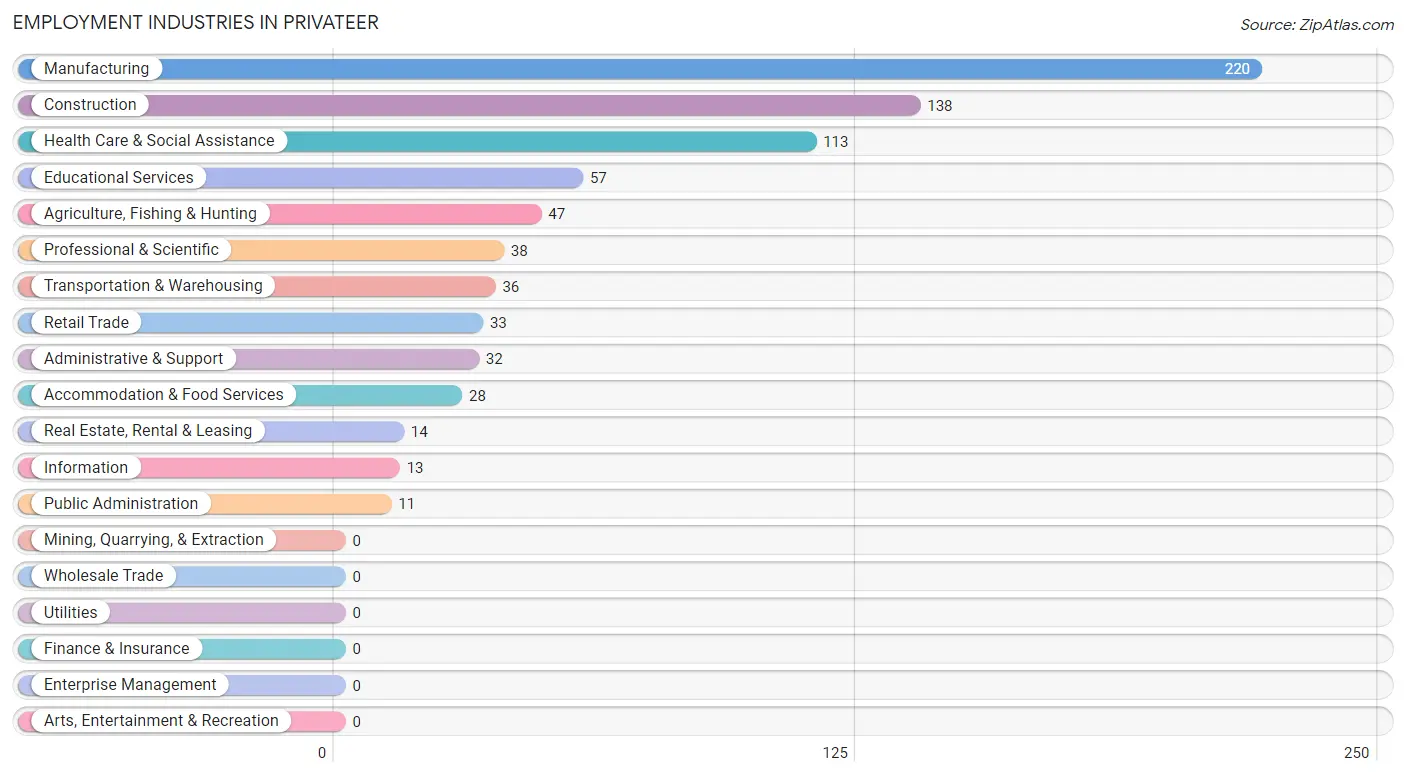
Employment Industries in Privateer
The major employment industries in Privateer include Manufacturing (220 | 28.2%), Construction (138 | 17.7%), Health Care & Social Assistance (113 | 14.5%), Educational Services (57 | 7.3%), and Agriculture, Fishing & Hunting (47 | 6.0%).
Employment Industries by Sex in Privateer
The Privateer industries that see more men than women are Agriculture, Fishing & Hunting (100.0%), Transportation & Warehousing (100.0%), and Professional & Scientific (100.0%), whereas the industries that tend to have a higher number of women are Information (100.0%), Real Estate, Rental & Leasing (100.0%), and Administrative & Support (100.0%).
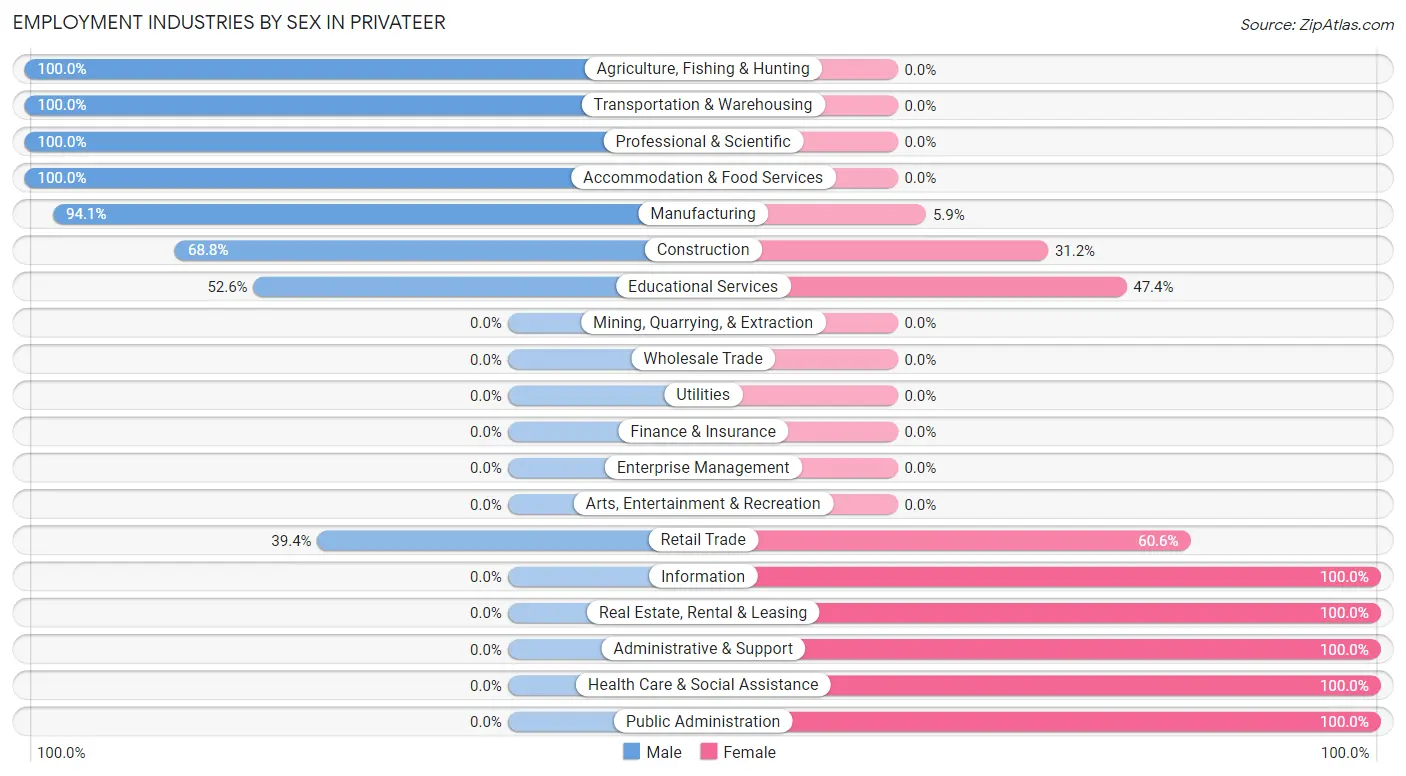
| Industry | Male | Female |
| Agriculture, Fishing & Hunting | 47 (100.0%) | 0 (0.0%) |
| Mining, Quarrying, & Extraction | 0 (0.0%) | 0 (0.0%) |
| Construction | 95 (68.8%) | 43 (31.2%) |
| Manufacturing | 207 (94.1%) | 13 (5.9%) |
| Wholesale Trade | 0 (0.0%) | 0 (0.0%) |
| Retail Trade | 13 (39.4%) | 20 (60.6%) |
| Transportation & Warehousing | 36 (100.0%) | 0 (0.0%) |
| Utilities | 0 (0.0%) | 0 (0.0%) |
| Information | 0 (0.0%) | 13 (100.0%) |
| Finance & Insurance | 0 (0.0%) | 0 (0.0%) |
| Real Estate, Rental & Leasing | 0 (0.0%) | 14 (100.0%) |
| Professional & Scientific | 38 (100.0%) | 0 (0.0%) |
| Enterprise Management | 0 (0.0%) | 0 (0.0%) |
| Administrative & Support | 0 (0.0%) | 32 (100.0%) |
| Educational Services | 30 (52.6%) | 27 (47.4%) |
| Health Care & Social Assistance | 0 (0.0%) | 113 (100.0%) |
| Arts, Entertainment & Recreation | 0 (0.0%) | 0 (0.0%) |
| Accommodation & Food Services | 28 (100.0%) | 0 (0.0%) |
| Public Administration | 0 (0.0%) | 11 (100.0%) |
| Total | 494 (63.3%) | 286 (36.7%) |
Education in Privateer
School Enrollment in Privateer
The most common levels of schooling among the 542 students in Privateer are middle school (191 | 35.2%), elementary school (155 | 28.6%), and high school (65 | 12.0%).
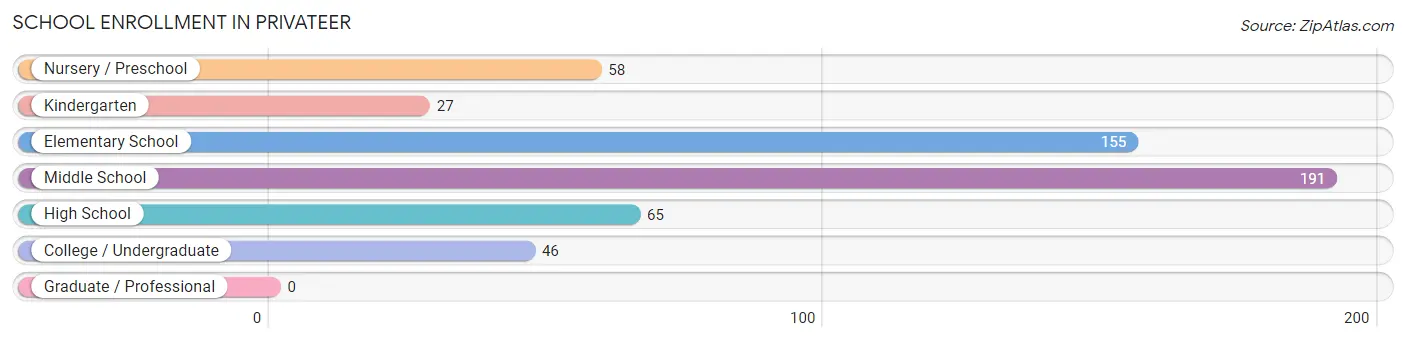
| School Level | # Students | % Students |
| Nursery / Preschool | 58 | 10.7% |
| Kindergarten | 27 | 5.0% |
| Elementary School | 155 | 28.6% |
| Middle School | 191 | 35.2% |
| High School | 65 | 12.0% |
| College / Undergraduate | 46 | 8.5% |
| Graduate / Professional | 0 | 0.0% |
| Total | 542 | 100.0% |
School Enrollment by Age by Funding Source in Privateer
Out of a total of 542 students who are enrolled in schools in Privateer, 174 (32.1%) attend a private institution, while the remaining 368 (67.9%) are enrolled in public schools. The age group of 3 to 4 year olds has the highest likelihood of being enrolled in private schools, with 58 (100.0% in the age bracket) enrolled. Conversely, the age group of 15 to 17 year olds has the lowest likelihood of being enrolled in a private school, with 48 (100.0% in the age bracket) attending a public institution.
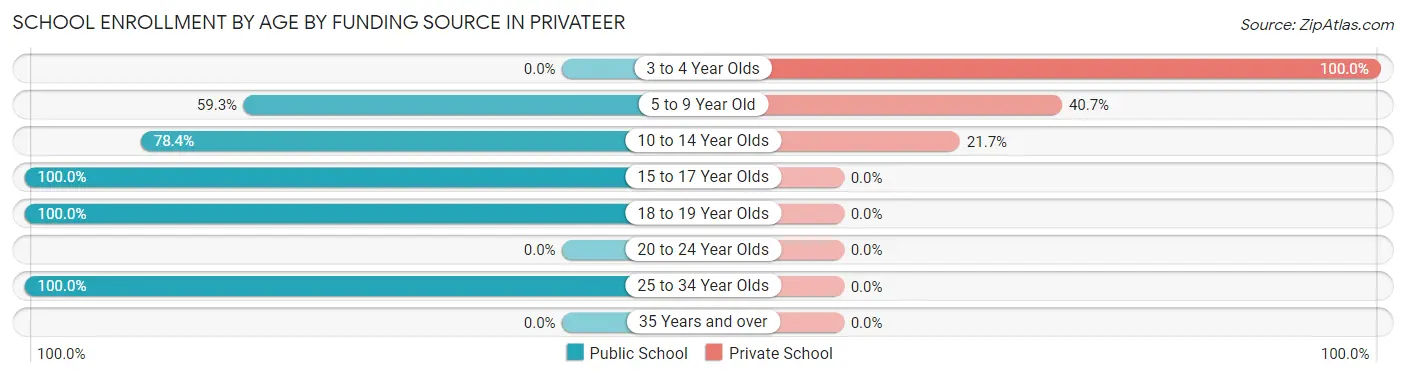
| Age Bracket | Public School | Private School |
| 3 to 4 Year Olds | 0 (0.0%) | 58 (100.0%) |
| 5 to 9 Year Old | 108 (59.3%) | 74 (40.7%) |
| 10 to 14 Year Olds | 152 (78.3%) | 42 (21.6%) |
| 15 to 17 Year Olds | 48 (100.0%) | 0 (0.0%) |
| 18 to 19 Year Olds | 14 (100.0%) | 0 (0.0%) |
| 20 to 24 Year Olds | 0 (0.0%) | 0 (0.0%) |
| 25 to 34 Year Olds | 46 (100.0%) | 0 (0.0%) |
| 35 Years and over | 0 (0.0%) | 0 (0.0%) |
| Total | 368 (67.9%) | 174 (32.1%) |
Educational Attainment by Field of Study in Privateer
Bio, nature & agricultural (47 | 34.8%), business (39 | 28.9%), psychology (27 | 20.0%), visual & performing arts (12 | 8.9%), and arts & humanities (10 | 7.4%) are the most common fields of study among 135 individuals in Privateer who have obtained a bachelor's degree or higher.
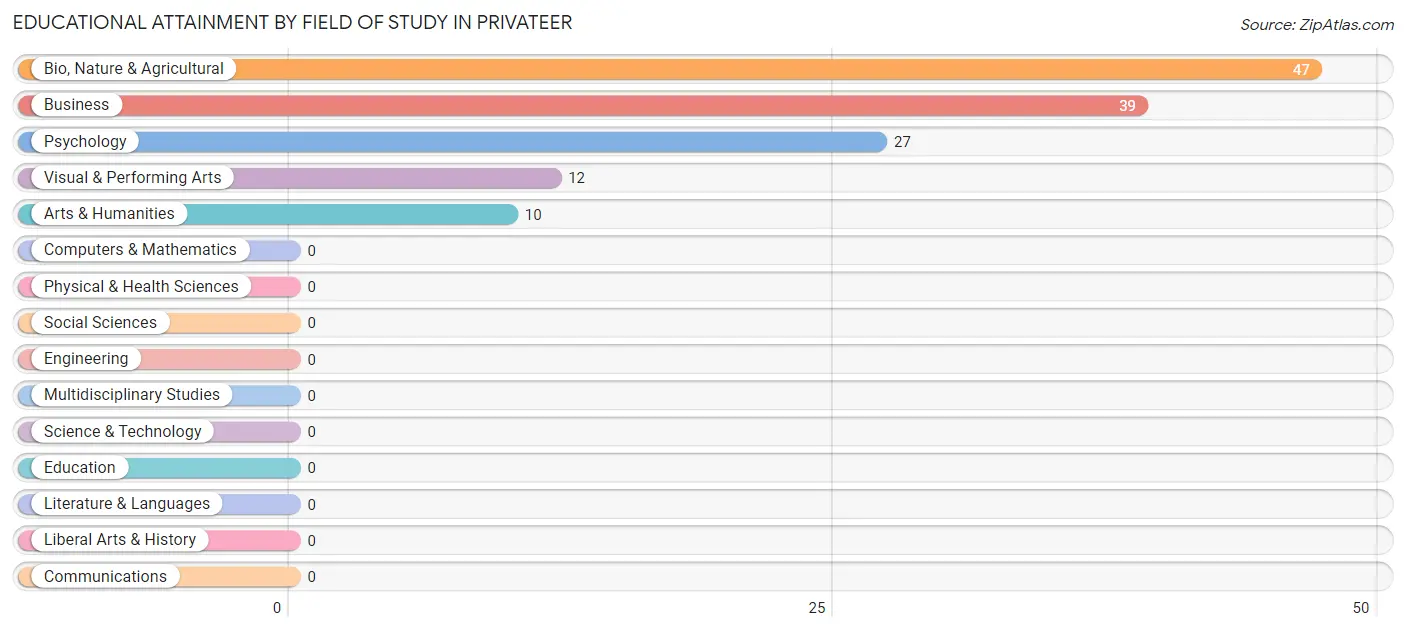
| Field of Study | # Graduates | % Graduates |
| Computers & Mathematics | 0 | 0.0% |
| Bio, Nature & Agricultural | 47 | 34.8% |
| Physical & Health Sciences | 0 | 0.0% |
| Psychology | 27 | 20.0% |
| Social Sciences | 0 | 0.0% |
| Engineering | 0 | 0.0% |
| Multidisciplinary Studies | 0 | 0.0% |
| Science & Technology | 0 | 0.0% |
| Business | 39 | 28.9% |
| Education | 0 | 0.0% |
| Literature & Languages | 0 | 0.0% |
| Liberal Arts & History | 0 | 0.0% |
| Visual & Performing Arts | 12 | 8.9% |
| Communications | 0 | 0.0% |
| Arts & Humanities | 10 | 7.4% |
| Total | 135 | 100.0% |
Transportation & Commute in Privateer
Vehicle Availability by Sex in Privateer
The most prevalent vehicle ownership categories in Privateer are males with 2 vehicles (229, accounting for 48.5%) and females with 2 vehicles (167, making up 80.1%).
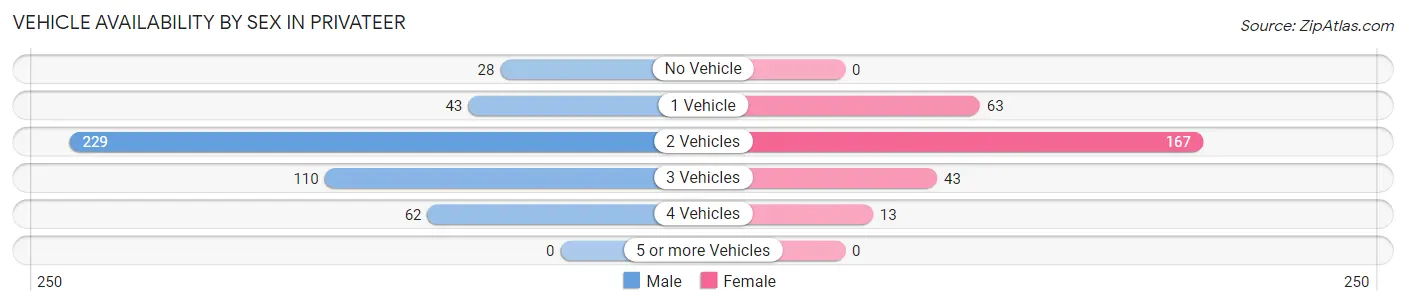
| Vehicles Available | Male | Female |
| No Vehicle | 28 (5.9%) | 0 (0.0%) |
| 1 Vehicle | 43 (9.1%) | 63 (22.0%) |
| 2 Vehicles | 229 (48.5%) | 167 (58.4%) |
| 3 Vehicles | 110 (23.3%) | 43 (15.0%) |
| 4 Vehicles | 62 (13.1%) | 13 (4.5%) |
| 5 or more Vehicles | 0 (0.0%) | 0 (0.0%) |
| Total | 472 (100.0%) | 286 (100.0%) |
Commute Time in Privateer
The most frequently occuring commute durations in Privateer are 25 to 29 minutes (162 commuters, 21.4%), 5 to 9 minutes (141 commuters, 18.6%), and 30 to 34 minutes (130 commuters, 17.2%).
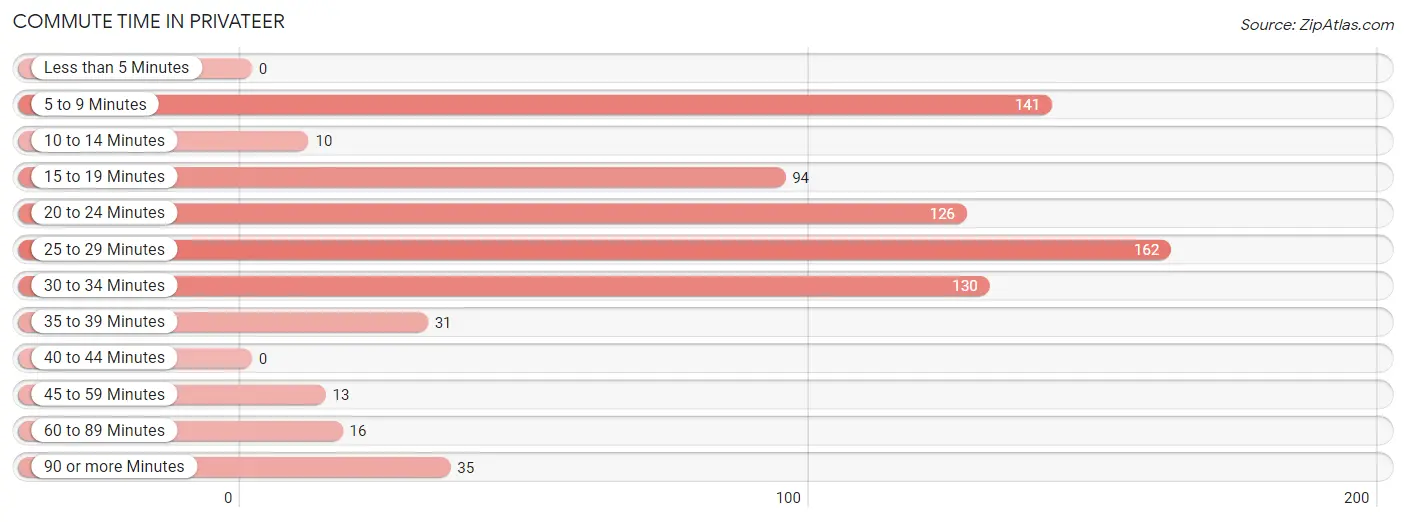
| Commute Time | # Commuters | % Commuters |
| Less than 5 Minutes | 0 | 0.0% |
| 5 to 9 Minutes | 141 | 18.6% |
| 10 to 14 Minutes | 10 | 1.3% |
| 15 to 19 Minutes | 94 | 12.4% |
| 20 to 24 Minutes | 126 | 16.6% |
| 25 to 29 Minutes | 162 | 21.4% |
| 30 to 34 Minutes | 130 | 17.2% |
| 35 to 39 Minutes | 31 | 4.1% |
| 40 to 44 Minutes | 0 | 0.0% |
| 45 to 59 Minutes | 13 | 1.7% |
| 60 to 89 Minutes | 16 | 2.1% |
| 90 or more Minutes | 35 | 4.6% |
Commute Time by Sex in Privateer
The most common commute times in Privateer are 5 to 9 minutes (141 commuters, 29.9%) for males and 20 to 24 minutes (98 commuters, 34.3%) for females.
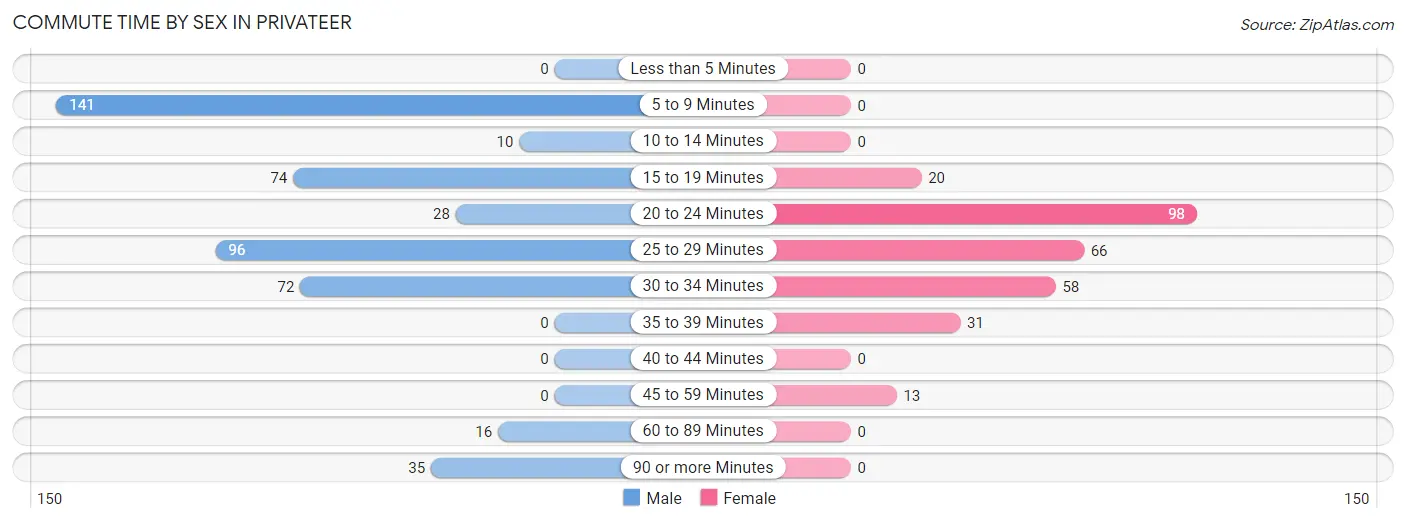
| Commute Time | Male | Female |
| Less than 5 Minutes | 0 (0.0%) | 0 (0.0%) |
| 5 to 9 Minutes | 141 (29.9%) | 0 (0.0%) |
| 10 to 14 Minutes | 10 (2.1%) | 0 (0.0%) |
| 15 to 19 Minutes | 74 (15.7%) | 20 (7.0%) |
| 20 to 24 Minutes | 28 (5.9%) | 98 (34.3%) |
| 25 to 29 Minutes | 96 (20.3%) | 66 (23.1%) |
| 30 to 34 Minutes | 72 (15.2%) | 58 (20.3%) |
| 35 to 39 Minutes | 0 (0.0%) | 31 (10.8%) |
| 40 to 44 Minutes | 0 (0.0%) | 0 (0.0%) |
| 45 to 59 Minutes | 0 (0.0%) | 13 (4.5%) |
| 60 to 89 Minutes | 16 (3.4%) | 0 (0.0%) |
| 90 or more Minutes | 35 (7.4%) | 0 (0.0%) |
Time of Departure to Work by Sex in Privateer
The most frequent times of departure to work in Privateer are 12:00 AM to 4:59 AM (130, 27.5%) for males and 5:30 AM to 5:59 AM (74, 25.9%) for females.
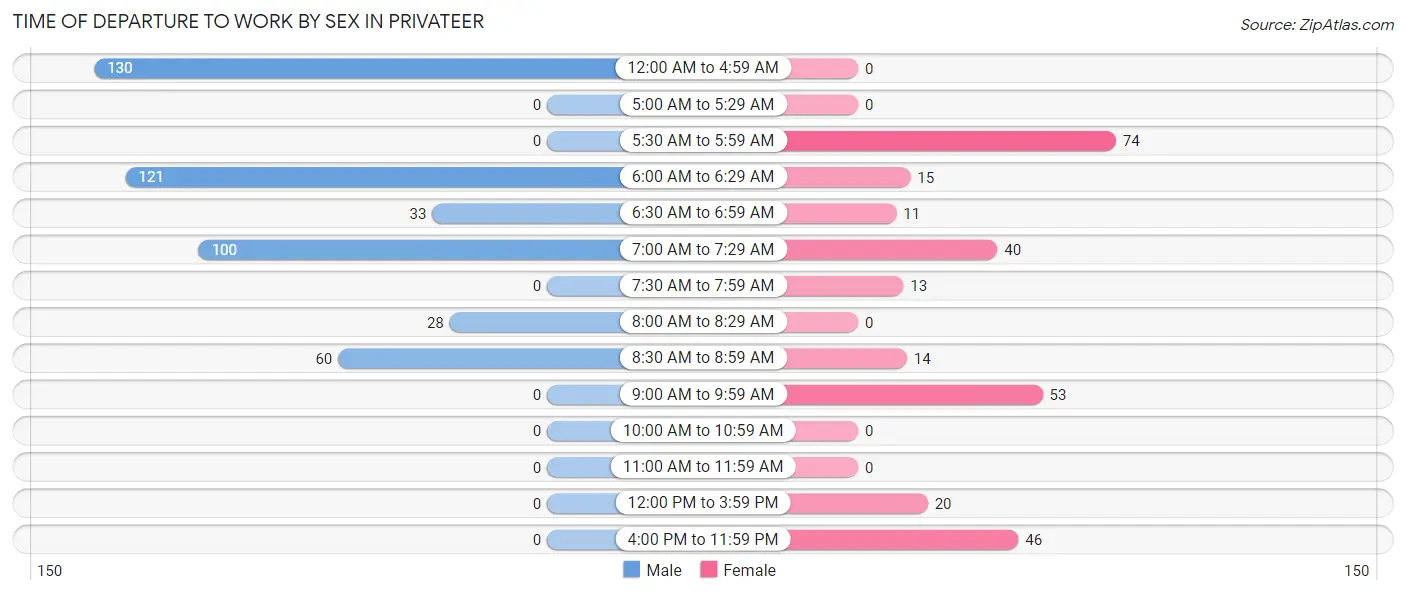
| Time of Departure | Male | Female |
| 12:00 AM to 4:59 AM | 130 (27.5%) | 0 (0.0%) |
| 5:00 AM to 5:29 AM | 0 (0.0%) | 0 (0.0%) |
| 5:30 AM to 5:59 AM | 0 (0.0%) | 74 (25.9%) |
| 6:00 AM to 6:29 AM | 121 (25.6%) | 15 (5.2%) |
| 6:30 AM to 6:59 AM | 33 (7.0%) | 11 (3.8%) |
| 7:00 AM to 7:29 AM | 100 (21.2%) | 40 (14.0%) |
| 7:30 AM to 7:59 AM | 0 (0.0%) | 13 (4.5%) |
| 8:00 AM to 8:29 AM | 28 (5.9%) | 0 (0.0%) |
| 8:30 AM to 8:59 AM | 60 (12.7%) | 14 (4.9%) |
| 9:00 AM to 9:59 AM | 0 (0.0%) | 53 (18.5%) |
| 10:00 AM to 10:59 AM | 0 (0.0%) | 0 (0.0%) |
| 11:00 AM to 11:59 AM | 0 (0.0%) | 0 (0.0%) |
| 12:00 PM to 3:59 PM | 0 (0.0%) | 20 (7.0%) |
| 4:00 PM to 11:59 PM | 0 (0.0%) | 46 (16.1%) |
| Total | 472 (100.0%) | 286 (100.0%) |
Housing Occupancy in Privateer
Occupancy by Ownership in Privateer
Of the total 741 dwellings in Privateer, owner-occupied units account for 621 (83.8%), while renter-occupied units make up 120 (16.2%).
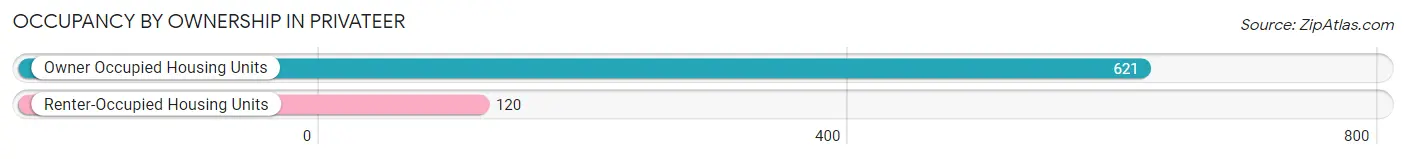
| Occupancy | # Housing Units | % Housing Units |
| Owner Occupied Housing Units | 621 | 83.8% |
| Renter-Occupied Housing Units | 120 | 16.2% |
| Total Occupied Housing Units | 741 | 100.0% |
Occupancy by Household Size in Privateer
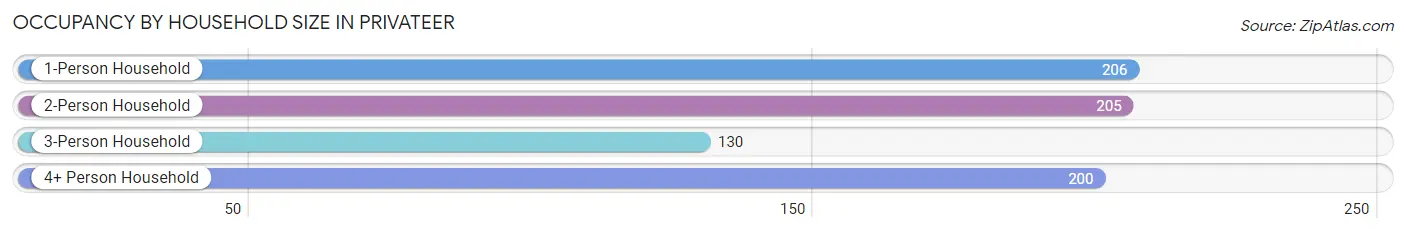
| Household Size | # Housing Units | % Housing Units |
| 1-Person Household | 206 | 27.8% |
| 2-Person Household | 205 | 27.7% |
| 3-Person Household | 130 | 17.5% |
| 4+ Person Household | 200 | 27.0% |
| Total Housing Units | 741 | 100.0% |
Occupancy by Ownership by Household Size in Privateer
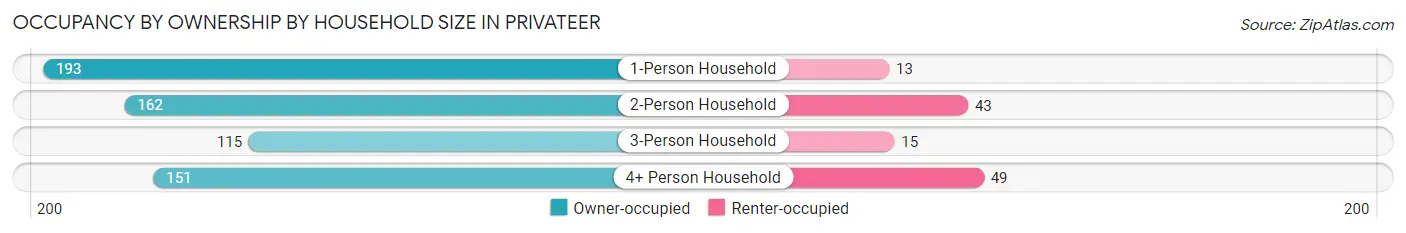
| Household Size | Owner-occupied | Renter-occupied |
| 1-Person Household | 193 (93.7%) | 13 (6.3%) |
| 2-Person Household | 162 (79.0%) | 43 (21.0%) |
| 3-Person Household | 115 (88.5%) | 15 (11.5%) |
| 4+ Person Household | 151 (75.5%) | 49 (24.5%) |
| Total Housing Units | 621 (83.8%) | 120 (16.2%) |
Occupancy by Educational Attainment in Privateer
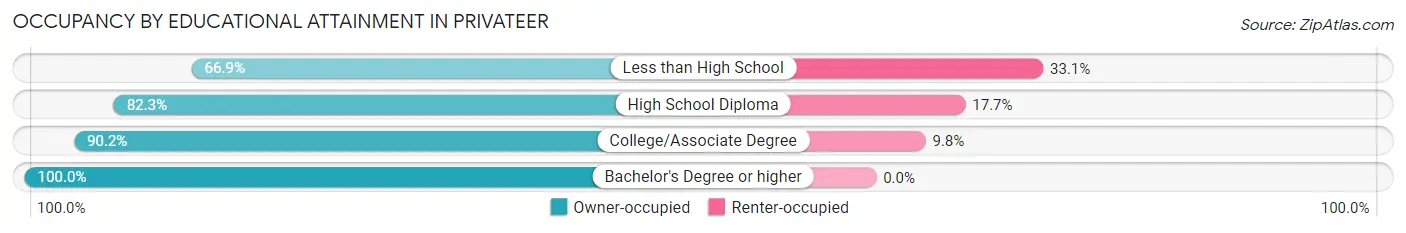
| Household Size | Owner-occupied | Renter-occupied |
| Less than High School | 97 (66.9%) | 48 (33.1%) |
| High School Diploma | 270 (82.3%) | 58 (17.7%) |
| College/Associate Degree | 129 (90.2%) | 14 (9.8%) |
| Bachelor's Degree or higher | 125 (100.0%) | 0 (0.0%) |
Occupancy by Age of Householder in Privateer
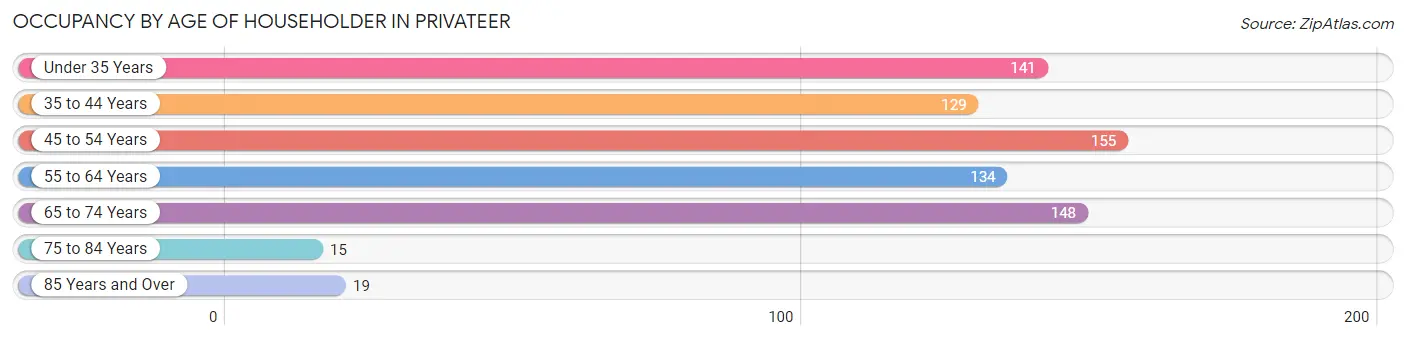
| Age Bracket | # Households | % Households |
| Under 35 Years | 141 | 19.0% |
| 35 to 44 Years | 129 | 17.4% |
| 45 to 54 Years | 155 | 20.9% |
| 55 to 64 Years | 134 | 18.1% |
| 65 to 74 Years | 148 | 20.0% |
| 75 to 84 Years | 15 | 2.0% |
| 85 Years and Over | 19 | 2.6% |
| Total | 741 | 100.0% |
Housing Finances in Privateer
Median Income by Occupancy in Privateer
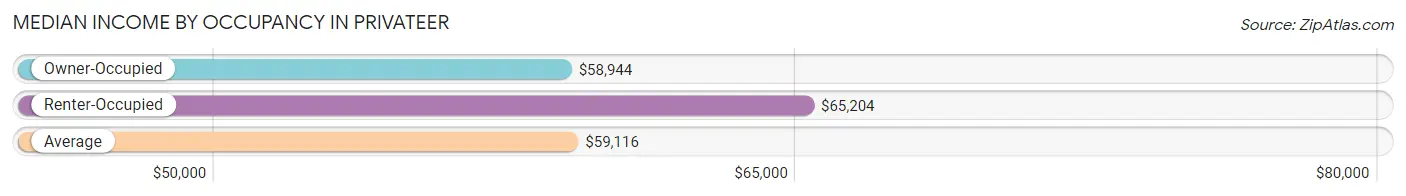
| Occupancy Type | # Households | Median Income |
| Owner-Occupied | 621 (83.8%) | $58,944 |
| Renter-Occupied | 120 (16.2%) | $65,204 |
| Average | 741 (100.0%) | $59,116 |
Occupancy by Householder Income Bracket in Privateer
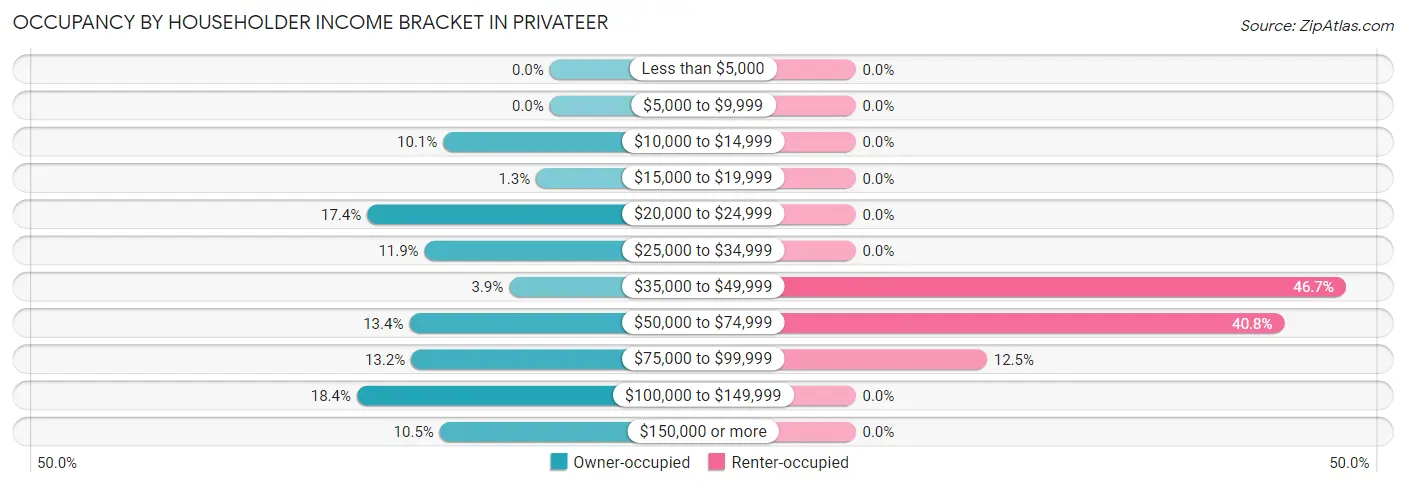
| Income Bracket | Owner-occupied | Renter-occupied |
| Less than $5,000 | 0 (0.0%) | 0 (0.0%) |
| $5,000 to $9,999 | 0 (0.0%) | 0 (0.0%) |
| $10,000 to $14,999 | 63 (10.1%) | 0 (0.0%) |
| $15,000 to $19,999 | 8 (1.3%) | 0 (0.0%) |
| $20,000 to $24,999 | 108 (17.4%) | 0 (0.0%) |
| $25,000 to $34,999 | 74 (11.9%) | 0 (0.0%) |
| $35,000 to $49,999 | 24 (3.9%) | 56 (46.7%) |
| $50,000 to $74,999 | 83 (13.4%) | 49 (40.8%) |
| $75,000 to $99,999 | 82 (13.2%) | 15 (12.5%) |
| $100,000 to $149,999 | 114 (18.4%) | 0 (0.0%) |
| $150,000 or more | 65 (10.5%) | 0 (0.0%) |
| Total | 621 (100.0%) | 120 (100.0%) |
Monthly Housing Cost Tiers in Privateer
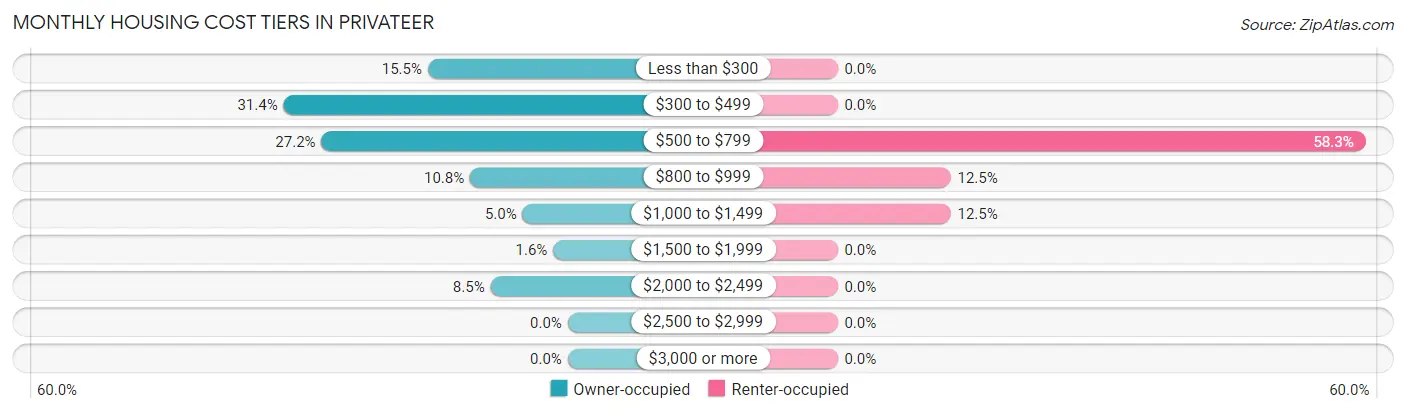
| Monthly Cost | Owner-occupied | Renter-occupied |
| Less than $300 | 96 (15.5%) | 0 (0.0%) |
| $300 to $499 | 195 (31.4%) | 0 (0.0%) |
| $500 to $799 | 169 (27.2%) | 70 (58.3%) |
| $800 to $999 | 67 (10.8%) | 15 (12.5%) |
| $1,000 to $1,499 | 31 (5.0%) | 15 (12.5%) |
| $1,500 to $1,999 | 10 (1.6%) | 0 (0.0%) |
| $2,000 to $2,499 | 53 (8.5%) | 0 (0.0%) |
| $2,500 to $2,999 | 0 (0.0%) | 0 (0.0%) |
| $3,000 or more | 0 (0.0%) | 0 (0.0%) |
| Total | 621 (100.0%) | 120 (100.0%) |
Physical Housing Characteristics in Privateer
Housing Structures in Privateer
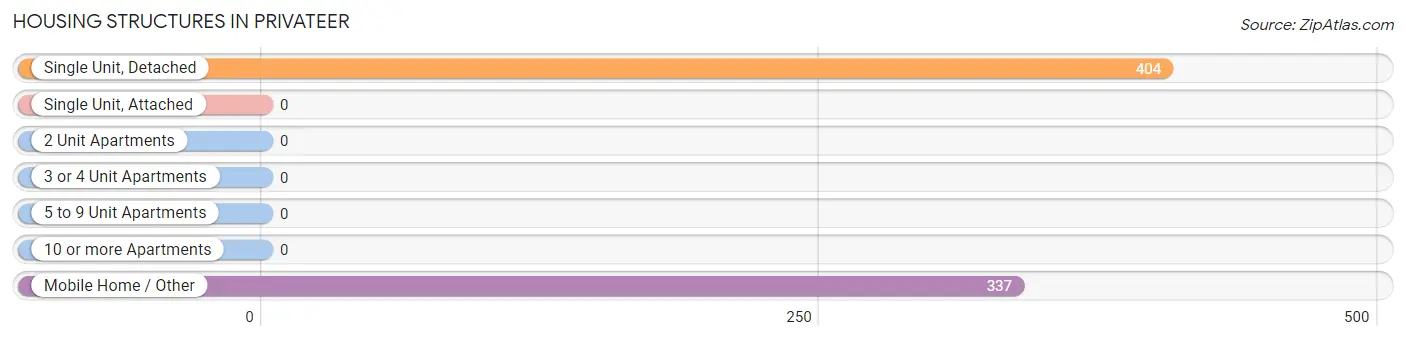
| Structure Type | # Housing Units | % Housing Units |
| Single Unit, Detached | 404 | 54.5% |
| Single Unit, Attached | 0 | 0.0% |
| 2 Unit Apartments | 0 | 0.0% |
| 3 or 4 Unit Apartments | 0 | 0.0% |
| 5 to 9 Unit Apartments | 0 | 0.0% |
| 10 or more Apartments | 0 | 0.0% |
| Mobile Home / Other | 337 | 45.5% |
| Total | 741 | 100.0% |
Housing Structures by Occupancy in Privateer
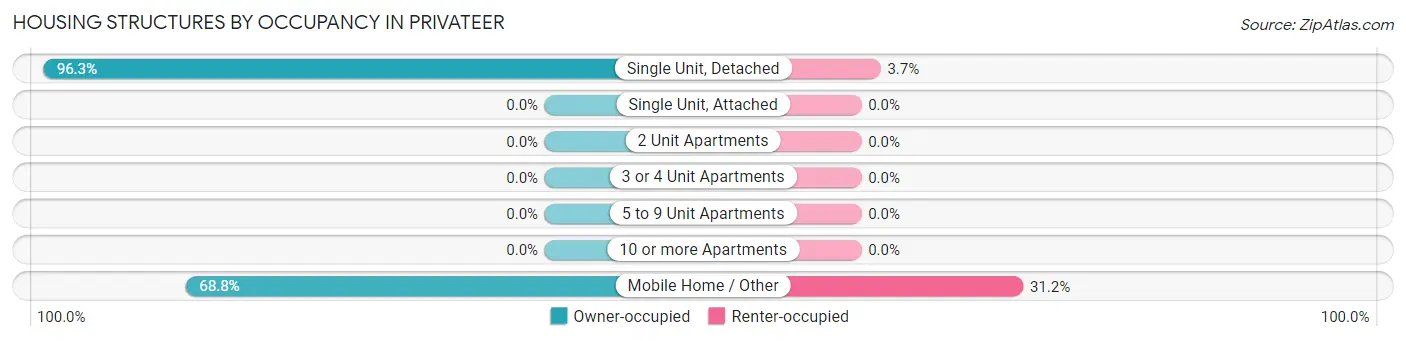
| Structure Type | Owner-occupied | Renter-occupied |
| Single Unit, Detached | 389 (96.3%) | 15 (3.7%) |
| Single Unit, Attached | 0 (0.0%) | 0 (0.0%) |
| 2 Unit Apartments | 0 (0.0%) | 0 (0.0%) |
| 3 or 4 Unit Apartments | 0 (0.0%) | 0 (0.0%) |
| 5 to 9 Unit Apartments | 0 (0.0%) | 0 (0.0%) |
| 10 or more Apartments | 0 (0.0%) | 0 (0.0%) |
| Mobile Home / Other | 232 (68.8%) | 105 (31.2%) |
| Total | 621 (83.8%) | 120 (16.2%) |
Housing Structures by Number of Rooms in Privateer
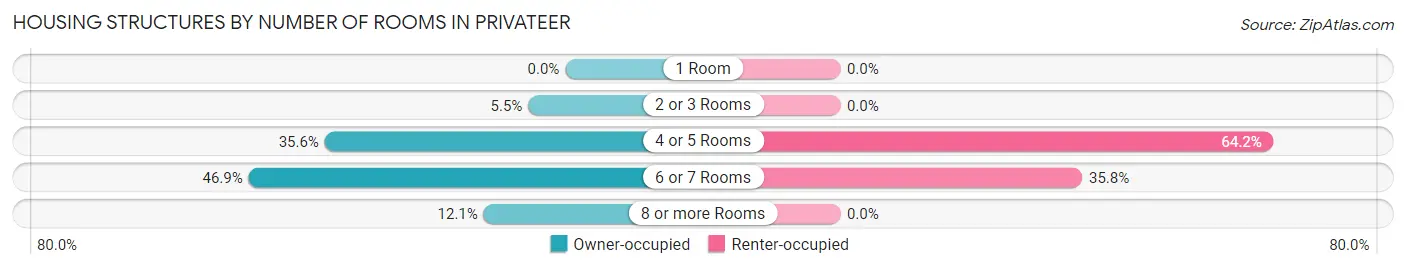
| Number of Rooms | Owner-occupied | Renter-occupied |
| 1 Room | 0 (0.0%) | 0 (0.0%) |
| 2 or 3 Rooms | 34 (5.5%) | 0 (0.0%) |
| 4 or 5 Rooms | 221 (35.6%) | 77 (64.2%) |
| 6 or 7 Rooms | 291 (46.9%) | 43 (35.8%) |
| 8 or more Rooms | 75 (12.1%) | 0 (0.0%) |
| Total | 621 (100.0%) | 120 (100.0%) |
Housing Structure by Heating Type in Privateer
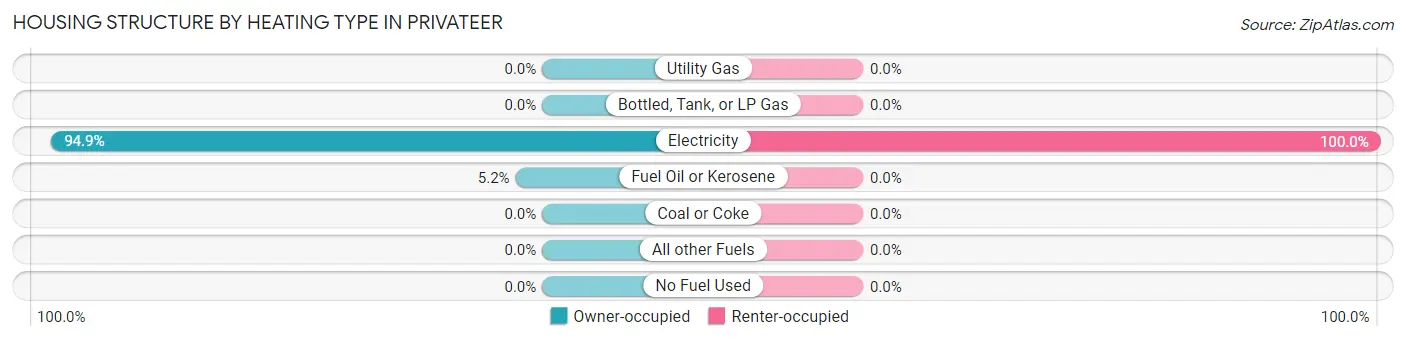
| Heating Type | Owner-occupied | Renter-occupied |
| Utility Gas | 0 (0.0%) | 0 (0.0%) |
| Bottled, Tank, or LP Gas | 0 (0.0%) | 0 (0.0%) |
| Electricity | 589 (94.9%) | 120 (100.0%) |
| Fuel Oil or Kerosene | 32 (5.1%) | 0 (0.0%) |
| Coal or Coke | 0 (0.0%) | 0 (0.0%) |
| All other Fuels | 0 (0.0%) | 0 (0.0%) |
| No Fuel Used | 0 (0.0%) | 0 (0.0%) |
| Total | 621 (100.0%) | 120 (100.0%) |
Household Vehicle Usage in Privateer
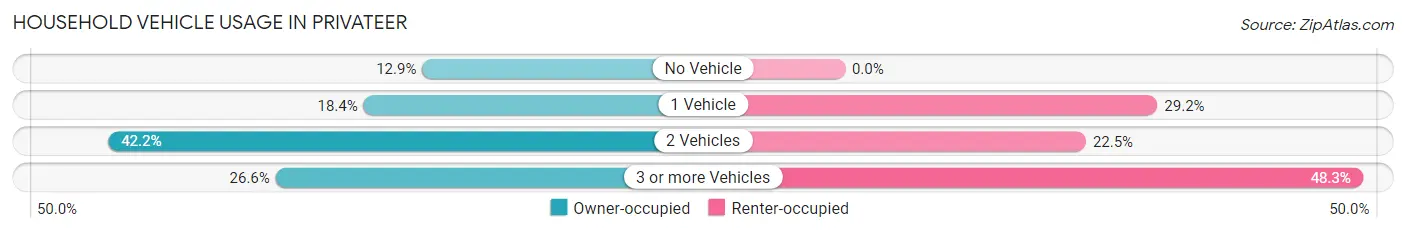
| Vehicles per Household | Owner-occupied | Renter-occupied |
| No Vehicle | 80 (12.9%) | 0 (0.0%) |
| 1 Vehicle | 114 (18.4%) | 35 (29.2%) |
| 2 Vehicles | 262 (42.2%) | 27 (22.5%) |
| 3 or more Vehicles | 165 (26.6%) | 58 (48.3%) |
| Total | 621 (100.0%) | 120 (100.0%) |
Real Estate & Mortgages in Privateer
Real Estate and Mortgage Overview in Privateer
| Characteristic | Without Mortgage | With Mortgage |
| Housing Units | 370 | 251 |
| Median Property Value | $78,400 | $135,000 |
| Median Household Income | $58,362 | $18 |
| Monthly Housing Costs | $384 | $0 |
| Real Estate Taxes | $402 | $0 |
Property Value by Mortgage Status in Privateer
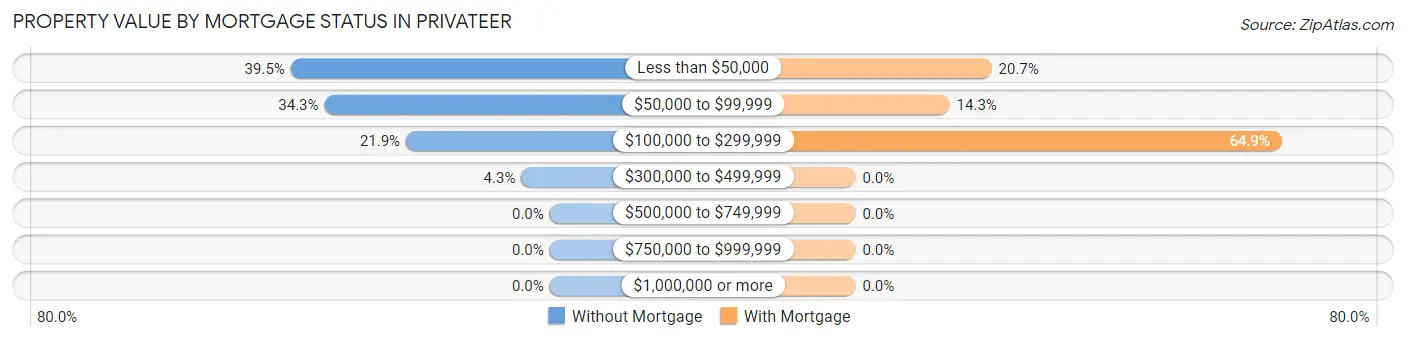
| Property Value | Without Mortgage | With Mortgage |
| Less than $50,000 | 146 (39.5%) | 52 (20.7%) |
| $50,000 to $99,999 | 127 (34.3%) | 36 (14.3%) |
| $100,000 to $299,999 | 81 (21.9%) | 163 (64.9%) |
| $300,000 to $499,999 | 16 (4.3%) | 0 (0.0%) |
| $500,000 to $749,999 | 0 (0.0%) | 0 (0.0%) |
| $750,000 to $999,999 | 0 (0.0%) | 0 (0.0%) |
| $1,000,000 or more | 0 (0.0%) | 0 (0.0%) |
| Total | 370 (100.0%) | 251 (100.0%) |
Household Income by Mortgage Status in Privateer
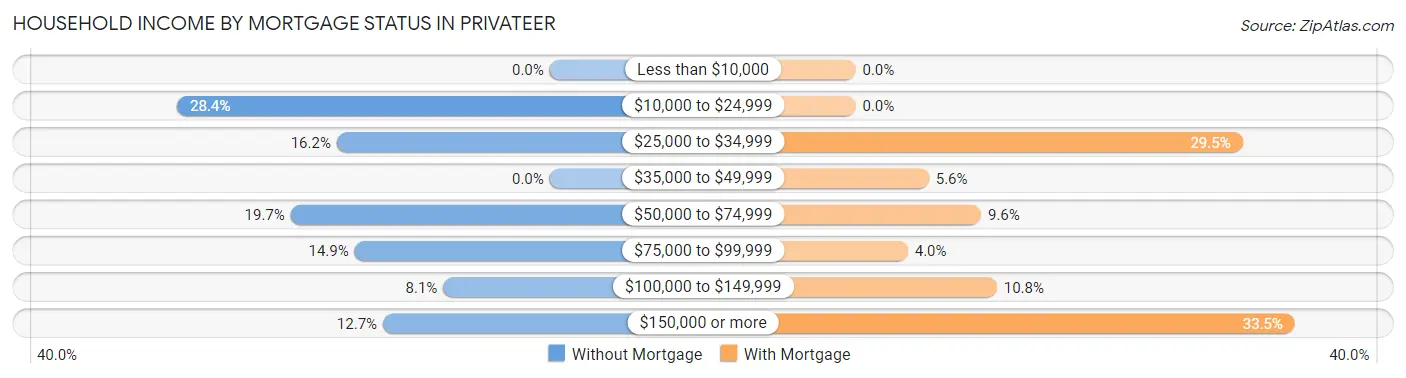
| Household Income | Without Mortgage | With Mortgage |
| Less than $10,000 | 0 (0.0%) | 0 (0.0%) |
| $10,000 to $24,999 | 105 (28.4%) | 0 (0.0%) |
| $25,000 to $34,999 | 60 (16.2%) | 74 (29.5%) |
| $35,000 to $49,999 | 0 (0.0%) | 14 (5.6%) |
| $50,000 to $74,999 | 73 (19.7%) | 24 (9.6%) |
| $75,000 to $99,999 | 55 (14.9%) | 10 (4.0%) |
| $100,000 to $149,999 | 30 (8.1%) | 27 (10.8%) |
| $150,000 or more | 47 (12.7%) | 84 (33.5%) |
| Total | 370 (100.0%) | 251 (100.0%) |
Property Value to Household Income Ratio in Privateer
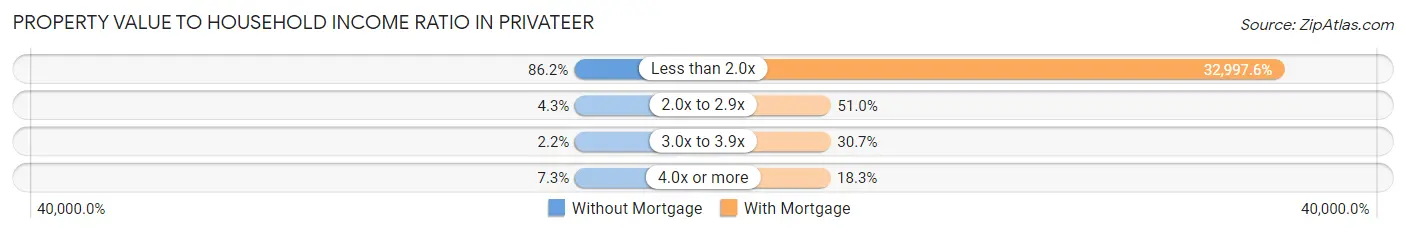
| Value-to-Income Ratio | Without Mortgage | With Mortgage |
| Less than 2.0x | 319 (86.2%) | 82,824 (32,997.6%) |
| 2.0x to 2.9x | 16 (4.3%) | 128 (51.0%) |
| 3.0x to 3.9x | 8 (2.2%) | 77 (30.7%) |
| 4.0x or more | 27 (7.3%) | 46 (18.3%) |
| Total | 370 (100.0%) | 251 (100.0%) |
Real Estate Taxes by Mortgage Status in Privateer
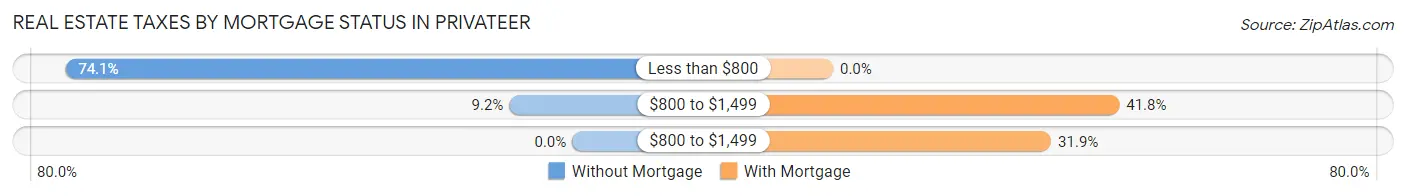
| Property Taxes | Without Mortgage | With Mortgage |
| Less than $800 | 274 (74.1%) | 0 (0.0%) |
| $800 to $1,499 | 34 (9.2%) | 105 (41.8%) |
| $800 to $1,499 | 0 (0.0%) | 80 (31.9%) |
| Total | 370 (100.0%) | 251 (100.0%) |
Health & Disability in Privateer
Health Insurance Coverage by Age in Privateer
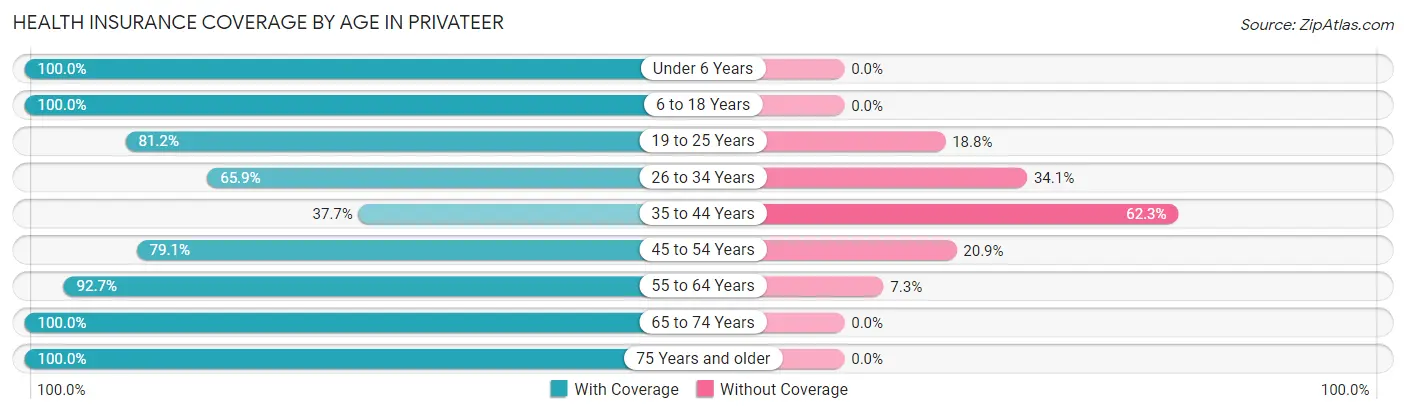
| Age Bracket | With Coverage | Without Coverage |
| Under 6 Years | 158 (100.0%) | 0 (0.0%) |
| 6 to 18 Years | 424 (100.0%) | 0 (0.0%) |
| 19 to 25 Years | 138 (81.2%) | 32 (18.8%) |
| 26 to 34 Years | 180 (65.9%) | 93 (34.1%) |
| 35 to 44 Years | 89 (37.7%) | 147 (62.3%) |
| 45 to 54 Years | 318 (79.1%) | 84 (20.9%) |
| 55 to 64 Years | 178 (92.7%) | 14 (7.3%) |
| 65 to 74 Years | 279 (100.0%) | 0 (0.0%) |
| 75 Years and older | 57 (100.0%) | 0 (0.0%) |
| Total | 1,821 (83.1%) | 370 (16.9%) |
Health Insurance Coverage by Citizenship Status in Privateer
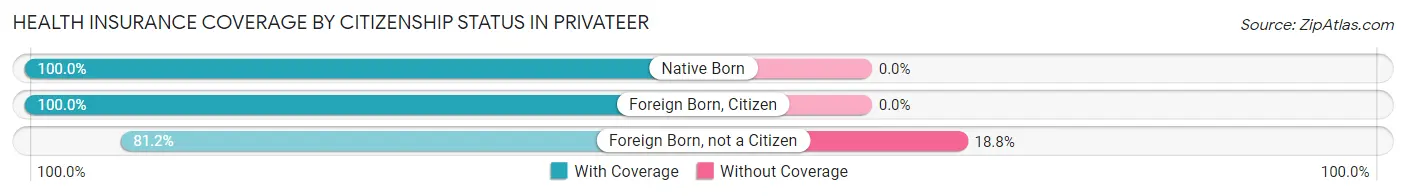
| Citizenship Status | With Coverage | Without Coverage |
| Native Born | 158 (100.0%) | 0 (0.0%) |
| Foreign Born, Citizen | 424 (100.0%) | 0 (0.0%) |
| Foreign Born, not a Citizen | 138 (81.2%) | 32 (18.8%) |
Health Insurance Coverage by Household Income in Privateer
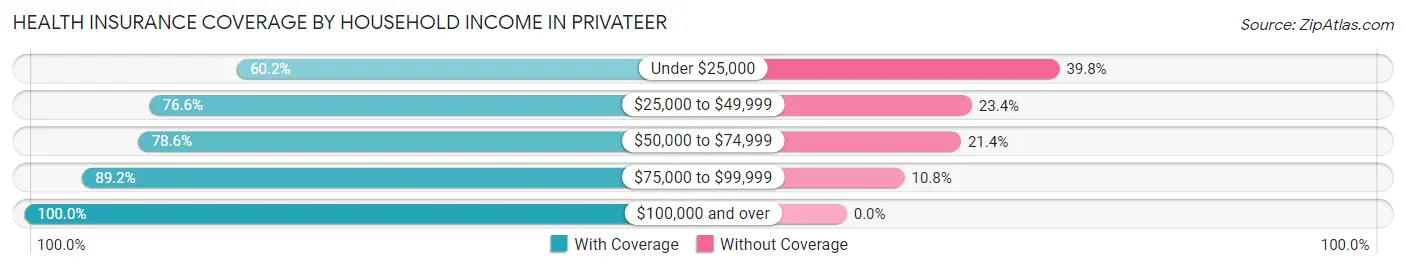
| Household Income | With Coverage | Without Coverage |
| Under $25,000 | 148 (60.2%) | 98 (39.8%) |
| $25,000 to $49,999 | 467 (76.6%) | 143 (23.4%) |
| $50,000 to $74,999 | 294 (78.6%) | 80 (21.4%) |
| $75,000 to $99,999 | 404 (89.2%) | 49 (10.8%) |
| $100,000 and over | 508 (100.0%) | 0 (0.0%) |
Public vs Private Health Insurance Coverage by Age in Privateer
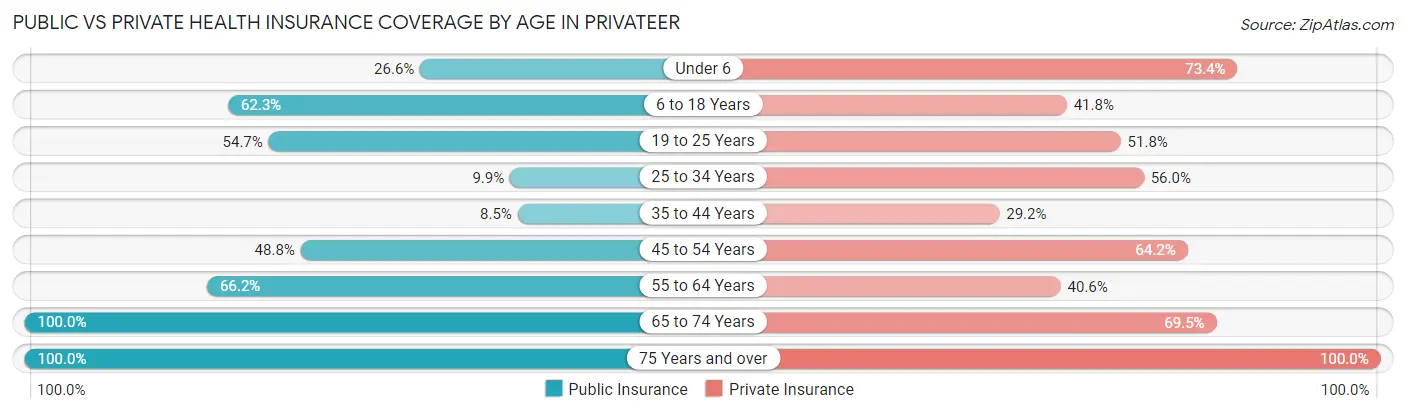
| Age Bracket | Public Insurance | Private Insurance |
| Under 6 | 42 (26.6%) | 116 (73.4%) |
| 6 to 18 Years | 264 (62.3%) | 177 (41.7%) |
| 19 to 25 Years | 93 (54.7%) | 88 (51.8%) |
| 25 to 34 Years | 27 (9.9%) | 153 (56.0%) |
| 35 to 44 Years | 20 (8.5%) | 69 (29.2%) |
| 45 to 54 Years | 196 (48.8%) | 258 (64.2%) |
| 55 to 64 Years | 127 (66.1%) | 78 (40.6%) |
| 65 to 74 Years | 279 (100.0%) | 194 (69.5%) |
| 75 Years and over | 57 (100.0%) | 57 (100.0%) |
| Total | 1,105 (50.4%) | 1,190 (54.3%) |
Disability Status by Sex by Age in Privateer
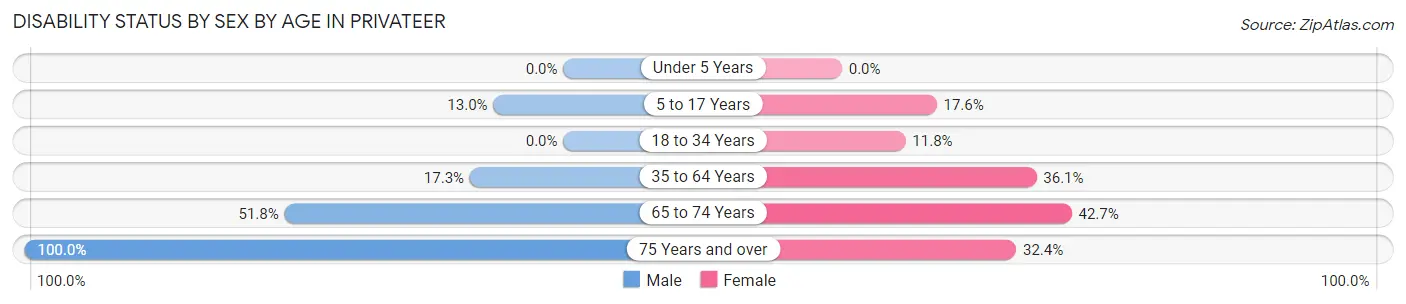
| Age Bracket | Male | Female |
| Under 5 Years | 0 (0.0%) | 0 (0.0%) |
| 5 to 17 Years | 27 (13.0%) | 38 (17.6%) |
| 18 to 34 Years | 0 (0.0%) | 30 (11.8%) |
| 35 to 64 Years | 69 (17.3%) | 156 (36.1%) |
| 65 to 74 Years | 74 (51.7%) | 58 (42.6%) |
| 75 Years and over | 23 (100.0%) | 11 (32.4%) |
Disability Class by Sex by Age in Privateer
Disability Class: Hearing Difficulty
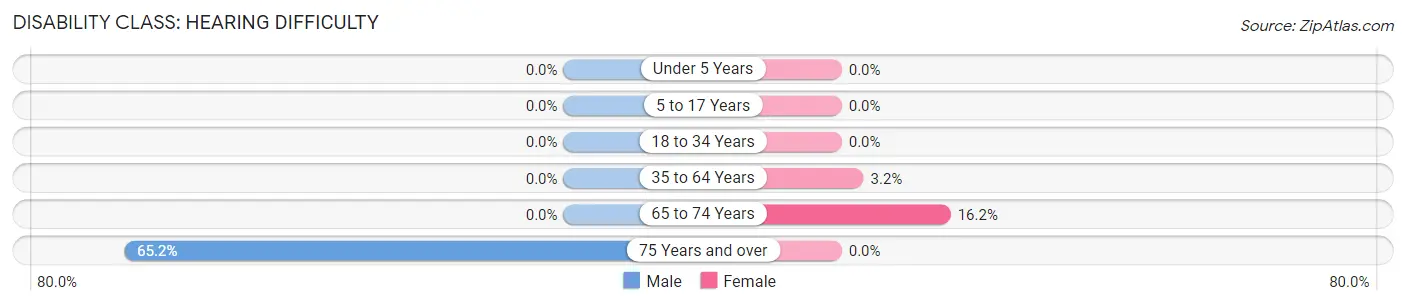
| Age Bracket | Male | Female |
| Under 5 Years | 0 (0.0%) | 0 (0.0%) |
| 5 to 17 Years | 0 (0.0%) | 0 (0.0%) |
| 18 to 34 Years | 0 (0.0%) | 0 (0.0%) |
| 35 to 64 Years | 0 (0.0%) | 14 (3.2%) |
| 65 to 74 Years | 0 (0.0%) | 22 (16.2%) |
| 75 Years and over | 15 (65.2%) | 0 (0.0%) |
Disability Class: Vision Difficulty
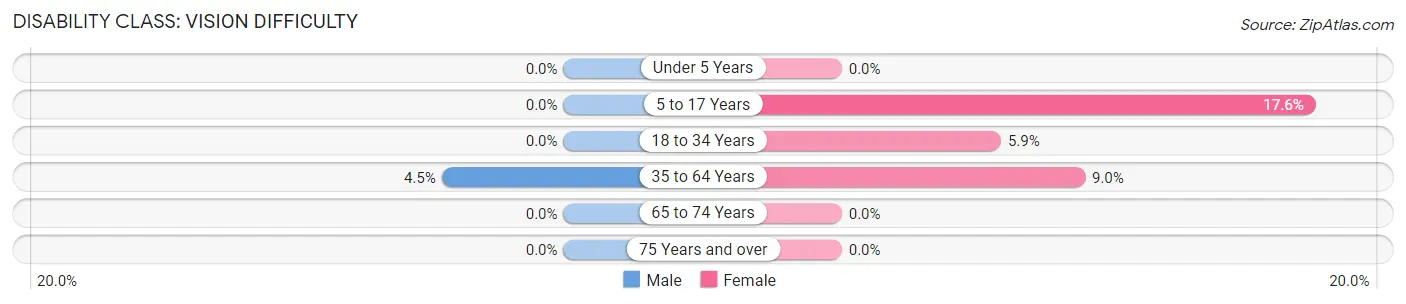
| Age Bracket | Male | Female |
| Under 5 Years | 0 (0.0%) | 0 (0.0%) |
| 5 to 17 Years | 0 (0.0%) | 38 (17.6%) |
| 18 to 34 Years | 0 (0.0%) | 15 (5.9%) |
| 35 to 64 Years | 18 (4.5%) | 39 (9.0%) |
| 65 to 74 Years | 0 (0.0%) | 0 (0.0%) |
| 75 Years and over | 0 (0.0%) | 0 (0.0%) |
Disability Class: Cognitive Difficulty
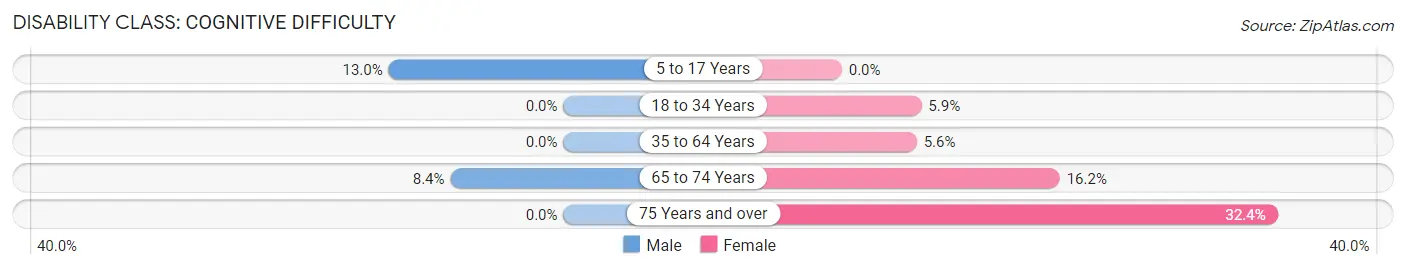
| Age Bracket | Male | Female |
| 5 to 17 Years | 27 (13.0%) | 0 (0.0%) |
| 18 to 34 Years | 0 (0.0%) | 15 (5.9%) |
| 35 to 64 Years | 0 (0.0%) | 24 (5.6%) |
| 65 to 74 Years | 12 (8.4%) | 22 (16.2%) |
| 75 Years and over | 0 (0.0%) | 11 (32.4%) |
Disability Class: Ambulatory Difficulty
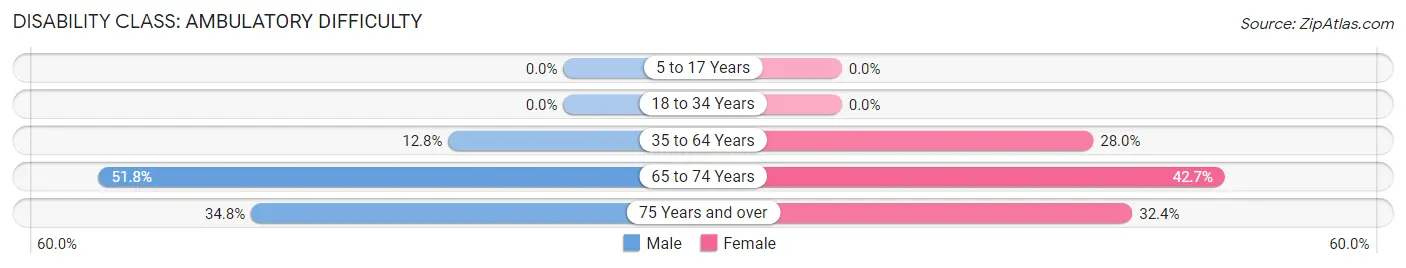
| Age Bracket | Male | Female |
| 5 to 17 Years | 0 (0.0%) | 0 (0.0%) |
| 18 to 34 Years | 0 (0.0%) | 0 (0.0%) |
| 35 to 64 Years | 51 (12.8%) | 121 (28.0%) |
| 65 to 74 Years | 74 (51.7%) | 58 (42.6%) |
| 75 Years and over | 8 (34.8%) | 11 (32.4%) |
Disability Class: Self-Care Difficulty
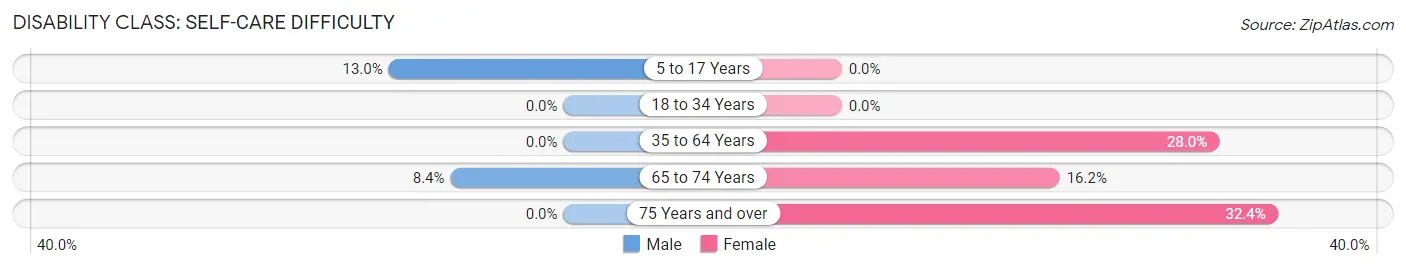
| Age Bracket | Male | Female |
| 5 to 17 Years | 27 (13.0%) | 0 (0.0%) |
| 18 to 34 Years | 0 (0.0%) | 0 (0.0%) |
| 35 to 64 Years | 0 (0.0%) | 121 (28.0%) |
| 65 to 74 Years | 12 (8.4%) | 22 (16.2%) |
| 75 Years and over | 0 (0.0%) | 11 (32.4%) |
Technology Access in Privateer
Computing Device Access in Privateer
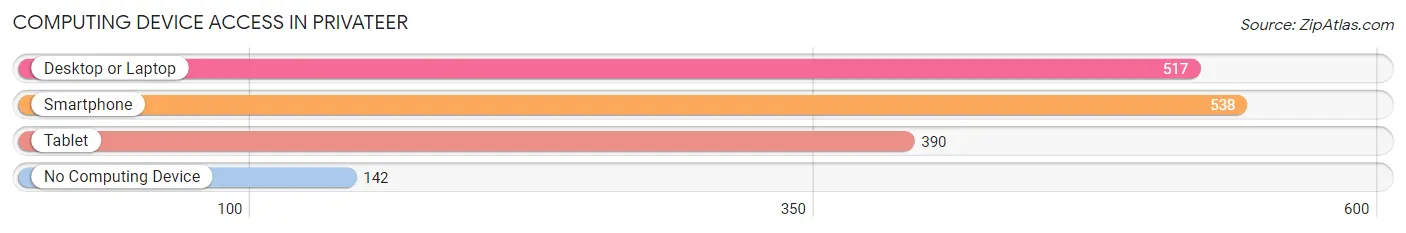
| Device Type | # Households | % Households |
| Desktop or Laptop | 517 | 69.8% |
| Smartphone | 538 | 72.6% |
| Tablet | 390 | 52.6% |
| No Computing Device | 142 | 19.2% |
| Total | 741 | 100.0% |
Internet Access in Privateer
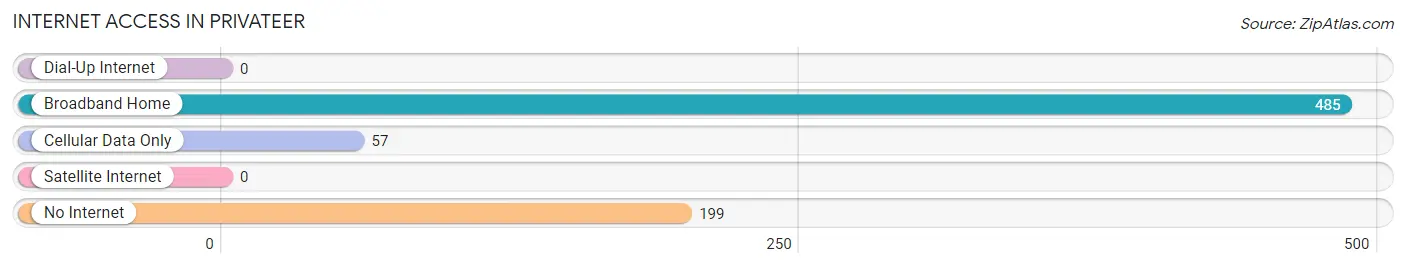
| Internet Type | # Households | % Households |
| Dial-Up Internet | 0 | 0.0% |
| Broadband Home | 485 | 65.4% |
| Cellular Data Only | 57 | 7.7% |
| Satellite Internet | 0 | 0.0% |
| No Internet | 199 | 26.9% |
| Total | 741 | 100.0% |
Privateer Summary
Privateer, South Carolina is a small town located in the Lowcountry region of the state. It is situated in the northern part of Beaufort County, about 20 miles south of the city of Beaufort. The town is bordered by the towns of Port Royal to the north, Burton to the east, and St. Helena Island to the south. Privateer has a population of approximately 1,500 people, and is part of the Hilton Head Island-Beaufort Metropolitan Statistical Area.
Geography
Privateer is located in the Lowcountry region of South Carolina, which is characterized by its flat terrain and coastal marshes. The town is situated on the banks of the Coosaw River, which is a tributary of the Beaufort River. The town is surrounded by a variety of natural habitats, including salt marshes, tidal creeks, and maritime forests. The town is also home to a variety of wildlife, including deer, alligators, and a variety of birds.
The climate in Privateer is humid subtropical, with hot, humid summers and mild winters. The average annual temperature is around 70 degrees Fahrenheit, and the average annual precipitation is around 50 inches.
Economy
The economy of Privateer is largely based on tourism and agriculture. The town is home to several tourist attractions, including the Coosaw River Marina, the Privateer Yacht Club, and the Privateer Golf Course. The town is also home to several farms, which produce a variety of crops, including corn, soybeans, and cotton.
In addition to agriculture and tourism, Privateer is home to several small businesses, including restaurants, retail stores, and service providers. The town is also home to a number of manufacturing companies, which produce a variety of products, including furniture, clothing, and electronics.
Demographics
As of the 2010 census, the population of Privateer was 1,500 people. The racial makeup of the town was 79.3% White, 15.3% African American, 0.7% Native American, 0.7% Asian, and 3.7% from other races. The median household income was $37,500, and the median family income was $45,000.
The town is served by the Beaufort County School District, which operates two elementary schools, one middle school, and one high school. The town is also home to a number of private schools, including the Privateer Academy and the Privateer Christian Academy.
Conclusion
Privateer, South Carolina is a small town located in the Lowcountry region of the state. It is situated in the northern part of Beaufort County, about 20 miles south of the city of Beaufort. The town is bordered by the towns of Port Royal to the north, Burton to the east, and St. Helena Island to the south. Privateer has a population of approximately 1,500 people, and is part of the Hilton Head Island-Beaufort Metropolitan Statistical Area. The economy of Privateer is largely based on tourism and agriculture, and the town is home to several tourist attractions, farms, small businesses, and manufacturing companies. The racial makeup of the town is 79.3% White, 15.3% African American, 0.7% Native American, 0.7% Asian, and 3.7% from other races. The median household income was $37,500, and the median family income was $45,000. Privateer is served by the Beaufort County School District, which operates two elementary schools, one middle school, and one high school. The town is also home to a number of private schools.
Common Questions
What is Per Capita Income in Privateer?
Per Capita income in Privateer is $25,148.
What is the Median Family Income in Privateer?
Median Family Income in Privateer is $79,688.
What is the Median Household income in Privateer?
Median Household Income in Privateer is $59,116.
What is Income or Wage Gap in Privateer?
Income or Wage Gap in Privateer is 62.7%.
Women in Privateer earn 37.3 cents for every dollar earned by a man.
What is Inequality or Gini Index in Privateer?
Inequality or Gini Index in Privateer is 0.41.
What is the Total Population of Privateer?
Total Population of Privateer is 2,191.
What is the Total Male Population of Privateer?
Total Male Population of Privateer is 1,119.
What is the Total Female Population of Privateer?
Total Female Population of Privateer is 1,072.
What is the Ratio of Males per 100 Females in Privateer?
There are 104.38 Males per 100 Females in Privateer.
What is the Ratio of Females per 100 Males in Privateer?
There are 95.80 Females per 100 Males in Privateer.
What is the Median Population Age in Privateer?
Median Population Age in Privateer is 40.2 Years.
What is the Average Family Size in Privateer
Average Family Size in Privateer is 3.8 People.
What is the Average Household Size in Privateer
Average Household Size in Privateer is 3.0 People.
How Large is the Labor Force in Privateer?
There are 877 People in the Labor Forcein in Privateer.
What is the Percentage of People in the Labor Force in Privateer?
54.2% of People are in the Labor Force in Privateer.
What is the Unemployment Rate in Privateer?
Unemployment Rate in Privateer is 11.2%.