Lesslie, SC Map & Demographics
Lesslie Map
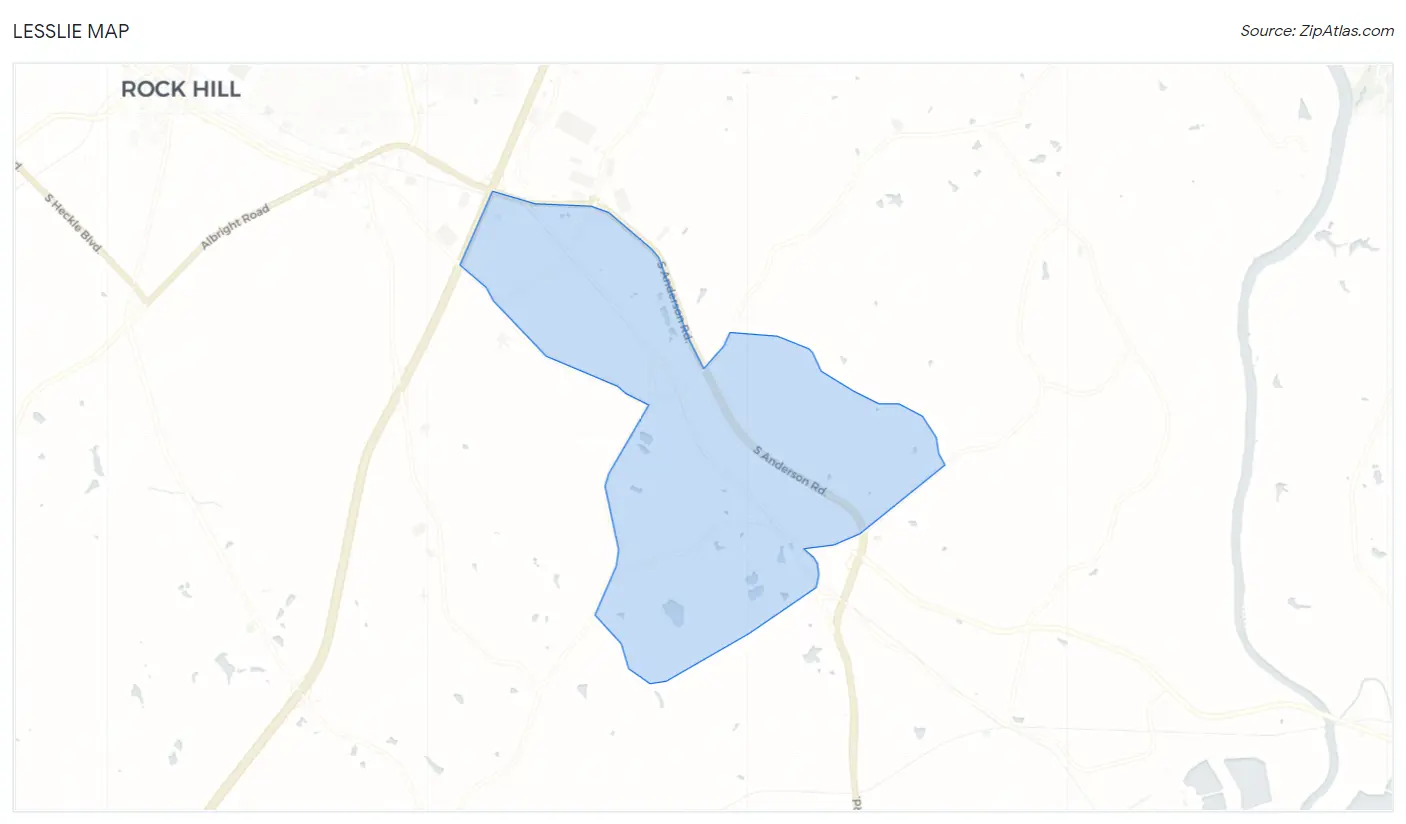
Lesslie Overview
$30,523
PER CAPITA INCOME
$93,864
AVG FAMILY INCOME
$77,500
AVG HOUSEHOLD INCOME
32.7%
WAGE / INCOME GAP [ % ]
67.3¢/ $1
WAGE / INCOME GAP [ $ ]
0.32
INEQUALITY / GINI INDEX
3,114
TOTAL POPULATION
1,486
MALE POPULATION
1,628
FEMALE POPULATION
91.28
MALES / 100 FEMALES
109.56
FEMALES / 100 MALES
38.7
MEDIAN AGE
3.1
AVG FAMILY SIZE
2.8
AVG HOUSEHOLD SIZE
1,579
LABOR FORCE [ PEOPLE ]
66.7%
PERCENT IN LABOR FORCE
5.8%
UNEMPLOYMENT RATE
Income in Lesslie
Income Overview in Lesslie
Per Capita Income in Lesslie is $30,523, while median incomes of families and households are $93,864 and $77,500 respectively.
| Characteristic | Number | Measure |
| Per Capita Income | 3,114 | $30,523 |
| Median Family Income | 846 | $93,864 |
| Mean Family Income | 846 | $89,132 |
| Median Household Income | 1,102 | $77,500 |
| Mean Household Income | 1,102 | $84,824 |
| Income Deficit | 846 | $0 |
| Wage / Income Gap (%) | 3,114 | 32.67% |
| Wage / Income Gap ($) | 3,114 | 67.33¢ per $1 |
| Gini / Inequality Index | 3,114 | 0.32 |
Earnings by Sex in Lesslie
Average Earnings in Lesslie are $40,098, $52,706 for men and $35,486 for women, a difference of 32.7%.
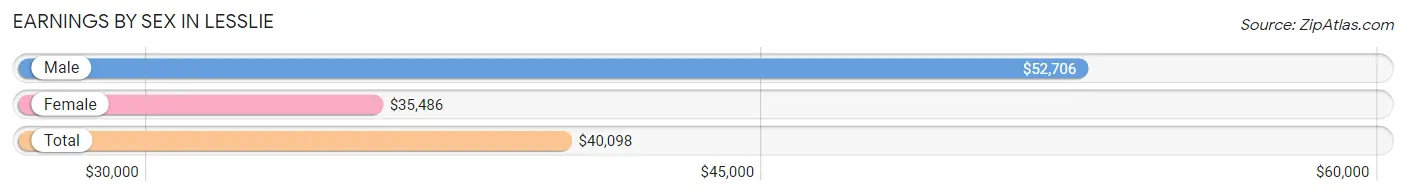
| Sex | Number | Average Earnings |
| Male | 815 (48.6%) | $52,706 |
| Female | 863 (51.4%) | $35,486 |
| Total | 1,678 (100.0%) | $40,098 |
Earnings by Sex by Income Bracket in Lesslie
The most common earnings brackets in Lesslie are $35,000 to $39,999 for men (257 | 31.5%) and $55,000 to $64,999 for women (171 | 19.8%).
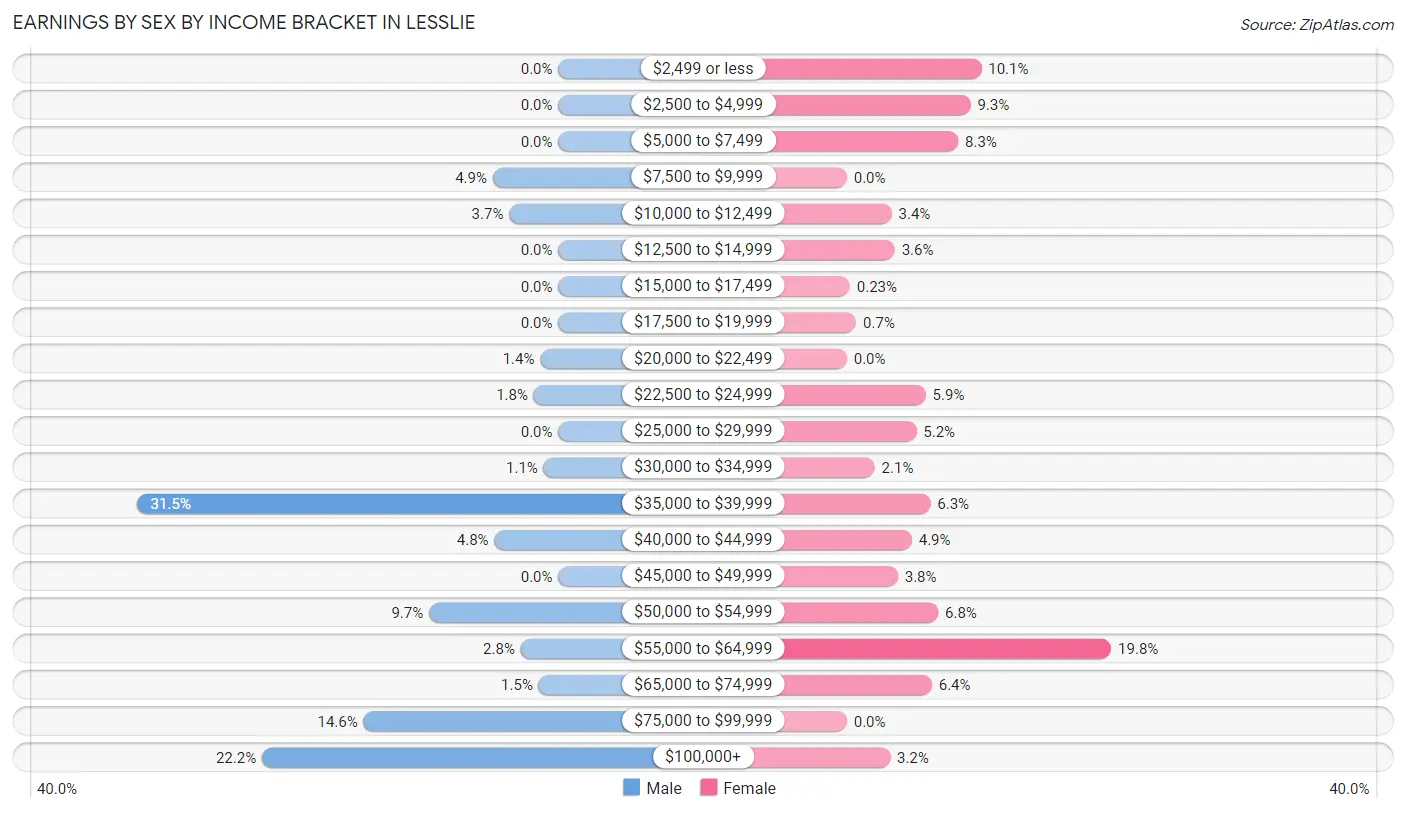
| Income | Male | Female |
| $2,499 or less | 0 (0.0%) | 87 (10.1%) |
| $2,500 to $4,999 | 0 (0.0%) | 80 (9.3%) |
| $5,000 to $7,499 | 0 (0.0%) | 72 (8.3%) |
| $7,500 to $9,999 | 40 (4.9%) | 0 (0.0%) |
| $10,000 to $12,499 | 30 (3.7%) | 29 (3.4%) |
| $12,500 to $14,999 | 0 (0.0%) | 31 (3.6%) |
| $15,000 to $17,499 | 0 (0.0%) | 2 (0.2%) |
| $17,500 to $19,999 | 0 (0.0%) | 6 (0.7%) |
| $20,000 to $22,499 | 11 (1.3%) | 0 (0.0%) |
| $22,500 to $24,999 | 15 (1.8%) | 51 (5.9%) |
| $25,000 to $29,999 | 0 (0.0%) | 45 (5.2%) |
| $30,000 to $34,999 | 9 (1.1%) | 18 (2.1%) |
| $35,000 to $39,999 | 257 (31.5%) | 54 (6.3%) |
| $40,000 to $44,999 | 39 (4.8%) | 42 (4.9%) |
| $45,000 to $49,999 | 0 (0.0%) | 33 (3.8%) |
| $50,000 to $54,999 | 79 (9.7%) | 59 (6.8%) |
| $55,000 to $64,999 | 23 (2.8%) | 171 (19.8%) |
| $65,000 to $74,999 | 12 (1.5%) | 55 (6.4%) |
| $75,000 to $99,999 | 119 (14.6%) | 0 (0.0%) |
| $100,000+ | 181 (22.2%) | 28 (3.2%) |
| Total | 815 (100.0%) | 863 (100.0%) |
Earnings by Sex by Educational Attainment in Lesslie
Average earnings in Lesslie are $53,339 for men and $47,500 for women, a difference of 11.0%. Men with an educational attainment of bachelor's degree enjoy the highest average annual earnings of $116,417, while those with high school diploma education earn the least with $38,648. Women with an educational attainment of college or associate's degree earn the most with the average annual earnings of $55,184, while those with high school diploma education have the smallest earnings of $40,739.
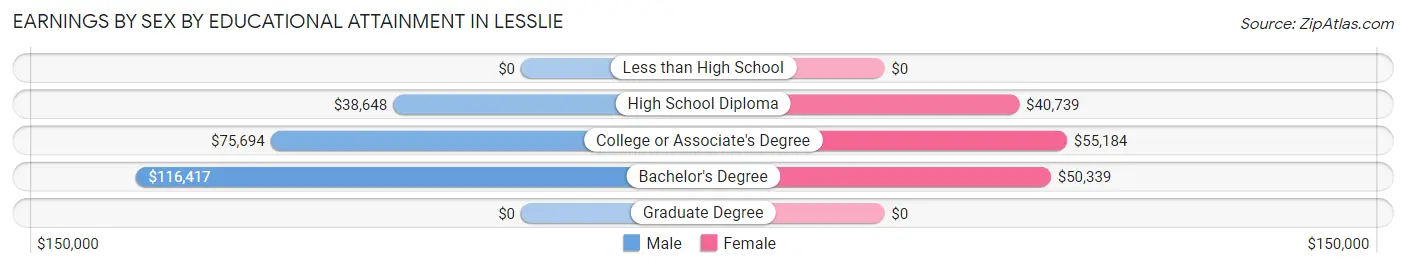
| Educational Attainment | Male Income | Female Income |
| Less than High School | - | - |
| High School Diploma | $38,648 | $40,739 |
| College or Associate's Degree | $75,694 | $55,184 |
| Bachelor's Degree | $116,417 | $50,339 |
| Graduate Degree | - | - |
| Total | $53,339 | $47,500 |
Family Income in Lesslie
Family Income Brackets in Lesslie
According to the Lesslie family income data, there are 256 families falling into the $100,000 to $149,999 income range, which is the most common income bracket and makes up 30.3% of all families.
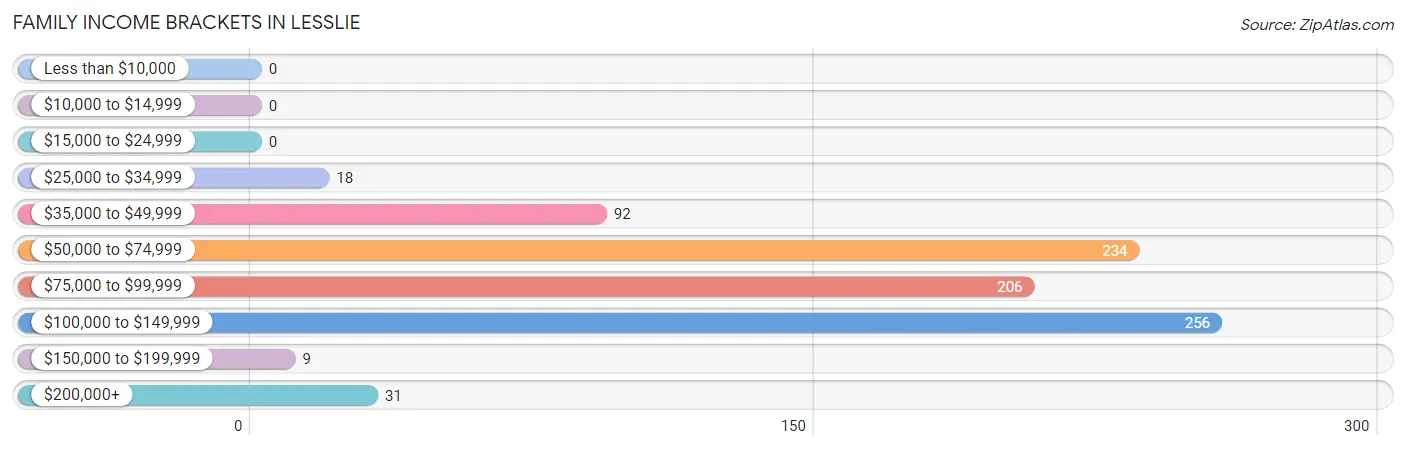
| Income Bracket | # Families | % Families |
| Less than $10,000 | 0 | 0.0% |
| $10,000 to $14,999 | 0 | 0.0% |
| $15,000 to $24,999 | 0 | 0.0% |
| $25,000 to $34,999 | 18 | 2.1% |
| $35,000 to $49,999 | 92 | 10.9% |
| $50,000 to $74,999 | 234 | 27.7% |
| $75,000 to $99,999 | 206 | 24.3% |
| $100,000 to $149,999 | 256 | 30.3% |
| $150,000 to $199,999 | 9 | 1.1% |
| $200,000+ | 31 | 3.7% |
Family Income by Famaliy Size in Lesslie
3-person families (187 | 22.1%) account for the highest median family income in Lesslie with $106,512 per family, while 2-person families (431 | 50.9%) have the highest median income of $46,988 per family member.
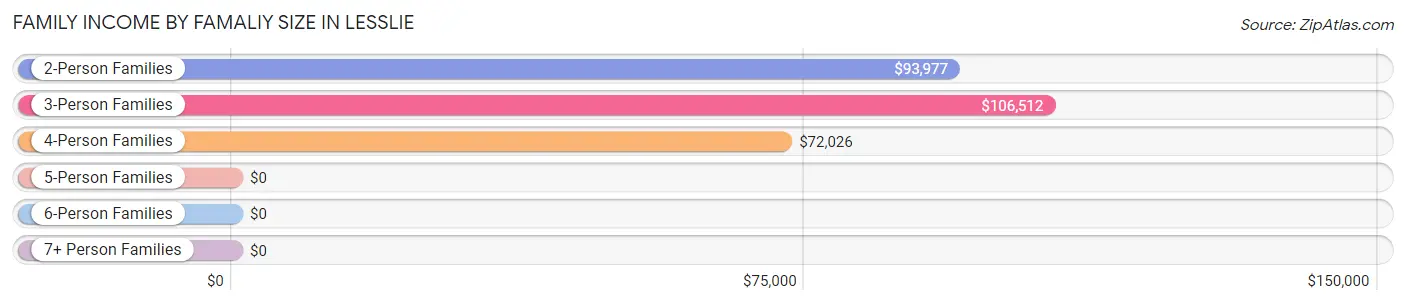
| Income Bracket | # Families | Median Income |
| 2-Person Families | 431 (50.9%) | $93,977 |
| 3-Person Families | 187 (22.1%) | $106,512 |
| 4-Person Families | 143 (16.9%) | $72,026 |
| 5-Person Families | 27 (3.2%) | $0 |
| 6-Person Families | 54 (6.4%) | $0 |
| 7+ Person Families | 4 (0.5%) | $0 |
| Total | 846 (100.0%) | $93,864 |
Family Income by Number of Earners in Lesslie
The median family income in Lesslie is $93,864, with families comprising 3+ earners (63) having the highest median family income of $182,361, while families with 1 earner (315) have the lowest median family income of $56,885, accounting for 7.4% and 37.2% of families, respectively.
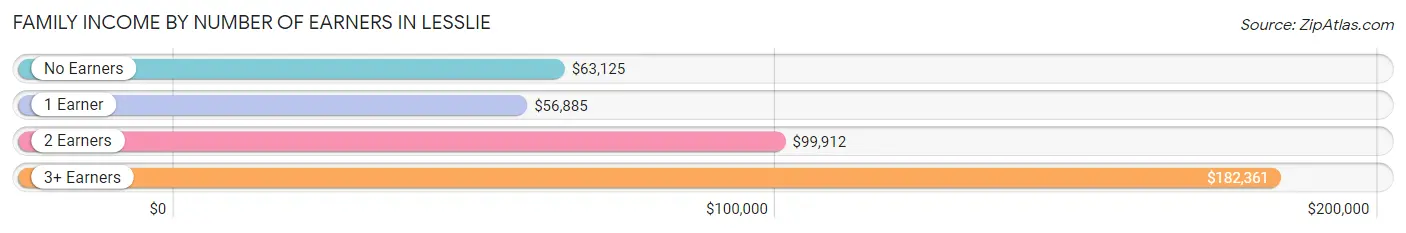
| Number of Earners | # Families | Median Income |
| No Earners | 41 (4.9%) | $63,125 |
| 1 Earner | 315 (37.2%) | $56,885 |
| 2 Earners | 427 (50.5%) | $99,912 |
| 3+ Earners | 63 (7.4%) | $182,361 |
| Total | 846 (100.0%) | $93,864 |
Household Income in Lesslie
Household Income Brackets in Lesslie
With 301 households falling in the category, the $50,000 to $74,999 income range is the most frequent in Lesslie, accounting for 27.3% of all households. In contrast, only 17 households (1.5%) fall into the $10,000 to $14,999 income bracket, making it the least populous group.
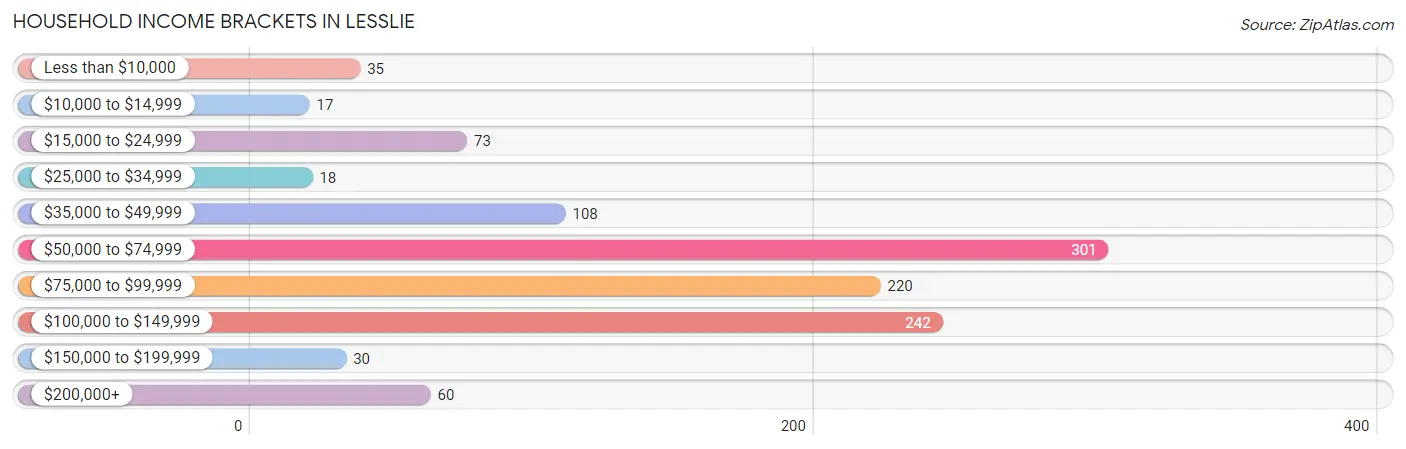
| Income Bracket | # Households | % Households |
| Less than $10,000 | 35 | 3.2% |
| $10,000 to $14,999 | 17 | 1.5% |
| $15,000 to $24,999 | 73 | 6.6% |
| $25,000 to $34,999 | 18 | 1.6% |
| $35,000 to $49,999 | 108 | 9.8% |
| $50,000 to $74,999 | 301 | 27.3% |
| $75,000 to $99,999 | 220 | 20.0% |
| $100,000 to $149,999 | 242 | 22.0% |
| $150,000 to $199,999 | 30 | 2.7% |
| $200,000+ | 60 | 5.4% |
Household Income by Householder Age in Lesslie
The median household income in Lesslie is $77,500, with the highest median household income of $97,818 found in the 45 to 64 years age bracket for the primary householder. A total of 595 households (54.0%) fall into this category.
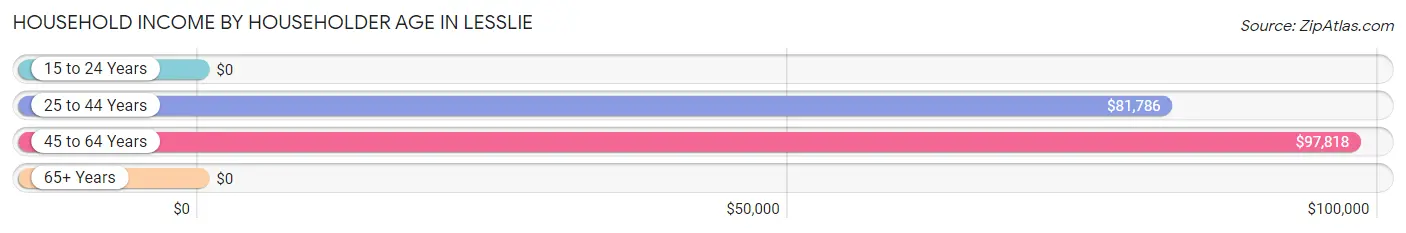
| Income Bracket | # Households | Median Income |
| 15 to 24 Years | 0 (0.0%) | $0 |
| 25 to 44 Years | 336 (30.5%) | $81,786 |
| 45 to 64 Years | 595 (54.0%) | $97,818 |
| 65+ Years | 171 (15.5%) | $0 |
| Total | 1,102 (100.0%) | $77,500 |
Poverty in Lesslie
Income Below Poverty by Sex and Age in Lesslie
With 2.1% poverty level for males and 6.3% for females among the residents of Lesslie, 55 to 64 year old males and 65 to 74 year old females are the most vulnerable to poverty, with 30 males (14.6%) and 29 females (25.4%) in their respective age groups living below the poverty level.
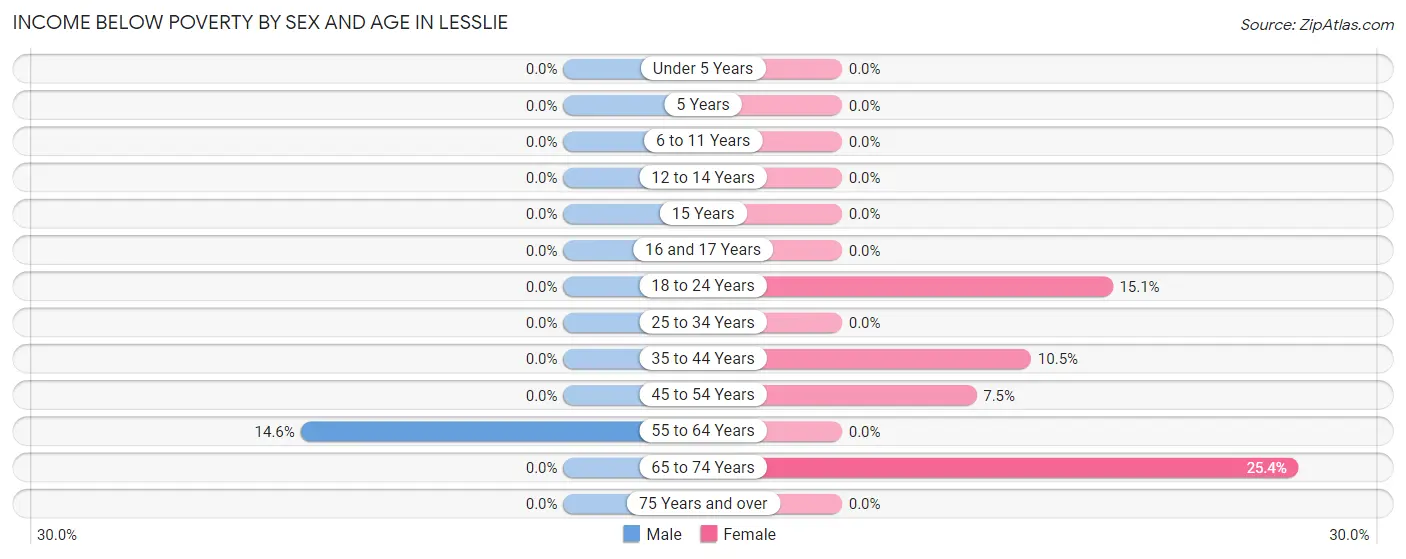
| Age Bracket | Male | Female |
| Under 5 Years | 0 (0.0%) | 0 (0.0%) |
| 5 Years | 0 (0.0%) | 0 (0.0%) |
| 6 to 11 Years | 0 (0.0%) | 0 (0.0%) |
| 12 to 14 Years | 0 (0.0%) | 0 (0.0%) |
| 15 Years | 0 (0.0%) | 0 (0.0%) |
| 16 and 17 Years | 0 (0.0%) | 0 (0.0%) |
| 18 to 24 Years | 0 (0.0%) | 22 (15.1%) |
| 25 to 34 Years | 0 (0.0%) | 0 (0.0%) |
| 35 to 44 Years | 0 (0.0%) | 22 (10.5%) |
| 45 to 54 Years | 0 (0.0%) | 29 (7.5%) |
| 55 to 64 Years | 30 (14.6%) | 0 (0.0%) |
| 65 to 74 Years | 0 (0.0%) | 29 (25.4%) |
| 75 Years and over | 0 (0.0%) | 0 (0.0%) |
| Total | 30 (2.1%) | 102 (6.3%) |
Income Above Poverty by Sex and Age in Lesslie
According to the poverty statistics in Lesslie, males aged under 5 years and females aged under 5 years are the age groups that are most secure financially, with 100.0% of males and 100.0% of females in these age groups living above the poverty line.
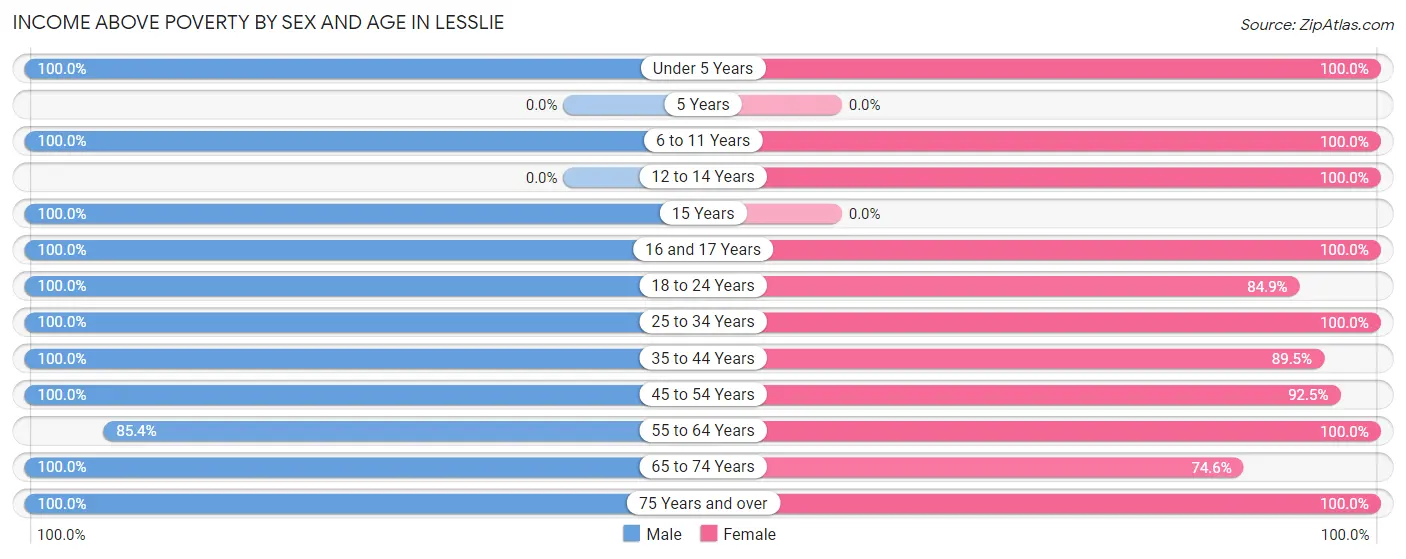
| Age Bracket | Male | Female |
| Under 5 Years | 86 (100.0%) | 21 (100.0%) |
| 5 Years | 0 (0.0%) | 0 (0.0%) |
| 6 to 11 Years | 276 (100.0%) | 165 (100.0%) |
| 12 to 14 Years | 0 (0.0%) | 111 (100.0%) |
| 15 Years | 53 (100.0%) | 0 (0.0%) |
| 16 and 17 Years | 37 (100.0%) | 83 (100.0%) |
| 18 to 24 Years | 58 (100.0%) | 124 (84.9%) |
| 25 to 34 Years | 291 (100.0%) | 120 (100.0%) |
| 35 to 44 Years | 171 (100.0%) | 187 (89.5%) |
| 45 to 54 Years | 181 (100.0%) | 358 (92.5%) |
| 55 to 64 Years | 175 (85.4%) | 192 (100.0%) |
| 65 to 74 Years | 69 (100.0%) | 85 (74.6%) |
| 75 Years and over | 24 (100.0%) | 80 (100.0%) |
| Total | 1,421 (97.9%) | 1,526 (93.7%) |
Income Below Poverty Among Married-Couple Families in Lesslie
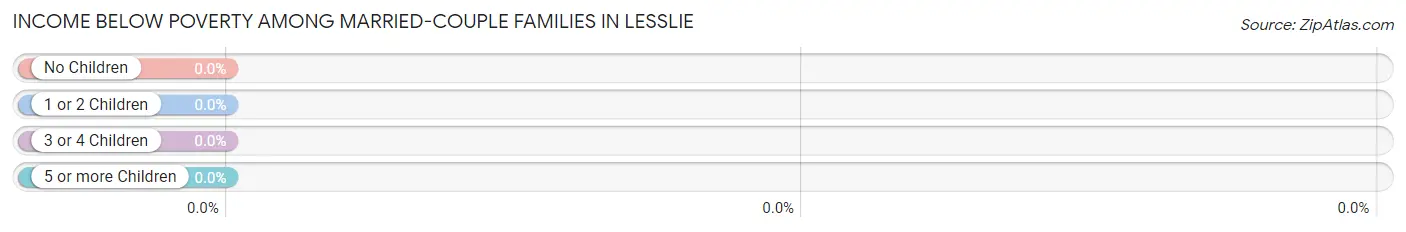
| Children | Above Poverty | Below Poverty |
| No Children | 308 (100.0%) | 0 (0.0%) |
| 1 or 2 Children | 134 (100.0%) | 0 (0.0%) |
| 3 or 4 Children | 81 (100.0%) | 0 (0.0%) |
| 5 or more Children | 0 (0.0%) | 0 (0.0%) |
| Total | 523 (100.0%) | 0 (0.0%) |
Income Below Poverty Among Single-Parent Households in Lesslie
| Children | Single Father | Single Mother |
| No Children | 0 (0.0%) | 0 (0.0%) |
| 1 or 2 Children | 0 (0.0%) | 0 (0.0%) |
| 3 or 4 Children | 0 (0.0%) | 0 (0.0%) |
| 5 or more Children | 0 (0.0%) | 0 (0.0%) |
| Total | 0 (0.0%) | 0 (0.0%) |
Income Below Poverty Among Married-Couple vs Single-Parent Households in Lesslie
| Children | Married-Couple Families | Single-Parent Households |
| No Children | 0 (0.0%) | 0 (0.0%) |
| 1 or 2 Children | 0 (0.0%) | 0 (0.0%) |
| 3 or 4 Children | 0 (0.0%) | 0 (0.0%) |
| 5 or more Children | 0 (0.0%) | 0 (0.0%) |
| Total | 0 (0.0%) | 0 (0.0%) |
Race in Lesslie
The most populous races in Lesslie are White / Caucasian (2,475 | 79.5%), Black / African American (510 | 16.4%), and Two or more Races (129 | 4.1%).
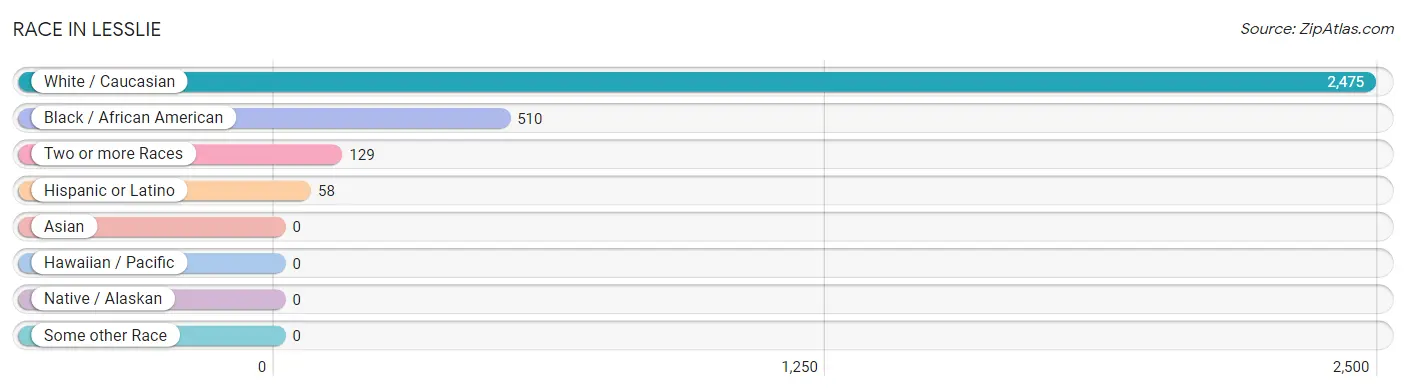
| Race | # Population | % Population |
| Asian | 0 | 0.0% |
| Black / African American | 510 | 16.4% |
| Hawaiian / Pacific | 0 | 0.0% |
| Hispanic or Latino | 58 | 1.9% |
| Native / Alaskan | 0 | 0.0% |
| White / Caucasian | 2,475 | 79.5% |
| Two or more Races | 129 | 4.1% |
| Some other Race | 0 | 0.0% |
| Total | 3,114 | 100.0% |
Ancestry in Lesslie
The most populous ancestries reported in Lesslie are American (642 | 20.6%), Irish (413 | 13.3%), German (401 | 12.9%), English (284 | 9.1%), and Scotch-Irish (98 | 3.2%), together accounting for 59.0% of all Lesslie residents.
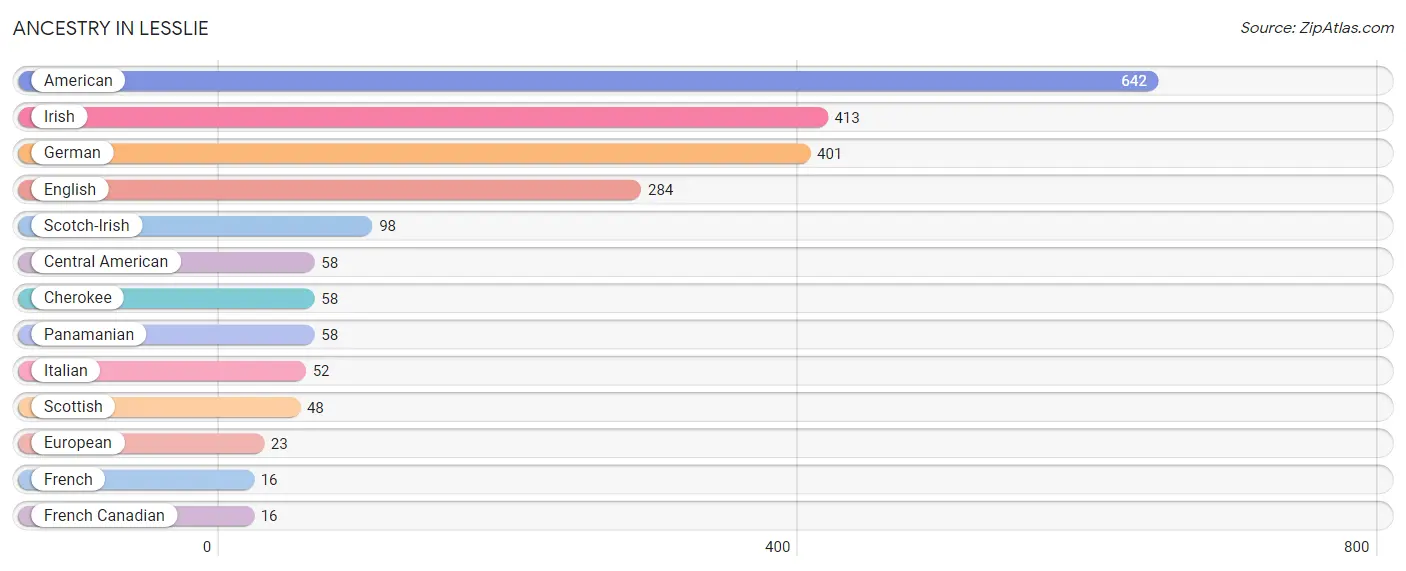
| Ancestry | # Population | % Population |
| American | 642 | 20.6% |
| Central American | 58 | 1.9% |
| Cherokee | 58 | 1.9% |
| English | 284 | 9.1% |
| European | 23 | 0.7% |
| French | 16 | 0.5% |
| French Canadian | 16 | 0.5% |
| German | 401 | 12.9% |
| Irish | 413 | 13.3% |
| Italian | 52 | 1.7% |
| Panamanian | 58 | 1.9% |
| Scotch-Irish | 98 | 3.2% |
| Scottish | 48 | 1.5% | View All 13 Rows |
Immigrants in Lesslie
The most numerous immigrant groups reported in Lesslie came from , and Canada (11 | 0.4%), together accounting for 0.4% of all Lesslie residents.

| Immigration Origin | # Population | % Population |
| Canada | 11 | 0.4% | View All 1 Rows |
Sex and Age in Lesslie
Sex and Age in Lesslie
The most populous age groups in Lesslie are 5 to 9 Years (255 | 17.2%) for men and 45 to 49 Years (258 | 15.9%) for women.
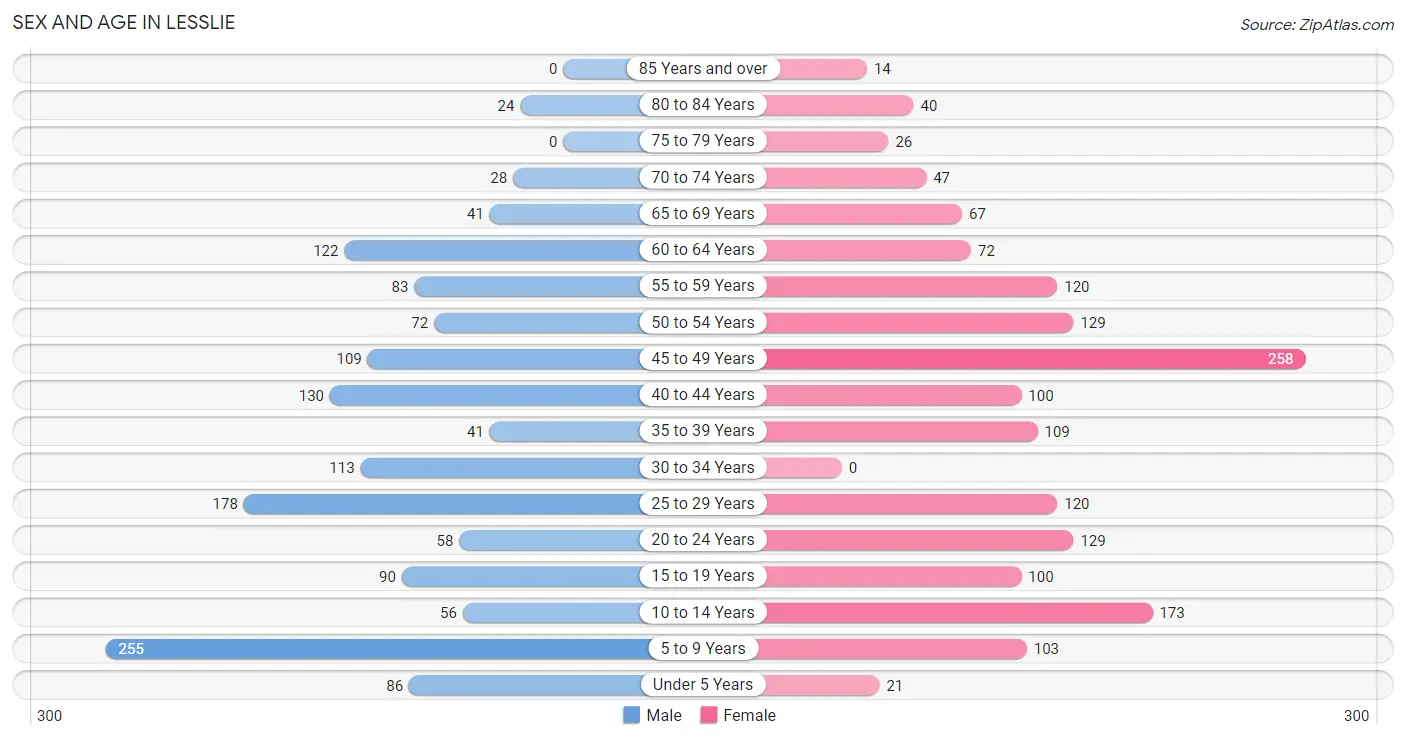
| Age Bracket | Male | Female |
| Under 5 Years | 86 (5.8%) | 21 (1.3%) |
| 5 to 9 Years | 255 (17.2%) | 103 (6.3%) |
| 10 to 14 Years | 56 (3.8%) | 173 (10.6%) |
| 15 to 19 Years | 90 (6.1%) | 100 (6.1%) |
| 20 to 24 Years | 58 (3.9%) | 129 (7.9%) |
| 25 to 29 Years | 178 (12.0%) | 120 (7.4%) |
| 30 to 34 Years | 113 (7.6%) | 0 (0.0%) |
| 35 to 39 Years | 41 (2.8%) | 109 (6.7%) |
| 40 to 44 Years | 130 (8.7%) | 100 (6.1%) |
| 45 to 49 Years | 109 (7.3%) | 258 (15.9%) |
| 50 to 54 Years | 72 (4.9%) | 129 (7.9%) |
| 55 to 59 Years | 83 (5.6%) | 120 (7.4%) |
| 60 to 64 Years | 122 (8.2%) | 72 (4.4%) |
| 65 to 69 Years | 41 (2.8%) | 67 (4.1%) |
| 70 to 74 Years | 28 (1.9%) | 47 (2.9%) |
| 75 to 79 Years | 0 (0.0%) | 26 (1.6%) |
| 80 to 84 Years | 24 (1.6%) | 40 (2.5%) |
| 85 Years and over | 0 (0.0%) | 14 (0.9%) |
| Total | 1,486 (100.0%) | 1,628 (100.0%) |
Families and Households in Lesslie
Median Family Size in Lesslie
The median family size in Lesslie is 3.14 persons per family, with married-couple families (523 | 61.8%) accounting for the largest median family size of 3.35 persons per family. On the other hand, single female/mother families (233 | 27.5%) represent the smallest median family size with 2.61 persons per family.
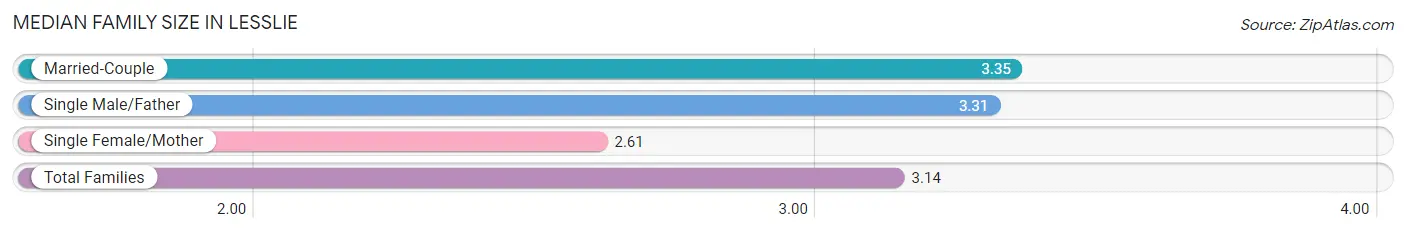
| Family Type | # Families | Family Size |
| Married-Couple | 523 (61.8%) | 3.35 |
| Single Male/Father | 90 (10.6%) | 3.31 |
| Single Female/Mother | 233 (27.5%) | 2.61 |
| Total Families | 846 (100.0%) | 3.14 |
Median Household Size in Lesslie
The median household size in Lesslie is 2.82 persons per household, with single male/father households (90 | 8.2%) accounting for the largest median household size of 4.34 persons per household. non-family households (256 | 23.2%) represent the smallest median household size with 1.23 persons per household.
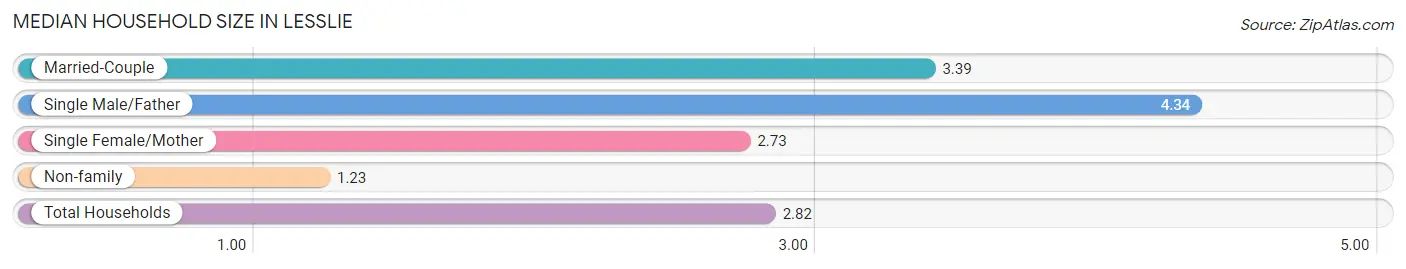
| Household Type | # Households | Household Size |
| Married-Couple | 523 (47.5%) | 3.39 |
| Single Male/Father | 90 (8.2%) | 4.34 |
| Single Female/Mother | 233 (21.1%) | 2.73 |
| Non-family | 256 (23.2%) | 1.23 |
| Total Households | 1,102 (100.0%) | 2.82 |
Household Size by Marriage Status in Lesslie
Out of a total of 1,102 households in Lesslie, 846 (76.8%) are family households, while 256 (23.2%) are nonfamily households. The most numerous type of family households are 2-person households, comprising 403, and the most common type of nonfamily households are 1-person households, comprising 212.
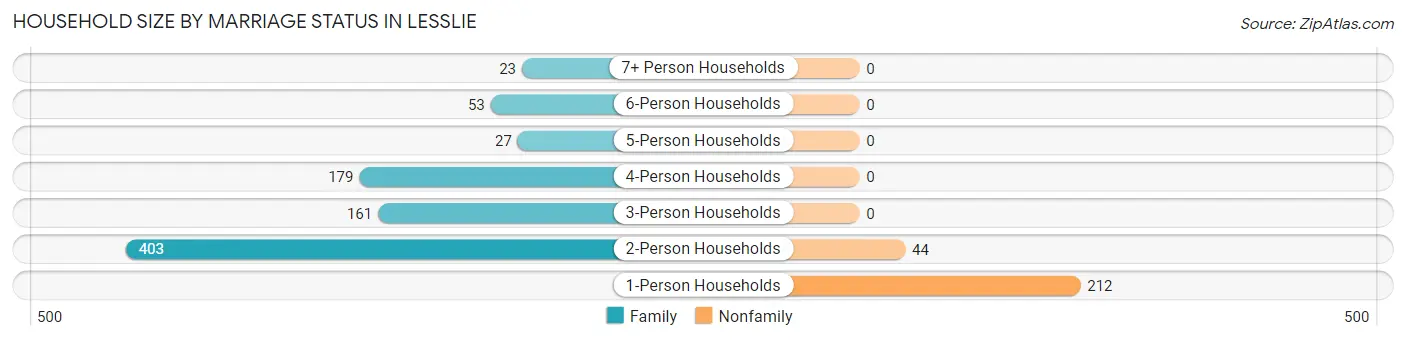
| Household Size | Family Households | Nonfamily Households |
| 1-Person Households | - | 212 (19.2%) |
| 2-Person Households | 403 (36.6%) | 44 (4.0%) |
| 3-Person Households | 161 (14.6%) | 0 (0.0%) |
| 4-Person Households | 179 (16.2%) | 0 (0.0%) |
| 5-Person Households | 27 (2.5%) | 0 (0.0%) |
| 6-Person Households | 53 (4.8%) | 0 (0.0%) |
| 7+ Person Households | 23 (2.1%) | 0 (0.0%) |
| Total | 846 (76.8%) | 256 (23.2%) |
Female Fertility in Lesslie
Fertility by Age in Lesslie
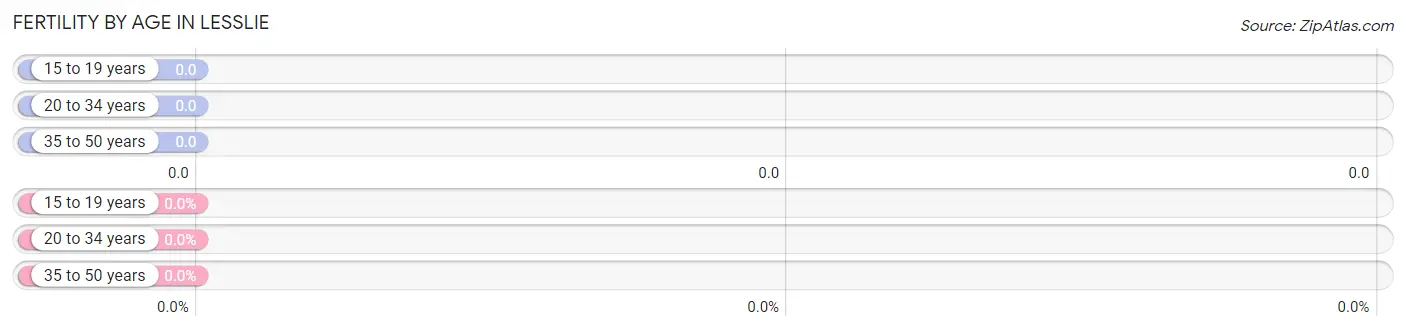
| Age Bracket | Women with Births | Births / 1,000 Women |
| 15 to 19 years | 0 (0.0%) | 0.0 |
| 20 to 34 years | 0 (0.0%) | 0.0 |
| 35 to 50 years | 0 (0.0%) | 0.0 |
| Total | 0 (0.0%) | 0.0 |
Fertility by Age by Marriage Status in Lesslie
| Age Bracket | Married | Unmarried |
| 15 to 19 years | 0 (0.0%) | 0 (0.0%) |
| 20 to 34 years | 0 (0.0%) | 0 (0.0%) |
| 35 to 50 years | 0 (0.0%) | 0 (0.0%) |
| Total | 0 (0.0%) | 0 (0.0%) |
Fertility by Education in Lesslie
| Educational Attainment | Women with Births | Births / 1,000 Women |
| Less than High School | 0 (0.0%) | 0.0 |
| High School Diploma | 0 (0.0%) | 0.0 |
| College or Associate's Degree | 0 (0.0%) | 0.0 |
| Bachelor's Degree | 0 (0.0%) | 0.0 |
| Graduate Degree | 0 (0.0%) | 0.0 |
| Total | 0 (0.0%) | 0.0 |
Fertility by Education by Marriage Status in Lesslie
| Educational Attainment | Married | Unmarried |
| Less than High School | 0 (0.0%) | 0 (0.0%) |
| High School Diploma | 0 (0.0%) | 0 (0.0%) |
| College or Associate's Degree | 0 (0.0%) | 0 (0.0%) |
| Bachelor's Degree | 0 (0.0%) | 0 (0.0%) |
| Graduate Degree | 0 (0.0%) | 0 (0.0%) |
| Total | 0 (0.0%) | 0 (0.0%) |
Employment Characteristics in Lesslie
Employment by Class of Employer in Lesslie
Among the 1,372 employed individuals in Lesslie, private company employees (1,149 | 83.8%), local government employees (86 | 6.3%), and state government employees (51 | 3.7%) make up the most common classes of employment.
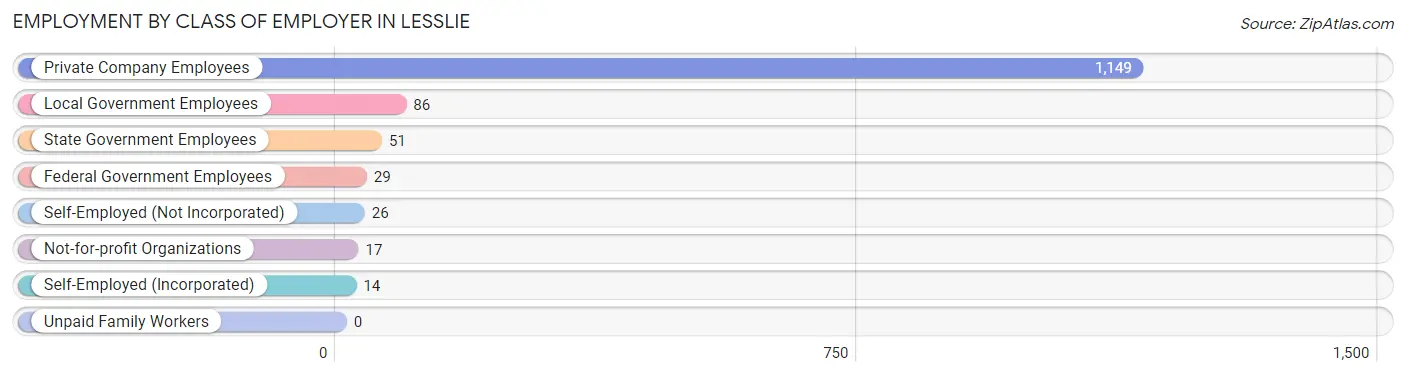
| Employer Class | # Employees | % Employees |
| Private Company Employees | 1,149 | 83.8% |
| Self-Employed (Incorporated) | 14 | 1.0% |
| Self-Employed (Not Incorporated) | 26 | 1.9% |
| Not-for-profit Organizations | 17 | 1.2% |
| Local Government Employees | 86 | 6.3% |
| State Government Employees | 51 | 3.7% |
| Federal Government Employees | 29 | 2.1% |
| Unpaid Family Workers | 0 | 0.0% |
| Total | 1,372 | 100.0% |
Employment Status by Age in Lesslie
According to the labor force statistics for Lesslie, out of the total population over 16 years of age (2,367), 66.7% or 1,579 individuals are in the labor force, with 5.8% or 92 of them unemployed. The age group with the highest labor force participation rate is 35 to 44 years, with 92.6% or 352 individuals in the labor force. Within the labor force, the 20 to 24 years age range has the highest percentage of unemployed individuals, with 31.0% or 40 of them being unemployed.
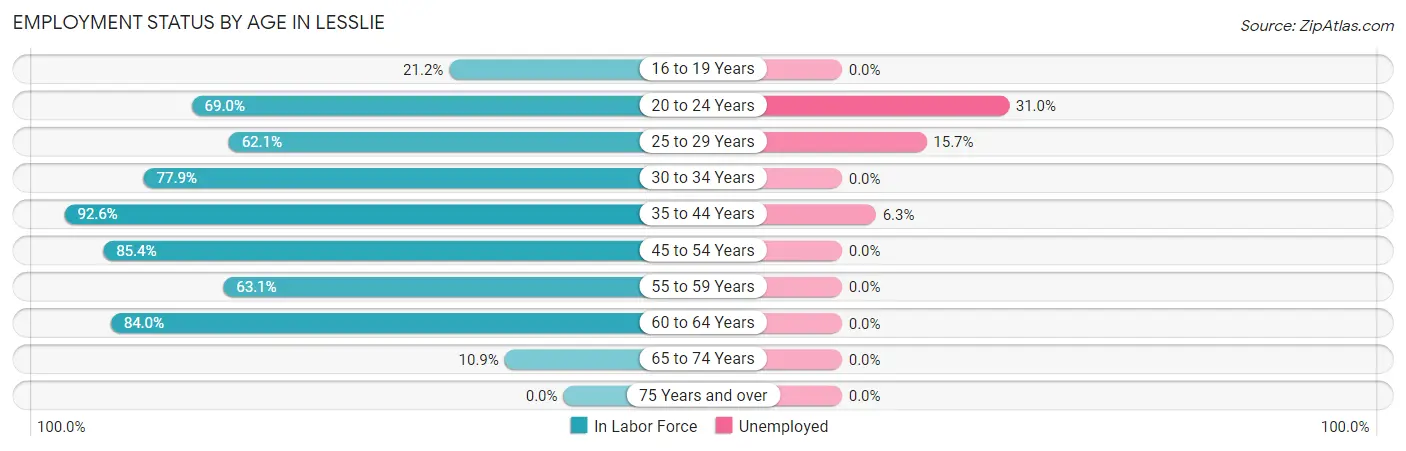
| Age Bracket | In Labor Force | Unemployed |
| 16 to 19 Years | 29 (21.2%) | 0 (0.0%) |
| 20 to 24 Years | 129 (69.0%) | 40 (31.0%) |
| 25 to 29 Years | 185 (62.1%) | 29 (15.7%) |
| 30 to 34 Years | 88 (77.9%) | 0 (0.0%) |
| 35 to 44 Years | 352 (92.6%) | 22 (6.3%) |
| 45 to 54 Years | 485 (85.4%) | 0 (0.0%) |
| 55 to 59 Years | 128 (63.1%) | 0 (0.0%) |
| 60 to 64 Years | 163 (84.0%) | 0 (0.0%) |
| 65 to 74 Years | 20 (10.9%) | 0 (0.0%) |
| 75 Years and over | 0 (0.0%) | 0 (0.0%) |
| Total | 1,579 (66.7%) | 92 (5.8%) |
Employment Status by Educational Attainment in Lesslie
According to labor force statistics for Lesslie, 79.8% of individuals (1,401) out of the total population between 25 and 64 years of age (1,756) are in the labor force, with 3.6% or 50 of them being unemployed. The group with the highest labor force participation rate are those with the educational attainment of bachelor's degree or higher, with 100.0% or 287 individuals in the labor force. Within the labor force, individuals with less than high school education have the highest percentage of unemployment, with 62.9% or 22 of them being unemployed.
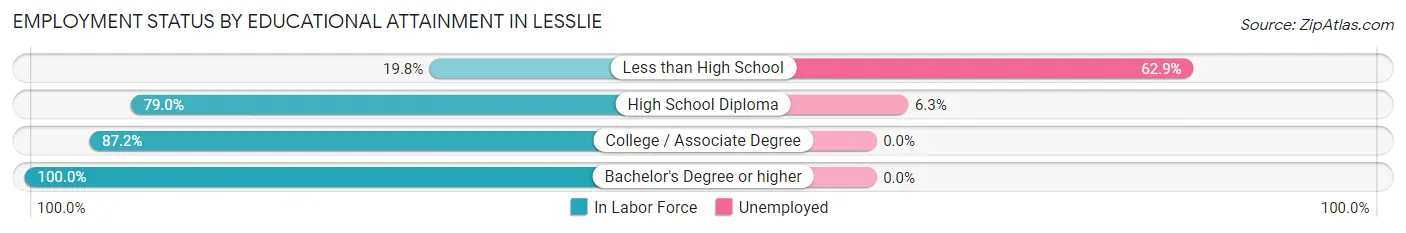
| Educational Attainment | In Labor Force | Unemployed |
| Less than High School | 35 (19.8%) | 111 (62.9%) |
| High School Diploma | 460 (79.0%) | 37 (6.3%) |
| College / Associate Degree | 619 (87.2%) | 0 (0.0%) |
| Bachelor's Degree or higher | 287 (100.0%) | 0 (0.0%) |
| Total | 1,401 (79.8%) | 63 (3.6%) |
Employment Occupations by Sex in Lesslie
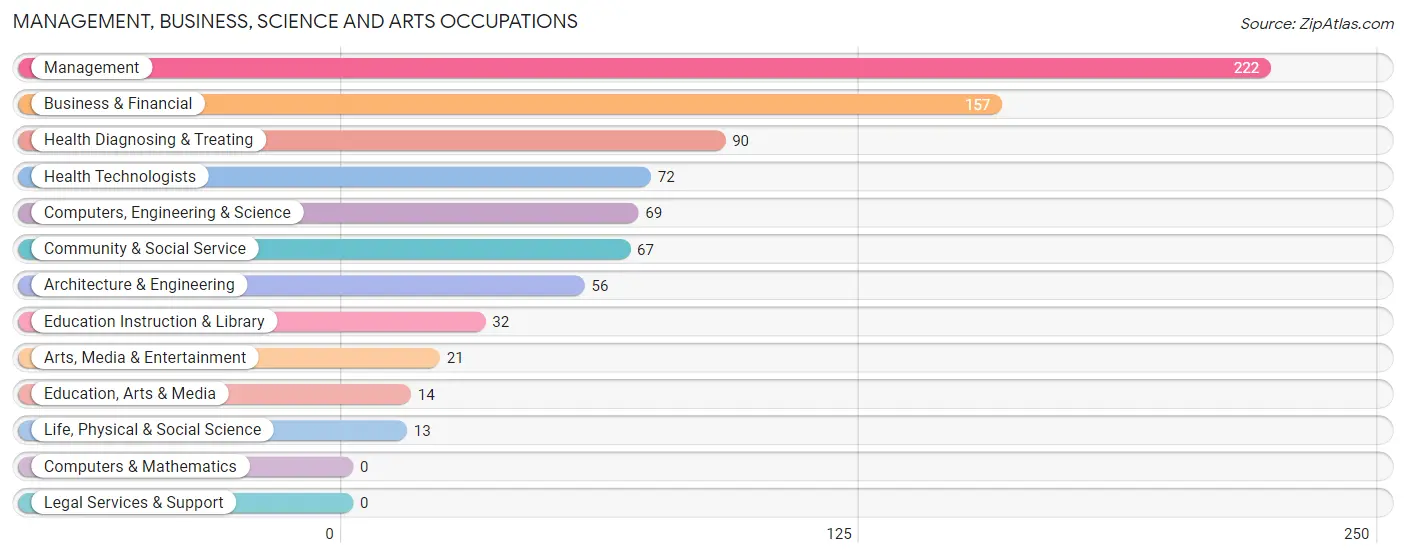
Management, Business, Science and Arts Occupations
The most common Management, Business, Science and Arts occupations in Lesslie are Management (222 | 14.9%), Business & Financial (157 | 10.5%), Health Diagnosing & Treating (90 | 6.0%), Health Technologists (72 | 4.8%), and Computers, Engineering & Science (69 | 4.6%).
Management, Business, Science and Arts Occupations by Sex
Within the Management, Business, Science and Arts occupations in Lesslie, the most male-oriented occupations are Computers, Engineering & Science (100.0%), Architecture & Engineering (100.0%), and Life, Physical & Social Science (100.0%), while the most female-oriented occupations are Community & Social Service (100.0%), Education, Arts & Media (100.0%), and Education Instruction & Library (100.0%).
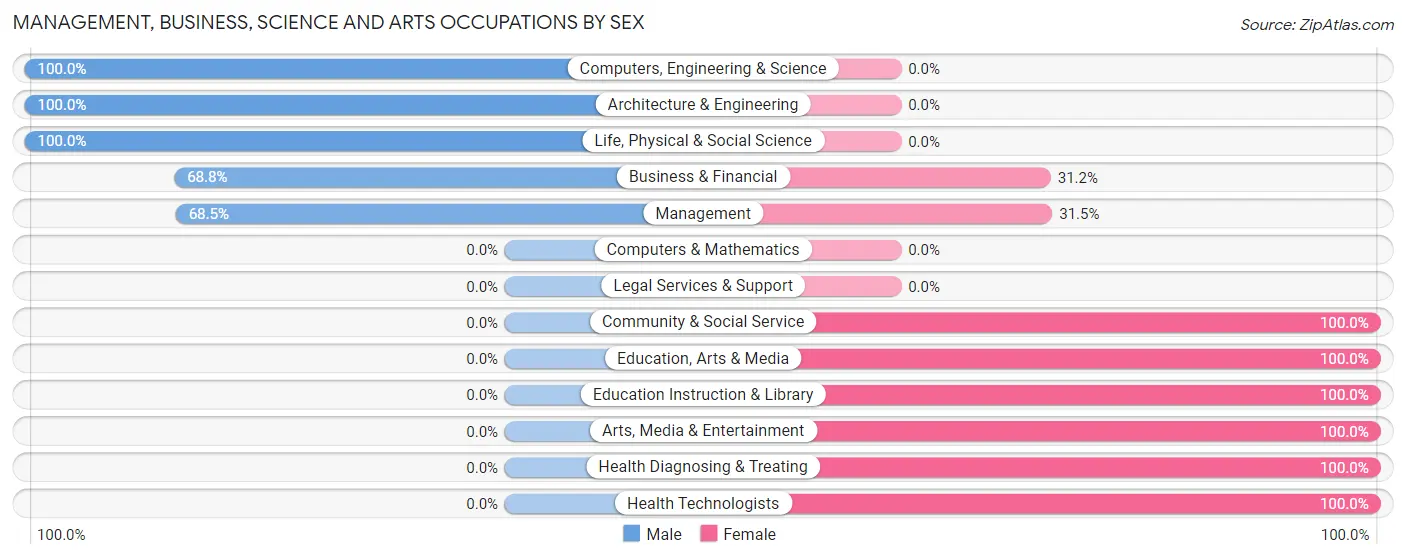
| Occupation | Male | Female |
| Management | 152 (68.5%) | 70 (31.5%) |
| Business & Financial | 108 (68.8%) | 49 (31.2%) |
| Computers, Engineering & Science | 69 (100.0%) | 0 (0.0%) |
| Computers & Mathematics | 0 (0.0%) | 0 (0.0%) |
| Architecture & Engineering | 56 (100.0%) | 0 (0.0%) |
| Life, Physical & Social Science | 13 (100.0%) | 0 (0.0%) |
| Community & Social Service | 0 (0.0%) | 67 (100.0%) |
| Education, Arts & Media | 0 (0.0%) | 14 (100.0%) |
| Legal Services & Support | 0 (0.0%) | 0 (0.0%) |
| Education Instruction & Library | 0 (0.0%) | 32 (100.0%) |
| Arts, Media & Entertainment | 0 (0.0%) | 21 (100.0%) |
| Health Diagnosing & Treating | 0 (0.0%) | 90 (100.0%) |
| Health Technologists | 0 (0.0%) | 72 (100.0%) |
| Total (Category) | 329 (54.4%) | 276 (45.6%) |
| Total (Overall) | 775 (52.1%) | 713 (47.9%) |
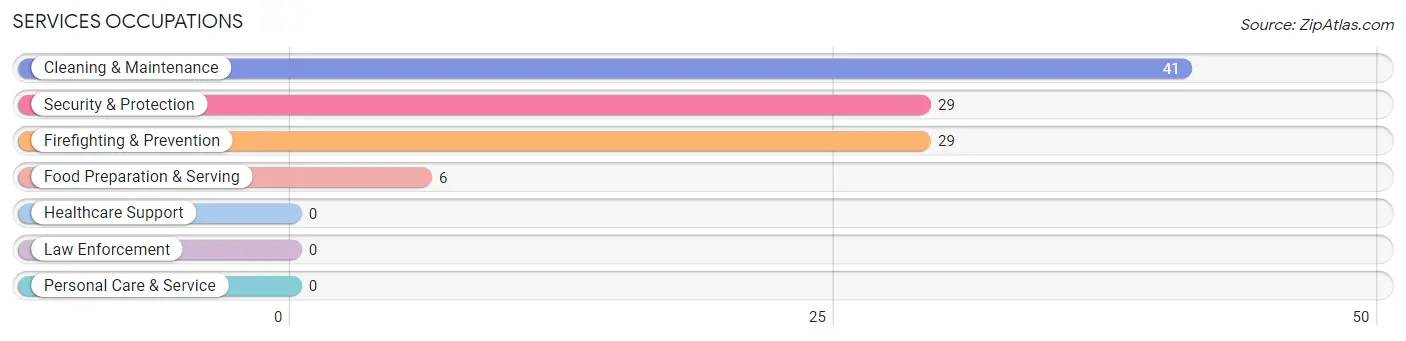
Services Occupations
The most common Services occupations in Lesslie are Cleaning & Maintenance (41 | 2.8%), Security & Protection (29 | 1.9%), Firefighting & Prevention (29 | 1.9%), and Food Preparation & Serving (6 | 0.4%).
Services Occupations by Sex
Within the Services occupations in Lesslie, the most male-oriented occupations are Security & Protection (100.0%), Firefighting & Prevention (100.0%), and Cleaning & Maintenance (73.2%), while the most female-oriented occupations are Food Preparation & Serving (100.0%), and Cleaning & Maintenance (26.8%).
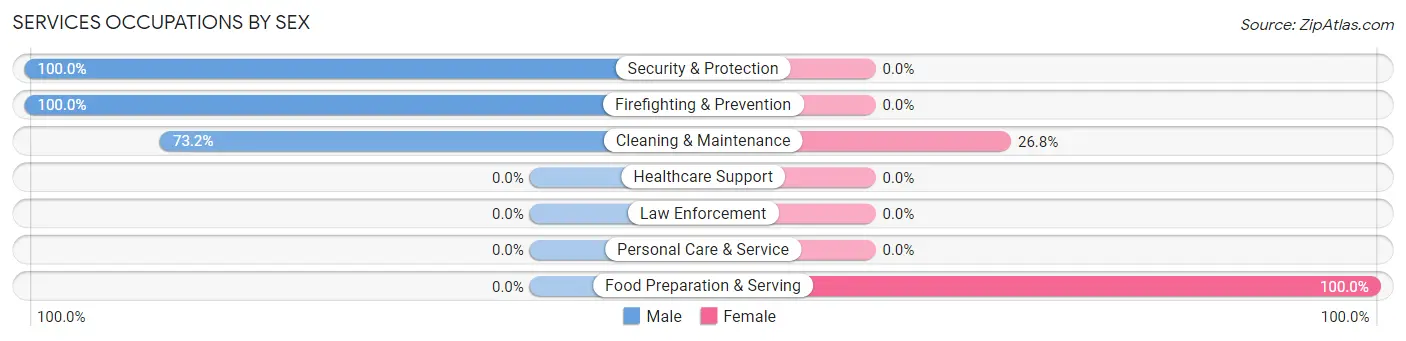
| Occupation | Male | Female |
| Healthcare Support | 0 (0.0%) | 0 (0.0%) |
| Security & Protection | 29 (100.0%) | 0 (0.0%) |
| Firefighting & Prevention | 29 (100.0%) | 0 (0.0%) |
| Law Enforcement | 0 (0.0%) | 0 (0.0%) |
| Food Preparation & Serving | 0 (0.0%) | 6 (100.0%) |
| Cleaning & Maintenance | 30 (73.2%) | 11 (26.8%) |
| Personal Care & Service | 0 (0.0%) | 0 (0.0%) |
| Total (Category) | 59 (77.6%) | 17 (22.4%) |
| Total (Overall) | 775 (52.1%) | 713 (47.9%) |
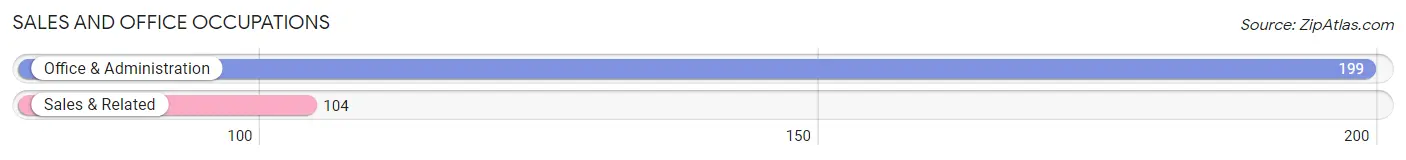
Sales and Office Occupations
The most common Sales and Office occupations in Lesslie are Office & Administration (199 | 13.4%), and Sales & Related (104 | 7.0%).
Sales and Office Occupations by Sex
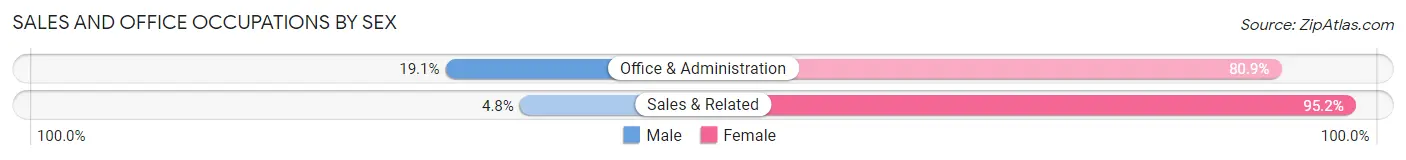
| Occupation | Male | Female |
| Sales & Related | 5 (4.8%) | 99 (95.2%) |
| Office & Administration | 38 (19.1%) | 161 (80.9%) |
| Total (Category) | 43 (14.2%) | 260 (85.8%) |
| Total (Overall) | 775 (52.1%) | 713 (47.9%) |
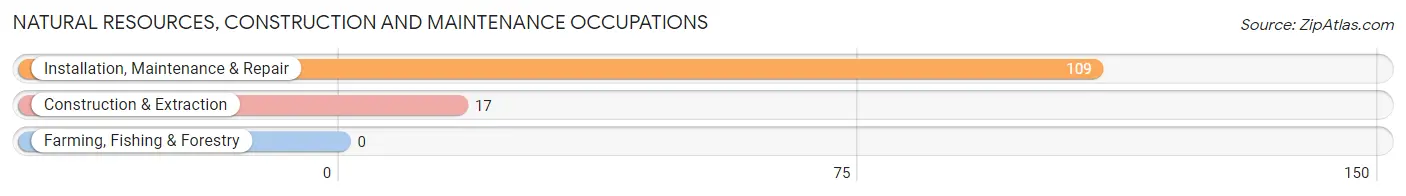
Natural Resources, Construction and Maintenance Occupations
The most common Natural Resources, Construction and Maintenance occupations in Lesslie are Installation, Maintenance & Repair (109 | 7.3%), and Construction & Extraction (17 | 1.1%).
Natural Resources, Construction and Maintenance Occupations by Sex
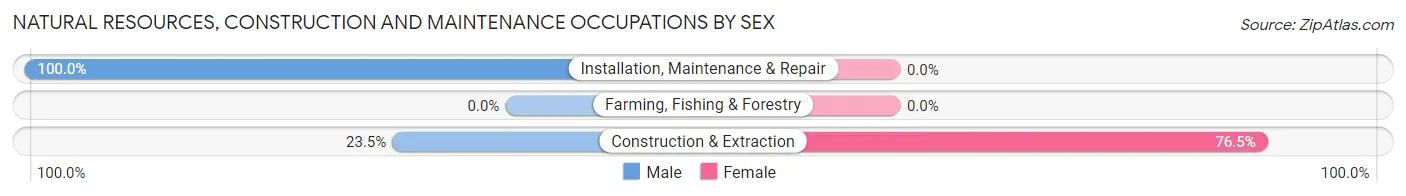
| Occupation | Male | Female |
| Farming, Fishing & Forestry | 0 (0.0%) | 0 (0.0%) |
| Construction & Extraction | 4 (23.5%) | 13 (76.5%) |
| Installation, Maintenance & Repair | 109 (100.0%) | 0 (0.0%) |
| Total (Category) | 113 (89.7%) | 13 (10.3%) |
| Total (Overall) | 775 (52.1%) | 713 (47.9%) |
Production, Transportation and Moving Occupations
The most common Production, Transportation and Moving occupations in Lesslie are Transportation (190 | 12.8%), Production (154 | 10.3%), and Material Moving (34 | 2.3%).
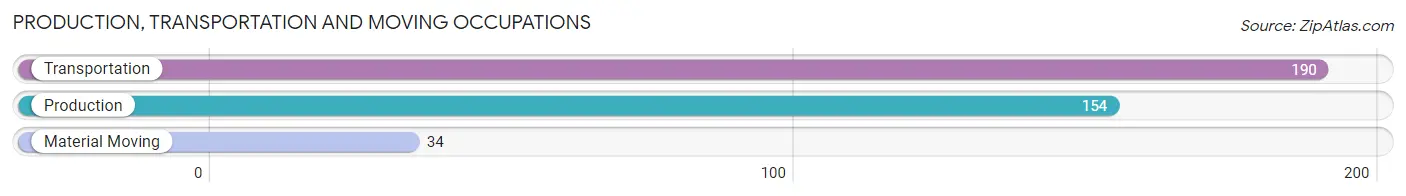
Production, Transportation and Moving Occupations by Sex
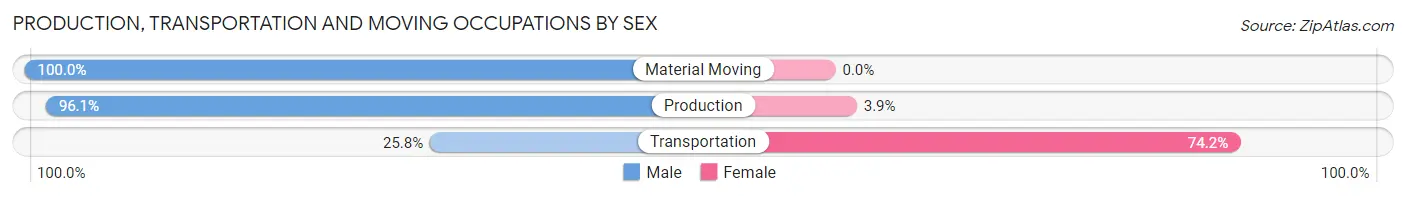
| Occupation | Male | Female |
| Production | 148 (96.1%) | 6 (3.9%) |
| Transportation | 49 (25.8%) | 141 (74.2%) |
| Material Moving | 34 (100.0%) | 0 (0.0%) |
| Total (Category) | 231 (61.1%) | 147 (38.9%) |
| Total (Overall) | 775 (52.1%) | 713 (47.9%) |
Employment Industries by Sex in Lesslie
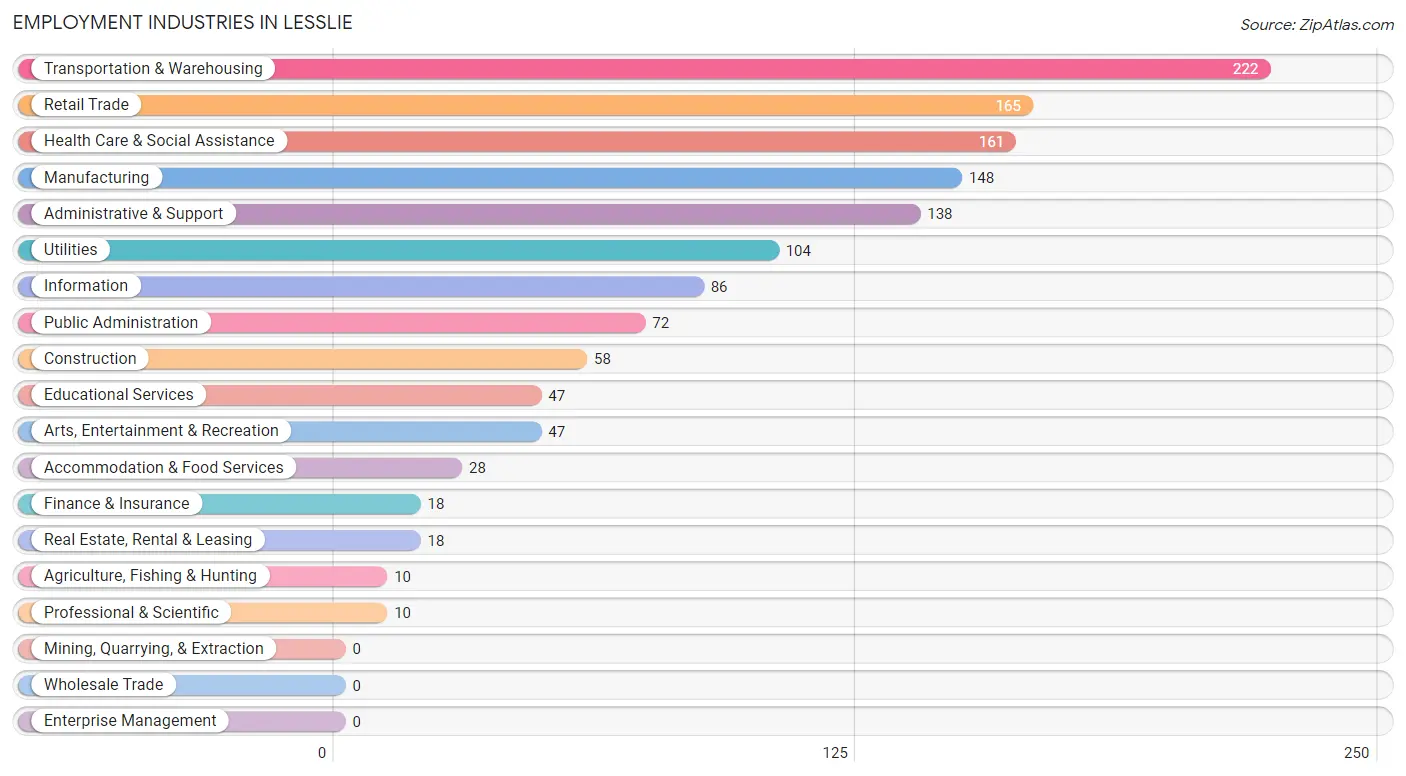
Employment Industries in Lesslie
The major employment industries in Lesslie include Transportation & Warehousing (222 | 14.9%), Retail Trade (165 | 11.1%), Health Care & Social Assistance (161 | 10.8%), Manufacturing (148 | 10.0%), and Administrative & Support (138 | 9.3%).
Employment Industries by Sex in Lesslie
The Lesslie industries that see more men than women are Agriculture, Fishing & Hunting (100.0%), Arts, Entertainment & Recreation (100.0%), and Manufacturing (92.6%), whereas the industries that tend to have a higher number of women are Finance & Insurance (100.0%), Professional & Scientific (100.0%), and Educational Services (100.0%).
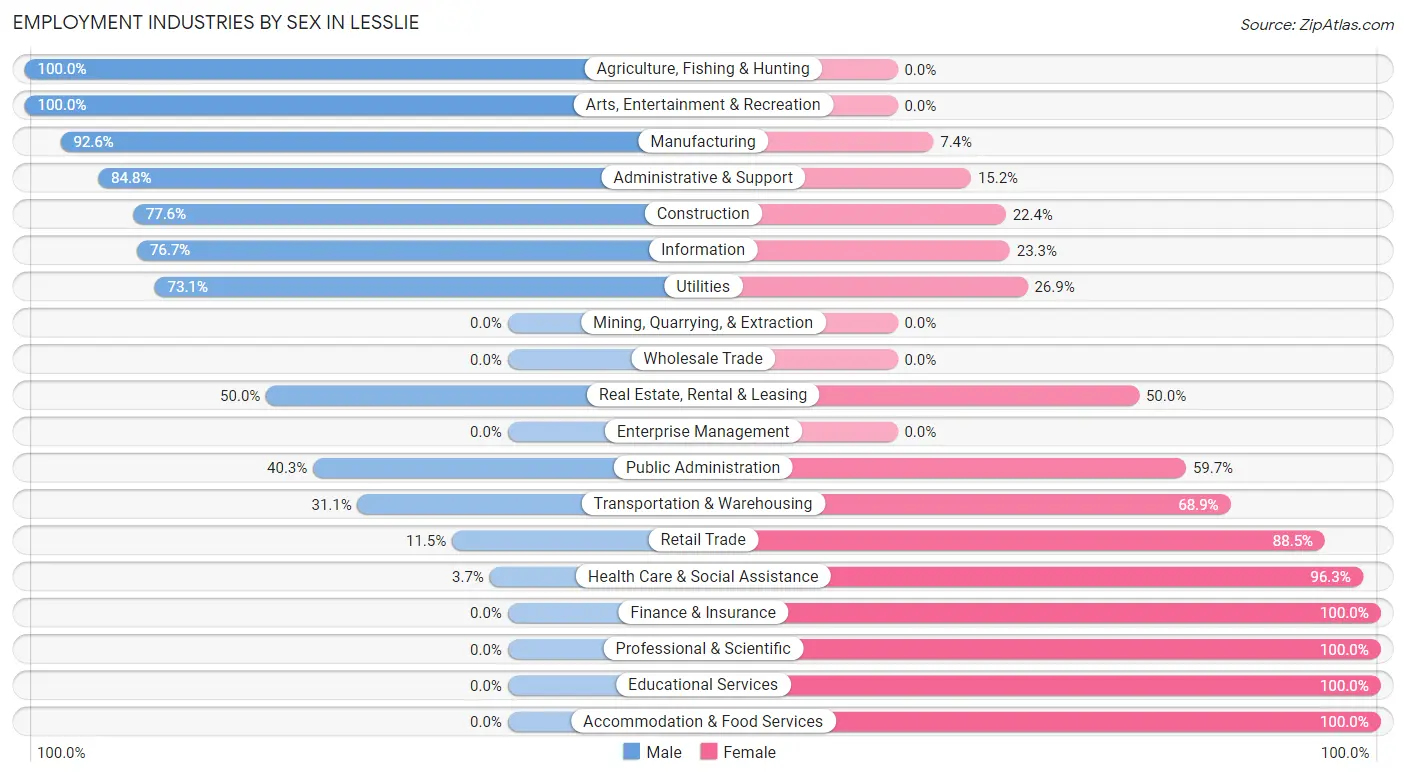
| Industry | Male | Female |
| Agriculture, Fishing & Hunting | 10 (100.0%) | 0 (0.0%) |
| Mining, Quarrying, & Extraction | 0 (0.0%) | 0 (0.0%) |
| Construction | 45 (77.6%) | 13 (22.4%) |
| Manufacturing | 137 (92.6%) | 11 (7.4%) |
| Wholesale Trade | 0 (0.0%) | 0 (0.0%) |
| Retail Trade | 19 (11.5%) | 146 (88.5%) |
| Transportation & Warehousing | 69 (31.1%) | 153 (68.9%) |
| Utilities | 76 (73.1%) | 28 (26.9%) |
| Information | 66 (76.7%) | 20 (23.3%) |
| Finance & Insurance | 0 (0.0%) | 18 (100.0%) |
| Real Estate, Rental & Leasing | 9 (50.0%) | 9 (50.0%) |
| Professional & Scientific | 0 (0.0%) | 10 (100.0%) |
| Enterprise Management | 0 (0.0%) | 0 (0.0%) |
| Administrative & Support | 117 (84.8%) | 21 (15.2%) |
| Educational Services | 0 (0.0%) | 47 (100.0%) |
| Health Care & Social Assistance | 6 (3.7%) | 155 (96.3%) |
| Arts, Entertainment & Recreation | 47 (100.0%) | 0 (0.0%) |
| Accommodation & Food Services | 0 (0.0%) | 28 (100.0%) |
| Public Administration | 29 (40.3%) | 43 (59.7%) |
| Total | 775 (52.1%) | 713 (47.9%) |
Education in Lesslie
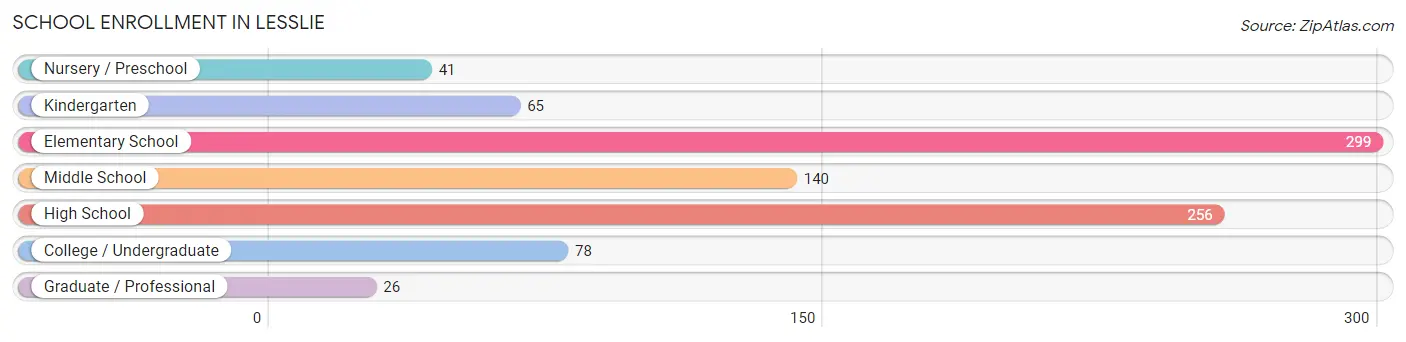
School Enrollment in Lesslie
The most common levels of schooling among the 905 students in Lesslie are elementary school (299 | 33.0%), high school (256 | 28.3%), and middle school (140 | 15.5%).
| School Level | # Students | % Students |
| Nursery / Preschool | 41 | 4.5% |
| Kindergarten | 65 | 7.2% |
| Elementary School | 299 | 33.0% |
| Middle School | 140 | 15.5% |
| High School | 256 | 28.3% |
| College / Undergraduate | 78 | 8.6% |
| Graduate / Professional | 26 | 2.9% |
| Total | 905 | 100.0% |
School Enrollment by Age by Funding Source in Lesslie
Out of a total of 905 students who are enrolled in schools in Lesslie, 75 (8.3%) attend a private institution, while the remaining 830 (91.7%) are enrolled in public schools. The age group of 15 to 17 year olds has the highest likelihood of being enrolled in private schools, with 20 (11.6% in the age bracket) enrolled. Conversely, the age group of 3 to 4 year olds has the lowest likelihood of being enrolled in a private school, with 24 (100.0% in the age bracket) attending a public institution.
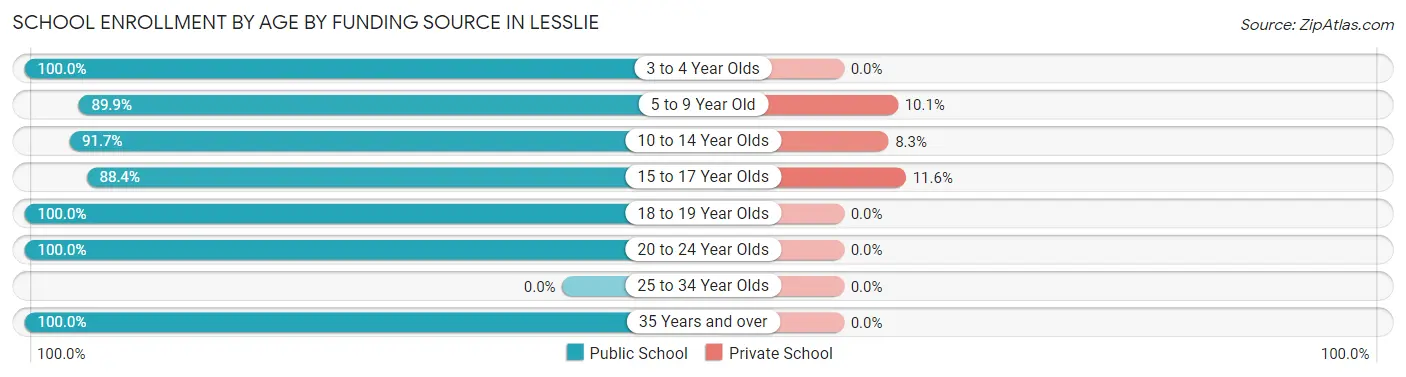
| Age Bracket | Public School | Private School |
| 3 to 4 Year Olds | 24 (100.0%) | 0 (0.0%) |
| 5 to 9 Year Old | 322 (89.9%) | 36 (10.1%) |
| 10 to 14 Year Olds | 210 (91.7%) | 19 (8.3%) |
| 15 to 17 Year Olds | 153 (88.4%) | 20 (11.6%) |
| 18 to 19 Year Olds | 17 (100.0%) | 0 (0.0%) |
| 20 to 24 Year Olds | 78 (100.0%) | 0 (0.0%) |
| 25 to 34 Year Olds | 0 (0.0%) | 0 (0.0%) |
| 35 Years and over | 26 (100.0%) | 0 (0.0%) |
| Total | 830 (91.7%) | 75 (8.3%) |
Educational Attainment by Field of Study in Lesslie
Business (107 | 33.4%), science & technology (72 | 22.5%), education (37 | 11.6%), arts & humanities (33 | 10.3%), and psychology (18 | 5.6%) are the most common fields of study among 320 individuals in Lesslie who have obtained a bachelor's degree or higher.
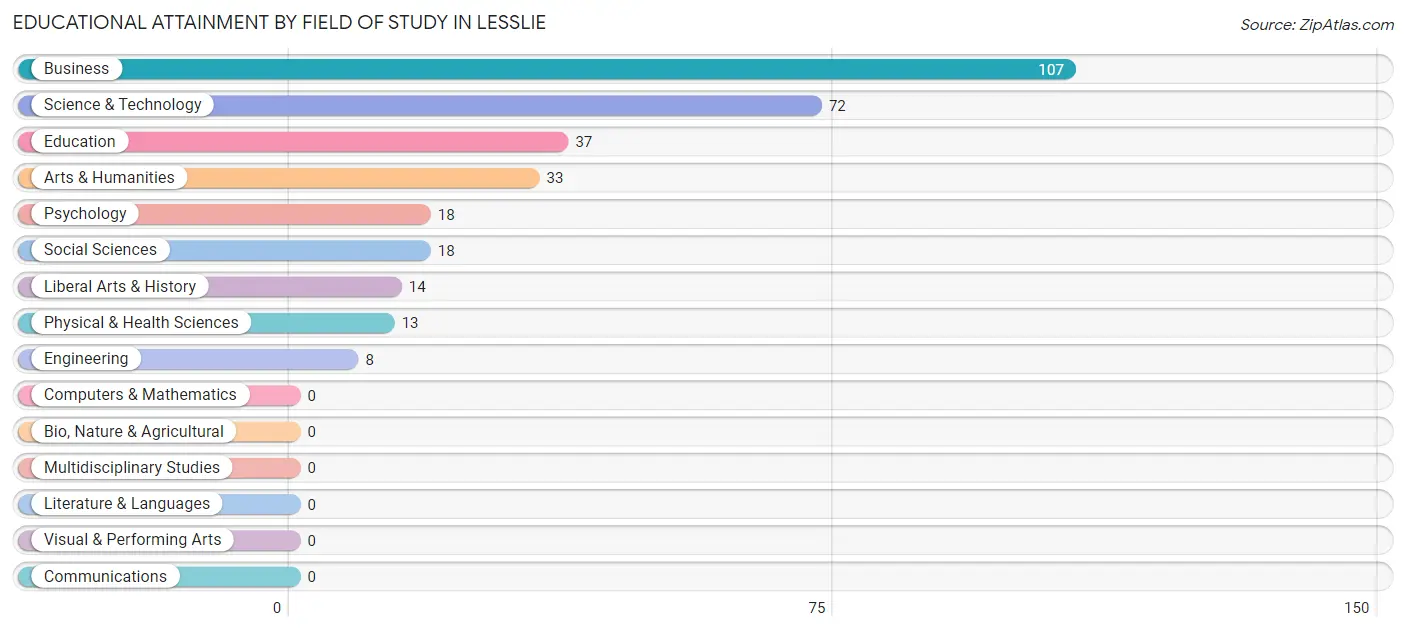
| Field of Study | # Graduates | % Graduates |
| Computers & Mathematics | 0 | 0.0% |
| Bio, Nature & Agricultural | 0 | 0.0% |
| Physical & Health Sciences | 13 | 4.1% |
| Psychology | 18 | 5.6% |
| Social Sciences | 18 | 5.6% |
| Engineering | 8 | 2.5% |
| Multidisciplinary Studies | 0 | 0.0% |
| Science & Technology | 72 | 22.5% |
| Business | 107 | 33.4% |
| Education | 37 | 11.6% |
| Literature & Languages | 0 | 0.0% |
| Liberal Arts & History | 14 | 4.4% |
| Visual & Performing Arts | 0 | 0.0% |
| Communications | 0 | 0.0% |
| Arts & Humanities | 33 | 10.3% |
| Total | 320 | 100.0% |
Transportation & Commute in Lesslie
Vehicle Availability by Sex in Lesslie
The most prevalent vehicle ownership categories in Lesslie are males with 2 vehicles (292, accounting for 39.2%) and females with 2 vehicles (250, making up 46.7%).
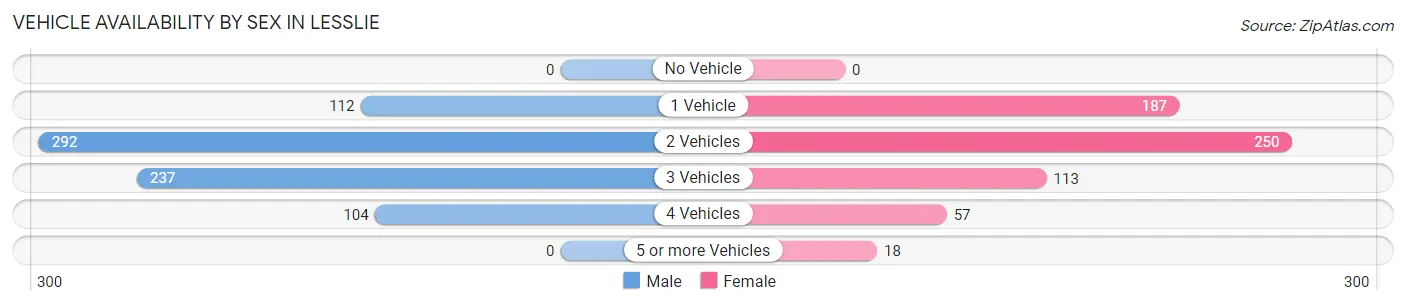
| Vehicles Available | Male | Female |
| No Vehicle | 0 (0.0%) | 0 (0.0%) |
| 1 Vehicle | 112 (15.0%) | 187 (29.9%) |
| 2 Vehicles | 292 (39.2%) | 250 (40.0%) |
| 3 Vehicles | 237 (31.8%) | 113 (18.1%) |
| 4 Vehicles | 104 (14.0%) | 57 (9.1%) |
| 5 or more Vehicles | 0 (0.0%) | 18 (2.9%) |
| Total | 745 (100.0%) | 625 (100.0%) |
Commute Time in Lesslie
The most frequently occuring commute durations in Lesslie are 30 to 34 minutes (256 commuters, 20.9%), 25 to 29 minutes (219 commuters, 17.8%), and 15 to 19 minutes (151 commuters, 12.3%).
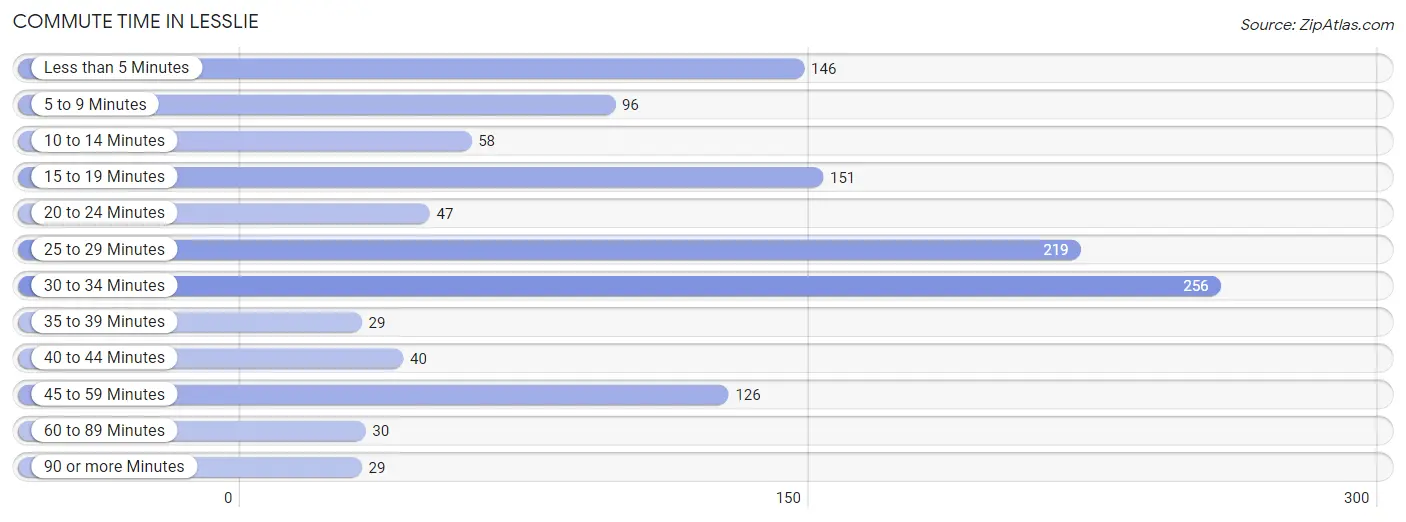
| Commute Time | # Commuters | % Commuters |
| Less than 5 Minutes | 146 | 11.9% |
| 5 to 9 Minutes | 96 | 7.8% |
| 10 to 14 Minutes | 58 | 4.7% |
| 15 to 19 Minutes | 151 | 12.3% |
| 20 to 24 Minutes | 47 | 3.8% |
| 25 to 29 Minutes | 219 | 17.8% |
| 30 to 34 Minutes | 256 | 20.9% |
| 35 to 39 Minutes | 29 | 2.4% |
| 40 to 44 Minutes | 40 | 3.3% |
| 45 to 59 Minutes | 126 | 10.3% |
| 60 to 89 Minutes | 30 | 2.4% |
| 90 or more Minutes | 29 | 2.4% |
Commute Time by Sex in Lesslie
The most common commute times in Lesslie are 30 to 34 minutes (202 commuters, 27.1%) for males and 25 to 29 minutes (174 commuters, 36.1%) for females.
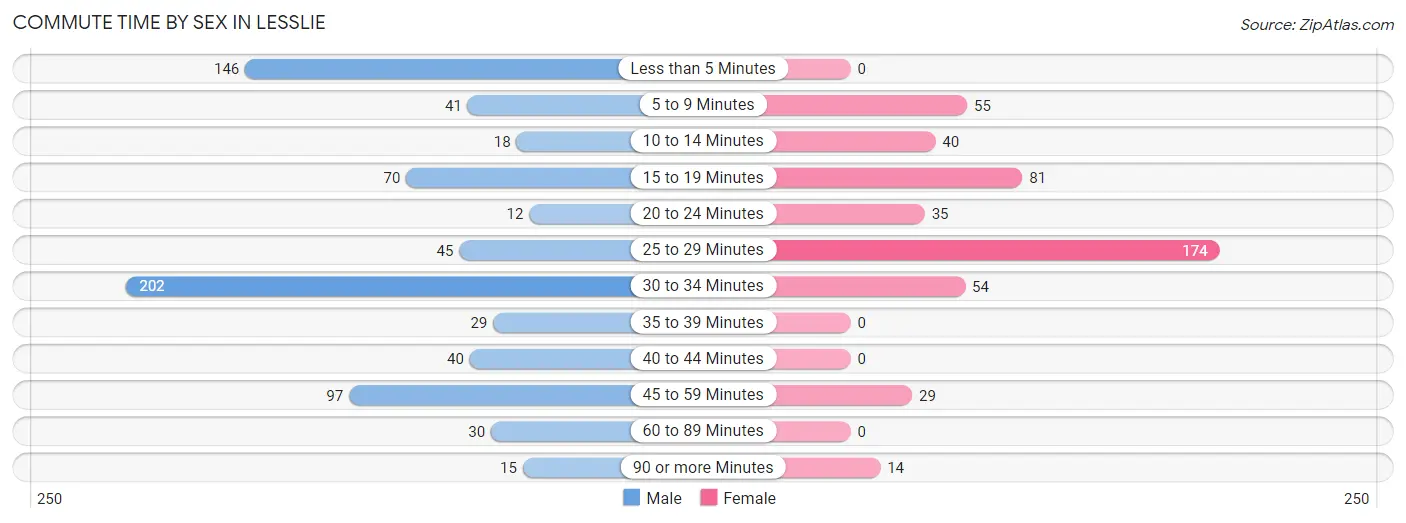
| Commute Time | Male | Female |
| Less than 5 Minutes | 146 (19.6%) | 0 (0.0%) |
| 5 to 9 Minutes | 41 (5.5%) | 55 (11.4%) |
| 10 to 14 Minutes | 18 (2.4%) | 40 (8.3%) |
| 15 to 19 Minutes | 70 (9.4%) | 81 (16.8%) |
| 20 to 24 Minutes | 12 (1.6%) | 35 (7.3%) |
| 25 to 29 Minutes | 45 (6.0%) | 174 (36.1%) |
| 30 to 34 Minutes | 202 (27.1%) | 54 (11.2%) |
| 35 to 39 Minutes | 29 (3.9%) | 0 (0.0%) |
| 40 to 44 Minutes | 40 (5.4%) | 0 (0.0%) |
| 45 to 59 Minutes | 97 (13.0%) | 29 (6.0%) |
| 60 to 89 Minutes | 30 (4.0%) | 0 (0.0%) |
| 90 or more Minutes | 15 (2.0%) | 14 (2.9%) |
Time of Departure to Work by Sex in Lesslie
The most frequent times of departure to work in Lesslie are 5:30 AM to 5:59 AM (196, 26.3%) for males and 7:00 AM to 7:29 AM (152, 31.5%) for females.
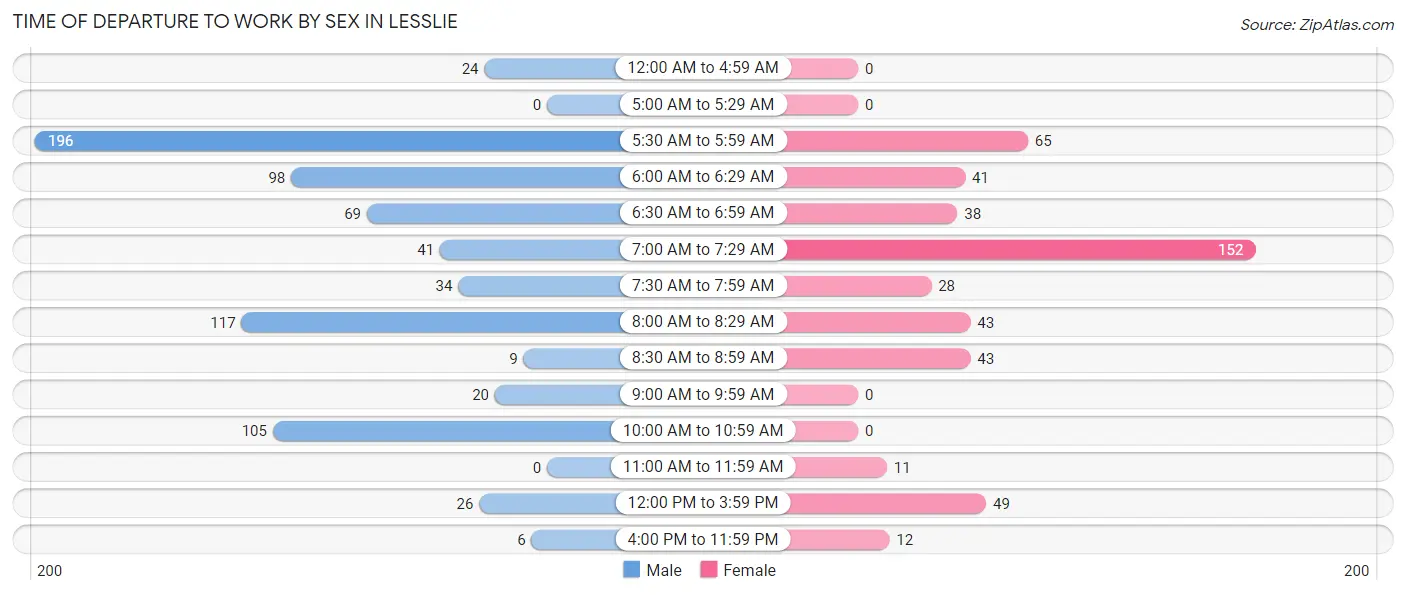
| Time of Departure | Male | Female |
| 12:00 AM to 4:59 AM | 24 (3.2%) | 0 (0.0%) |
| 5:00 AM to 5:29 AM | 0 (0.0%) | 0 (0.0%) |
| 5:30 AM to 5:59 AM | 196 (26.3%) | 65 (13.5%) |
| 6:00 AM to 6:29 AM | 98 (13.2%) | 41 (8.5%) |
| 6:30 AM to 6:59 AM | 69 (9.3%) | 38 (7.9%) |
| 7:00 AM to 7:29 AM | 41 (5.5%) | 152 (31.5%) |
| 7:30 AM to 7:59 AM | 34 (4.6%) | 28 (5.8%) |
| 8:00 AM to 8:29 AM | 117 (15.7%) | 43 (8.9%) |
| 8:30 AM to 8:59 AM | 9 (1.2%) | 43 (8.9%) |
| 9:00 AM to 9:59 AM | 20 (2.7%) | 0 (0.0%) |
| 10:00 AM to 10:59 AM | 105 (14.1%) | 0 (0.0%) |
| 11:00 AM to 11:59 AM | 0 (0.0%) | 11 (2.3%) |
| 12:00 PM to 3:59 PM | 26 (3.5%) | 49 (10.2%) |
| 4:00 PM to 11:59 PM | 6 (0.8%) | 12 (2.5%) |
| Total | 745 (100.0%) | 482 (100.0%) |
Housing Occupancy in Lesslie
Occupancy by Ownership in Lesslie
Of the total 1,102 dwellings in Lesslie, owner-occupied units account for 1,013 (91.9%), while renter-occupied units make up 89 (8.1%).
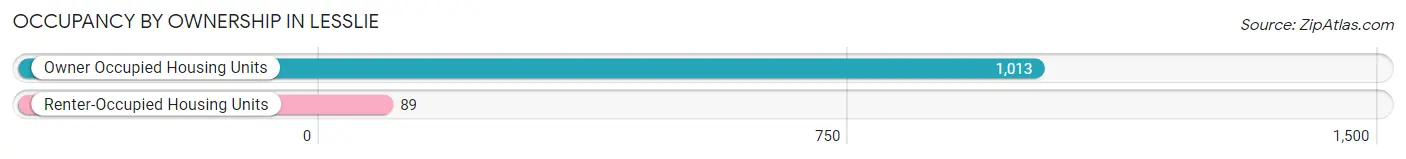
| Occupancy | # Housing Units | % Housing Units |
| Owner Occupied Housing Units | 1,013 | 91.9% |
| Renter-Occupied Housing Units | 89 | 8.1% |
| Total Occupied Housing Units | 1,102 | 100.0% |
Occupancy by Household Size in Lesslie
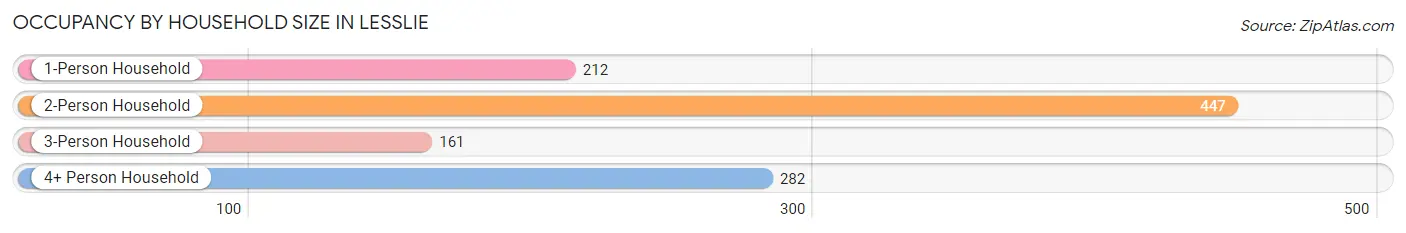
| Household Size | # Housing Units | % Housing Units |
| 1-Person Household | 212 | 19.2% |
| 2-Person Household | 447 | 40.6% |
| 3-Person Household | 161 | 14.6% |
| 4+ Person Household | 282 | 25.6% |
| Total Housing Units | 1,102 | 100.0% |
Occupancy by Ownership by Household Size in Lesslie
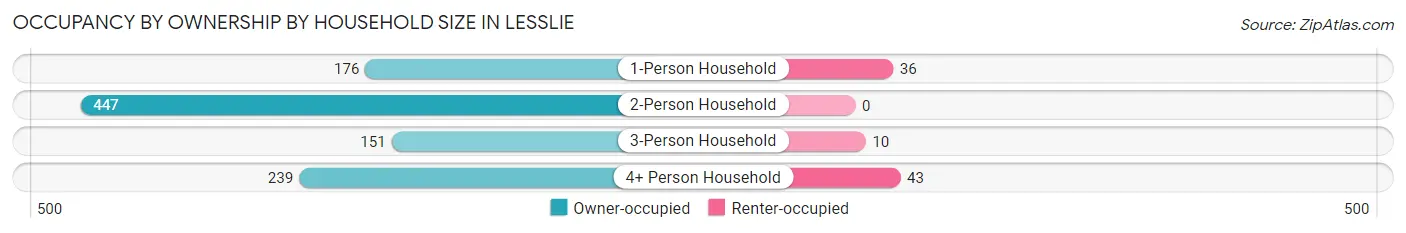
| Household Size | Owner-occupied | Renter-occupied |
| 1-Person Household | 176 (83.0%) | 36 (17.0%) |
| 2-Person Household | 447 (100.0%) | 0 (0.0%) |
| 3-Person Household | 151 (93.8%) | 10 (6.2%) |
| 4+ Person Household | 239 (84.8%) | 43 (15.2%) |
| Total Housing Units | 1,013 (91.9%) | 89 (8.1%) |
Occupancy by Educational Attainment in Lesslie
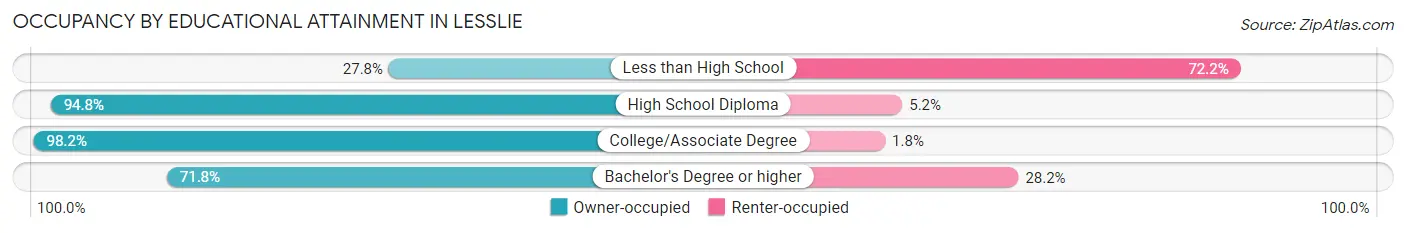
| Household Size | Owner-occupied | Renter-occupied |
| Less than High School | 10 (27.8%) | 26 (72.2%) |
| High School Diploma | 366 (94.8%) | 20 (5.2%) |
| College/Associate Degree | 553 (98.2%) | 10 (1.8%) |
| Bachelor's Degree or higher | 84 (71.8%) | 33 (28.2%) |
Occupancy by Age of Householder in Lesslie
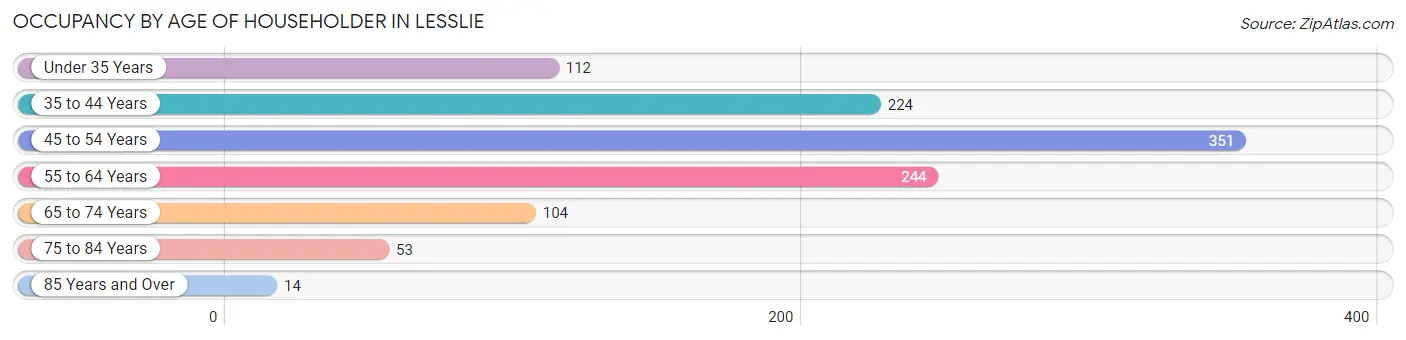
| Age Bracket | # Households | % Households |
| Under 35 Years | 112 | 10.2% |
| 35 to 44 Years | 224 | 20.3% |
| 45 to 54 Years | 351 | 31.9% |
| 55 to 64 Years | 244 | 22.1% |
| 65 to 74 Years | 104 | 9.4% |
| 75 to 84 Years | 53 | 4.8% |
| 85 Years and Over | 14 | 1.3% |
| Total | 1,102 | 100.0% |
Housing Finances in Lesslie
Median Income by Occupancy in Lesslie
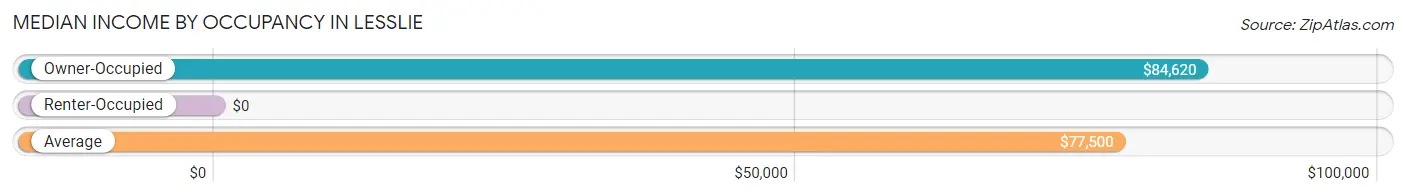
| Occupancy Type | # Households | Median Income |
| Owner-Occupied | 1,013 (91.9%) | $84,620 |
| Renter-Occupied | 89 (8.1%) | $0 |
| Average | 1,102 (100.0%) | $77,500 |
Occupancy by Householder Income Bracket in Lesslie
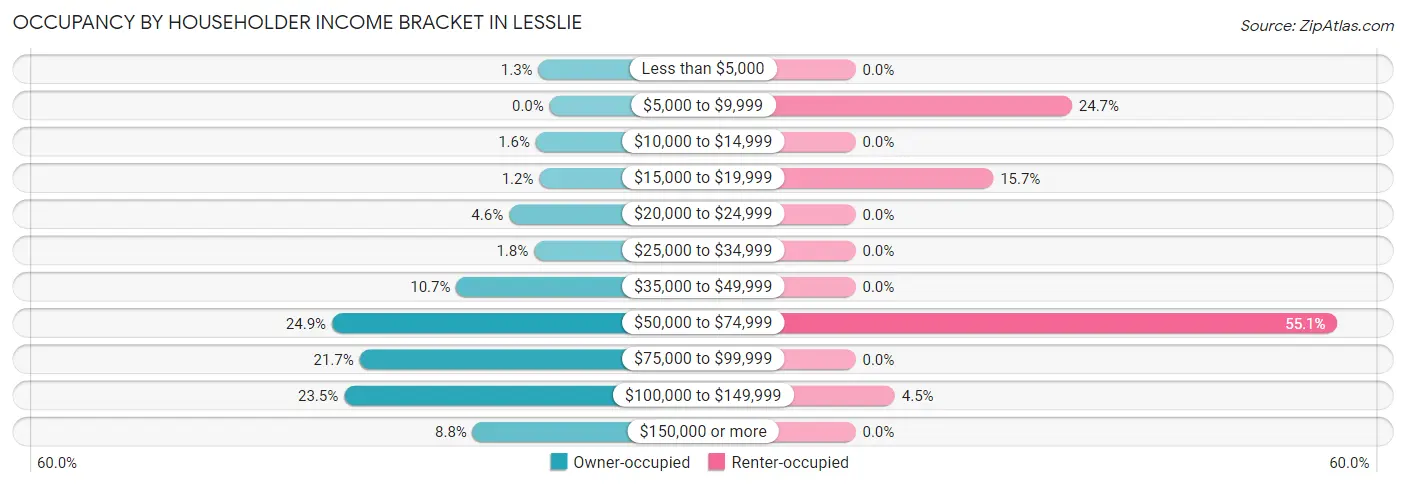
| Income Bracket | Owner-occupied | Renter-occupied |
| Less than $5,000 | 13 (1.3%) | 0 (0.0%) |
| $5,000 to $9,999 | 0 (0.0%) | 22 (24.7%) |
| $10,000 to $14,999 | 16 (1.6%) | 0 (0.0%) |
| $15,000 to $19,999 | 12 (1.2%) | 14 (15.7%) |
| $20,000 to $24,999 | 47 (4.6%) | 0 (0.0%) |
| $25,000 to $34,999 | 18 (1.8%) | 0 (0.0%) |
| $35,000 to $49,999 | 108 (10.7%) | 0 (0.0%) |
| $50,000 to $74,999 | 252 (24.9%) | 49 (55.1%) |
| $75,000 to $99,999 | 220 (21.7%) | 0 (0.0%) |
| $100,000 to $149,999 | 238 (23.5%) | 4 (4.5%) |
| $150,000 or more | 89 (8.8%) | 0 (0.0%) |
| Total | 1,013 (100.0%) | 89 (100.0%) |
Monthly Housing Cost Tiers in Lesslie
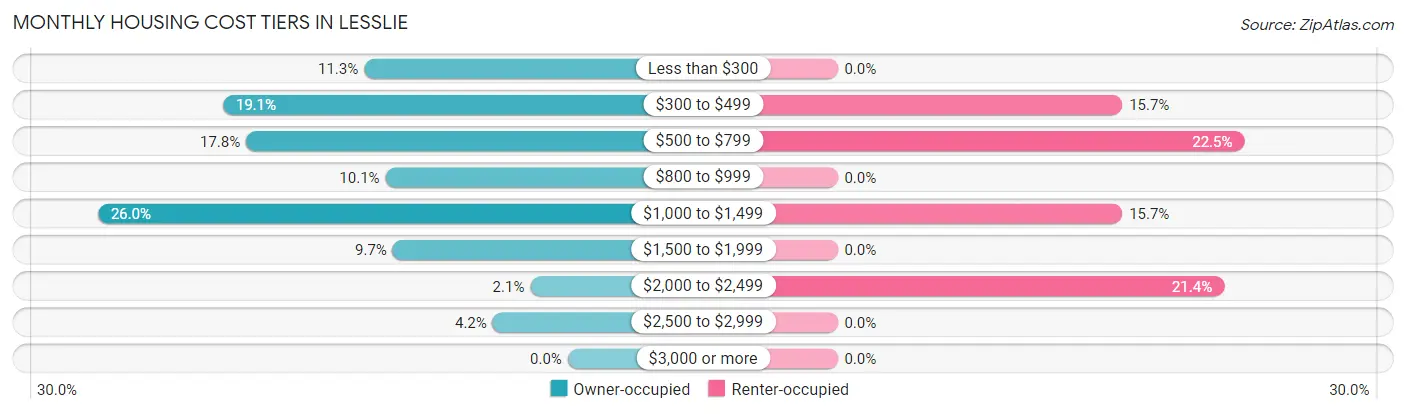
| Monthly Cost | Owner-occupied | Renter-occupied |
| Less than $300 | 114 (11.3%) | 0 (0.0%) |
| $300 to $499 | 193 (19.1%) | 14 (15.7%) |
| $500 to $799 | 180 (17.8%) | 20 (22.5%) |
| $800 to $999 | 102 (10.1%) | 0 (0.0%) |
| $1,000 to $1,499 | 263 (26.0%) | 14 (15.7%) |
| $1,500 to $1,999 | 98 (9.7%) | 0 (0.0%) |
| $2,000 to $2,499 | 21 (2.1%) | 19 (21.3%) |
| $2,500 to $2,999 | 42 (4.2%) | 0 (0.0%) |
| $3,000 or more | 0 (0.0%) | 0 (0.0%) |
| Total | 1,013 (100.0%) | 89 (100.0%) |
Physical Housing Characteristics in Lesslie
Housing Structures in Lesslie
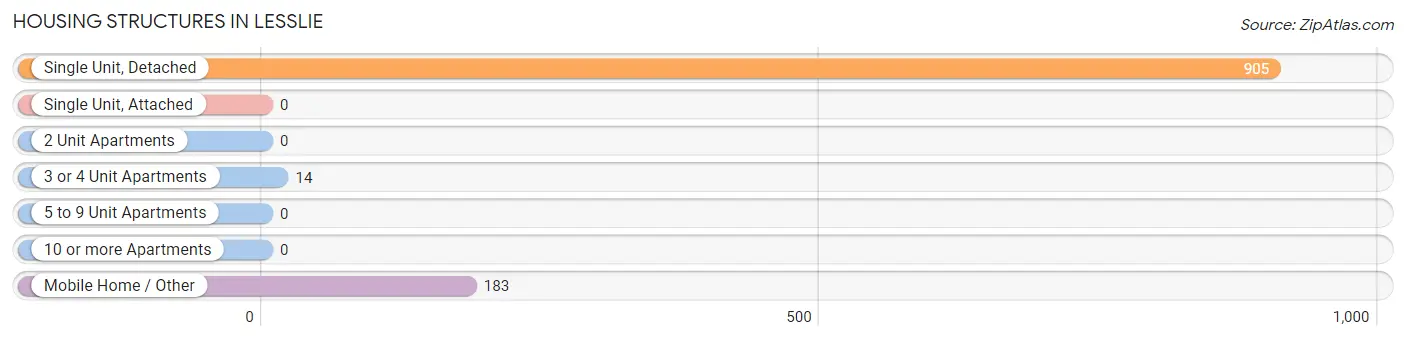
| Structure Type | # Housing Units | % Housing Units |
| Single Unit, Detached | 905 | 82.1% |
| Single Unit, Attached | 0 | 0.0% |
| 2 Unit Apartments | 0 | 0.0% |
| 3 or 4 Unit Apartments | 14 | 1.3% |
| 5 to 9 Unit Apartments | 0 | 0.0% |
| 10 or more Apartments | 0 | 0.0% |
| Mobile Home / Other | 183 | 16.6% |
| Total | 1,102 | 100.0% |
Housing Structures by Occupancy in Lesslie
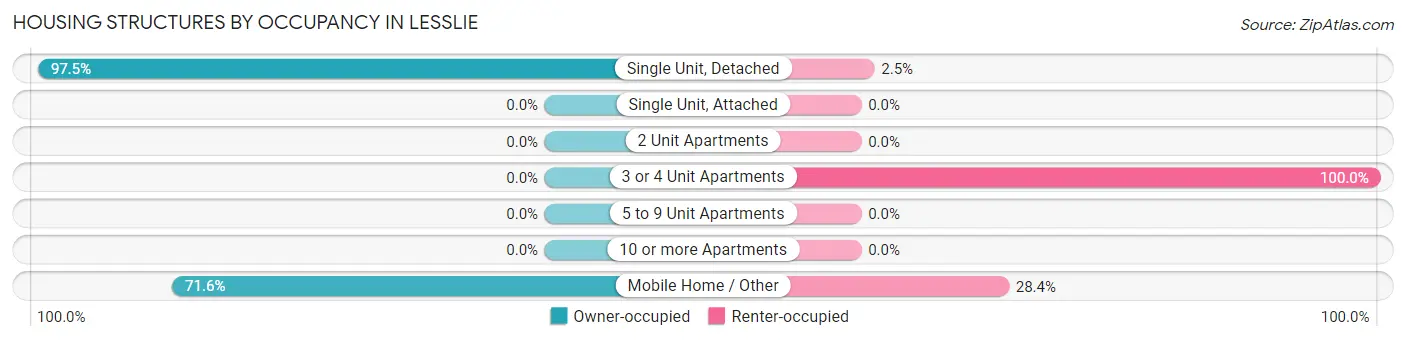
| Structure Type | Owner-occupied | Renter-occupied |
| Single Unit, Detached | 882 (97.5%) | 23 (2.5%) |
| Single Unit, Attached | 0 (0.0%) | 0 (0.0%) |
| 2 Unit Apartments | 0 (0.0%) | 0 (0.0%) |
| 3 or 4 Unit Apartments | 0 (0.0%) | 14 (100.0%) |
| 5 to 9 Unit Apartments | 0 (0.0%) | 0 (0.0%) |
| 10 or more Apartments | 0 (0.0%) | 0 (0.0%) |
| Mobile Home / Other | 131 (71.6%) | 52 (28.4%) |
| Total | 1,013 (91.9%) | 89 (8.1%) |
Housing Structures by Number of Rooms in Lesslie
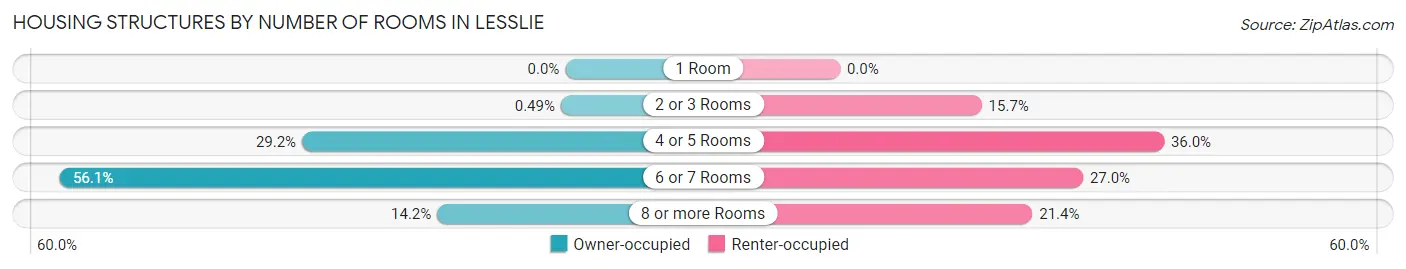
| Number of Rooms | Owner-occupied | Renter-occupied |
| 1 Room | 0 (0.0%) | 0 (0.0%) |
| 2 or 3 Rooms | 5 (0.5%) | 14 (15.7%) |
| 4 or 5 Rooms | 296 (29.2%) | 32 (36.0%) |
| 6 or 7 Rooms | 568 (56.1%) | 24 (27.0%) |
| 8 or more Rooms | 144 (14.2%) | 19 (21.3%) |
| Total | 1,013 (100.0%) | 89 (100.0%) |
Housing Structure by Heating Type in Lesslie
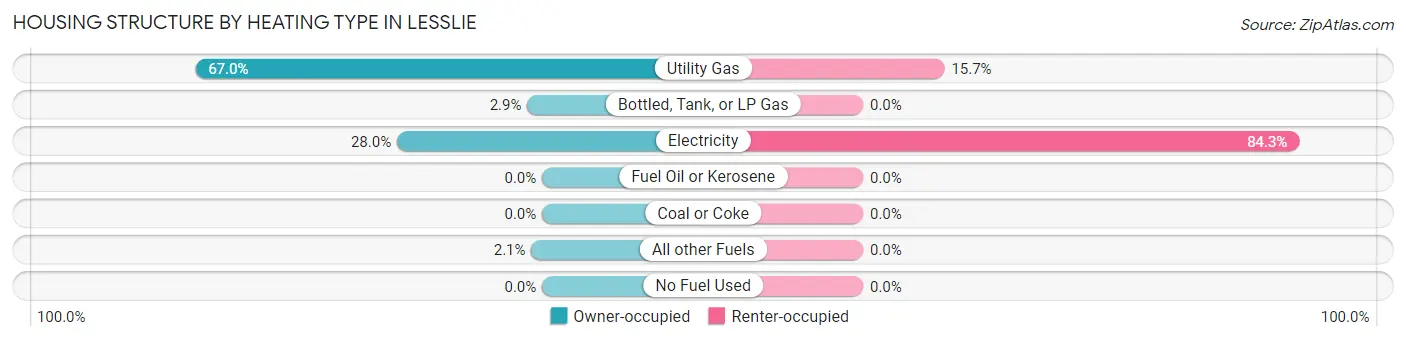
| Heating Type | Owner-occupied | Renter-occupied |
| Utility Gas | 679 (67.0%) | 14 (15.7%) |
| Bottled, Tank, or LP Gas | 29 (2.9%) | 0 (0.0%) |
| Electricity | 284 (28.0%) | 75 (84.3%) |
| Fuel Oil or Kerosene | 0 (0.0%) | 0 (0.0%) |
| Coal or Coke | 0 (0.0%) | 0 (0.0%) |
| All other Fuels | 21 (2.1%) | 0 (0.0%) |
| No Fuel Used | 0 (0.0%) | 0 (0.0%) |
| Total | 1,013 (100.0%) | 89 (100.0%) |
Household Vehicle Usage in Lesslie
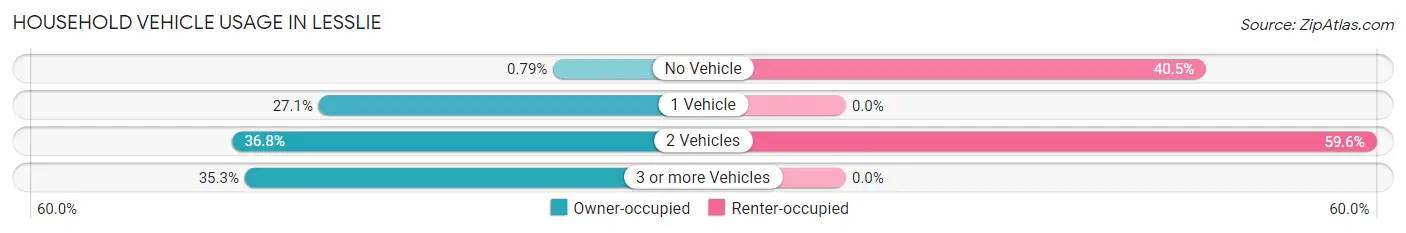
| Vehicles per Household | Owner-occupied | Renter-occupied |
| No Vehicle | 8 (0.8%) | 36 (40.5%) |
| 1 Vehicle | 274 (27.1%) | 0 (0.0%) |
| 2 Vehicles | 373 (36.8%) | 53 (59.6%) |
| 3 or more Vehicles | 358 (35.3%) | 0 (0.0%) |
| Total | 1,013 (100.0%) | 89 (100.0%) |
Real Estate & Mortgages in Lesslie
Real Estate and Mortgage Overview in Lesslie
| Characteristic | Without Mortgage | With Mortgage |
| Housing Units | 341 | 672 |
| Median Property Value | $191,700 | $217,100 |
| Median Household Income | $71,734 | $61 |
| Monthly Housing Costs | $355 | $0 |
| Real Estate Taxes | $904 | $0 |
Property Value by Mortgage Status in Lesslie
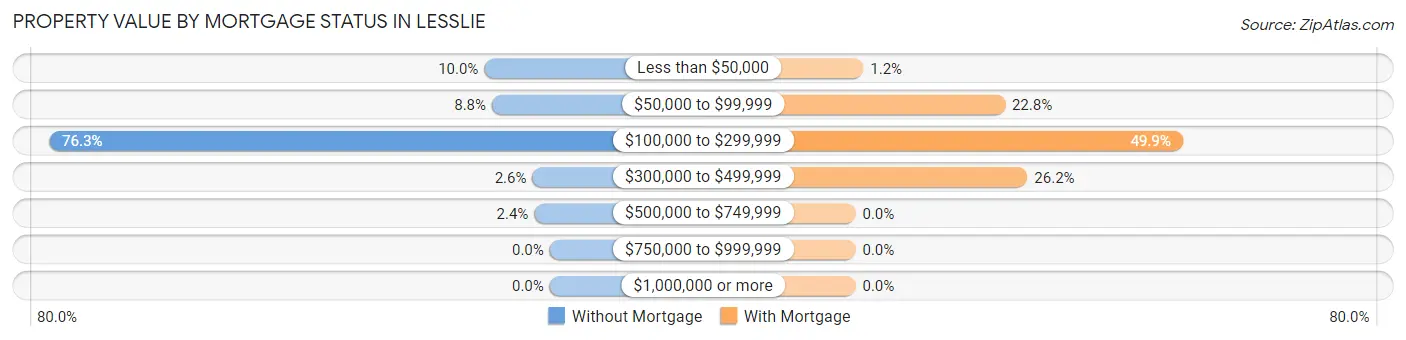
| Property Value | Without Mortgage | With Mortgage |
| Less than $50,000 | 34 (10.0%) | 8 (1.2%) |
| $50,000 to $99,999 | 30 (8.8%) | 153 (22.8%) |
| $100,000 to $299,999 | 260 (76.2%) | 335 (49.8%) |
| $300,000 to $499,999 | 9 (2.6%) | 176 (26.2%) |
| $500,000 to $749,999 | 8 (2.4%) | 0 (0.0%) |
| $750,000 to $999,999 | 0 (0.0%) | 0 (0.0%) |
| $1,000,000 or more | 0 (0.0%) | 0 (0.0%) |
| Total | 341 (100.0%) | 672 (100.0%) |
Household Income by Mortgage Status in Lesslie
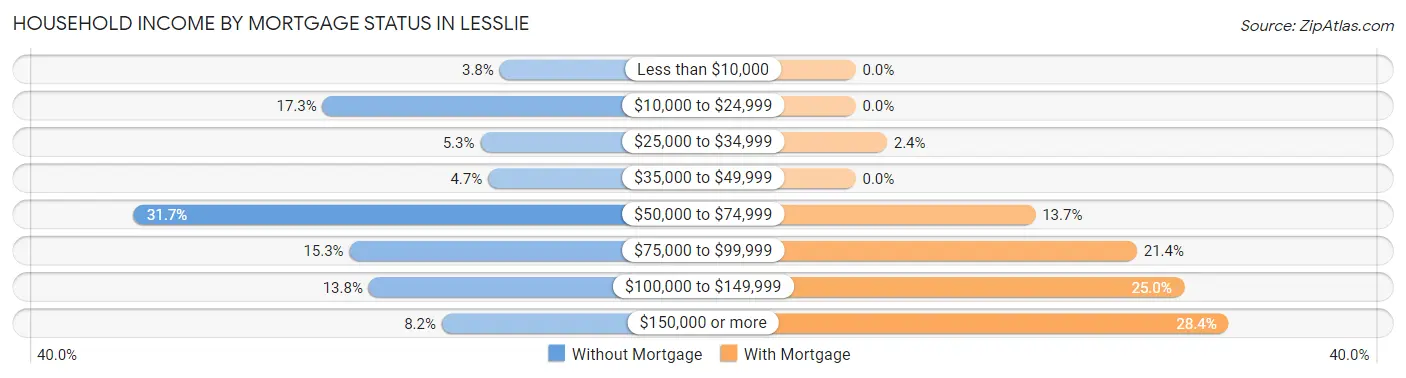
| Household Income | Without Mortgage | With Mortgage |
| Less than $10,000 | 13 (3.8%) | 0 (0.0%) |
| $10,000 to $24,999 | 59 (17.3%) | 0 (0.0%) |
| $25,000 to $34,999 | 18 (5.3%) | 16 (2.4%) |
| $35,000 to $49,999 | 16 (4.7%) | 0 (0.0%) |
| $50,000 to $74,999 | 108 (31.7%) | 92 (13.7%) |
| $75,000 to $99,999 | 52 (15.2%) | 144 (21.4%) |
| $100,000 to $149,999 | 47 (13.8%) | 168 (25.0%) |
| $150,000 or more | 28 (8.2%) | 191 (28.4%) |
| Total | 341 (100.0%) | 672 (100.0%) |
Property Value to Household Income Ratio in Lesslie
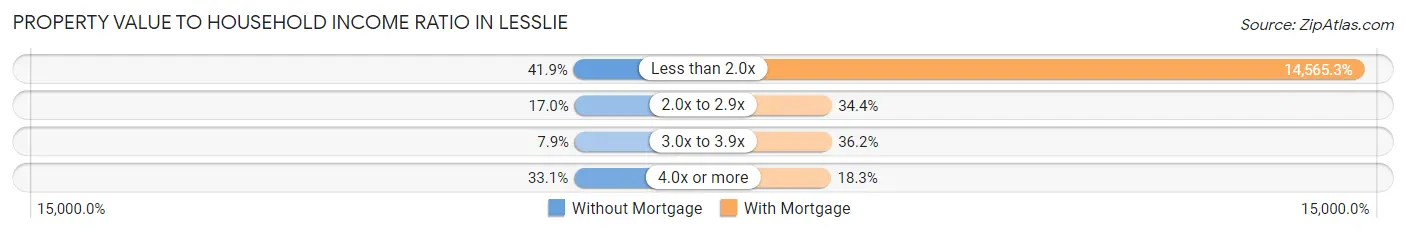
| Value-to-Income Ratio | Without Mortgage | With Mortgage |
| Less than 2.0x | 143 (41.9%) | 97,879 (14,565.3%) |
| 2.0x to 2.9x | 58 (17.0%) | 231 (34.4%) |
| 3.0x to 3.9x | 27 (7.9%) | 243 (36.2%) |
| 4.0x or more | 113 (33.1%) | 123 (18.3%) |
| Total | 341 (100.0%) | 672 (100.0%) |
Real Estate Taxes by Mortgage Status in Lesslie
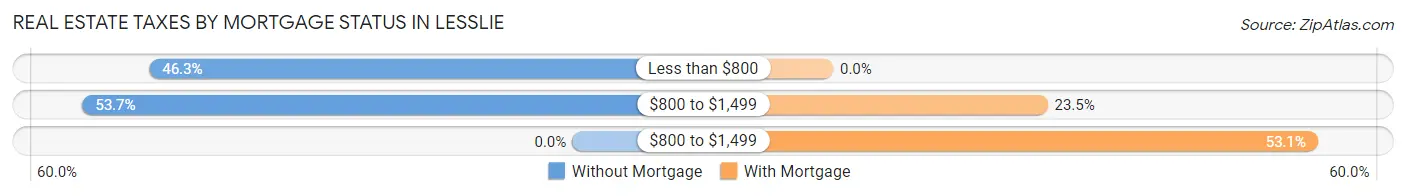
| Property Taxes | Without Mortgage | With Mortgage |
| Less than $800 | 158 (46.3%) | 0 (0.0%) |
| $800 to $1,499 | 183 (53.7%) | 158 (23.5%) |
| $800 to $1,499 | 0 (0.0%) | 357 (53.1%) |
| Total | 341 (100.0%) | 672 (100.0%) |
Health & Disability in Lesslie
Health Insurance Coverage by Age in Lesslie
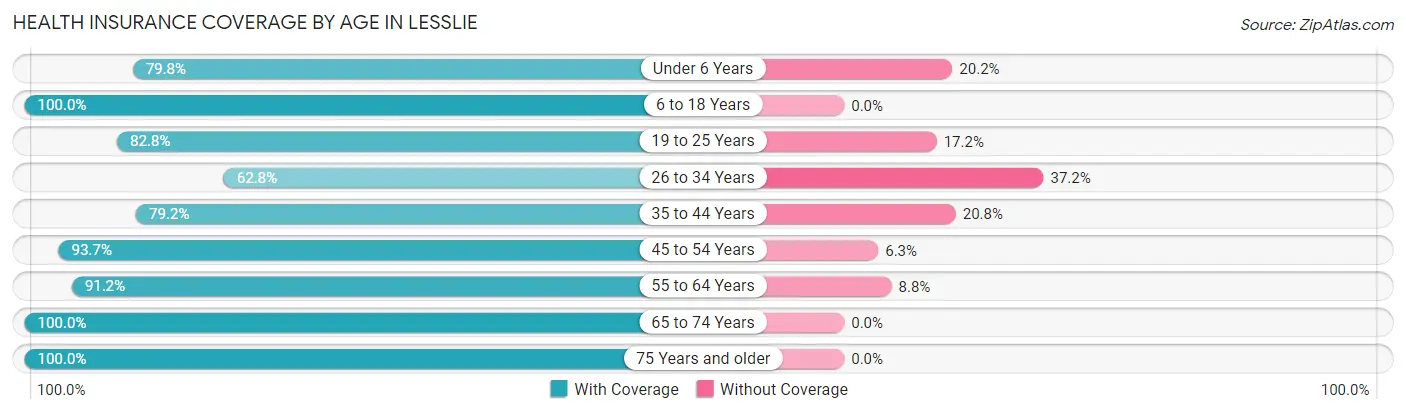
| Age Bracket | With Coverage | Without Coverage |
| Under 6 Years | 99 (79.8%) | 25 (20.2%) |
| 6 to 18 Years | 760 (100.0%) | 0 (0.0%) |
| 19 to 25 Years | 192 (82.8%) | 40 (17.2%) |
| 26 to 34 Years | 230 (62.8%) | 136 (37.2%) |
| 35 to 44 Years | 301 (79.2%) | 79 (20.8%) |
| 45 to 54 Years | 532 (93.7%) | 36 (6.3%) |
| 55 to 64 Years | 362 (91.2%) | 35 (8.8%) |
| 65 to 74 Years | 183 (100.0%) | 0 (0.0%) |
| 75 Years and older | 104 (100.0%) | 0 (0.0%) |
| Total | 2,763 (88.7%) | 351 (11.3%) |
Health Insurance Coverage by Citizenship Status in Lesslie
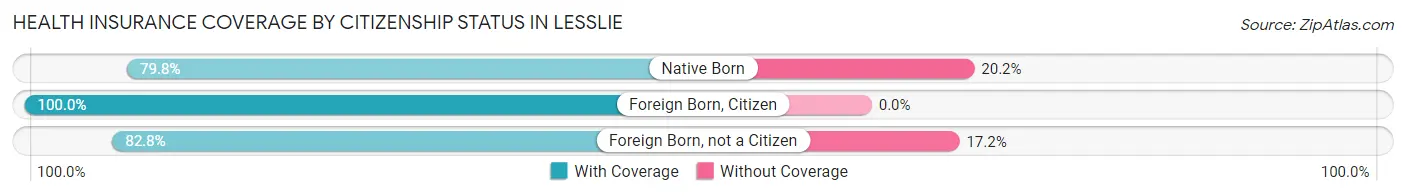
| Citizenship Status | With Coverage | Without Coverage |
| Native Born | 99 (79.8%) | 25 (20.2%) |
| Foreign Born, Citizen | 760 (100.0%) | 0 (0.0%) |
| Foreign Born, not a Citizen | 192 (82.8%) | 40 (17.2%) |
Health Insurance Coverage by Household Income in Lesslie
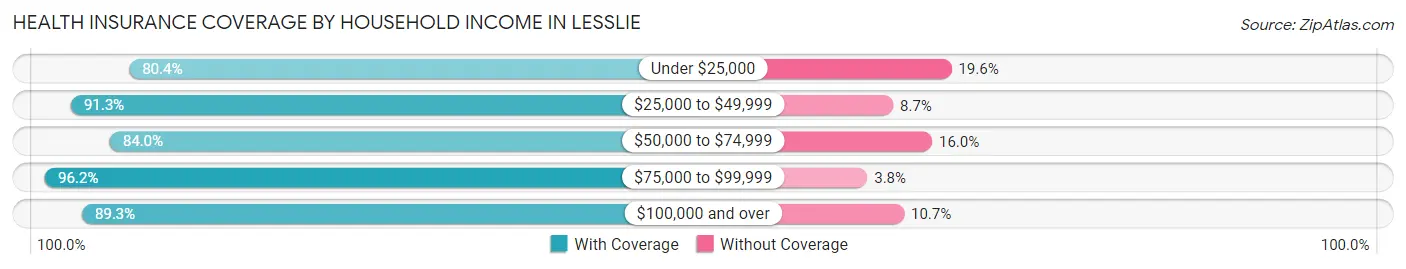
| Household Income | With Coverage | Without Coverage |
| Under $25,000 | 123 (80.4%) | 30 (19.6%) |
| $25,000 to $49,999 | 284 (91.3%) | 27 (8.7%) |
| $50,000 to $74,999 | 763 (84.0%) | 145 (16.0%) |
| $75,000 to $99,999 | 526 (96.2%) | 21 (3.8%) |
| $100,000 and over | 1,065 (89.3%) | 128 (10.7%) |
Public vs Private Health Insurance Coverage by Age in Lesslie
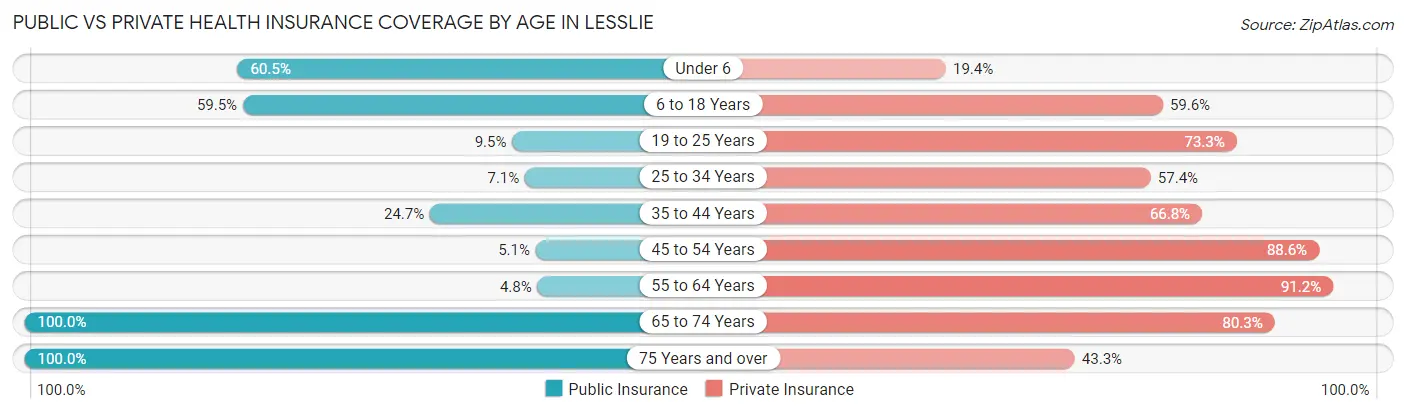
| Age Bracket | Public Insurance | Private Insurance |
| Under 6 | 75 (60.5%) | 24 (19.4%) |
| 6 to 18 Years | 452 (59.5%) | 453 (59.6%) |
| 19 to 25 Years | 22 (9.5%) | 170 (73.3%) |
| 25 to 34 Years | 26 (7.1%) | 210 (57.4%) |
| 35 to 44 Years | 94 (24.7%) | 254 (66.8%) |
| 45 to 54 Years | 29 (5.1%) | 503 (88.6%) |
| 55 to 64 Years | 19 (4.8%) | 362 (91.2%) |
| 65 to 74 Years | 183 (100.0%) | 147 (80.3%) |
| 75 Years and over | 104 (100.0%) | 45 (43.3%) |
| Total | 1,004 (32.2%) | 2,168 (69.6%) |
Disability Status by Sex by Age in Lesslie
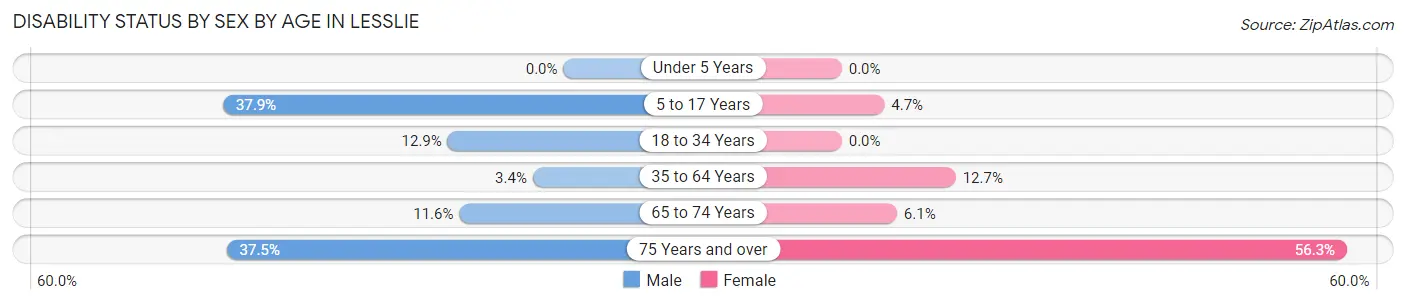
| Age Bracket | Male | Female |
| Under 5 Years | 0 (0.0%) | 0 (0.0%) |
| 5 to 17 Years | 152 (37.9%) | 17 (4.7%) |
| 18 to 34 Years | 45 (12.9%) | 0 (0.0%) |
| 35 to 64 Years | 19 (3.4%) | 100 (12.7%) |
| 65 to 74 Years | 8 (11.6%) | 7 (6.1%) |
| 75 Years and over | 9 (37.5%) | 45 (56.2%) |
Disability Class by Sex by Age in Lesslie
Disability Class: Hearing Difficulty
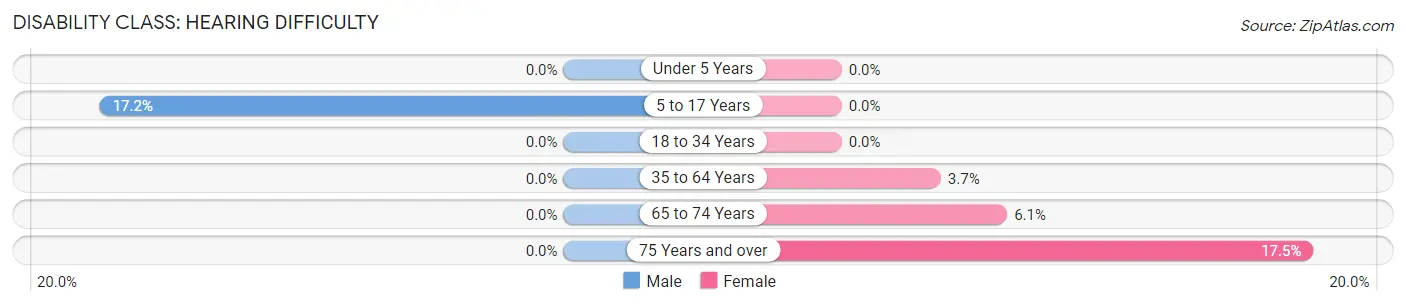
| Age Bracket | Male | Female |
| Under 5 Years | 0 (0.0%) | 0 (0.0%) |
| 5 to 17 Years | 69 (17.2%) | 0 (0.0%) |
| 18 to 34 Years | 0 (0.0%) | 0 (0.0%) |
| 35 to 64 Years | 0 (0.0%) | 29 (3.7%) |
| 65 to 74 Years | 0 (0.0%) | 7 (6.1%) |
| 75 Years and over | 0 (0.0%) | 14 (17.5%) |
Disability Class: Vision Difficulty
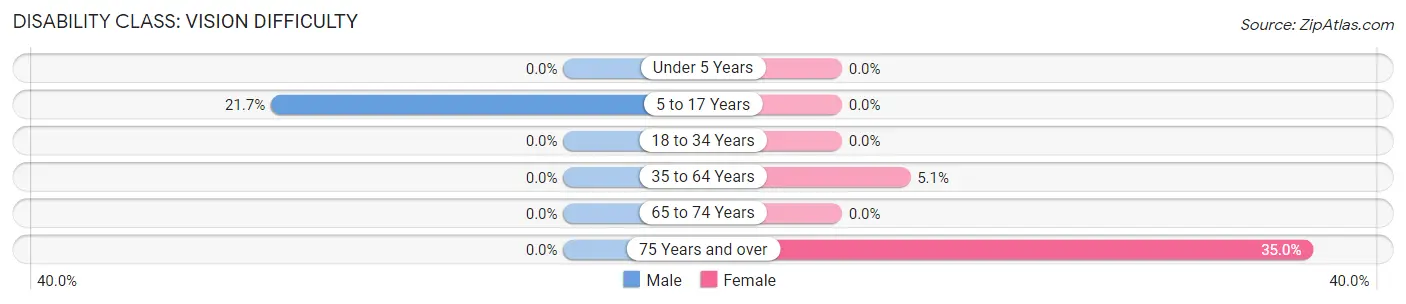
| Age Bracket | Male | Female |
| Under 5 Years | 0 (0.0%) | 0 (0.0%) |
| 5 to 17 Years | 87 (21.7%) | 0 (0.0%) |
| 18 to 34 Years | 0 (0.0%) | 0 (0.0%) |
| 35 to 64 Years | 0 (0.0%) | 40 (5.1%) |
| 65 to 74 Years | 0 (0.0%) | 0 (0.0%) |
| 75 Years and over | 0 (0.0%) | 28 (35.0%) |
Disability Class: Cognitive Difficulty
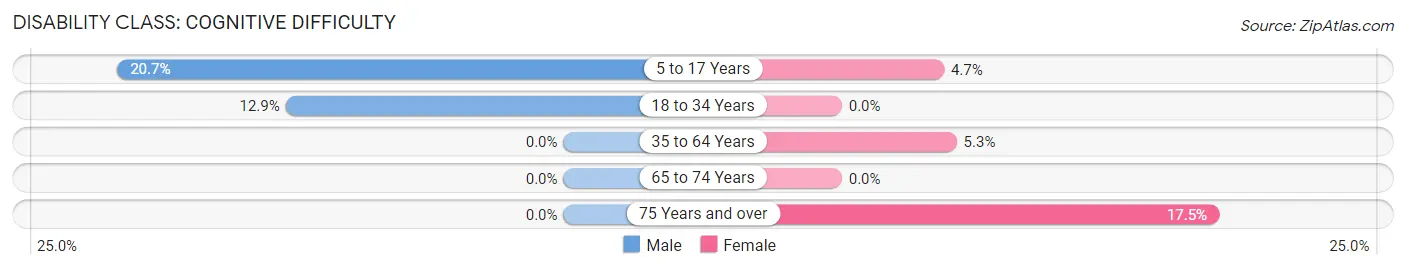
| Age Bracket | Male | Female |
| 5 to 17 Years | 83 (20.7%) | 17 (4.7%) |
| 18 to 34 Years | 45 (12.9%) | 0 (0.0%) |
| 35 to 64 Years | 0 (0.0%) | 42 (5.3%) |
| 65 to 74 Years | 0 (0.0%) | 0 (0.0%) |
| 75 Years and over | 0 (0.0%) | 14 (17.5%) |
Disability Class: Ambulatory Difficulty
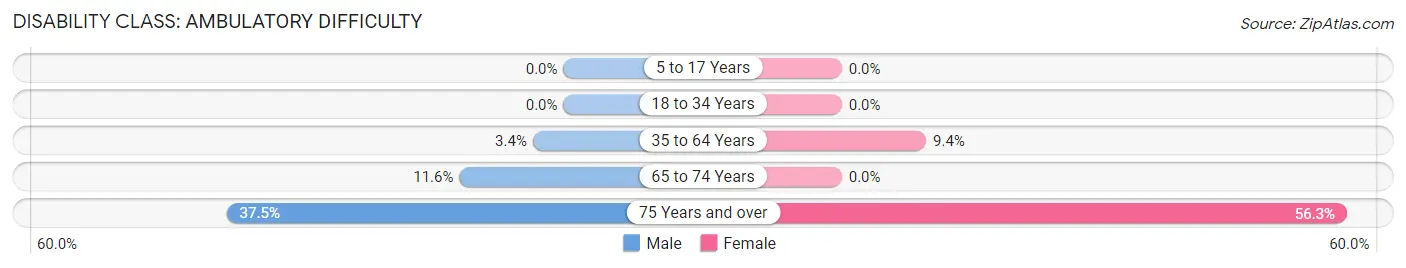
| Age Bracket | Male | Female |
| 5 to 17 Years | 0 (0.0%) | 0 (0.0%) |
| 18 to 34 Years | 0 (0.0%) | 0 (0.0%) |
| 35 to 64 Years | 19 (3.4%) | 74 (9.4%) |
| 65 to 74 Years | 8 (11.6%) | 0 (0.0%) |
| 75 Years and over | 9 (37.5%) | 45 (56.2%) |
Disability Class: Self-Care Difficulty
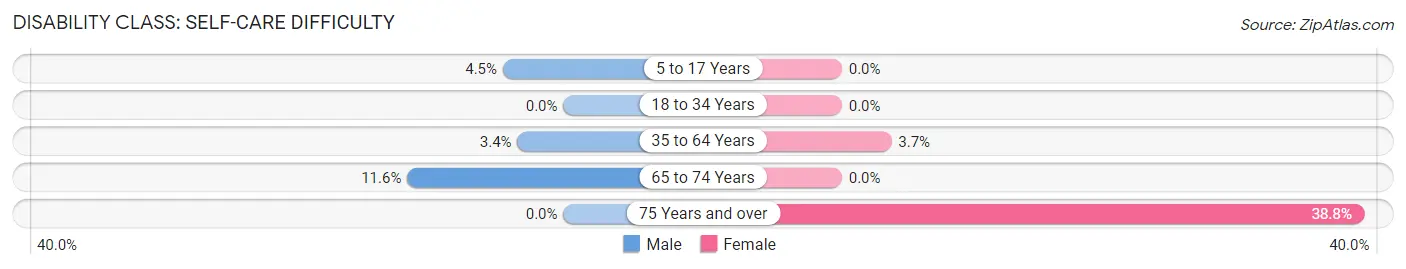
| Age Bracket | Male | Female |
| 5 to 17 Years | 18 (4.5%) | 0 (0.0%) |
| 18 to 34 Years | 0 (0.0%) | 0 (0.0%) |
| 35 to 64 Years | 19 (3.4%) | 29 (3.7%) |
| 65 to 74 Years | 8 (11.6%) | 0 (0.0%) |
| 75 Years and over | 0 (0.0%) | 31 (38.8%) |
Technology Access in Lesslie
Computing Device Access in Lesslie
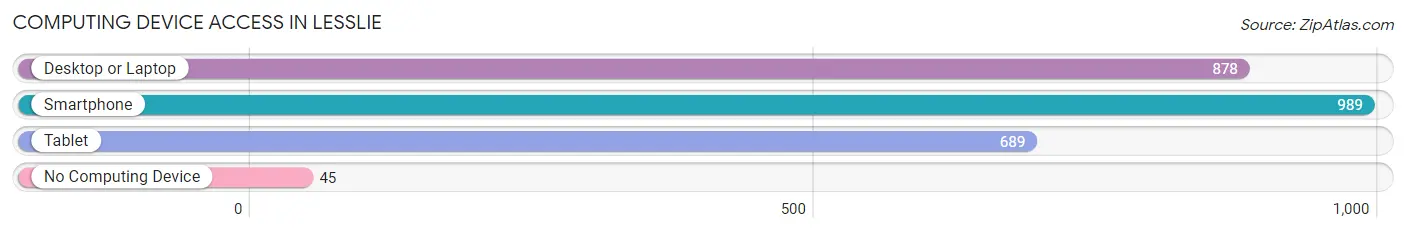
| Device Type | # Households | % Households |
| Desktop or Laptop | 878 | 79.7% |
| Smartphone | 989 | 89.7% |
| Tablet | 689 | 62.5% |
| No Computing Device | 45 | 4.1% |
| Total | 1,102 | 100.0% |
Internet Access in Lesslie
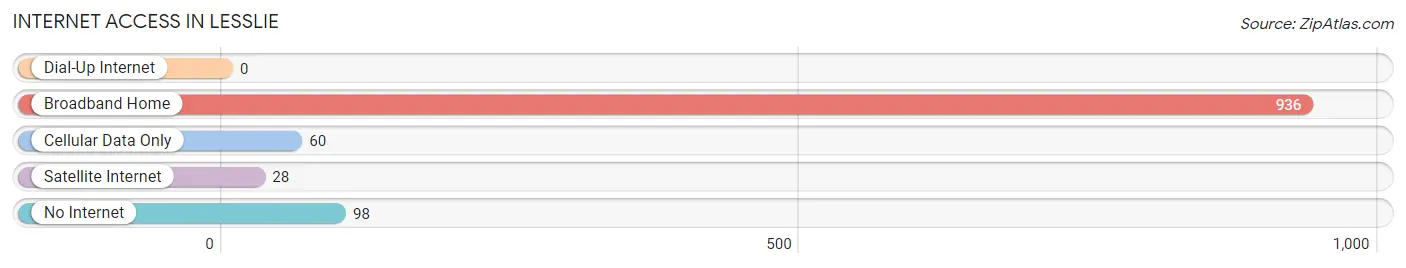
| Internet Type | # Households | % Households |
| Dial-Up Internet | 0 | 0.0% |
| Broadband Home | 936 | 84.9% |
| Cellular Data Only | 60 | 5.4% |
| Satellite Internet | 28 | 2.5% |
| No Internet | 98 | 8.9% |
| Total | 1,102 | 100.0% |
Lesslie Summary
Leslie, South Carolina is a small town located in the northwest corner of the state, near the border of North Carolina. It is part of the Greenville-Spartanburg-Anderson metropolitan area and is situated in the foothills of the Blue Ridge Mountains. The town has a population of just over 1,000 people and is known for its rural charm and friendly atmosphere.
History
Leslie was founded in 1845 by a group of settlers from North Carolina. The town was named after the first settler, William Leslie, who was a veteran of the Revolutionary War. The town was originally a farming community, but in the late 19th century, the railroad came through and the town began to grow. The railroad brought new businesses and industries to the area, and the town soon became a center for commerce and industry.
In the early 20th century, Leslie was a thriving community with a variety of businesses, including a cotton mill, a furniture factory, and a brickyard. The town also had a number of churches, schools, and other civic organizations.
Geography
Leslie is located in the northwest corner of South Carolina, near the border of North Carolina. The town is situated in the foothills of the Blue Ridge Mountains and is surrounded by rolling hills and forests. The town is located about 25 miles from Greenville and about 50 miles from Spartanburg.
The climate in Leslie is mild and temperate, with hot summers and cool winters. The average annual temperature is around 60 degrees Fahrenheit. The town receives an average of 45 inches of rain per year.
Economy
The economy of Leslie is largely based on agriculture and tourism. The town is home to several farms, which produce a variety of crops, including corn, soybeans, and hay. The town also has a number of small businesses, including restaurants, shops, and other services.
Tourism is an important part of the economy of Leslie. The town is home to several historic sites, including the Leslie Historic District, which is listed on the National Register of Historic Places. The town also has a number of outdoor recreation opportunities, including hiking, fishing, and camping.
Demographics
As of the 2010 census, the population of Leslie was 1,072. The racial makeup of the town was 94.3% White, 3.2% African American, 0.3% Native American, 0.3% Asian, 0.2% from other races, and 1.9% from two or more races. The median household income was $37,500, and the median family income was $45,000.
Leslie is a small, rural town with a friendly atmosphere and a strong sense of community. The town is home to a variety of businesses and organizations, and it is a popular destination for tourists looking to explore the area’s natural beauty and historic sites.
Common Questions
What is Per Capita Income in Lesslie?
Per Capita income in Lesslie is $30,523.
What is the Median Family Income in Lesslie?
Median Family Income in Lesslie is $93,864.
What is the Median Household income in Lesslie?
Median Household Income in Lesslie is $77,500.
What is Income or Wage Gap in Lesslie?
Income or Wage Gap in Lesslie is 32.7%.
Women in Lesslie earn 67.3 cents for every dollar earned by a man.
What is Inequality or Gini Index in Lesslie?
Inequality or Gini Index in Lesslie is 0.32.
What is the Total Population of Lesslie?
Total Population of Lesslie is 3,114.
What is the Total Male Population of Lesslie?
Total Male Population of Lesslie is 1,486.
What is the Total Female Population of Lesslie?
Total Female Population of Lesslie is 1,628.
What is the Ratio of Males per 100 Females in Lesslie?
There are 91.28 Males per 100 Females in Lesslie.
What is the Ratio of Females per 100 Males in Lesslie?
There are 109.56 Females per 100 Males in Lesslie.
What is the Median Population Age in Lesslie?
Median Population Age in Lesslie is 38.7 Years.
What is the Average Family Size in Lesslie
Average Family Size in Lesslie is 3.1 People.
What is the Average Household Size in Lesslie
Average Household Size in Lesslie is 2.8 People.
How Large is the Labor Force in Lesslie?
There are 1,579 People in the Labor Forcein in Lesslie.
What is the Percentage of People in the Labor Force in Lesslie?
66.7% of People are in the Labor Force in Lesslie.
What is the Unemployment Rate in Lesslie?
Unemployment Rate in Lesslie is 5.8%.