North Augusta, SC Map & Demographics
North Augusta Map
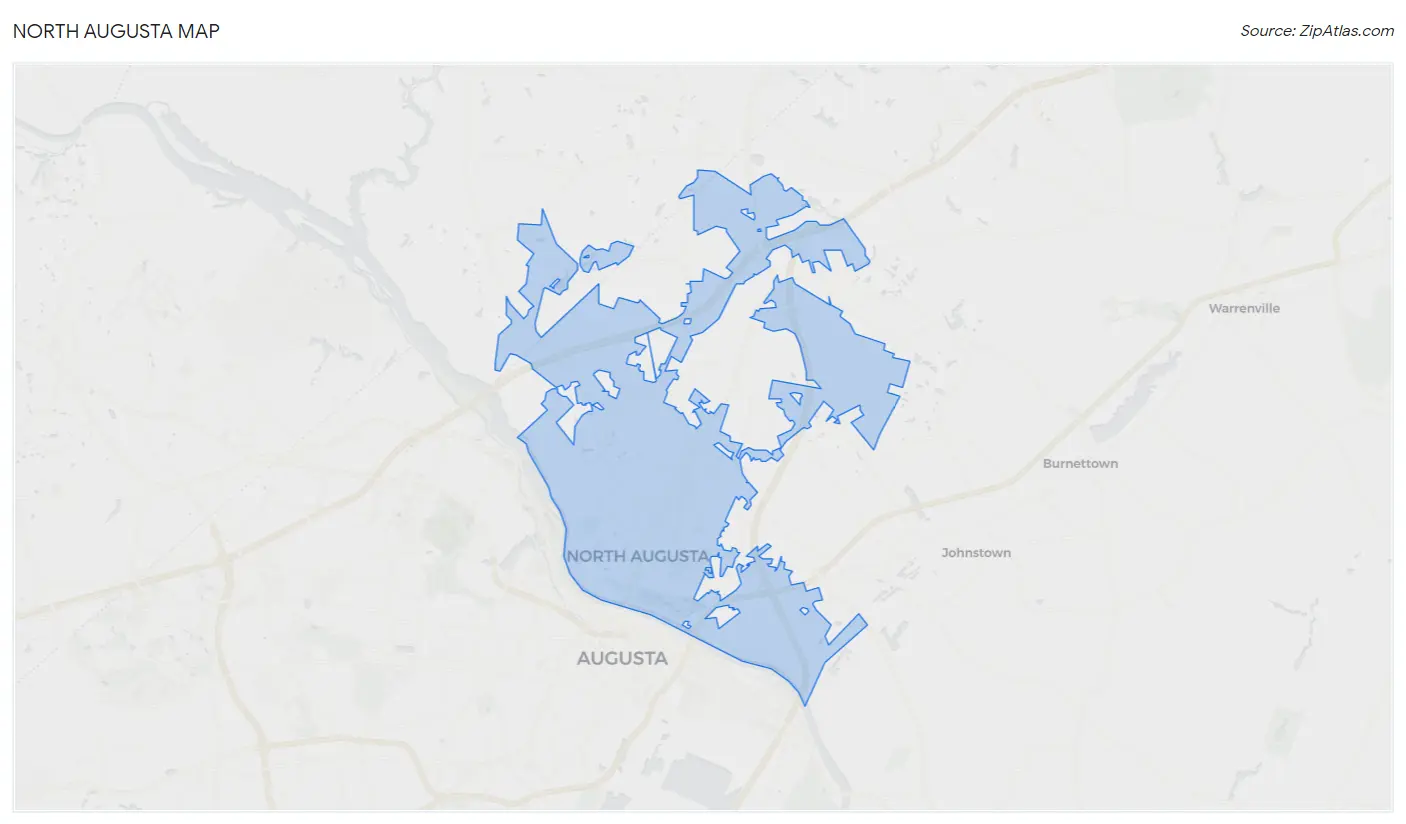
North Augusta Overview
$46,452
PER CAPITA INCOME
$98,389
AVG FAMILY INCOME
$85,093
AVG HOUSEHOLD INCOME
34.5%
WAGE / INCOME GAP [ % ]
65.5¢/ $1
WAGE / INCOME GAP [ $ ]
0.44
INEQUALITY / GINI INDEX
24,425
TOTAL POPULATION
11,728
MALE POPULATION
12,697
FEMALE POPULATION
92.37
MALES / 100 FEMALES
108.26
FEMALES / 100 MALES
43.4
MEDIAN AGE
2.8
AVG FAMILY SIZE
2.2
AVG HOUSEHOLD SIZE
13,291
LABOR FORCE [ PEOPLE ]
64.9%
PERCENT IN LABOR FORCE
3.8%
UNEMPLOYMENT RATE
North Augusta Area Codes
Income in North Augusta
Income Overview in North Augusta
Per Capita Income in North Augusta is $46,452, while median incomes of families and households are $98,389 and $85,093 respectively.
| Characteristic | Number | Measure |
| Per Capita Income | 24,425 | $46,452 |
| Median Family Income | 6,703 | $98,389 |
| Mean Family Income | 6,703 | $124,510 |
| Median Household Income | 10,875 | $85,093 |
| Mean Household Income | 10,875 | $101,991 |
| Income Deficit | 6,703 | $0 |
| Wage / Income Gap (%) | 24,425 | 34.46% |
| Wage / Income Gap ($) | 24,425 | 65.54¢ per $1 |
| Gini / Inequality Index | 24,425 | 0.44 |
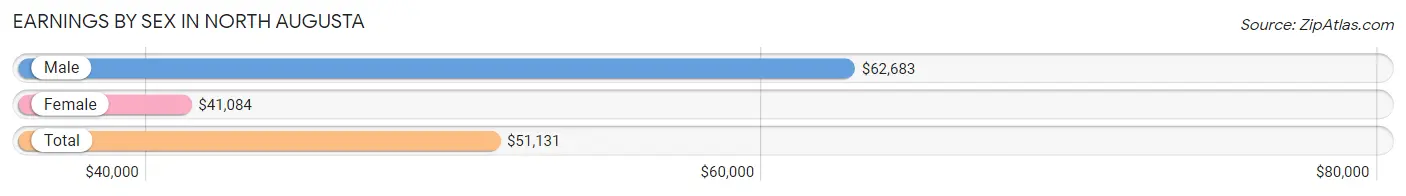
Earnings by Sex in North Augusta
Average Earnings in North Augusta are $51,131, $62,683 for men and $41,084 for women, a difference of 34.5%.
| Sex | Number | Average Earnings |
| Male | 7,122 (52.0%) | $62,683 |
| Female | 6,574 (48.0%) | $41,084 |
| Total | 13,696 (100.0%) | $51,131 |
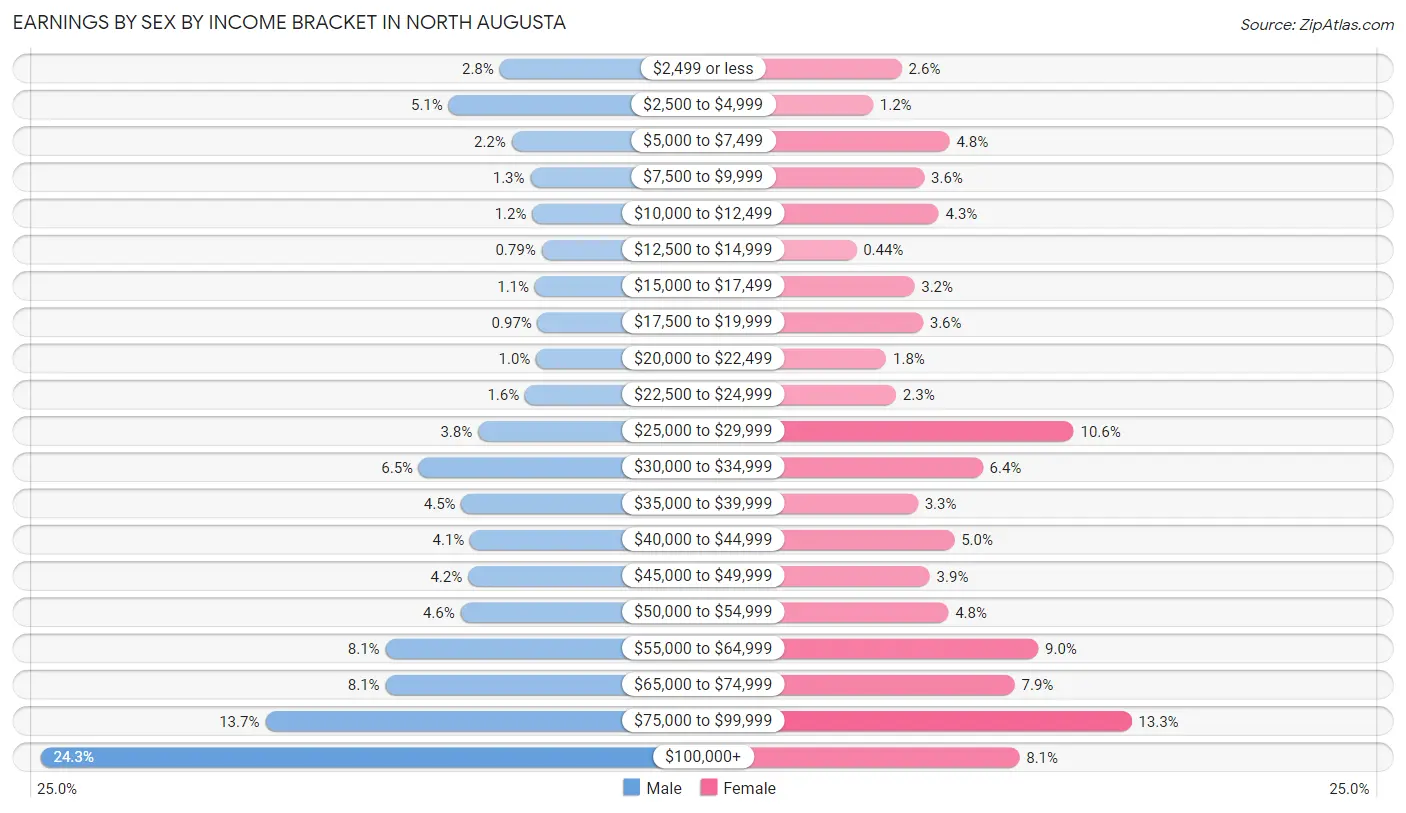
Earnings by Sex by Income Bracket in North Augusta
The most common earnings brackets in North Augusta are $100,000+ for men (1,727 | 24.2%) and $75,000 to $99,999 for women (876 | 13.3%).
| Income | Male | Female |
| $2,499 or less | 196 (2.8%) | 169 (2.6%) |
| $2,500 to $4,999 | 366 (5.1%) | 80 (1.2%) |
| $5,000 to $7,499 | 156 (2.2%) | 316 (4.8%) |
| $7,500 to $9,999 | 93 (1.3%) | 238 (3.6%) |
| $10,000 to $12,499 | 87 (1.2%) | 283 (4.3%) |
| $12,500 to $14,999 | 56 (0.8%) | 29 (0.4%) |
| $15,000 to $17,499 | 78 (1.1%) | 208 (3.2%) |
| $17,500 to $19,999 | 69 (1.0%) | 234 (3.6%) |
| $20,000 to $22,499 | 74 (1.0%) | 121 (1.8%) |
| $22,500 to $24,999 | 111 (1.6%) | 151 (2.3%) |
| $25,000 to $29,999 | 268 (3.8%) | 698 (10.6%) |
| $30,000 to $34,999 | 465 (6.5%) | 418 (6.4%) |
| $35,000 to $39,999 | 323 (4.5%) | 218 (3.3%) |
| $40,000 to $44,999 | 294 (4.1%) | 331 (5.0%) |
| $45,000 to $49,999 | 301 (4.2%) | 255 (3.9%) |
| $50,000 to $54,999 | 326 (4.6%) | 312 (4.8%) |
| $55,000 to $64,999 | 577 (8.1%) | 589 (9.0%) |
| $65,000 to $74,999 | 577 (8.1%) | 517 (7.9%) |
| $75,000 to $99,999 | 978 (13.7%) | 876 (13.3%) |
| $100,000+ | 1,727 (24.2%) | 531 (8.1%) |
| Total | 7,122 (100.0%) | 6,574 (100.0%) |
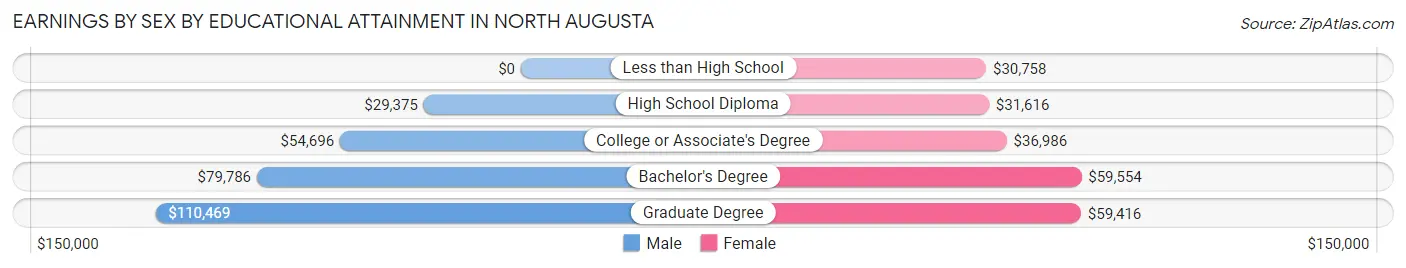
Earnings by Sex by Educational Attainment in North Augusta
Average earnings in North Augusta are $64,680 for men and $46,051 for women, a difference of 28.8%. Men with an educational attainment of graduate degree enjoy the highest average annual earnings of $110,469, while those with high school diploma education earn the least with $29,375. Women with an educational attainment of bachelor's degree earn the most with the average annual earnings of $59,554, while those with less than high school education have the smallest earnings of $30,758.
| Educational Attainment | Male Income | Female Income |
| Less than High School | - | - |
| High School Diploma | $29,375 | $31,616 |
| College or Associate's Degree | $54,696 | $36,986 |
| Bachelor's Degree | $79,786 | $59,554 |
| Graduate Degree | $110,469 | $59,416 |
| Total | $64,680 | $46,051 |
Family Income in North Augusta
Family Income Brackets in North Augusta
According to the North Augusta family income data, there are 1,468 families falling into the $100,000 to $149,999 income range, which is the most common income bracket and makes up 21.9% of all families. Conversely, the less than $10,000 income bracket is the least frequent group with only 40 families (0.6%) belonging to this category.
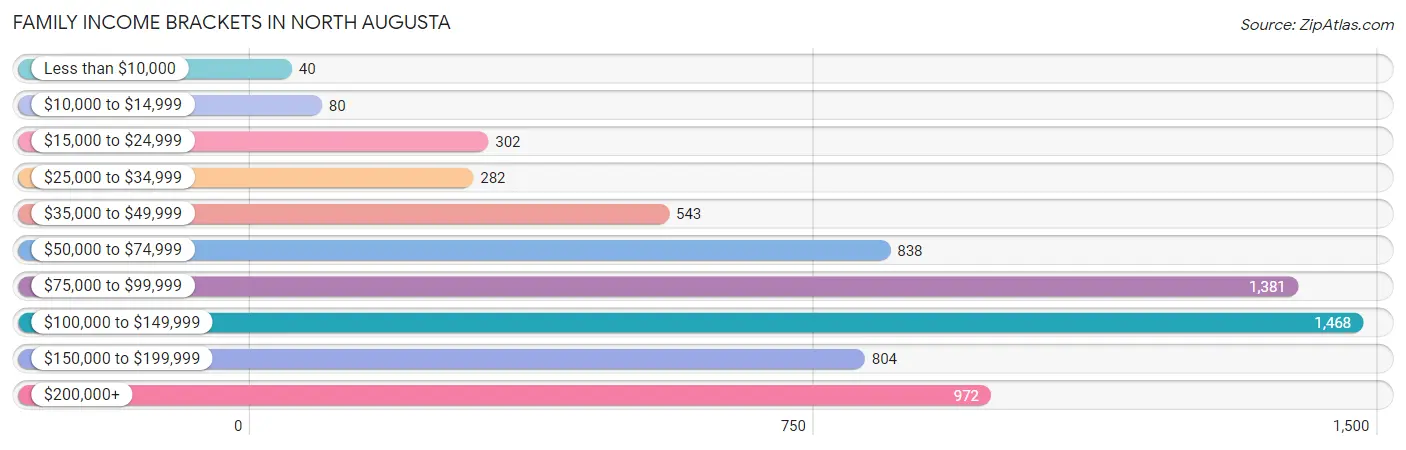
| Income Bracket | # Families | % Families |
| Less than $10,000 | 40 | 0.6% |
| $10,000 to $14,999 | 80 | 1.2% |
| $15,000 to $24,999 | 302 | 4.5% |
| $25,000 to $34,999 | 282 | 4.2% |
| $35,000 to $49,999 | 543 | 8.1% |
| $50,000 to $74,999 | 838 | 12.5% |
| $75,000 to $99,999 | 1,381 | 20.6% |
| $100,000 to $149,999 | 1,468 | 21.9% |
| $150,000 to $199,999 | 804 | 12.0% |
| $200,000+ | 972 | 14.5% |
Family Income by Famaliy Size in North Augusta
4-person families (851 | 12.7%) account for the highest median family income in North Augusta with $126,951 per family, while 2-person families (3,692 | 55.1%) have the highest median income of $44,364 per family member.
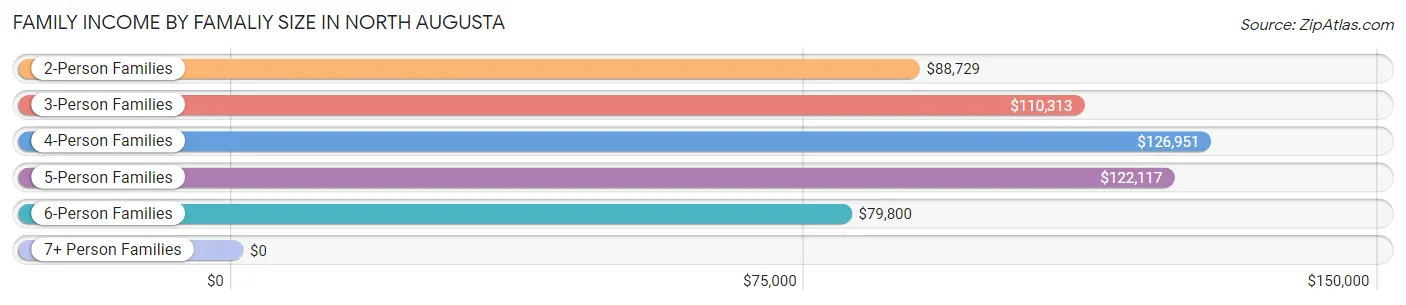
| Income Bracket | # Families | Median Income |
| 2-Person Families | 3,692 (55.1%) | $88,729 |
| 3-Person Families | 1,639 (24.4%) | $110,313 |
| 4-Person Families | 851 (12.7%) | $126,951 |
| 5-Person Families | 337 (5.0%) | $122,117 |
| 6-Person Families | 184 (2.8%) | $79,800 |
| 7+ Person Families | 0 (0.0%) | $0 |
| Total | 6,703 (100.0%) | $98,389 |
Family Income by Number of Earners in North Augusta
The median family income in North Augusta is $98,389, with families comprising 2 earners (3,173) having the highest median family income of $130,926, while families with no earners (946) have the lowest median family income of $58,043, accounting for 47.3% and 14.1% of families, respectively.
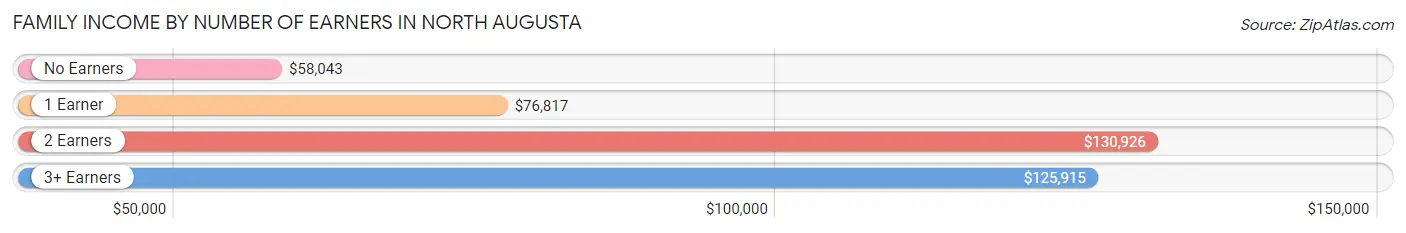
| Number of Earners | # Families | Median Income |
| No Earners | 946 (14.1%) | $58,043 |
| 1 Earner | 2,049 (30.6%) | $76,817 |
| 2 Earners | 3,173 (47.3%) | $130,926 |
| 3+ Earners | 535 (8.0%) | $125,915 |
| Total | 6,703 (100.0%) | $98,389 |
Household Income in North Augusta
Household Income Brackets in North Augusta
With 1,958 households falling in the category, the $100,000 to $149,999 income range is the most frequent in North Augusta, accounting for 18.0% of all households. In contrast, only 391 households (3.6%) fall into the $10,000 to $14,999 income bracket, making it the least populous group.
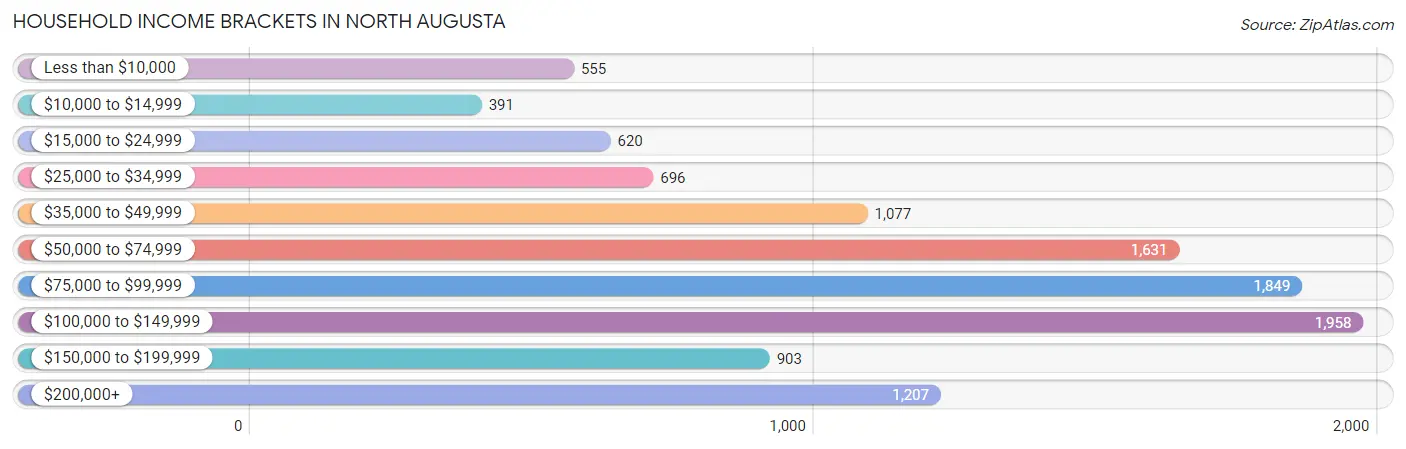
| Income Bracket | # Households | % Households |
| Less than $10,000 | 555 | 5.1% |
| $10,000 to $14,999 | 391 | 3.6% |
| $15,000 to $24,999 | 620 | 5.7% |
| $25,000 to $34,999 | 696 | 6.4% |
| $35,000 to $49,999 | 1,077 | 9.9% |
| $50,000 to $74,999 | 1,631 | 15.0% |
| $75,000 to $99,999 | 1,849 | 17.0% |
| $100,000 to $149,999 | 1,958 | 18.0% |
| $150,000 to $199,999 | 903 | 8.3% |
| $200,000+ | 1,207 | 11.1% |
Household Income by Householder Age in North Augusta
The median household income in North Augusta is $85,093, with the highest median household income of $104,830 found in the 45 to 64 years age bracket for the primary householder. A total of 4,097 households (37.7%) fall into this category. Meanwhile, the 65+ years age bracket for the primary householder has the lowest median household income of $59,035, with 2,881 households (26.5%) in this group.
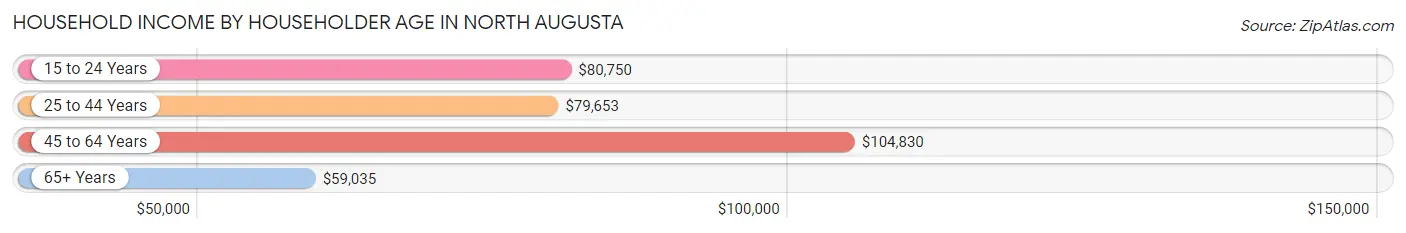
| Income Bracket | # Households | Median Income |
| 15 to 24 Years | 124 (1.1%) | $80,750 |
| 25 to 44 Years | 3,773 (34.7%) | $79,653 |
| 45 to 64 Years | 4,097 (37.7%) | $104,830 |
| 65+ Years | 2,881 (26.5%) | $59,035 |
| Total | 10,875 (100.0%) | $85,093 |
Poverty in North Augusta
Income Below Poverty by Sex and Age in North Augusta
With 9.1% poverty level for males and 7.1% for females among the residents of North Augusta, 55 to 64 year old males and 12 to 14 year old females are the most vulnerable to poverty, with 392 males (21.7%) and 59 females (15.2%) in their respective age groups living below the poverty level.
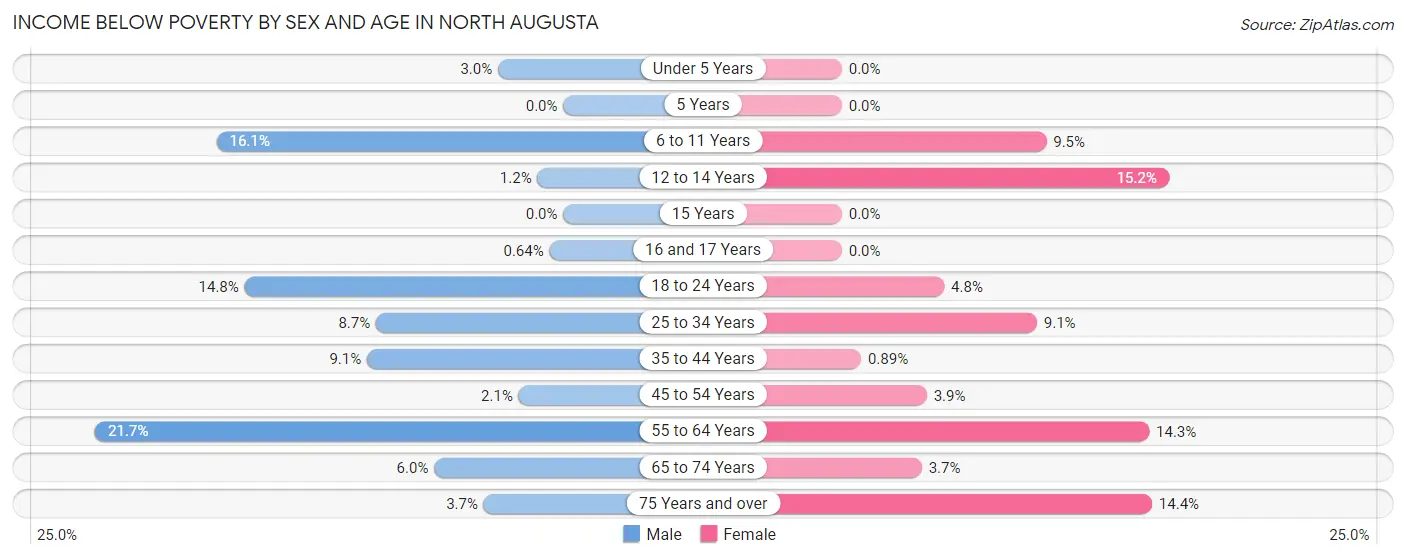
| Age Bracket | Male | Female |
| Under 5 Years | 20 (3.0%) | 0 (0.0%) |
| 5 Years | 0 (0.0%) | 0 (0.0%) |
| 6 to 11 Years | 126 (16.1%) | 70 (9.5%) |
| 12 to 14 Years | 3 (1.2%) | 59 (15.2%) |
| 15 Years | 0 (0.0%) | 0 (0.0%) |
| 16 and 17 Years | 2 (0.6%) | 0 (0.0%) |
| 18 to 24 Years | 63 (14.8%) | 31 (4.8%) |
| 25 to 34 Years | 160 (8.7%) | 188 (9.0%) |
| 35 to 44 Years | 159 (9.1%) | 13 (0.9%) |
| 45 to 54 Years | 32 (2.1%) | 73 (3.9%) |
| 55 to 64 Years | 392 (21.7%) | 272 (14.3%) |
| 65 to 74 Years | 80 (6.0%) | 56 (3.7%) |
| 75 Years and over | 20 (3.7%) | 124 (14.4%) |
| Total | 1,057 (9.1%) | 886 (7.1%) |
Income Above Poverty by Sex and Age in North Augusta
According to the poverty statistics in North Augusta, males aged 5 years and females aged under 5 years are the age groups that are most secure financially, with 100.0% of males and 100.0% of females in these age groups living above the poverty line.
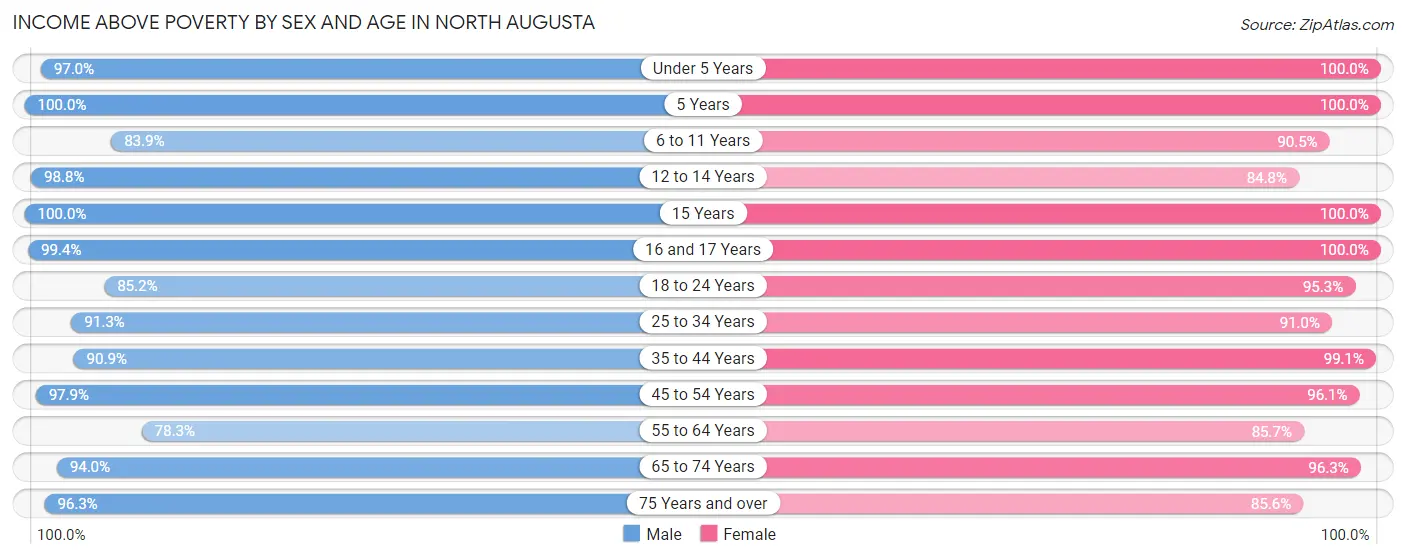
| Age Bracket | Male | Female |
| Under 5 Years | 639 (97.0%) | 736 (100.0%) |
| 5 Years | 147 (100.0%) | 39 (100.0%) |
| 6 to 11 Years | 657 (83.9%) | 668 (90.5%) |
| 12 to 14 Years | 247 (98.8%) | 330 (84.8%) |
| 15 Years | 168 (100.0%) | 11 (100.0%) |
| 16 and 17 Years | 309 (99.4%) | 203 (100.0%) |
| 18 to 24 Years | 363 (85.2%) | 622 (95.3%) |
| 25 to 34 Years | 1,682 (91.3%) | 1,889 (90.9%) |
| 35 to 44 Years | 1,586 (90.9%) | 1,451 (99.1%) |
| 45 to 54 Years | 1,514 (97.9%) | 1,778 (96.1%) |
| 55 to 64 Years | 1,412 (78.3%) | 1,636 (85.7%) |
| 65 to 74 Years | 1,256 (94.0%) | 1,453 (96.3%) |
| 75 Years and over | 522 (96.3%) | 738 (85.6%) |
| Total | 10,502 (90.9%) | 11,554 (92.9%) |
Income Below Poverty Among Married-Couple Families in North Augusta
The poverty statistics for married-couple families in North Augusta show that 3.5% or 193 of the total 5,533 families live below the poverty line. Families with no children have the highest poverty rate of 3.9%, comprising of 136 families. On the other hand, families with 3 or 4 children have the lowest poverty rate of 0.0%, which includes 0 families.
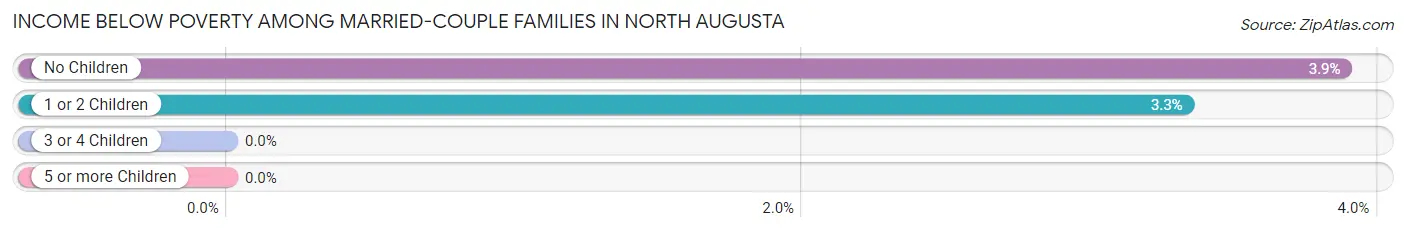
| Children | Above Poverty | Below Poverty |
| No Children | 3,370 (96.1%) | 136 (3.9%) |
| 1 or 2 Children | 1,656 (96.7%) | 57 (3.3%) |
| 3 or 4 Children | 314 (100.0%) | 0 (0.0%) |
| 5 or more Children | 0 (0.0%) | 0 (0.0%) |
| Total | 5,340 (96.5%) | 193 (3.5%) |
Income Below Poverty Among Single-Parent Households in North Augusta
According to the poverty data in North Augusta, 1.5% or 5 single-father households and 9.7% or 81 single-mother households are living below the poverty line. Among single-father households, those with 1 or 2 children have the highest poverty rate, with 5 households (3.5%) experiencing poverty. Likewise, among single-mother households, those with 3 or 4 children have the highest poverty rate, with 6 households (28.6%) falling below the poverty line.
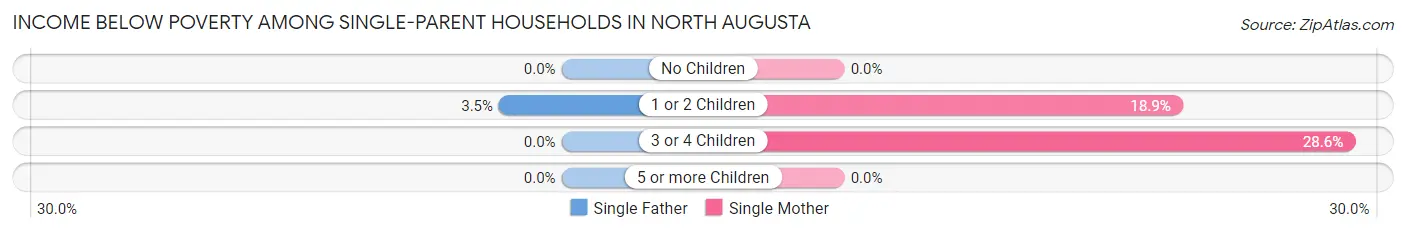
| Children | Single Father | Single Mother |
| No Children | 0 (0.0%) | 0 (0.0%) |
| 1 or 2 Children | 5 (3.5%) | 75 (18.9%) |
| 3 or 4 Children | 0 (0.0%) | 6 (28.6%) |
| 5 or more Children | 0 (0.0%) | 0 (0.0%) |
| Total | 5 (1.5%) | 81 (9.7%) |
Income Below Poverty Among Married-Couple vs Single-Parent Households in North Augusta
The poverty data for North Augusta shows that 193 of the married-couple family households (3.5%) and 86 of the single-parent households (7.3%) are living below the poverty level. Within the married-couple family households, those with no children have the highest poverty rate, with 136 households (3.9%) falling below the poverty line. Among the single-parent households, those with 1 or 2 children have the highest poverty rate, with 80 household (14.8%) living below poverty.
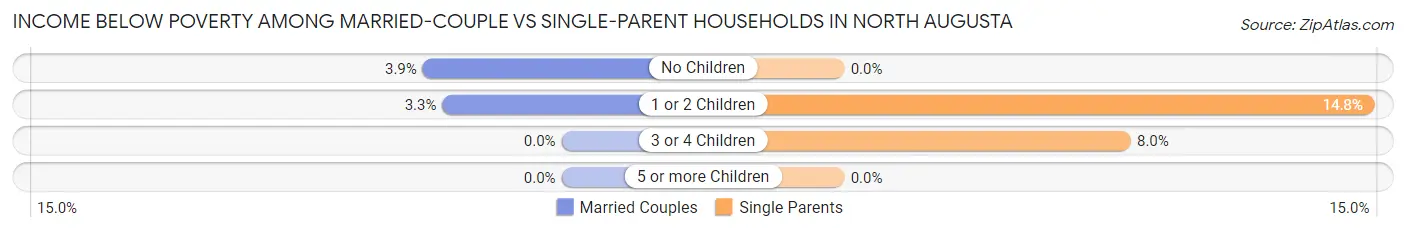
| Children | Married-Couple Families | Single-Parent Households |
| No Children | 136 (3.9%) | 0 (0.0%) |
| 1 or 2 Children | 57 (3.3%) | 80 (14.8%) |
| 3 or 4 Children | 0 (0.0%) | 6 (8.0%) |
| 5 or more Children | 0 (0.0%) | 0 (0.0%) |
| Total | 193 (3.5%) | 86 (7.3%) |
Race in North Augusta
The most populous races in North Augusta are White / Caucasian (19,456 | 79.7%), Black / African American (3,450 | 14.1%), and Hispanic or Latino (1,559 | 6.4%).
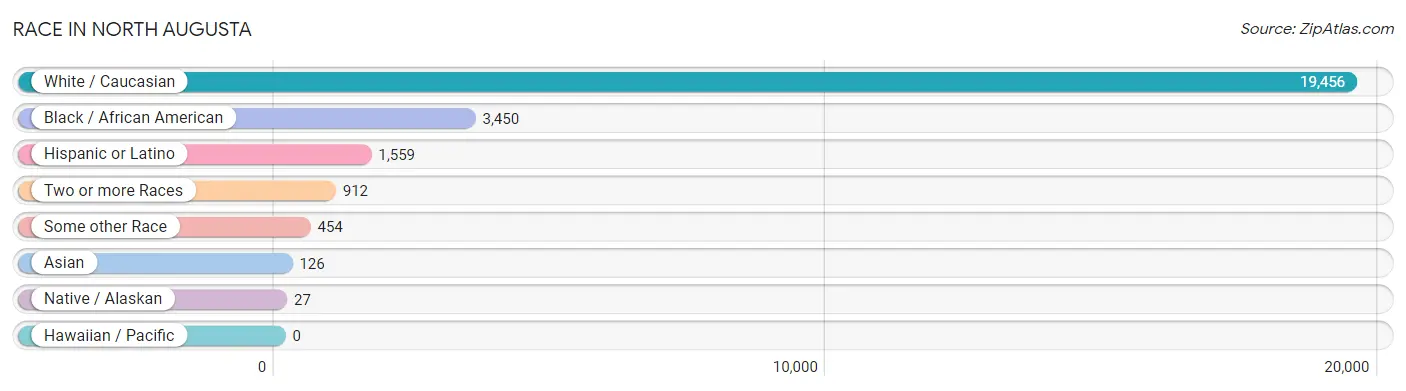
| Race | # Population | % Population |
| Asian | 126 | 0.5% |
| Black / African American | 3,450 | 14.1% |
| Hawaiian / Pacific | 0 | 0.0% |
| Hispanic or Latino | 1,559 | 6.4% |
| Native / Alaskan | 27 | 0.1% |
| White / Caucasian | 19,456 | 79.7% |
| Two or more Races | 912 | 3.7% |
| Some other Race | 454 | 1.9% |
| Total | 24,425 | 100.0% |
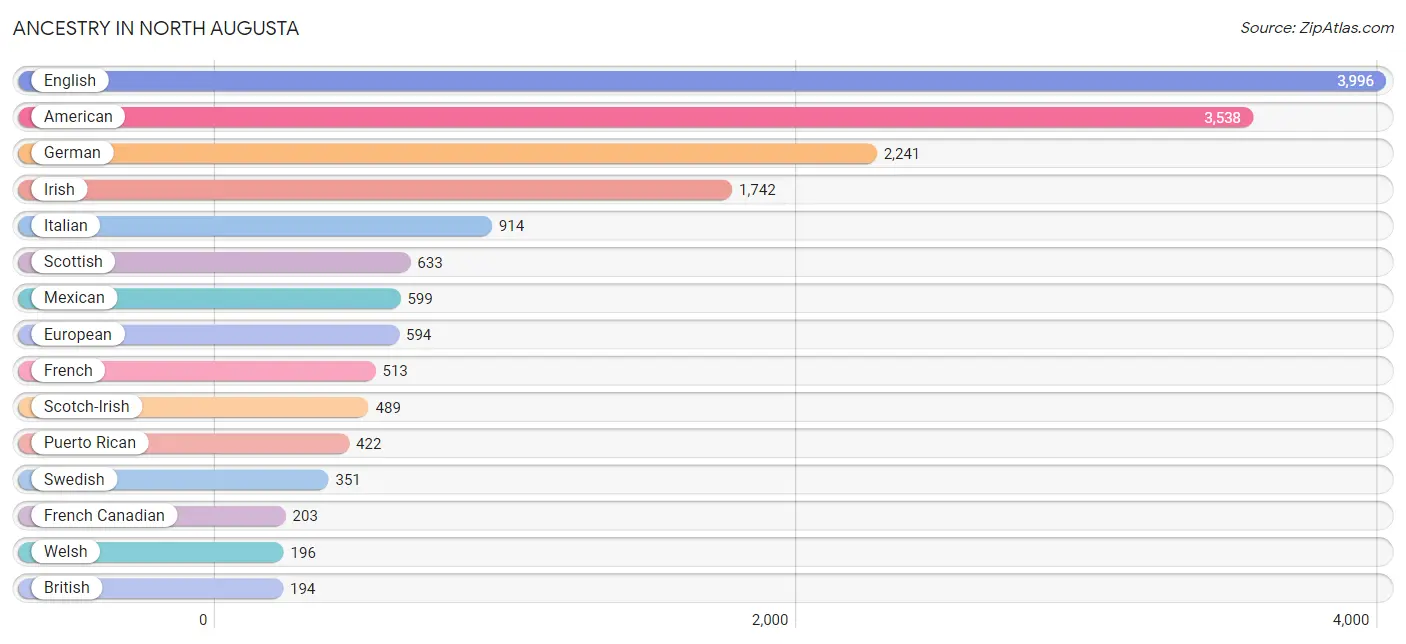
Ancestry in North Augusta
The most populous ancestries reported in North Augusta are English (3,996 | 16.4%), American (3,538 | 14.5%), German (2,241 | 9.2%), Irish (1,742 | 7.1%), and Italian (914 | 3.7%), together accounting for 50.9% of all North Augusta residents.
| Ancestry | # Population | % Population |
| African | 87 | 0.4% |
| American | 3,538 | 14.5% |
| Bahamian | 40 | 0.2% |
| Belgian | 26 | 0.1% |
| Bhutanese | 34 | 0.1% |
| Blackfeet | 7 | 0.0% |
| British | 194 | 0.8% |
| Bulgarian | 12 | 0.1% |
| Burmese | 12 | 0.1% |
| Central American | 62 | 0.3% |
| Central American Indian | 4 | 0.0% |
| Cherokee | 23 | 0.1% |
| Choctaw | 14 | 0.1% |
| Colombian | 80 | 0.3% |
| Costa Rican | 46 | 0.2% |
| Cuban | 15 | 0.1% |
| Czechoslovakian | 9 | 0.0% |
| Danish | 16 | 0.1% |
| Dominican | 38 | 0.2% |
| Dutch | 89 | 0.4% |
| Eastern European | 36 | 0.2% |
| English | 3,996 | 16.4% |
| European | 594 | 2.4% |
| French | 513 | 2.1% |
| French American Indian | 17 | 0.1% |
| French Canadian | 203 | 0.8% |
| German | 2,241 | 9.2% |
| Greek | 120 | 0.5% |
| Guatemalan | 4 | 0.0% |
| Haitian | 123 | 0.5% |
| Hungarian | 19 | 0.1% |
| Indian (Asian) | 88 | 0.4% |
| Iranian | 74 | 0.3% |
| Irish | 1,742 | 7.1% |
| Italian | 914 | 3.7% |
| Jamaican | 1 | 0.0% |
| Lithuanian | 18 | 0.1% |
| Mexican | 599 | 2.5% |
| Mongolian | 19 | 0.1% |
| Norwegian | 159 | 0.6% |
| Pakistani | 22 | 0.1% |
| Polish | 170 | 0.7% |
| Portuguese | 62 | 0.3% |
| Puerto Rican | 422 | 1.7% |
| Romanian | 15 | 0.1% |
| Russian | 32 | 0.1% |
| Salvadoran | 12 | 0.1% |
| Scandinavian | 23 | 0.1% |
| Scotch-Irish | 489 | 2.0% |
| Scottish | 633 | 2.6% |
| South American | 80 | 0.3% |
| Spaniard | 107 | 0.4% |
| Spanish | 51 | 0.2% |
| Sri Lankan | 16 | 0.1% |
| Subsaharan African | 87 | 0.4% |
| Swedish | 351 | 1.4% |
| Swiss | 20 | 0.1% |
| Welsh | 196 | 0.8% |
| Yugoslavian | 23 | 0.1% | View All 59 Rows |
Immigrants in North Augusta
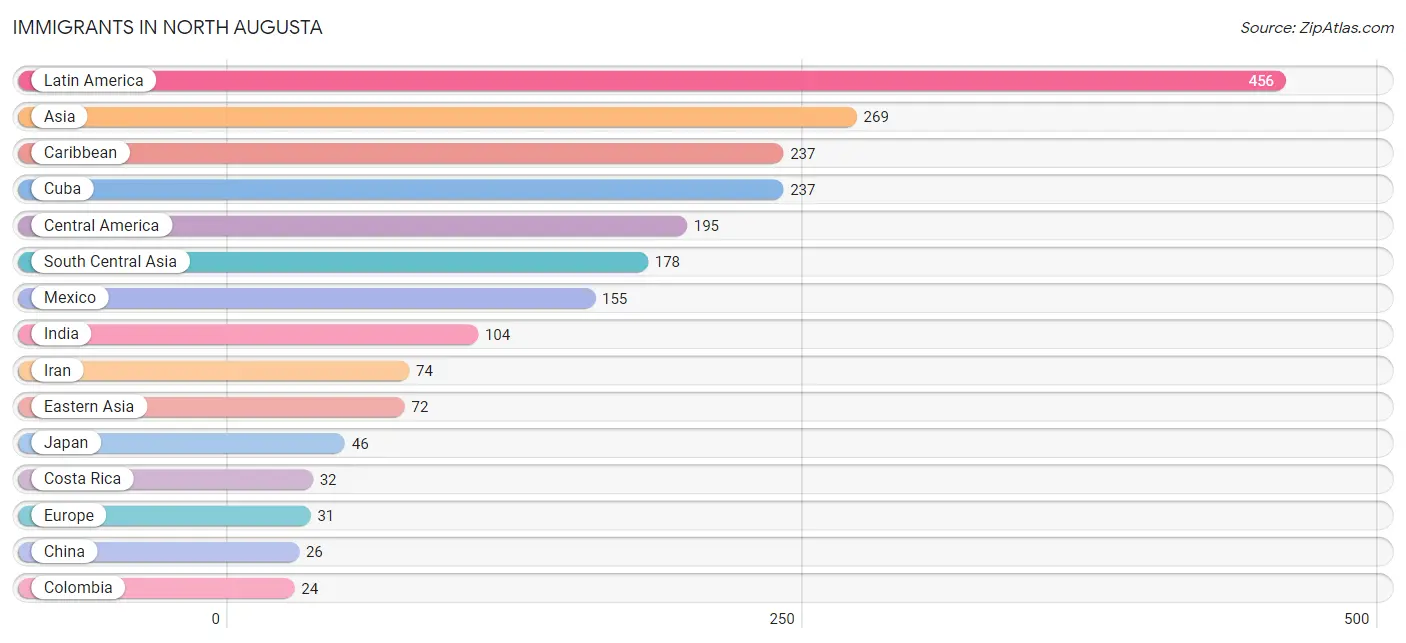
The most numerous immigrant groups reported in North Augusta came from Latin America (456 | 1.9%), Asia (269 | 1.1%), Caribbean (237 | 1.0%), Cuba (237 | 1.0%), and Central America (195 | 0.8%), together accounting for 5.7% of all North Augusta residents.
| Immigration Origin | # Population | % Population |
| Asia | 269 | 1.1% |
| Canada | 4 | 0.0% |
| Caribbean | 237 | 1.0% |
| Central America | 195 | 0.8% |
| China | 26 | 0.1% |
| Colombia | 24 | 0.1% |
| Costa Rica | 32 | 0.1% |
| Cuba | 237 | 1.0% |
| Denmark | 1 | 0.0% |
| Eastern Asia | 72 | 0.3% |
| Eastern Europe | 15 | 0.1% |
| El Salvador | 7 | 0.0% |
| Europe | 31 | 0.1% |
| Germany | 15 | 0.1% |
| Guatemala | 1 | 0.0% |
| India | 104 | 0.4% |
| Iran | 74 | 0.3% |
| Japan | 46 | 0.2% |
| Latin America | 456 | 1.9% |
| Malaysia | 19 | 0.1% |
| Mexico | 155 | 0.6% |
| Northern Europe | 1 | 0.0% |
| Romania | 15 | 0.1% |
| South America | 24 | 0.1% |
| South Central Asia | 178 | 0.7% |
| South Eastern Asia | 19 | 0.1% |
| Western Europe | 15 | 0.1% | View All 27 Rows |
Sex and Age in North Augusta
Sex and Age in North Augusta
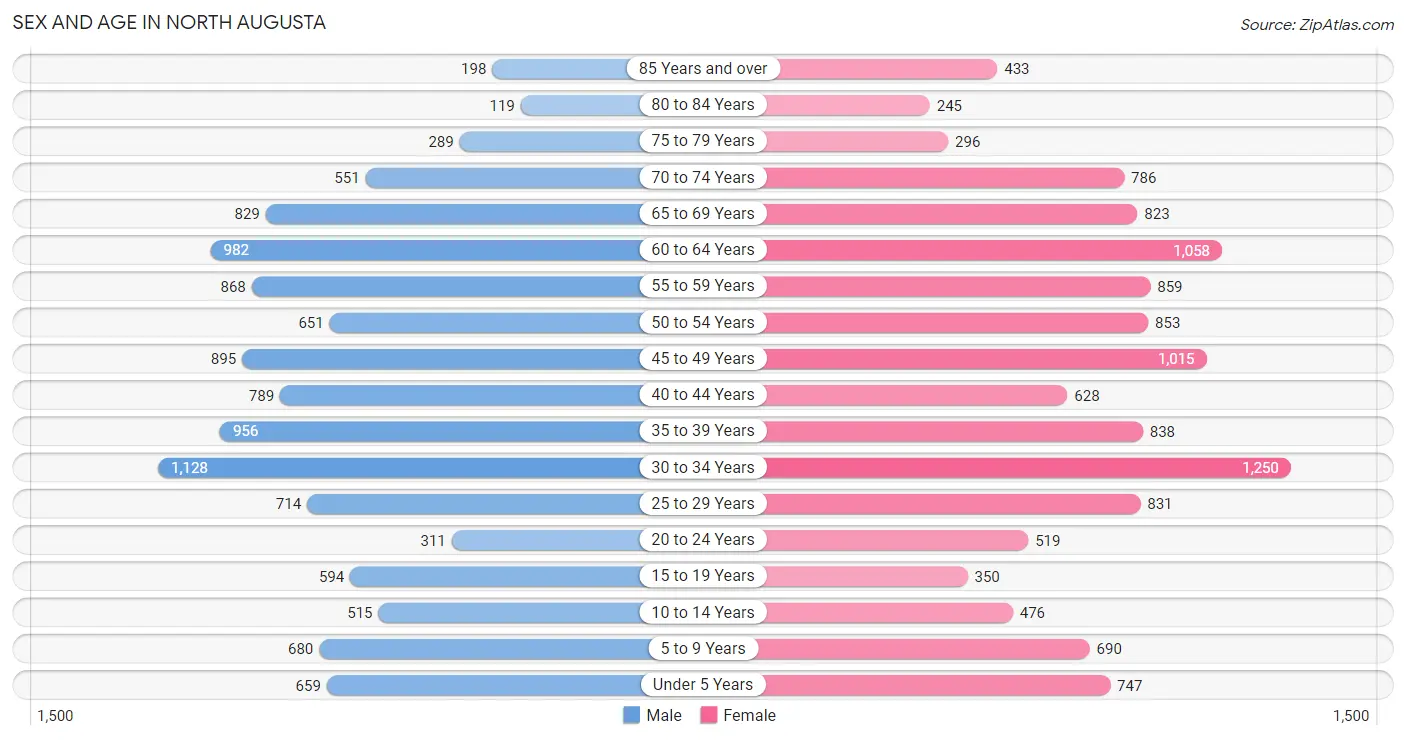
The most populous age groups in North Augusta are 30 to 34 Years (1,128 | 9.6%) for men and 30 to 34 Years (1,250 | 9.8%) for women.
| Age Bracket | Male | Female |
| Under 5 Years | 659 (5.6%) | 747 (5.9%) |
| 5 to 9 Years | 680 (5.8%) | 690 (5.4%) |
| 10 to 14 Years | 515 (4.4%) | 476 (3.7%) |
| 15 to 19 Years | 594 (5.1%) | 350 (2.8%) |
| 20 to 24 Years | 311 (2.6%) | 519 (4.1%) |
| 25 to 29 Years | 714 (6.1%) | 831 (6.5%) |
| 30 to 34 Years | 1,128 (9.6%) | 1,250 (9.8%) |
| 35 to 39 Years | 956 (8.2%) | 838 (6.6%) |
| 40 to 44 Years | 789 (6.7%) | 628 (5.0%) |
| 45 to 49 Years | 895 (7.6%) | 1,015 (8.0%) |
| 50 to 54 Years | 651 (5.6%) | 853 (6.7%) |
| 55 to 59 Years | 868 (7.4%) | 859 (6.8%) |
| 60 to 64 Years | 982 (8.4%) | 1,058 (8.3%) |
| 65 to 69 Years | 829 (7.1%) | 823 (6.5%) |
| 70 to 74 Years | 551 (4.7%) | 786 (6.2%) |
| 75 to 79 Years | 289 (2.5%) | 296 (2.3%) |
| 80 to 84 Years | 119 (1.0%) | 245 (1.9%) |
| 85 Years and over | 198 (1.7%) | 433 (3.4%) |
| Total | 11,728 (100.0%) | 12,697 (100.0%) |
Families and Households in North Augusta
Median Family Size in North Augusta
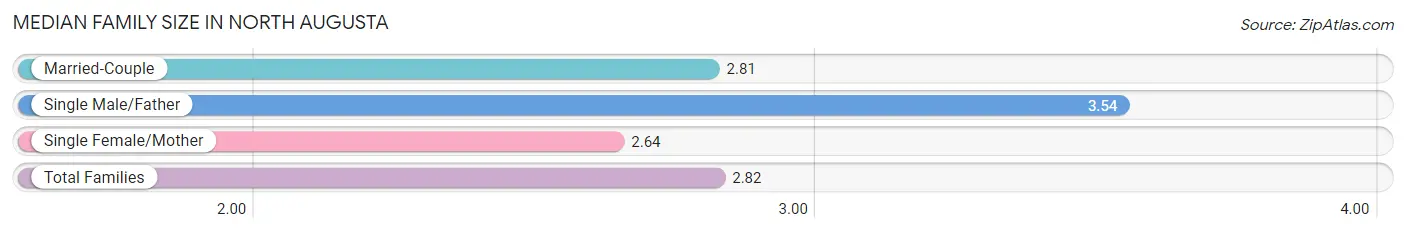
The median family size in North Augusta is 2.82 persons per family, with single male/father families (333 | 5.0%) accounting for the largest median family size of 3.54 persons per family. On the other hand, single female/mother families (837 | 12.5%) represent the smallest median family size with 2.64 persons per family.
| Family Type | # Families | Family Size |
| Married-Couple | 5,533 (82.6%) | 2.81 |
| Single Male/Father | 333 (5.0%) | 3.54 |
| Single Female/Mother | 837 (12.5%) | 2.64 |
| Total Families | 6,703 (100.0%) | 2.82 |
Median Household Size in North Augusta
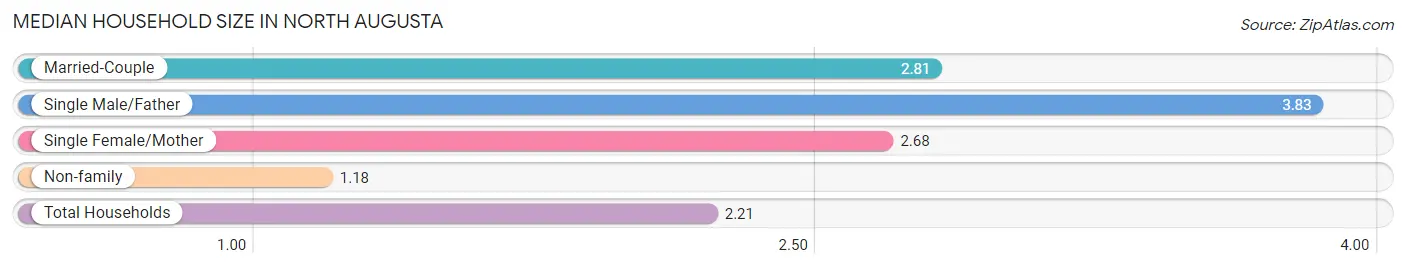
The median household size in North Augusta is 2.21 persons per household, with single male/father households (333 | 3.1%) accounting for the largest median household size of 3.83 persons per household. non-family households (4,172 | 38.4%) represent the smallest median household size with 1.18 persons per household.
| Household Type | # Households | Household Size |
| Married-Couple | 5,533 (50.9%) | 2.81 |
| Single Male/Father | 333 (3.1%) | 3.83 |
| Single Female/Mother | 837 (7.7%) | 2.68 |
| Non-family | 4,172 (38.4%) | 1.18 |
| Total Households | 10,875 (100.0%) | 2.21 |
Household Size by Marriage Status in North Augusta
Out of a total of 10,875 households in North Augusta, 6,703 (61.6%) are family households, while 4,172 (38.4%) are nonfamily households. The most numerous type of family households are 2-person households, comprising 3,633, and the most common type of nonfamily households are 1-person households, comprising 3,413.
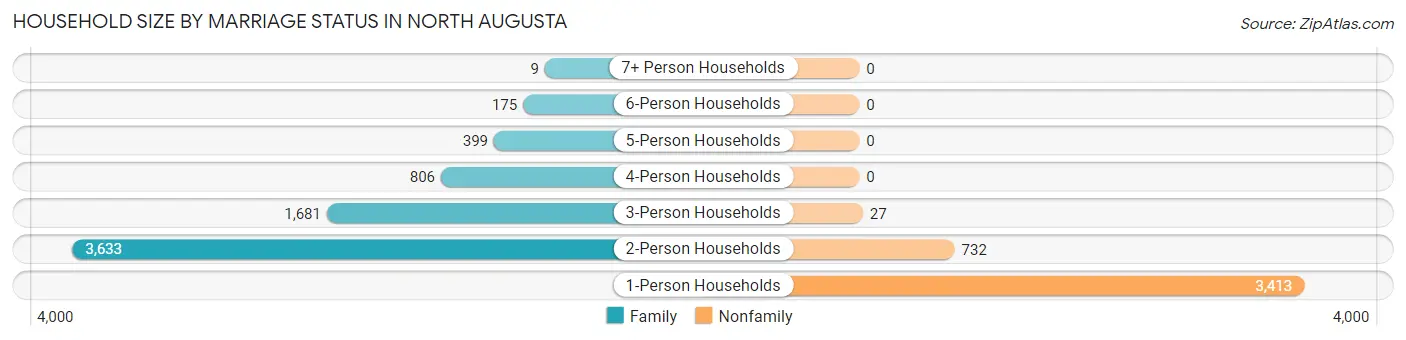
| Household Size | Family Households | Nonfamily Households |
| 1-Person Households | - | 3,413 (31.4%) |
| 2-Person Households | 3,633 (33.4%) | 732 (6.7%) |
| 3-Person Households | 1,681 (15.5%) | 27 (0.3%) |
| 4-Person Households | 806 (7.4%) | 0 (0.0%) |
| 5-Person Households | 399 (3.7%) | 0 (0.0%) |
| 6-Person Households | 175 (1.6%) | 0 (0.0%) |
| 7+ Person Households | 9 (0.1%) | 0 (0.0%) |
| Total | 6,703 (61.6%) | 4,172 (38.4%) |
Female Fertility in North Augusta
Fertility by Age in North Augusta
Average fertility rate in North Augusta is 58.0 births per 1,000 women. Women in the age bracket of 20 to 34 years have the highest fertility rate with 103.0 births per 1,000 women. Women in the age bracket of 20 to 34 years acount for 82.4% of all women with births.
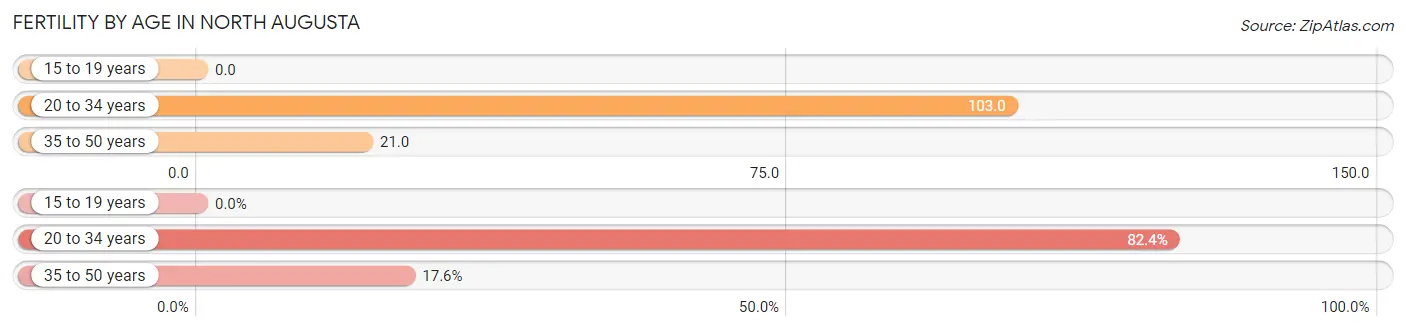
| Age Bracket | Women with Births | Births / 1,000 Women |
| 15 to 19 years | 0 (0.0%) | 0.0 |
| 20 to 34 years | 267 (82.4%) | 103.0 |
| 35 to 50 years | 57 (17.6%) | 21.0 |
| Total | 324 (100.0%) | 58.0 |
Fertility by Age by Marriage Status in North Augusta
73.8% of women with births (324) in North Augusta are married. The highest percentage of unmarried women with births falls into 35 to 50 years age bracket with 26.3% of them unmarried at the time of birth, while the lowest percentage of unmarried women with births belong to 20 to 34 years age bracket with 26.2% of them unmarried.
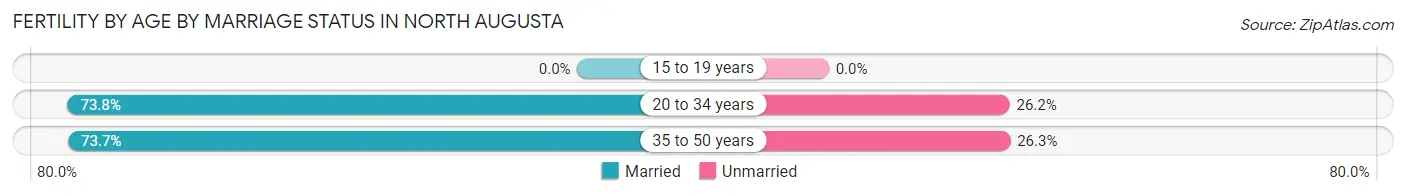
| Age Bracket | Married | Unmarried |
| 15 to 19 years | 0 (0.0%) | 0 (0.0%) |
| 20 to 34 years | 197 (73.8%) | 70 (26.2%) |
| 35 to 50 years | 42 (73.7%) | 15 (26.3%) |
| Total | 239 (73.8%) | 85 (26.2%) |
Fertility by Education in North Augusta
Average fertility rate in North Augusta is 58.0 births per 1,000 women. Women with the education attainment of high school diploma have the highest fertility rate of 73.0 births per 1,000 women, while women with the education attainment of less than high school have the lowest fertility at 42.0 births per 1,000 women. Women with the education attainment of college or associate's degree represent 34.6% of all women with births.
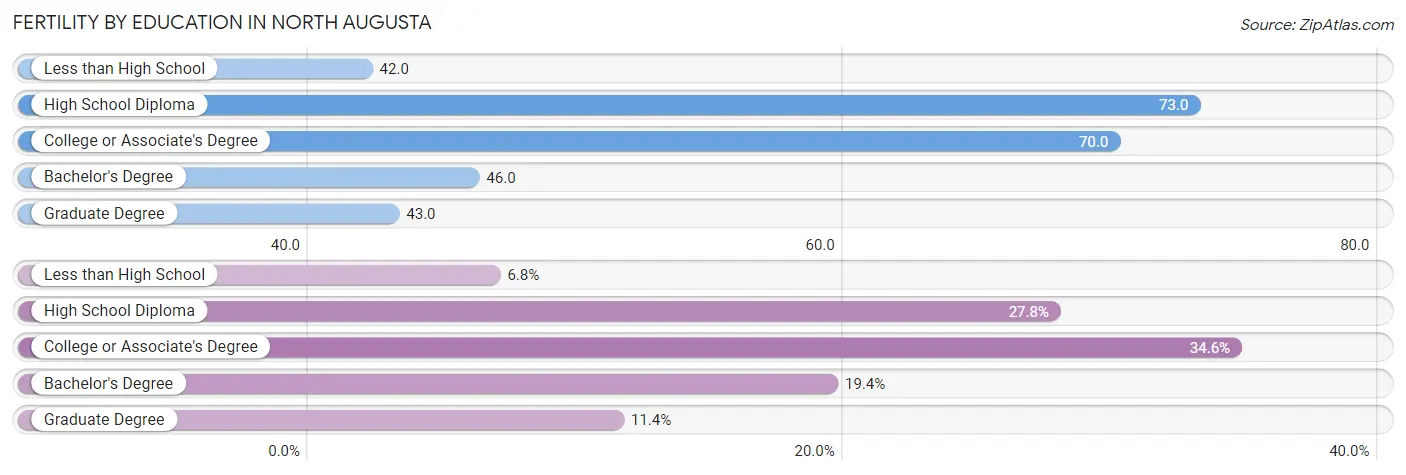
| Educational Attainment | Women with Births | Births / 1,000 Women |
| Less than High School | 22 (6.8%) | 42.0 |
| High School Diploma | 90 (27.8%) | 73.0 |
| College or Associate's Degree | 112 (34.6%) | 70.0 |
| Bachelor's Degree | 63 (19.4%) | 46.0 |
| Graduate Degree | 37 (11.4%) | 43.0 |
| Total | 324 (100.0%) | 58.0 |
Fertility by Education by Marriage Status in North Augusta
26.2% of women with births in North Augusta are unmarried. Women with the educational attainment of less than high school are most likely to be married with 100.0% of them married at childbirth, while women with the educational attainment of high school diploma are least likely to be married with 77.8% of them unmarried at childbirth.
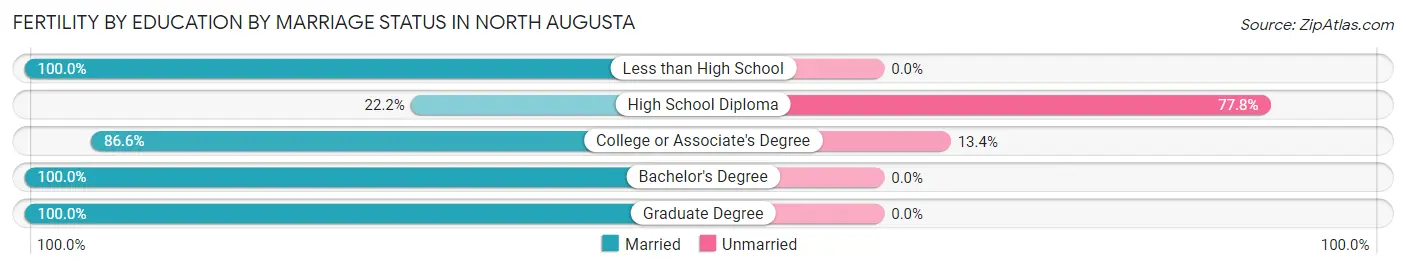
| Educational Attainment | Married | Unmarried |
| Less than High School | 22 (100.0%) | 0 (0.0%) |
| High School Diploma | 20 (22.2%) | 70 (77.8%) |
| College or Associate's Degree | 97 (86.6%) | 15 (13.4%) |
| Bachelor's Degree | 63 (100.0%) | 0 (0.0%) |
| Graduate Degree | 37 (100.0%) | 0 (0.0%) |
| Total | 239 (73.8%) | 85 (26.2%) |
Employment Characteristics in North Augusta
Employment by Class of Employer in North Augusta
Among the 12,619 employed individuals in North Augusta, private company employees (7,951 | 63.0%), federal government employees (1,200 | 9.5%), and not-for-profit organizations (880 | 7.0%) make up the most common classes of employment.
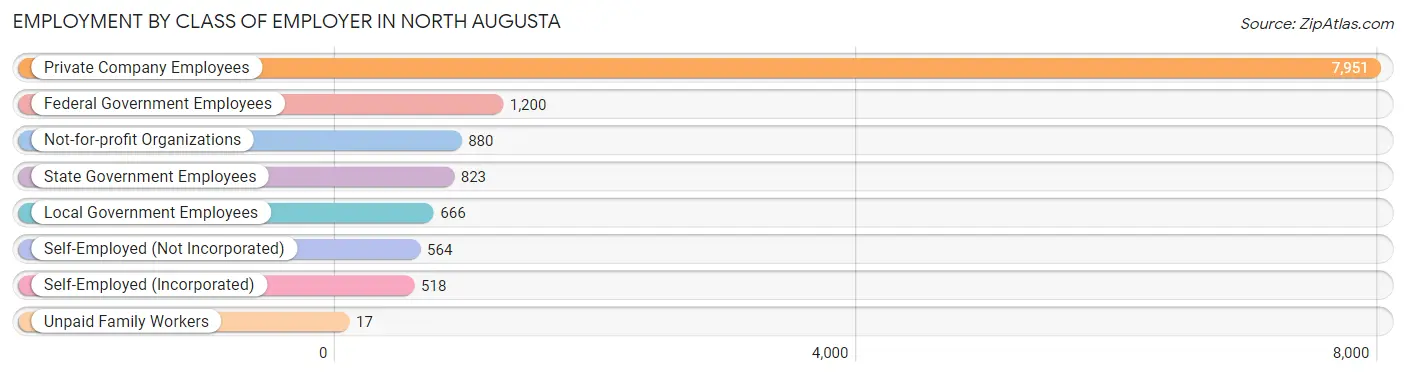
| Employer Class | # Employees | % Employees |
| Private Company Employees | 7,951 | 63.0% |
| Self-Employed (Incorporated) | 518 | 4.1% |
| Self-Employed (Not Incorporated) | 564 | 4.5% |
| Not-for-profit Organizations | 880 | 7.0% |
| Local Government Employees | 666 | 5.3% |
| State Government Employees | 823 | 6.5% |
| Federal Government Employees | 1,200 | 9.5% |
| Unpaid Family Workers | 17 | 0.1% |
| Total | 12,619 | 100.0% |
Employment Status by Age in North Augusta
According to the labor force statistics for North Augusta, out of the total population over 16 years of age (20,479), 64.9% or 13,291 individuals are in the labor force, with 3.8% or 505 of them unemployed. The age group with the highest labor force participation rate is 30 to 34 years, with 94.7% or 2,252 individuals in the labor force. Within the labor force, the 30 to 34 years age range has the highest percentage of unemployed individuals, with 12.3% or 277 of them being unemployed.
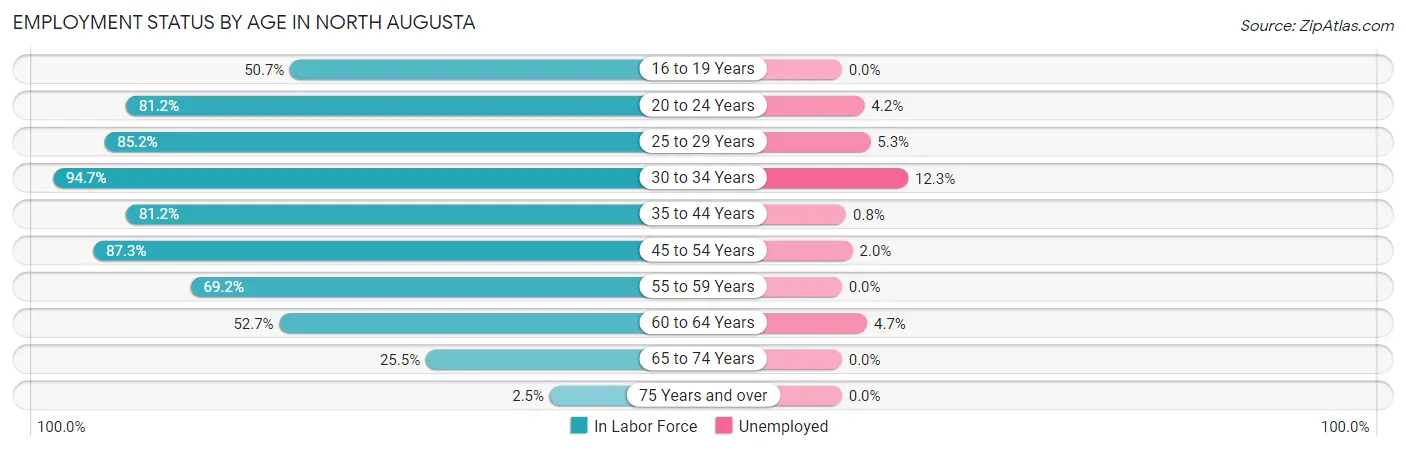
| Age Bracket | In Labor Force | Unemployed |
| 16 to 19 Years | 388 (50.7%) | 0 (0.0%) |
| 20 to 24 Years | 674 (81.2%) | 28 (4.2%) |
| 25 to 29 Years | 1,316 (85.2%) | 70 (5.3%) |
| 30 to 34 Years | 2,252 (94.7%) | 277 (12.3%) |
| 35 to 44 Years | 2,607 (81.2%) | 21 (0.8%) |
| 45 to 54 Years | 2,980 (87.3%) | 60 (2.0%) |
| 55 to 59 Years | 1,195 (69.2%) | 0 (0.0%) |
| 60 to 64 Years | 1,075 (52.7%) | 51 (4.7%) |
| 65 to 74 Years | 762 (25.5%) | 0 (0.0%) |
| 75 Years and over | 40 (2.5%) | 0 (0.0%) |
| Total | 13,291 (64.9%) | 505 (3.8%) |
Employment Status by Educational Attainment in North Augusta
According to labor force statistics for North Augusta, 79.8% of individuals (11,423) out of the total population between 25 and 64 years of age (14,315) are in the labor force, with 4.1% or 468 of them being unemployed. The group with the highest labor force participation rate are those with the educational attainment of bachelor's degree or higher, with 87.9% or 4,877 individuals in the labor force. Within the labor force, individuals with high school diploma education have the highest percentage of unemployment, with 13.0% or 250 of them being unemployed.
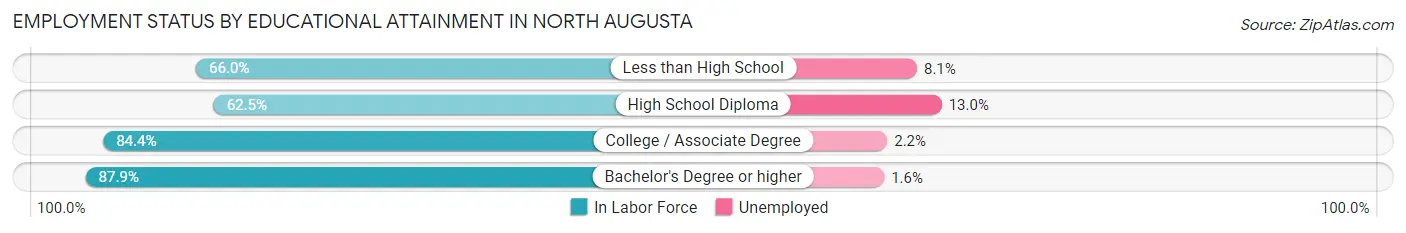
| Educational Attainment | In Labor Force | Unemployed |
| Less than High School | 614 (66.0%) | 75 (8.1%) |
| High School Diploma | 1,924 (62.5%) | 400 (13.0%) |
| College / Associate Degree | 4,017 (84.4%) | 105 (2.2%) |
| Bachelor's Degree or higher | 4,877 (87.9%) | 89 (1.6%) |
| Total | 11,423 (79.8%) | 587 (4.1%) |
Employment Occupations by Sex in North Augusta
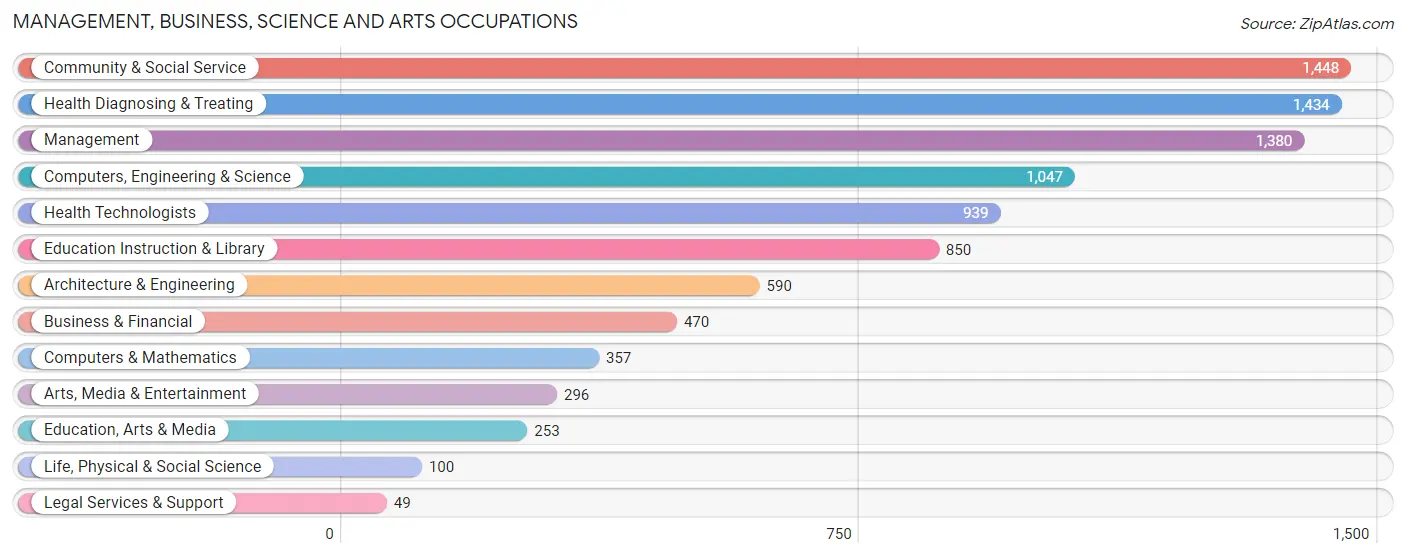
Management, Business, Science and Arts Occupations
The most common Management, Business, Science and Arts occupations in North Augusta are Community & Social Service (1,448 | 11.5%), Health Diagnosing & Treating (1,434 | 11.4%), Management (1,380 | 11.0%), Computers, Engineering & Science (1,047 | 8.3%), and Health Technologists (939 | 7.5%).
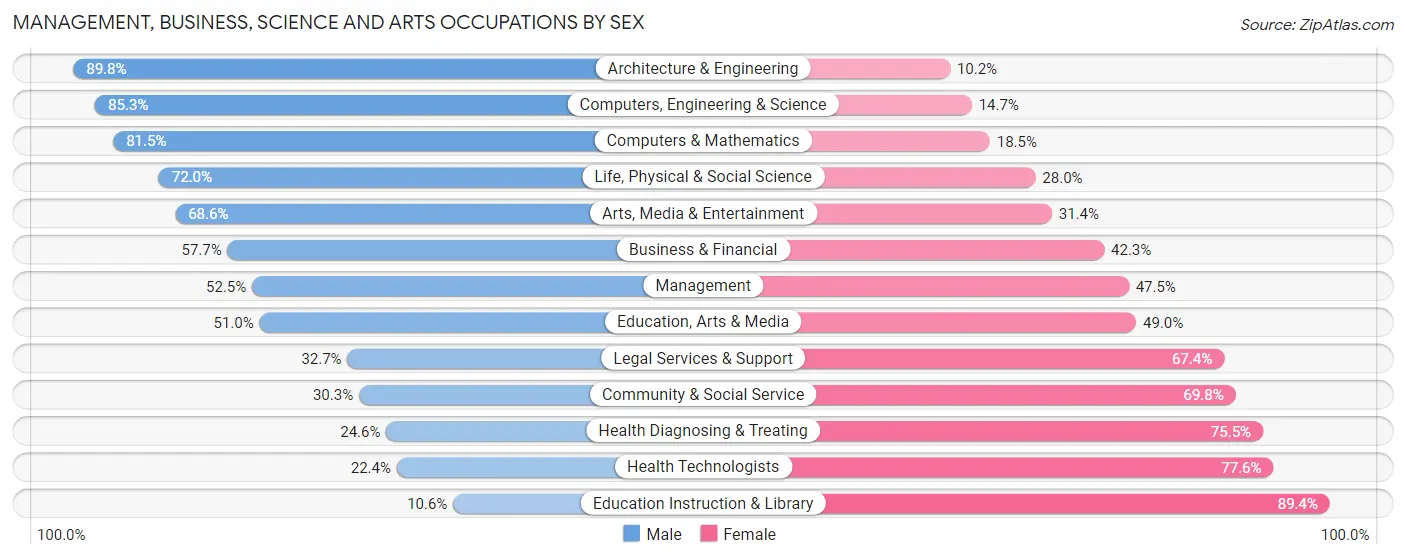
Management, Business, Science and Arts Occupations by Sex
Within the Management, Business, Science and Arts occupations in North Augusta, the most male-oriented occupations are Architecture & Engineering (89.8%), Computers, Engineering & Science (85.3%), and Computers & Mathematics (81.5%), while the most female-oriented occupations are Education Instruction & Library (89.4%), Health Technologists (77.6%), and Health Diagnosing & Treating (75.4%).
| Occupation | Male | Female |
| Management | 725 (52.5%) | 655 (47.5%) |
| Business & Financial | 271 (57.7%) | 199 (42.3%) |
| Computers, Engineering & Science | 893 (85.3%) | 154 (14.7%) |
| Computers & Mathematics | 291 (81.5%) | 66 (18.5%) |
| Architecture & Engineering | 530 (89.8%) | 60 (10.2%) |
| Life, Physical & Social Science | 72 (72.0%) | 28 (28.0%) |
| Community & Social Service | 438 (30.2%) | 1,010 (69.8%) |
| Education, Arts & Media | 129 (51.0%) | 124 (49.0%) |
| Legal Services & Support | 16 (32.7%) | 33 (67.3%) |
| Education Instruction & Library | 90 (10.6%) | 760 (89.4%) |
| Arts, Media & Entertainment | 203 (68.6%) | 93 (31.4%) |
| Health Diagnosing & Treating | 352 (24.5%) | 1,082 (75.4%) |
| Health Technologists | 210 (22.4%) | 729 (77.6%) |
| Total (Category) | 2,679 (46.4%) | 3,100 (53.6%) |
| Total (Overall) | 6,396 (50.9%) | 6,164 (49.1%) |
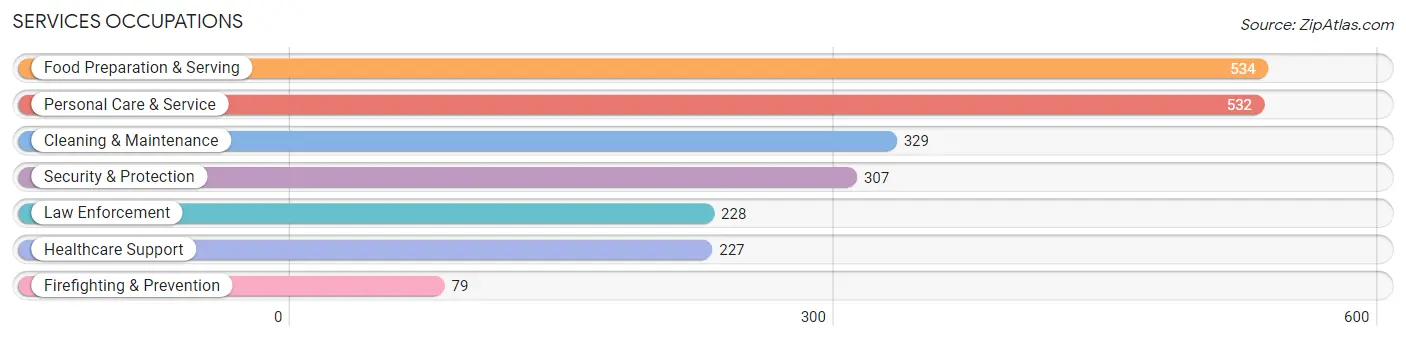
Services Occupations
The most common Services occupations in North Augusta are Food Preparation & Serving (534 | 4.3%), Personal Care & Service (532 | 4.2%), Cleaning & Maintenance (329 | 2.6%), Security & Protection (307 | 2.4%), and Law Enforcement (228 | 1.8%).
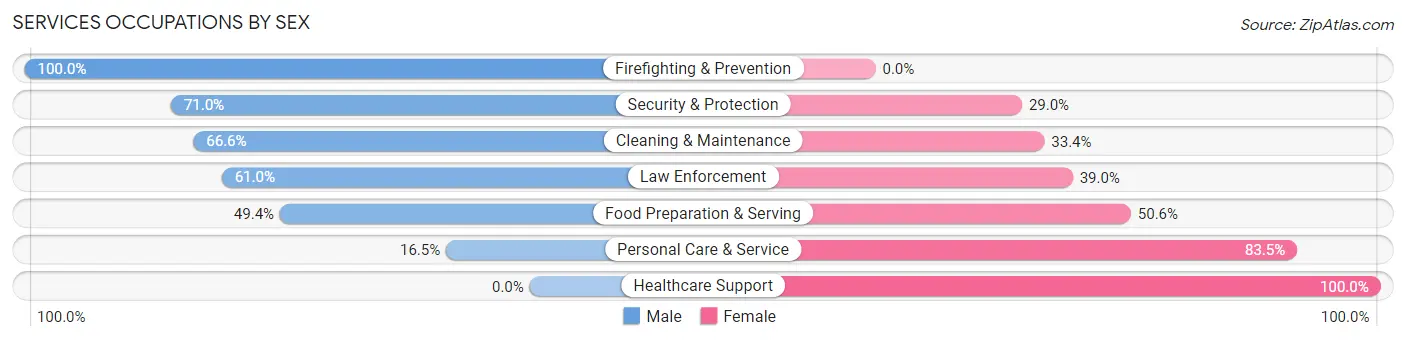
Services Occupations by Sex
Within the Services occupations in North Augusta, the most male-oriented occupations are Firefighting & Prevention (100.0%), Security & Protection (71.0%), and Cleaning & Maintenance (66.6%), while the most female-oriented occupations are Healthcare Support (100.0%), Personal Care & Service (83.5%), and Food Preparation & Serving (50.6%).
| Occupation | Male | Female |
| Healthcare Support | 0 (0.0%) | 227 (100.0%) |
| Security & Protection | 218 (71.0%) | 89 (29.0%) |
| Firefighting & Prevention | 79 (100.0%) | 0 (0.0%) |
| Law Enforcement | 139 (61.0%) | 89 (39.0%) |
| Food Preparation & Serving | 264 (49.4%) | 270 (50.6%) |
| Cleaning & Maintenance | 219 (66.6%) | 110 (33.4%) |
| Personal Care & Service | 88 (16.5%) | 444 (83.5%) |
| Total (Category) | 789 (40.9%) | 1,140 (59.1%) |
| Total (Overall) | 6,396 (50.9%) | 6,164 (49.1%) |
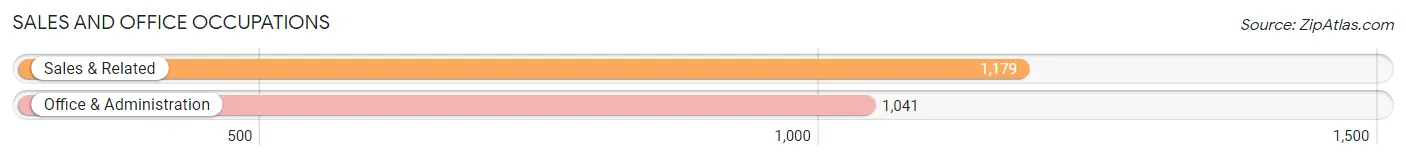
Sales and Office Occupations
The most common Sales and Office occupations in North Augusta are Sales & Related (1,179 | 9.4%), and Office & Administration (1,041 | 8.3%).
Sales and Office Occupations by Sex
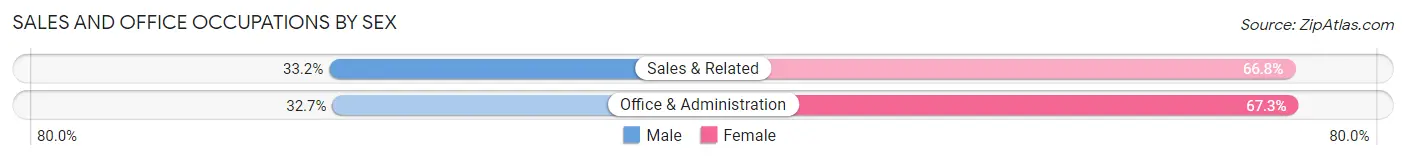
| Occupation | Male | Female |
| Sales & Related | 391 (33.2%) | 788 (66.8%) |
| Office & Administration | 340 (32.7%) | 701 (67.3%) |
| Total (Category) | 731 (32.9%) | 1,489 (67.1%) |
| Total (Overall) | 6,396 (50.9%) | 6,164 (49.1%) |
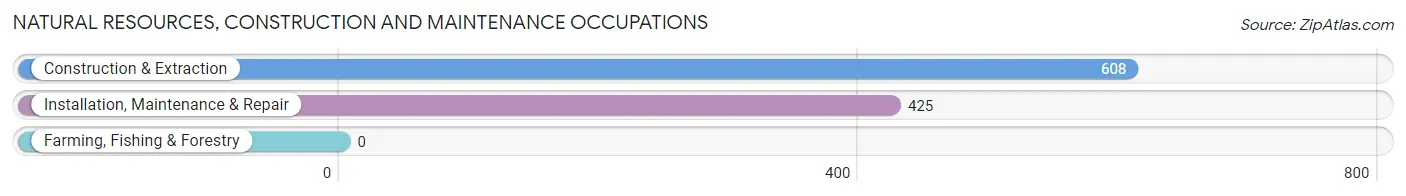
Natural Resources, Construction and Maintenance Occupations
The most common Natural Resources, Construction and Maintenance occupations in North Augusta are Construction & Extraction (608 | 4.8%), and Installation, Maintenance & Repair (425 | 3.4%).
Natural Resources, Construction and Maintenance Occupations by Sex
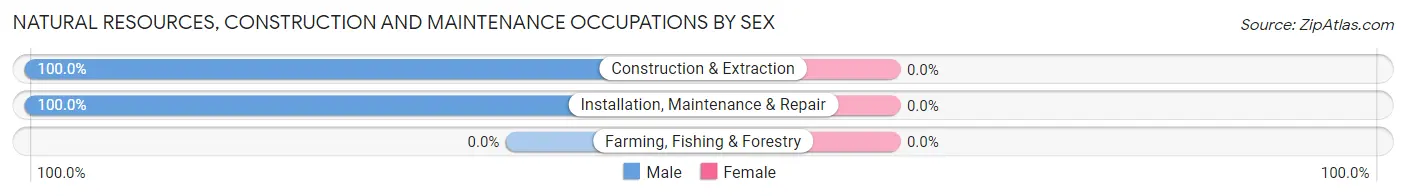
| Occupation | Male | Female |
| Farming, Fishing & Forestry | 0 (0.0%) | 0 (0.0%) |
| Construction & Extraction | 608 (100.0%) | 0 (0.0%) |
| Installation, Maintenance & Repair | 425 (100.0%) | 0 (0.0%) |
| Total (Category) | 1,033 (100.0%) | 0 (0.0%) |
| Total (Overall) | 6,396 (50.9%) | 6,164 (49.1%) |
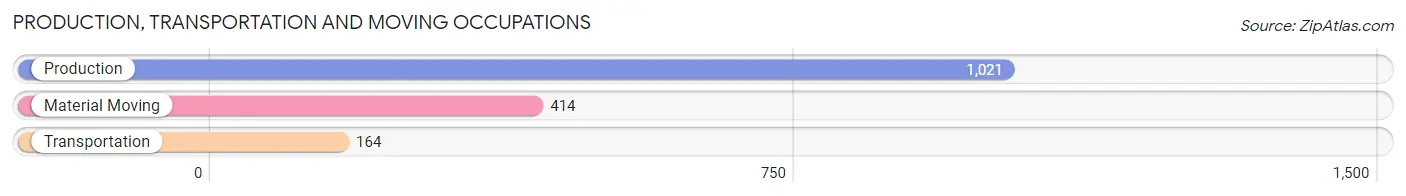
Production, Transportation and Moving Occupations
The most common Production, Transportation and Moving occupations in North Augusta are Production (1,021 | 8.1%), Material Moving (414 | 3.3%), and Transportation (164 | 1.3%).
Production, Transportation and Moving Occupations by Sex
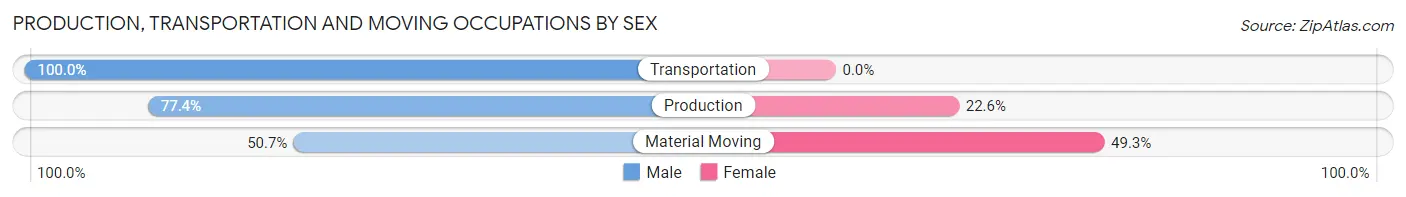
| Occupation | Male | Female |
| Production | 790 (77.4%) | 231 (22.6%) |
| Transportation | 164 (100.0%) | 0 (0.0%) |
| Material Moving | 210 (50.7%) | 204 (49.3%) |
| Total (Category) | 1,164 (72.8%) | 435 (27.2%) |
| Total (Overall) | 6,396 (50.9%) | 6,164 (49.1%) |
Employment Industries by Sex in North Augusta
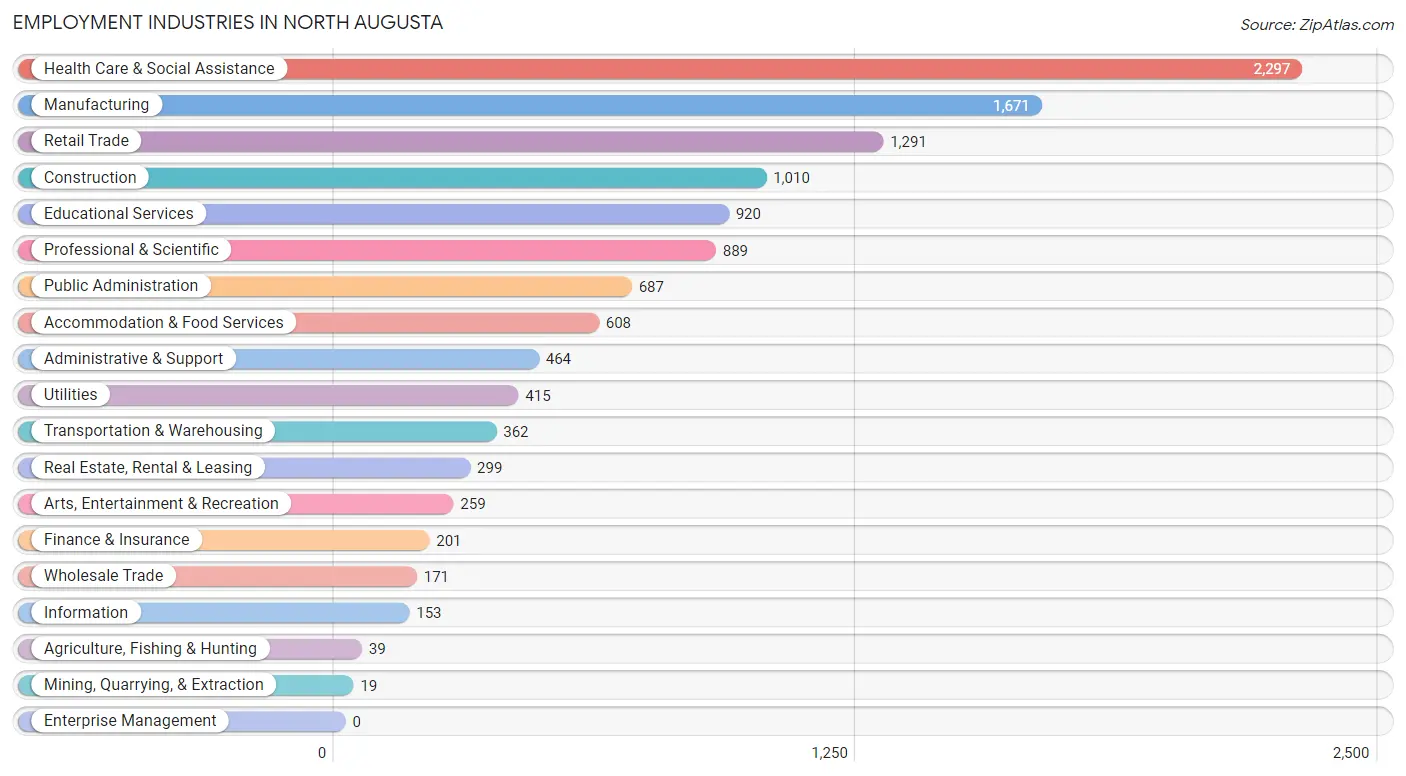
Employment Industries in North Augusta
The major employment industries in North Augusta include Health Care & Social Assistance (2,297 | 18.3%), Manufacturing (1,671 | 13.3%), Retail Trade (1,291 | 10.3%), Construction (1,010 | 8.0%), and Educational Services (920 | 7.3%).
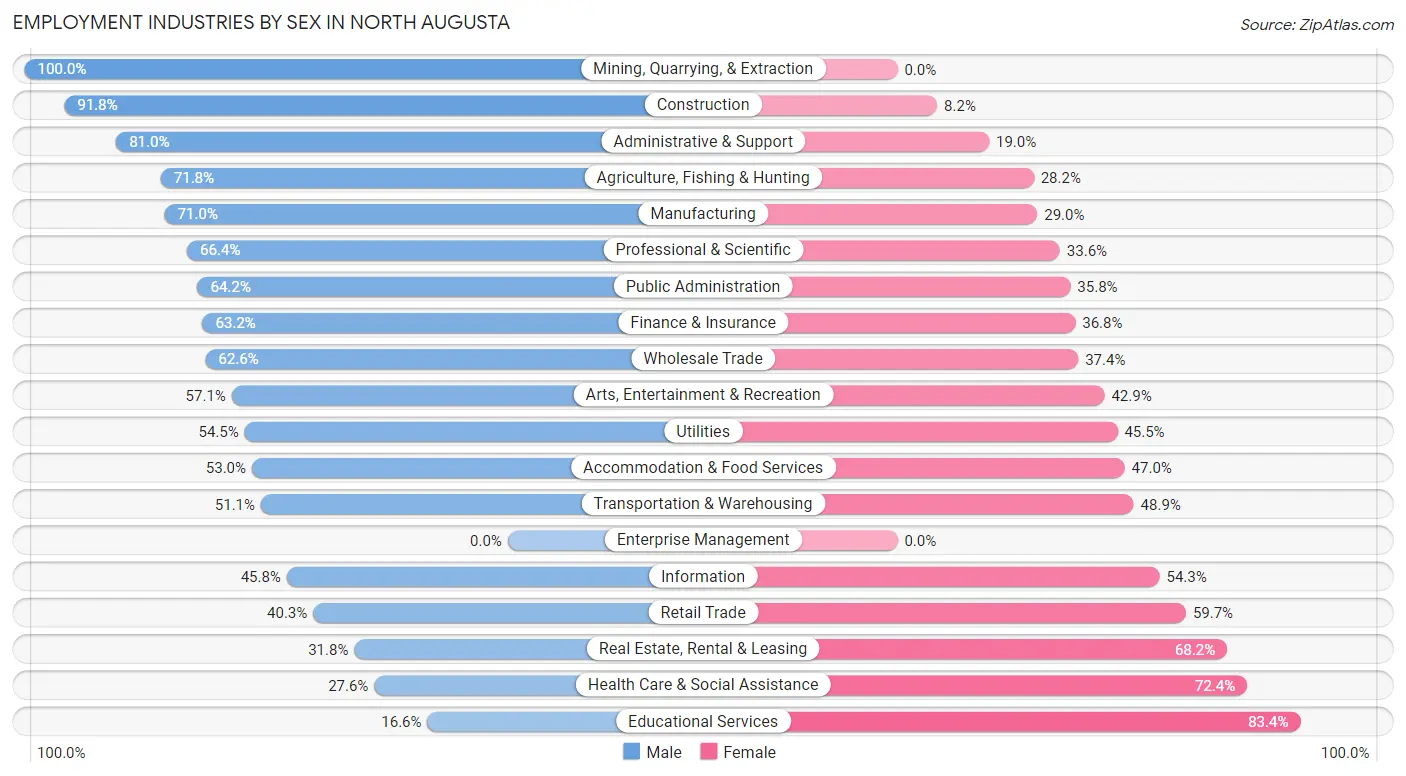
Employment Industries by Sex in North Augusta
The North Augusta industries that see more men than women are Mining, Quarrying, & Extraction (100.0%), Construction (91.8%), and Administrative & Support (81.0%), whereas the industries that tend to have a higher number of women are Educational Services (83.4%), Health Care & Social Assistance (72.4%), and Real Estate, Rental & Leasing (68.2%).
| Industry | Male | Female |
| Agriculture, Fishing & Hunting | 28 (71.8%) | 11 (28.2%) |
| Mining, Quarrying, & Extraction | 19 (100.0%) | 0 (0.0%) |
| Construction | 927 (91.8%) | 83 (8.2%) |
| Manufacturing | 1,187 (71.0%) | 484 (29.0%) |
| Wholesale Trade | 107 (62.6%) | 64 (37.4%) |
| Retail Trade | 520 (40.3%) | 771 (59.7%) |
| Transportation & Warehousing | 185 (51.1%) | 177 (48.9%) |
| Utilities | 226 (54.5%) | 189 (45.5%) |
| Information | 70 (45.8%) | 83 (54.2%) |
| Finance & Insurance | 127 (63.2%) | 74 (36.8%) |
| Real Estate, Rental & Leasing | 95 (31.8%) | 204 (68.2%) |
| Professional & Scientific | 590 (66.4%) | 299 (33.6%) |
| Enterprise Management | 0 (0.0%) | 0 (0.0%) |
| Administrative & Support | 376 (81.0%) | 88 (19.0%) |
| Educational Services | 153 (16.6%) | 767 (83.4%) |
| Health Care & Social Assistance | 635 (27.6%) | 1,662 (72.4%) |
| Arts, Entertainment & Recreation | 148 (57.1%) | 111 (42.9%) |
| Accommodation & Food Services | 322 (53.0%) | 286 (47.0%) |
| Public Administration | 441 (64.2%) | 246 (35.8%) |
| Total | 6,396 (50.9%) | 6,164 (49.1%) |
Education in North Augusta
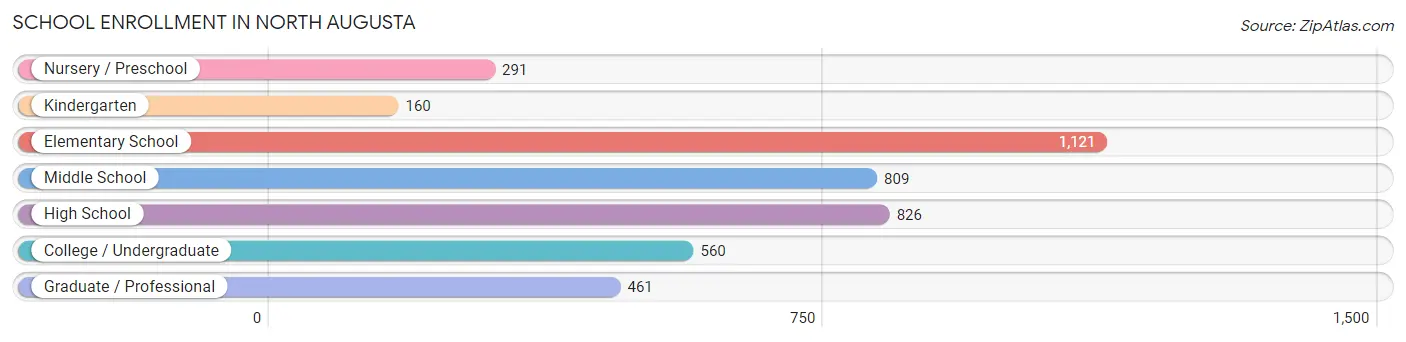
School Enrollment in North Augusta
The most common levels of schooling among the 4,228 students in North Augusta are elementary school (1,121 | 26.5%), high school (826 | 19.5%), and middle school (809 | 19.1%).
| School Level | # Students | % Students |
| Nursery / Preschool | 291 | 6.9% |
| Kindergarten | 160 | 3.8% |
| Elementary School | 1,121 | 26.5% |
| Middle School | 809 | 19.1% |
| High School | 826 | 19.5% |
| College / Undergraduate | 560 | 13.3% |
| Graduate / Professional | 461 | 10.9% |
| Total | 4,228 | 100.0% |
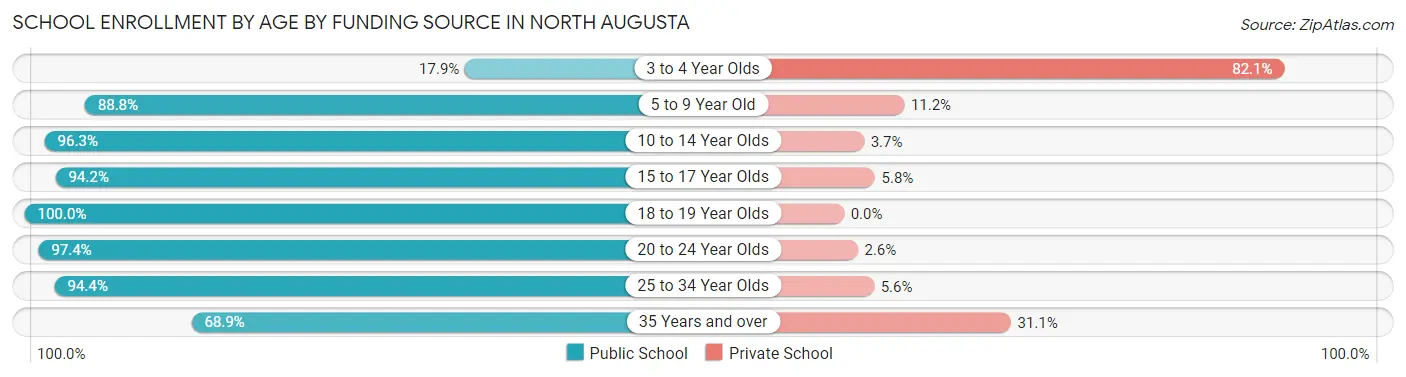
School Enrollment by Age by Funding Source in North Augusta
Out of a total of 4,228 students who are enrolled in schools in North Augusta, 571 (13.5%) attend a private institution, while the remaining 3,657 (86.5%) are enrolled in public schools. The age group of 3 to 4 year olds has the highest likelihood of being enrolled in private schools, with 215 (82.1% in the age bracket) enrolled. Conversely, the age group of 18 to 19 year olds has the lowest likelihood of being enrolled in a private school, with 76 (100.0% in the age bracket) attending a public institution.
| Age Bracket | Public School | Private School |
| 3 to 4 Year Olds | 47 (17.9%) | 215 (82.1%) |
| 5 to 9 Year Old | 1,130 (88.8%) | 143 (11.2%) |
| 10 to 14 Year Olds | 954 (96.3%) | 37 (3.7%) |
| 15 to 17 Year Olds | 605 (94.2%) | 37 (5.8%) |
| 18 to 19 Year Olds | 76 (100.0%) | 0 (0.0%) |
| 20 to 24 Year Olds | 302 (97.4%) | 8 (2.6%) |
| 25 to 34 Year Olds | 287 (94.4%) | 17 (5.6%) |
| 35 Years and over | 255 (68.9%) | 115 (31.1%) |
| Total | 3,657 (86.5%) | 571 (13.5%) |
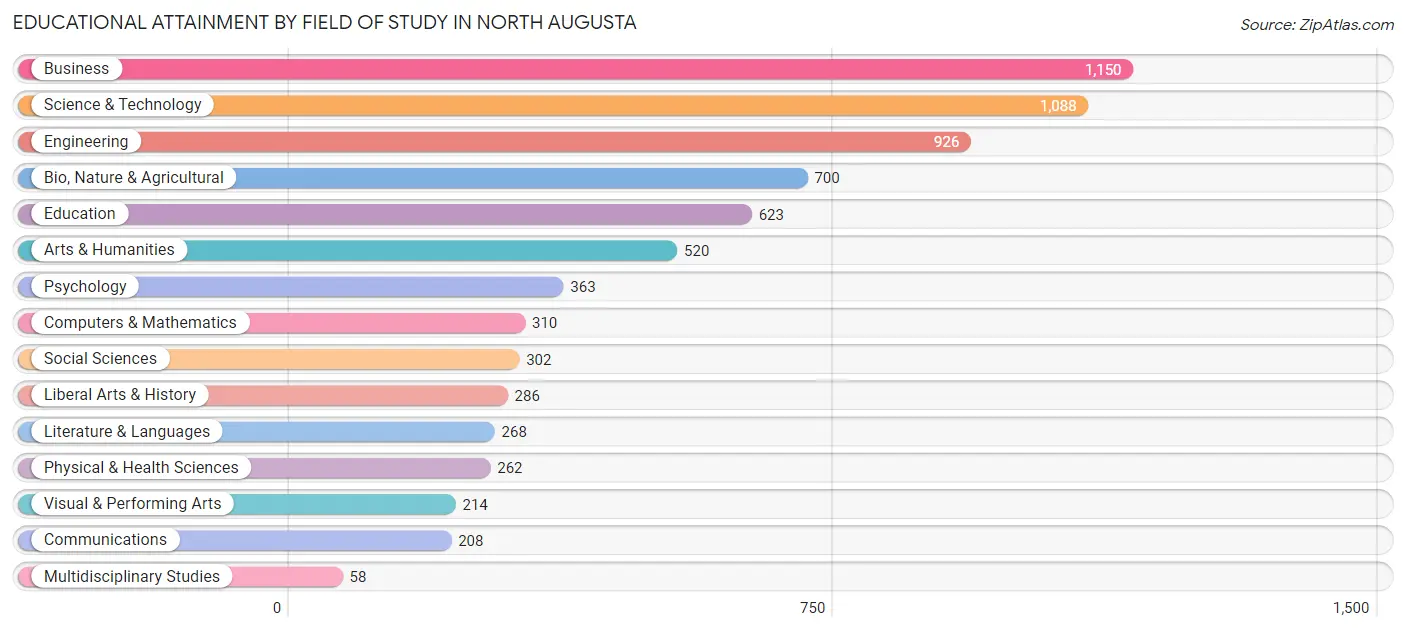
Educational Attainment by Field of Study in North Augusta
Business (1,150 | 15.8%), science & technology (1,088 | 14.9%), engineering (926 | 12.7%), bio, nature & agricultural (700 | 9.6%), and education (623 | 8.6%) are the most common fields of study among 7,278 individuals in North Augusta who have obtained a bachelor's degree or higher.
| Field of Study | # Graduates | % Graduates |
| Computers & Mathematics | 310 | 4.3% |
| Bio, Nature & Agricultural | 700 | 9.6% |
| Physical & Health Sciences | 262 | 3.6% |
| Psychology | 363 | 5.0% |
| Social Sciences | 302 | 4.2% |
| Engineering | 926 | 12.7% |
| Multidisciplinary Studies | 58 | 0.8% |
| Science & Technology | 1,088 | 14.9% |
| Business | 1,150 | 15.8% |
| Education | 623 | 8.6% |
| Literature & Languages | 268 | 3.7% |
| Liberal Arts & History | 286 | 3.9% |
| Visual & Performing Arts | 214 | 2.9% |
| Communications | 208 | 2.9% |
| Arts & Humanities | 520 | 7.1% |
| Total | 7,278 | 100.0% |
Transportation & Commute in North Augusta
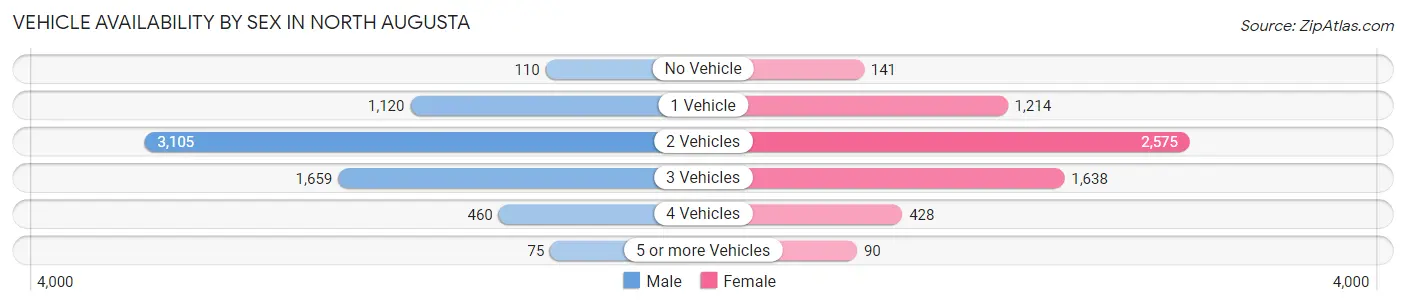
Vehicle Availability by Sex in North Augusta
The most prevalent vehicle ownership categories in North Augusta are males with 2 vehicles (3,105, accounting for 47.6%) and females with 2 vehicles (2,575, making up 51.0%).
| Vehicles Available | Male | Female |
| No Vehicle | 110 (1.7%) | 141 (2.3%) |
| 1 Vehicle | 1,120 (17.2%) | 1,214 (20.0%) |
| 2 Vehicles | 3,105 (47.6%) | 2,575 (42.3%) |
| 3 Vehicles | 1,659 (25.4%) | 1,638 (26.9%) |
| 4 Vehicles | 460 (7.0%) | 428 (7.0%) |
| 5 or more Vehicles | 75 (1.1%) | 90 (1.5%) |
| Total | 6,529 (100.0%) | 6,086 (100.0%) |
Commute Time in North Augusta
The most frequently occuring commute durations in North Augusta are 15 to 19 minutes (2,732 commuters, 23.1%), 10 to 14 minutes (2,239 commuters, 19.0%), and 20 to 24 minutes (1,707 commuters, 14.5%).
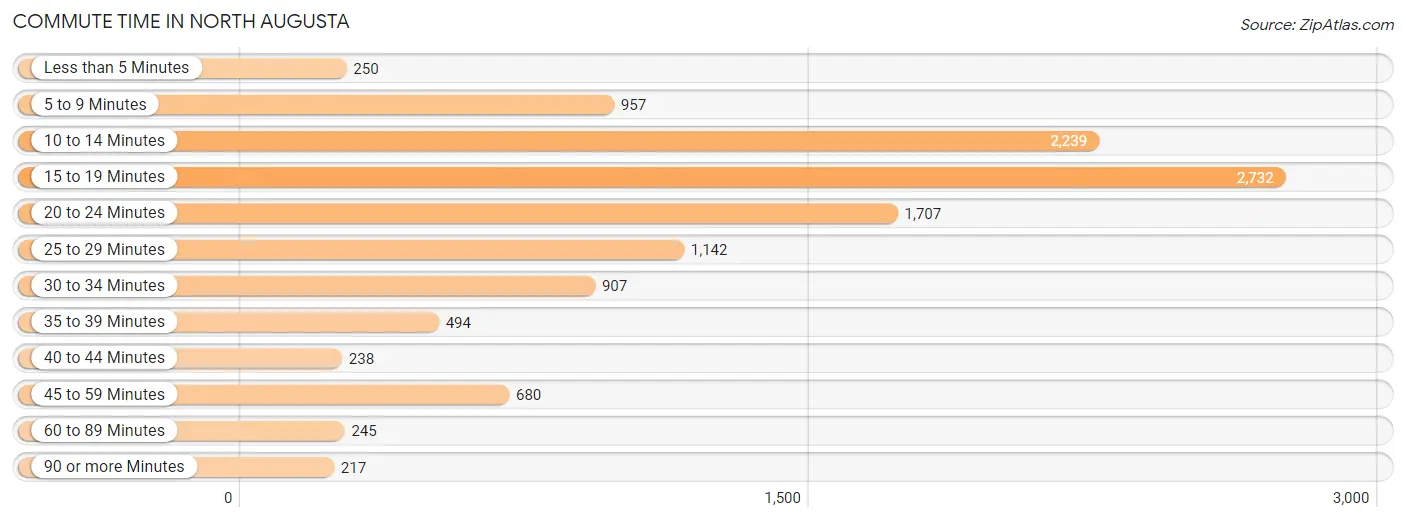
| Commute Time | # Commuters | % Commuters |
| Less than 5 Minutes | 250 | 2.1% |
| 5 to 9 Minutes | 957 | 8.1% |
| 10 to 14 Minutes | 2,239 | 19.0% |
| 15 to 19 Minutes | 2,732 | 23.1% |
| 20 to 24 Minutes | 1,707 | 14.5% |
| 25 to 29 Minutes | 1,142 | 9.7% |
| 30 to 34 Minutes | 907 | 7.7% |
| 35 to 39 Minutes | 494 | 4.2% |
| 40 to 44 Minutes | 238 | 2.0% |
| 45 to 59 Minutes | 680 | 5.8% |
| 60 to 89 Minutes | 245 | 2.1% |
| 90 or more Minutes | 217 | 1.8% |
Commute Time by Sex in North Augusta
The most common commute times in North Augusta are 15 to 19 minutes (1,499 commuters, 24.4%) for males and 15 to 19 minutes (1,233 commuters, 21.7%) for females.
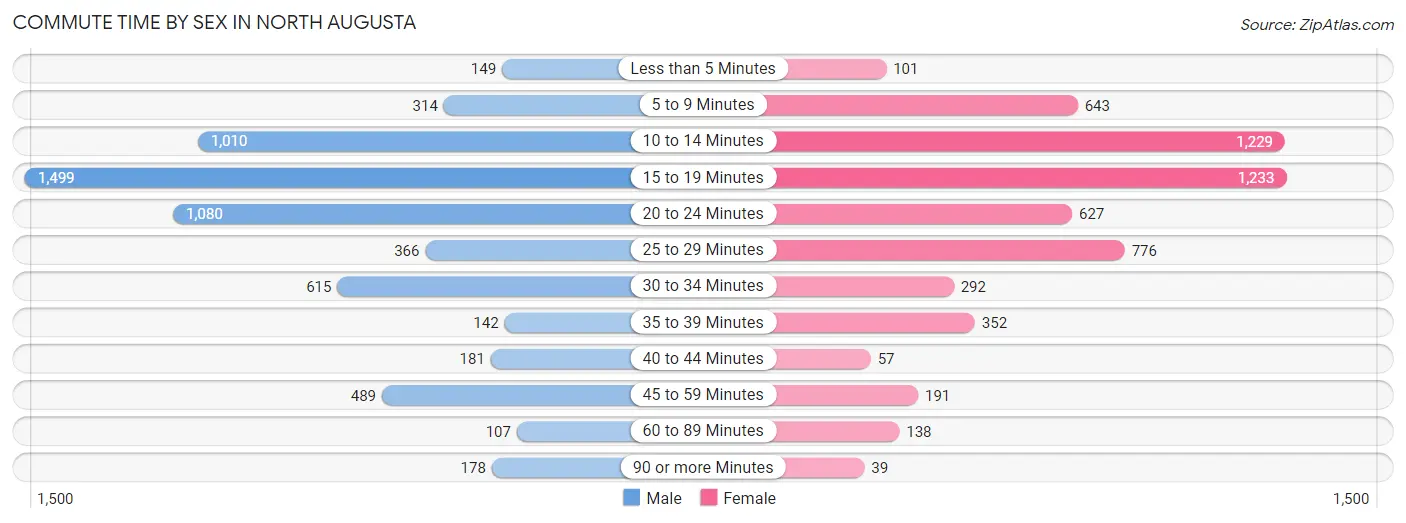
| Commute Time | Male | Female |
| Less than 5 Minutes | 149 (2.4%) | 101 (1.8%) |
| 5 to 9 Minutes | 314 (5.1%) | 643 (11.3%) |
| 10 to 14 Minutes | 1,010 (16.5%) | 1,229 (21.6%) |
| 15 to 19 Minutes | 1,499 (24.4%) | 1,233 (21.7%) |
| 20 to 24 Minutes | 1,080 (17.6%) | 627 (11.0%) |
| 25 to 29 Minutes | 366 (6.0%) | 776 (13.7%) |
| 30 to 34 Minutes | 615 (10.0%) | 292 (5.1%) |
| 35 to 39 Minutes | 142 (2.3%) | 352 (6.2%) |
| 40 to 44 Minutes | 181 (2.9%) | 57 (1.0%) |
| 45 to 59 Minutes | 489 (8.0%) | 191 (3.4%) |
| 60 to 89 Minutes | 107 (1.8%) | 138 (2.4%) |
| 90 or more Minutes | 178 (2.9%) | 39 (0.7%) |
Time of Departure to Work by Sex in North Augusta
The most frequent times of departure to work in North Augusta are 7:30 AM to 7:59 AM (822, 13.4%) for males and 7:30 AM to 7:59 AM (990, 17.4%) for females.
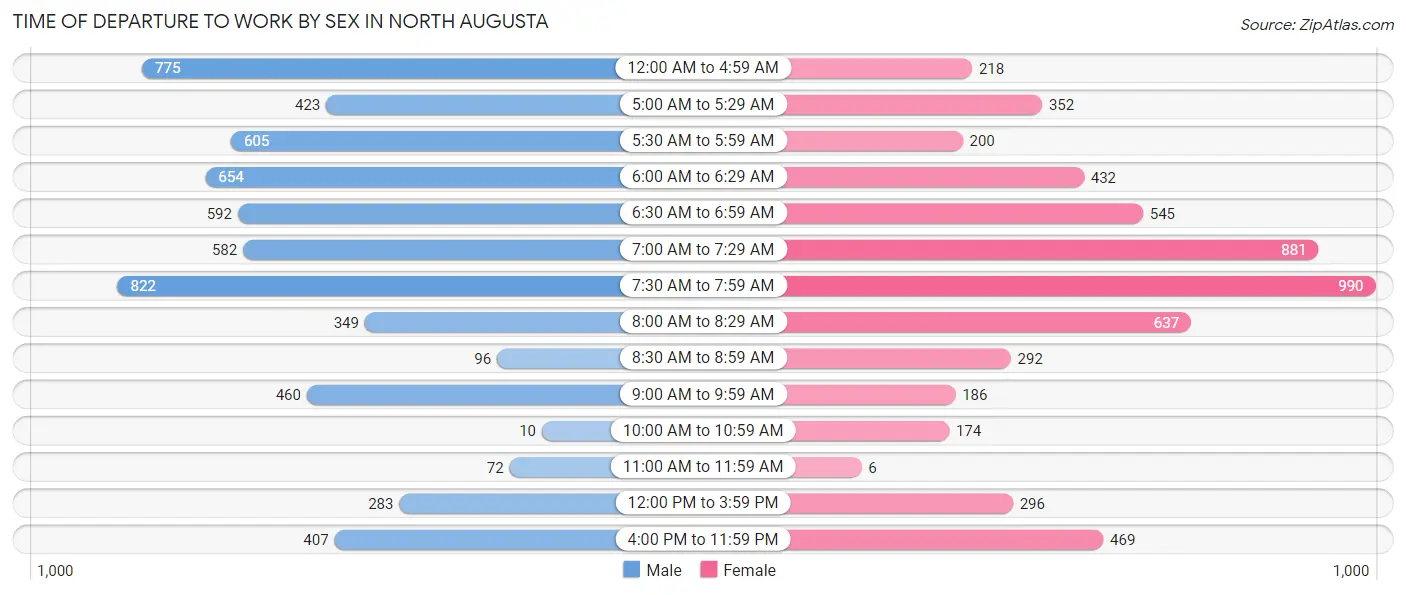
| Time of Departure | Male | Female |
| 12:00 AM to 4:59 AM | 775 (12.6%) | 218 (3.8%) |
| 5:00 AM to 5:29 AM | 423 (6.9%) | 352 (6.2%) |
| 5:30 AM to 5:59 AM | 605 (9.9%) | 200 (3.5%) |
| 6:00 AM to 6:29 AM | 654 (10.7%) | 432 (7.6%) |
| 6:30 AM to 6:59 AM | 592 (9.7%) | 545 (9.6%) |
| 7:00 AM to 7:29 AM | 582 (9.5%) | 881 (15.5%) |
| 7:30 AM to 7:59 AM | 822 (13.4%) | 990 (17.4%) |
| 8:00 AM to 8:29 AM | 349 (5.7%) | 637 (11.2%) |
| 8:30 AM to 8:59 AM | 96 (1.6%) | 292 (5.1%) |
| 9:00 AM to 9:59 AM | 460 (7.5%) | 186 (3.3%) |
| 10:00 AM to 10:59 AM | 10 (0.2%) | 174 (3.1%) |
| 11:00 AM to 11:59 AM | 72 (1.2%) | 6 (0.1%) |
| 12:00 PM to 3:59 PM | 283 (4.6%) | 296 (5.2%) |
| 4:00 PM to 11:59 PM | 407 (6.6%) | 469 (8.3%) |
| Total | 6,130 (100.0%) | 5,678 (100.0%) |
Housing Occupancy in North Augusta
Occupancy by Ownership in North Augusta
Of the total 10,875 dwellings in North Augusta, owner-occupied units account for 7,732 (71.1%), while renter-occupied units make up 3,143 (28.9%).
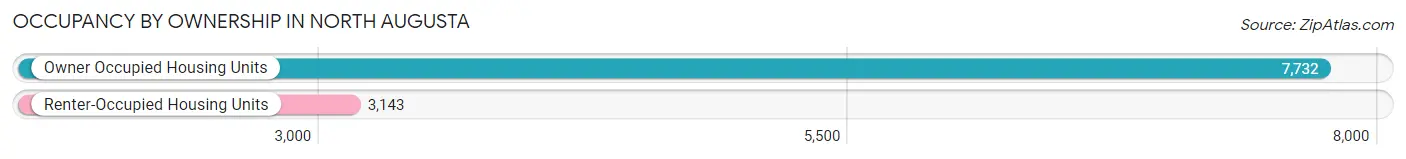
| Occupancy | # Housing Units | % Housing Units |
| Owner Occupied Housing Units | 7,732 | 71.1% |
| Renter-Occupied Housing Units | 3,143 | 28.9% |
| Total Occupied Housing Units | 10,875 | 100.0% |
Occupancy by Household Size in North Augusta
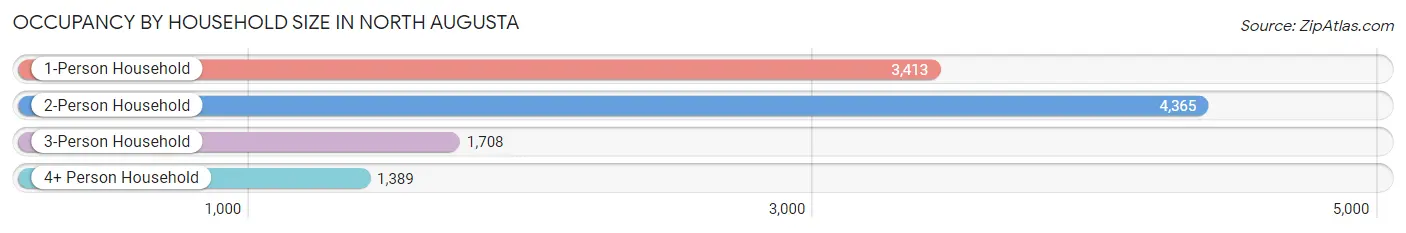
| Household Size | # Housing Units | % Housing Units |
| 1-Person Household | 3,413 | 31.4% |
| 2-Person Household | 4,365 | 40.1% |
| 3-Person Household | 1,708 | 15.7% |
| 4+ Person Household | 1,389 | 12.8% |
| Total Housing Units | 10,875 | 100.0% |
Occupancy by Ownership by Household Size in North Augusta
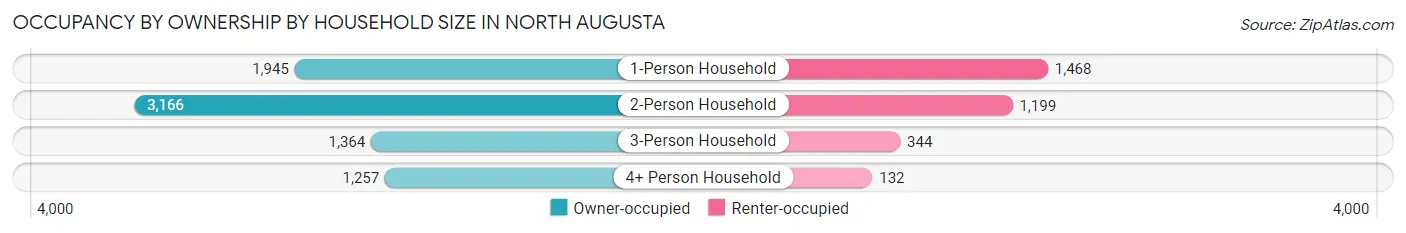
| Household Size | Owner-occupied | Renter-occupied |
| 1-Person Household | 1,945 (57.0%) | 1,468 (43.0%) |
| 2-Person Household | 3,166 (72.5%) | 1,199 (27.5%) |
| 3-Person Household | 1,364 (79.9%) | 344 (20.1%) |
| 4+ Person Household | 1,257 (90.5%) | 132 (9.5%) |
| Total Housing Units | 7,732 (71.1%) | 3,143 (28.9%) |
Occupancy by Educational Attainment in North Augusta
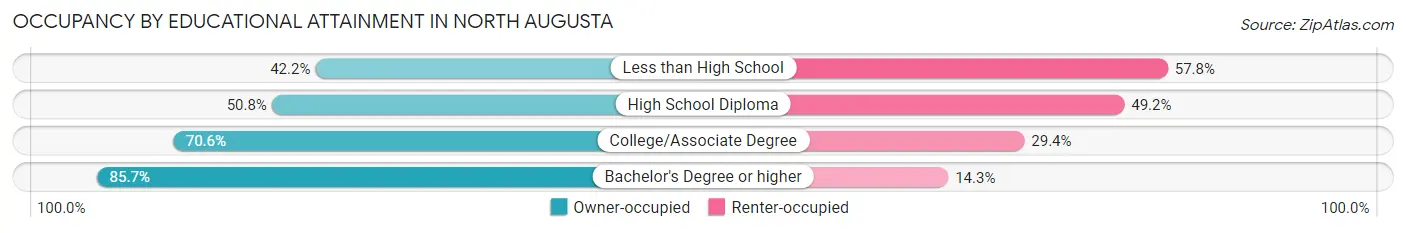
| Household Size | Owner-occupied | Renter-occupied |
| Less than High School | 313 (42.2%) | 429 (57.8%) |
| High School Diploma | 1,004 (50.8%) | 972 (49.2%) |
| College/Associate Degree | 2,697 (70.6%) | 1,122 (29.4%) |
| Bachelor's Degree or higher | 3,718 (85.7%) | 620 (14.3%) |
Occupancy by Age of Householder in North Augusta
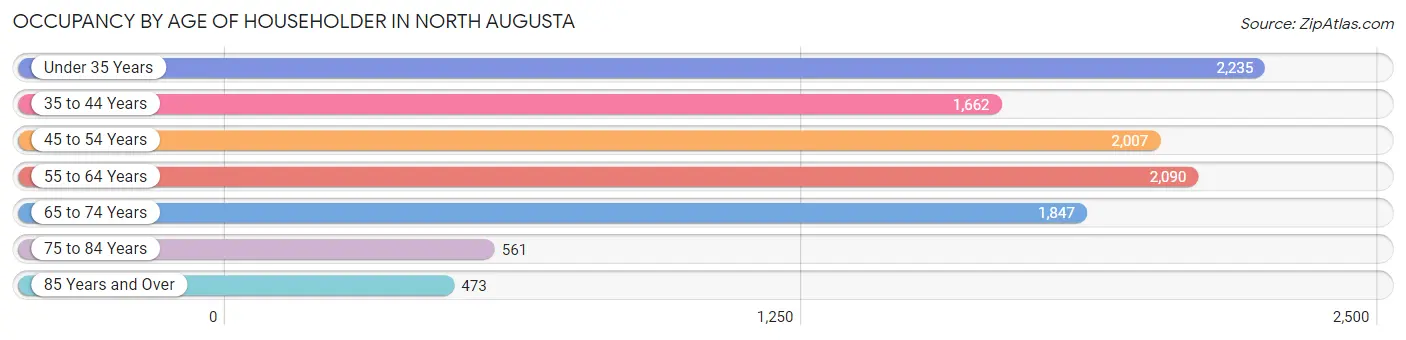
| Age Bracket | # Households | % Households |
| Under 35 Years | 2,235 | 20.5% |
| 35 to 44 Years | 1,662 | 15.3% |
| 45 to 54 Years | 2,007 | 18.5% |
| 55 to 64 Years | 2,090 | 19.2% |
| 65 to 74 Years | 1,847 | 17.0% |
| 75 to 84 Years | 561 | 5.2% |
| 85 Years and Over | 473 | 4.3% |
| Total | 10,875 | 100.0% |
Housing Finances in North Augusta
Median Income by Occupancy in North Augusta
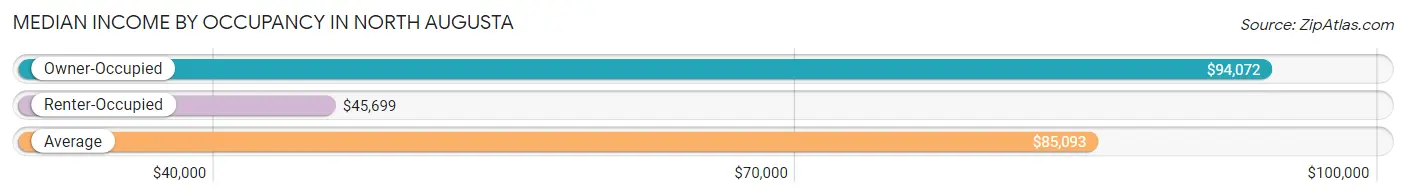
| Occupancy Type | # Households | Median Income |
| Owner-Occupied | 7,732 (71.1%) | $94,072 |
| Renter-Occupied | 3,143 (28.9%) | $45,699 |
| Average | 10,875 (100.0%) | $85,093 |
Occupancy by Householder Income Bracket in North Augusta
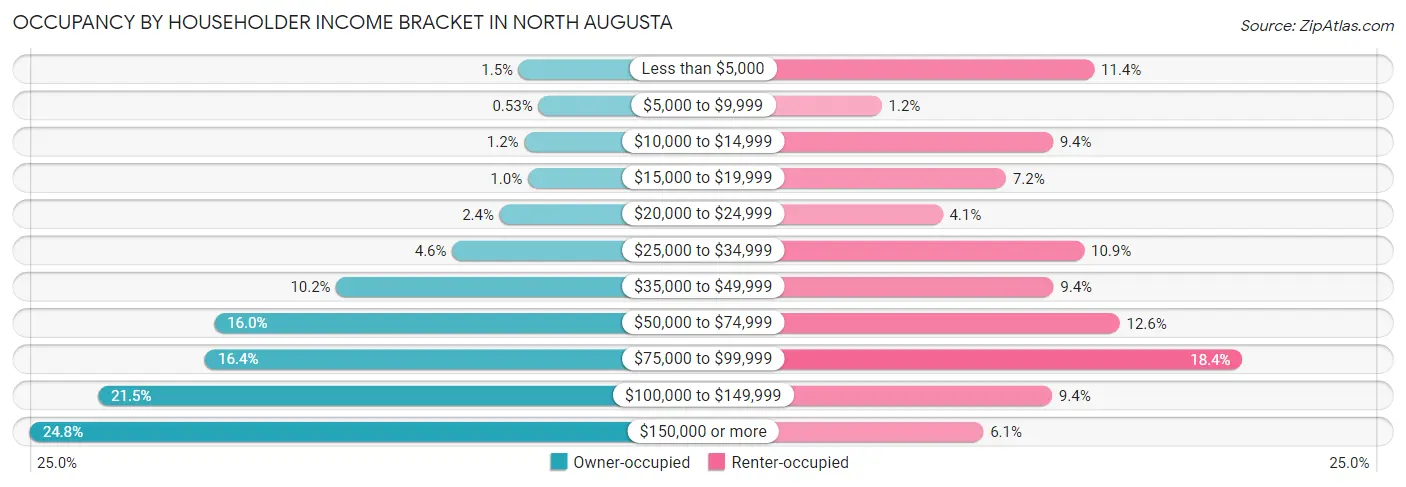
| Income Bracket | Owner-occupied | Renter-occupied |
| Less than $5,000 | 113 (1.5%) | 357 (11.4%) |
| $5,000 to $9,999 | 41 (0.5%) | 39 (1.2%) |
| $10,000 to $14,999 | 93 (1.2%) | 295 (9.4%) |
| $15,000 to $19,999 | 80 (1.0%) | 225 (7.2%) |
| $20,000 to $24,999 | 183 (2.4%) | 130 (4.1%) |
| $25,000 to $34,999 | 358 (4.6%) | 342 (10.9%) |
| $35,000 to $49,999 | 785 (10.2%) | 296 (9.4%) |
| $50,000 to $74,999 | 1,235 (16.0%) | 395 (12.6%) |
| $75,000 to $99,999 | 1,268 (16.4%) | 579 (18.4%) |
| $100,000 to $149,999 | 1,662 (21.5%) | 294 (9.3%) |
| $150,000 or more | 1,914 (24.7%) | 191 (6.1%) |
| Total | 7,732 (100.0%) | 3,143 (100.0%) |
Monthly Housing Cost Tiers in North Augusta
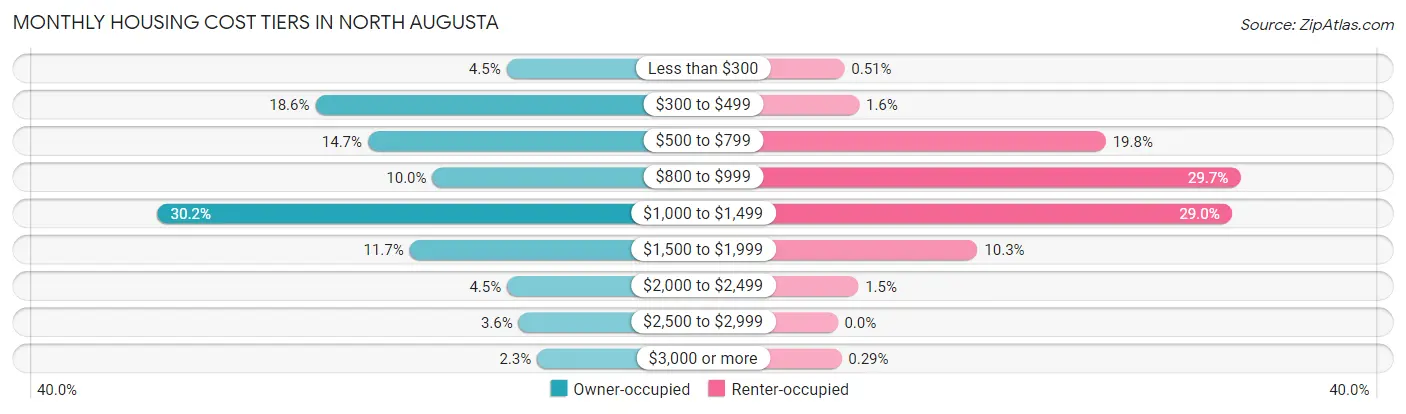
| Monthly Cost | Owner-occupied | Renter-occupied |
| Less than $300 | 349 (4.5%) | 16 (0.5%) |
| $300 to $499 | 1,437 (18.6%) | 50 (1.6%) |
| $500 to $799 | 1,138 (14.7%) | 621 (19.8%) |
| $800 to $999 | 771 (10.0%) | 932 (29.6%) |
| $1,000 to $1,499 | 2,335 (30.2%) | 912 (29.0%) |
| $1,500 to $1,999 | 901 (11.7%) | 324 (10.3%) |
| $2,000 to $2,499 | 346 (4.5%) | 48 (1.5%) |
| $2,500 to $2,999 | 280 (3.6%) | 0 (0.0%) |
| $3,000 or more | 175 (2.3%) | 9 (0.3%) |
| Total | 7,732 (100.0%) | 3,143 (100.0%) |
Physical Housing Characteristics in North Augusta
Housing Structures in North Augusta
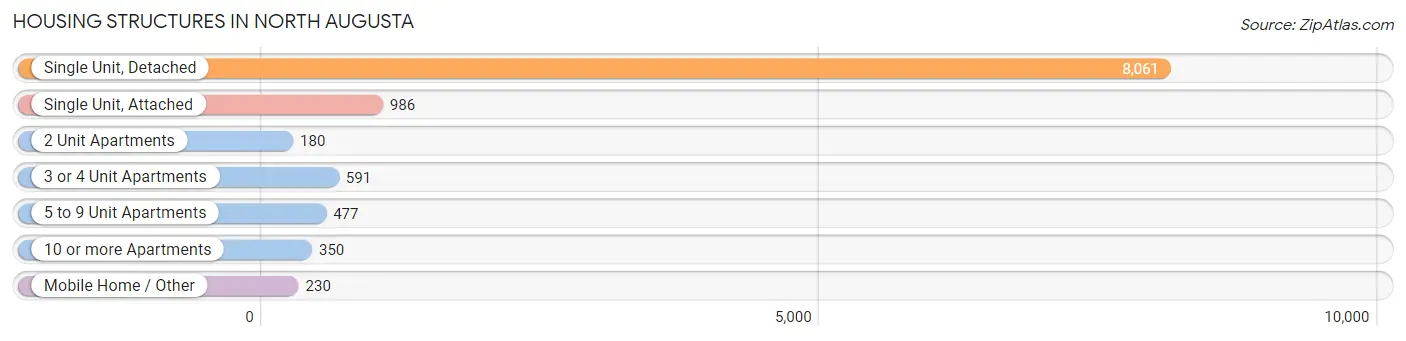
| Structure Type | # Housing Units | % Housing Units |
| Single Unit, Detached | 8,061 | 74.1% |
| Single Unit, Attached | 986 | 9.1% |
| 2 Unit Apartments | 180 | 1.7% |
| 3 or 4 Unit Apartments | 591 | 5.4% |
| 5 to 9 Unit Apartments | 477 | 4.4% |
| 10 or more Apartments | 350 | 3.2% |
| Mobile Home / Other | 230 | 2.1% |
| Total | 10,875 | 100.0% |
Housing Structures by Occupancy in North Augusta
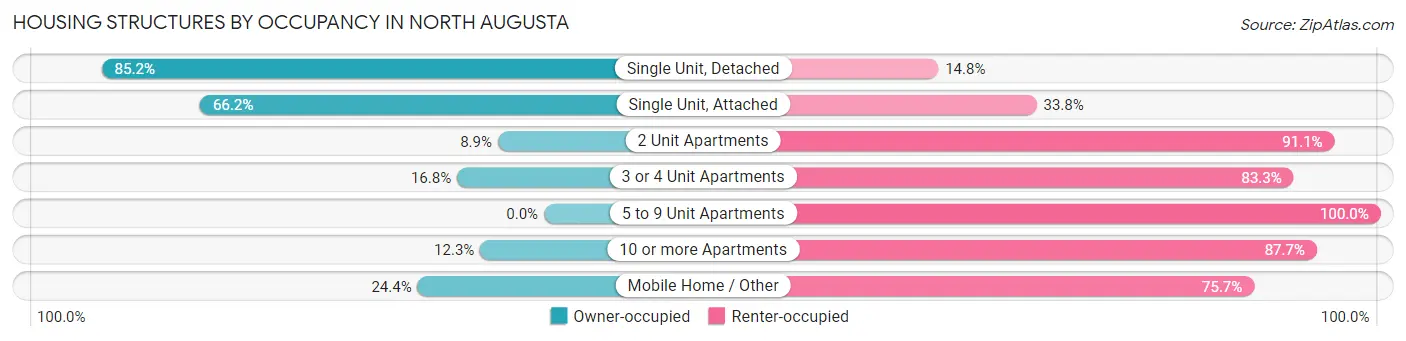
| Structure Type | Owner-occupied | Renter-occupied |
| Single Unit, Detached | 6,865 (85.2%) | 1,196 (14.8%) |
| Single Unit, Attached | 653 (66.2%) | 333 (33.8%) |
| 2 Unit Apartments | 16 (8.9%) | 164 (91.1%) |
| 3 or 4 Unit Apartments | 99 (16.8%) | 492 (83.3%) |
| 5 to 9 Unit Apartments | 0 (0.0%) | 477 (100.0%) |
| 10 or more Apartments | 43 (12.3%) | 307 (87.7%) |
| Mobile Home / Other | 56 (24.3%) | 174 (75.6%) |
| Total | 7,732 (71.1%) | 3,143 (28.9%) |
Housing Structures by Number of Rooms in North Augusta
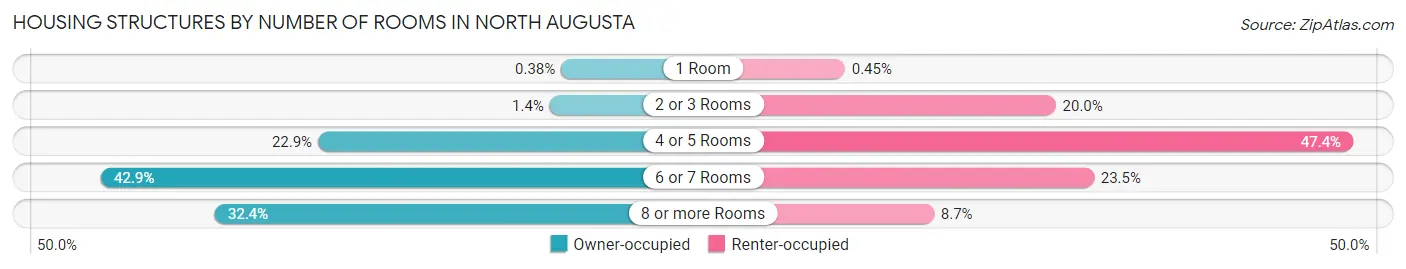
| Number of Rooms | Owner-occupied | Renter-occupied |
| 1 Room | 29 (0.4%) | 14 (0.4%) |
| 2 or 3 Rooms | 111 (1.4%) | 627 (20.0%) |
| 4 or 5 Rooms | 1,768 (22.9%) | 1,491 (47.4%) |
| 6 or 7 Rooms | 3,319 (42.9%) | 738 (23.5%) |
| 8 or more Rooms | 2,505 (32.4%) | 273 (8.7%) |
| Total | 7,732 (100.0%) | 3,143 (100.0%) |
Housing Structure by Heating Type in North Augusta
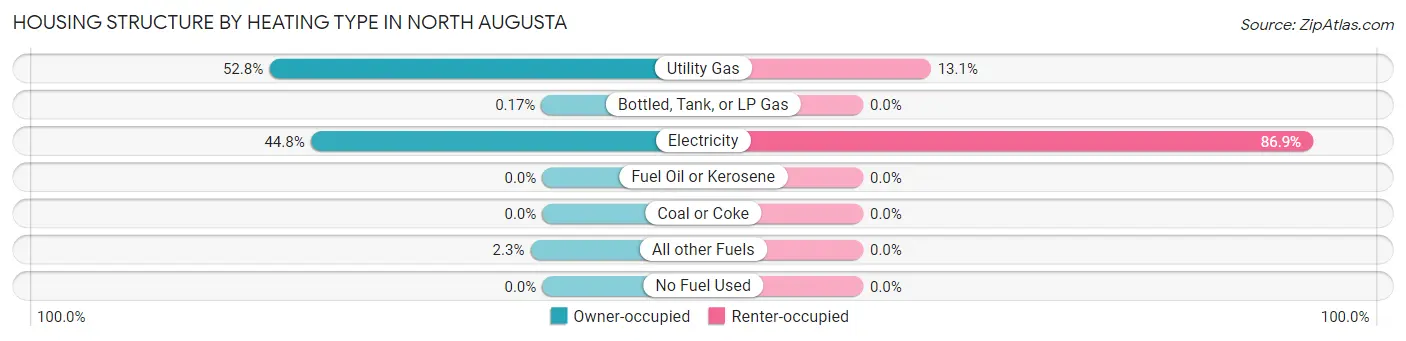
| Heating Type | Owner-occupied | Renter-occupied |
| Utility Gas | 4,081 (52.8%) | 411 (13.1%) |
| Bottled, Tank, or LP Gas | 13 (0.2%) | 0 (0.0%) |
| Electricity | 3,461 (44.8%) | 2,732 (86.9%) |
| Fuel Oil or Kerosene | 0 (0.0%) | 0 (0.0%) |
| Coal or Coke | 0 (0.0%) | 0 (0.0%) |
| All other Fuels | 177 (2.3%) | 0 (0.0%) |
| No Fuel Used | 0 (0.0%) | 0 (0.0%) |
| Total | 7,732 (100.0%) | 3,143 (100.0%) |
Household Vehicle Usage in North Augusta
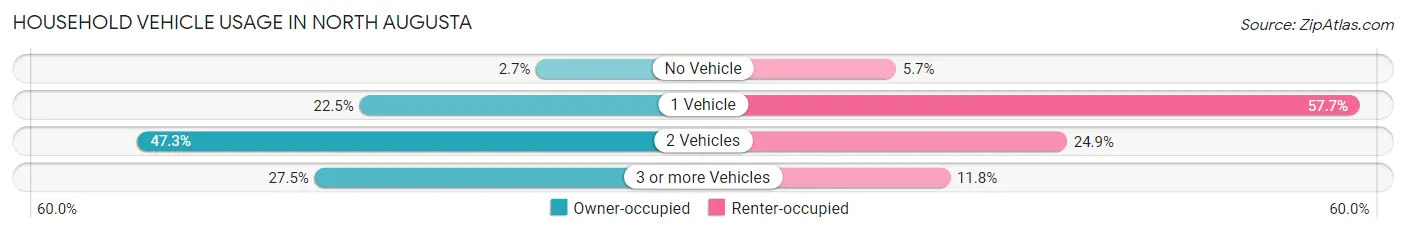
| Vehicles per Household | Owner-occupied | Renter-occupied |
| No Vehicle | 207 (2.7%) | 179 (5.7%) |
| 1 Vehicle | 1,738 (22.5%) | 1,813 (57.7%) |
| 2 Vehicles | 3,660 (47.3%) | 781 (24.8%) |
| 3 or more Vehicles | 2,127 (27.5%) | 370 (11.8%) |
| Total | 7,732 (100.0%) | 3,143 (100.0%) |
Real Estate & Mortgages in North Augusta
Real Estate and Mortgage Overview in North Augusta
| Characteristic | Without Mortgage | With Mortgage |
| Housing Units | 2,708 | 5,024 |
| Median Property Value | $209,600 | $210,400 |
| Median Household Income | $82,700 | $1,231 |
| Monthly Housing Costs | $456 | $175 |
| Real Estate Taxes | $931 | $103 |
Property Value by Mortgage Status in North Augusta
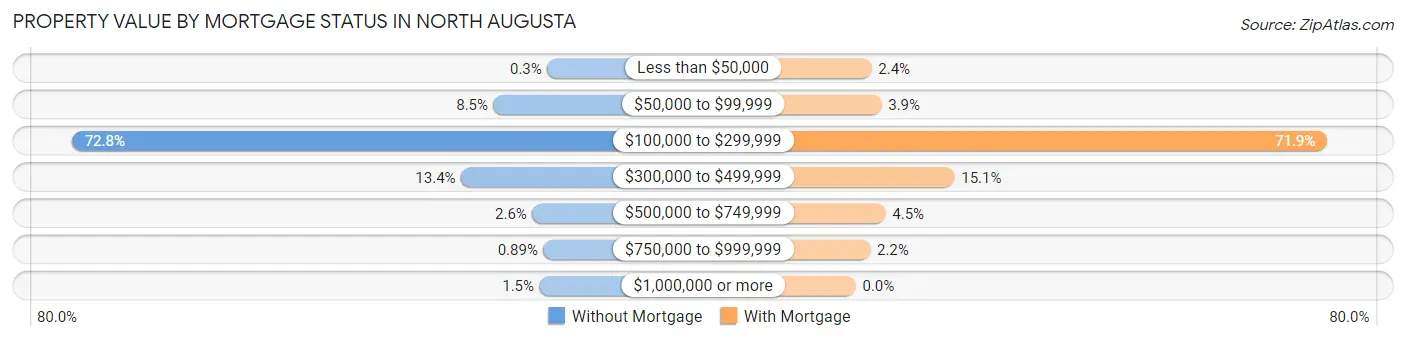
| Property Value | Without Mortgage | With Mortgage |
| Less than $50,000 | 8 (0.3%) | 121 (2.4%) |
| $50,000 to $99,999 | 230 (8.5%) | 197 (3.9%) |
| $100,000 to $299,999 | 1,972 (72.8%) | 3,611 (71.9%) |
| $300,000 to $499,999 | 364 (13.4%) | 756 (15.0%) |
| $500,000 to $749,999 | 70 (2.6%) | 228 (4.5%) |
| $750,000 to $999,999 | 24 (0.9%) | 111 (2.2%) |
| $1,000,000 or more | 40 (1.5%) | 0 (0.0%) |
| Total | 2,708 (100.0%) | 5,024 (100.0%) |
Household Income by Mortgage Status in North Augusta
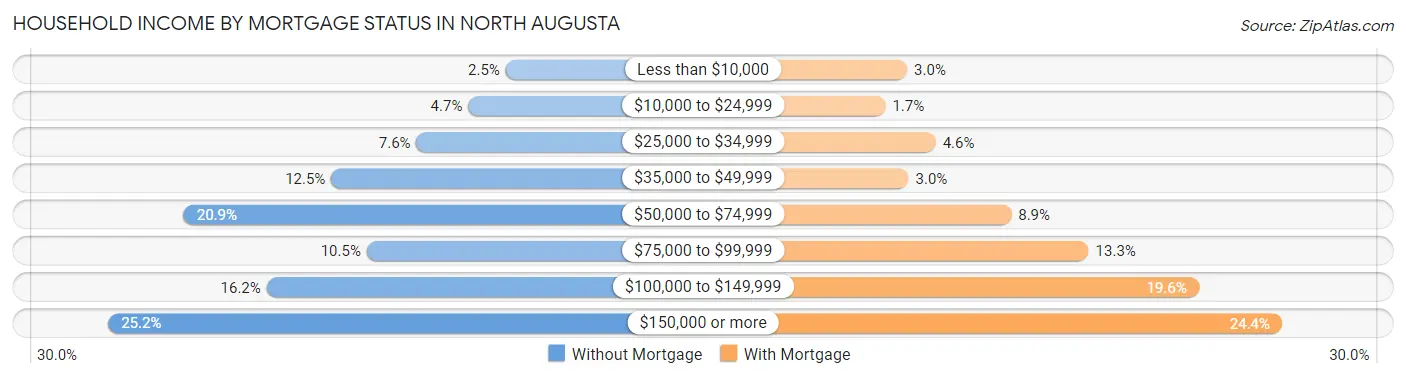
| Household Income | Without Mortgage | With Mortgage |
| Less than $10,000 | 68 (2.5%) | 148 (2.9%) |
| $10,000 to $24,999 | 126 (4.6%) | 86 (1.7%) |
| $25,000 to $34,999 | 206 (7.6%) | 230 (4.6%) |
| $35,000 to $49,999 | 338 (12.5%) | 152 (3.0%) |
| $50,000 to $74,999 | 566 (20.9%) | 447 (8.9%) |
| $75,000 to $99,999 | 283 (10.4%) | 669 (13.3%) |
| $100,000 to $149,999 | 438 (16.2%) | 985 (19.6%) |
| $150,000 or more | 683 (25.2%) | 1,224 (24.4%) |
| Total | 2,708 (100.0%) | 5,024 (100.0%) |
Property Value to Household Income Ratio in North Augusta
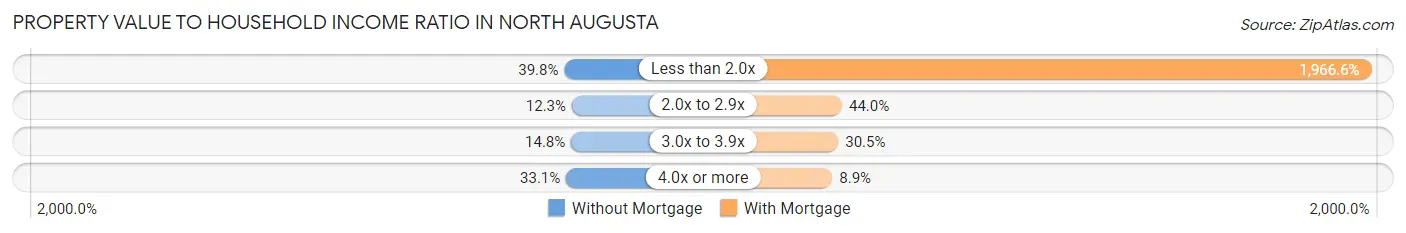
| Value-to-Income Ratio | Without Mortgage | With Mortgage |
| Less than 2.0x | 1,077 (39.8%) | 98,803 (1,966.6%) |
| 2.0x to 2.9x | 334 (12.3%) | 2,212 (44.0%) |
| 3.0x to 3.9x | 402 (14.8%) | 1,531 (30.5%) |
| 4.0x or more | 895 (33.1%) | 447 (8.9%) |
| Total | 2,708 (100.0%) | 5,024 (100.0%) |
Real Estate Taxes by Mortgage Status in North Augusta
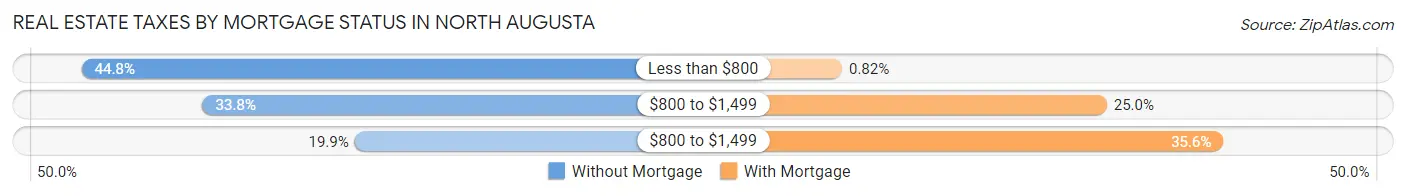
| Property Taxes | Without Mortgage | With Mortgage |
| Less than $800 | 1,213 (44.8%) | 41 (0.8%) |
| $800 to $1,499 | 914 (33.8%) | 1,256 (25.0%) |
| $800 to $1,499 | 538 (19.9%) | 1,790 (35.6%) |
| Total | 2,708 (100.0%) | 5,024 (100.0%) |
Health & Disability in North Augusta
Health Insurance Coverage by Age in North Augusta
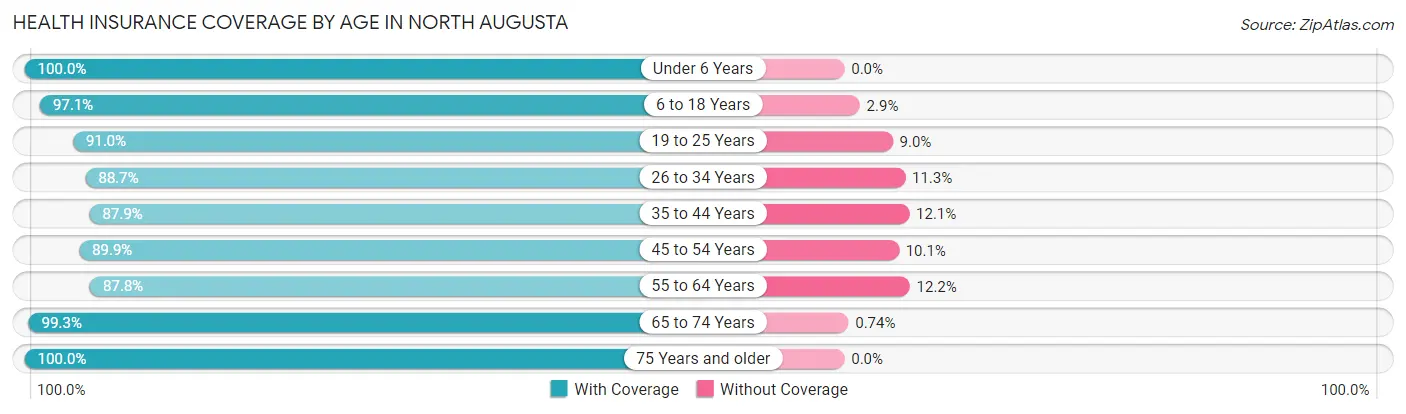
| Age Bracket | With Coverage | Without Coverage |
| Under 6 Years | 1,592 (100.0%) | 0 (0.0%) |
| 6 to 18 Years | 2,852 (97.1%) | 84 (2.9%) |
| 19 to 25 Years | 1,203 (91.0%) | 119 (9.0%) |
| 26 to 34 Years | 3,067 (88.7%) | 392 (11.3%) |
| 35 to 44 Years | 2,813 (87.9%) | 387 (12.1%) |
| 45 to 54 Years | 2,978 (89.9%) | 336 (10.1%) |
| 55 to 64 Years | 3,260 (87.8%) | 452 (12.2%) |
| 65 to 74 Years | 2,824 (99.3%) | 21 (0.7%) |
| 75 Years and older | 1,404 (100.0%) | 0 (0.0%) |
| Total | 21,993 (92.5%) | 1,791 (7.5%) |
Health Insurance Coverage by Citizenship Status in North Augusta
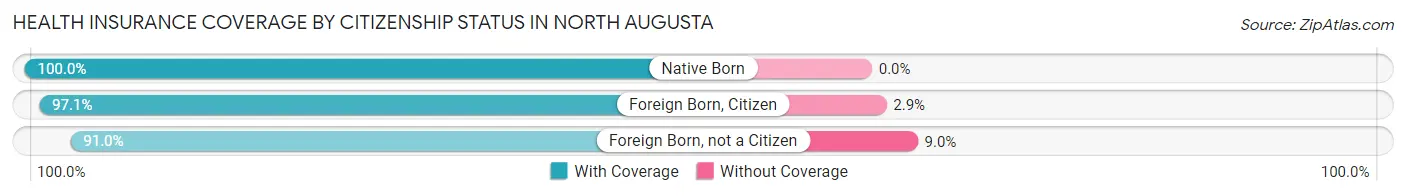
| Citizenship Status | With Coverage | Without Coverage |
| Native Born | 1,592 (100.0%) | 0 (0.0%) |
| Foreign Born, Citizen | 2,852 (97.1%) | 84 (2.9%) |
| Foreign Born, not a Citizen | 1,203 (91.0%) | 119 (9.0%) |
Health Insurance Coverage by Household Income in North Augusta
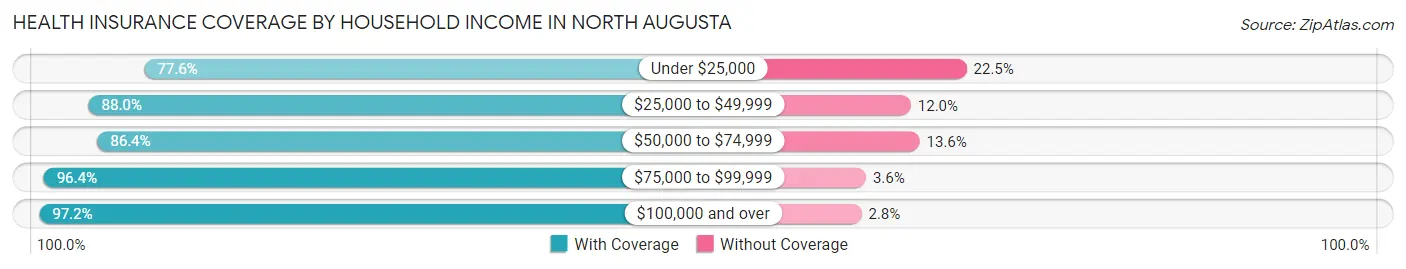
| Household Income | With Coverage | Without Coverage |
| Under $25,000 | 1,793 (77.5%) | 519 (22.5%) |
| $25,000 to $49,999 | 2,648 (88.0%) | 361 (12.0%) |
| $50,000 to $74,999 | 2,886 (86.4%) | 456 (13.6%) |
| $75,000 to $99,999 | 4,297 (96.4%) | 160 (3.6%) |
| $100,000 and over | 10,352 (97.2%) | 294 (2.8%) |
Public vs Private Health Insurance Coverage by Age in North Augusta
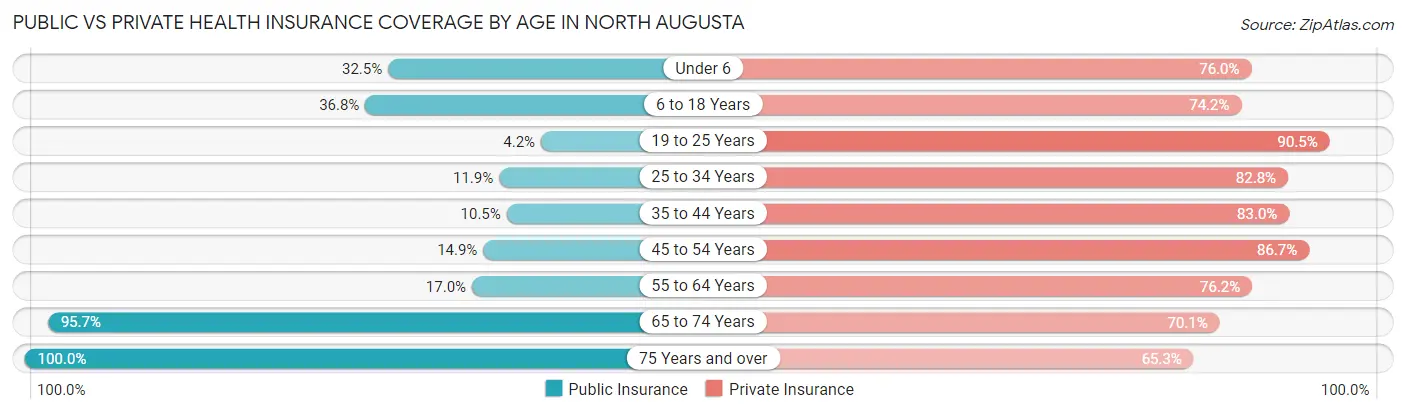
| Age Bracket | Public Insurance | Private Insurance |
| Under 6 | 518 (32.5%) | 1,210 (76.0%) |
| 6 to 18 Years | 1,080 (36.8%) | 2,177 (74.2%) |
| 19 to 25 Years | 55 (4.2%) | 1,197 (90.5%) |
| 25 to 34 Years | 413 (11.9%) | 2,864 (82.8%) |
| 35 to 44 Years | 337 (10.5%) | 2,657 (83.0%) |
| 45 to 54 Years | 493 (14.9%) | 2,874 (86.7%) |
| 55 to 64 Years | 630 (17.0%) | 2,827 (76.2%) |
| 65 to 74 Years | 2,723 (95.7%) | 1,995 (70.1%) |
| 75 Years and over | 1,404 (100.0%) | 917 (65.3%) |
| Total | 7,653 (32.2%) | 18,718 (78.7%) |
Disability Status by Sex by Age in North Augusta
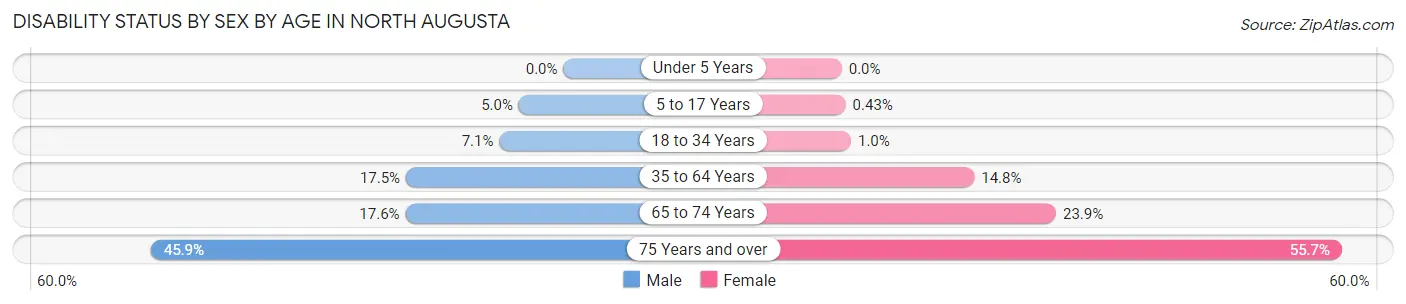
| Age Bracket | Male | Female |
| Under 5 Years | 0 (0.0%) | 0 (0.0%) |
| 5 to 17 Years | 83 (5.0%) | 6 (0.4%) |
| 18 to 34 Years | 151 (7.1%) | 28 (1.0%) |
| 35 to 64 Years | 878 (17.5%) | 770 (14.8%) |
| 65 to 74 Years | 235 (17.6%) | 360 (23.9%) |
| 75 Years and over | 249 (45.9%) | 480 (55.7%) |
Disability Class by Sex by Age in North Augusta
Disability Class: Hearing Difficulty
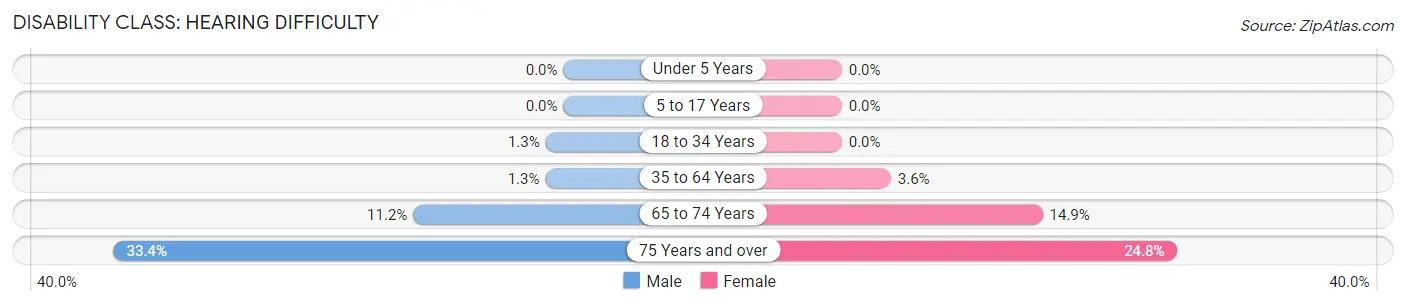
| Age Bracket | Male | Female |
| Under 5 Years | 0 (0.0%) | 0 (0.0%) |
| 5 to 17 Years | 0 (0.0%) | 0 (0.0%) |
| 18 to 34 Years | 28 (1.3%) | 0 (0.0%) |
| 35 to 64 Years | 67 (1.3%) | 190 (3.6%) |
| 65 to 74 Years | 149 (11.2%) | 225 (14.9%) |
| 75 Years and over | 181 (33.4%) | 214 (24.8%) |
Disability Class: Vision Difficulty
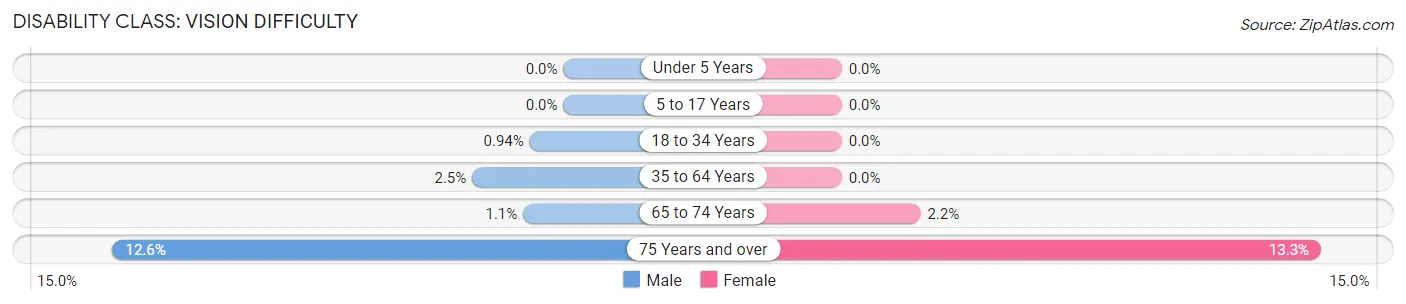
| Age Bracket | Male | Female |
| Under 5 Years | 0 (0.0%) | 0 (0.0%) |
| 5 to 17 Years | 0 (0.0%) | 0 (0.0%) |
| 18 to 34 Years | 20 (0.9%) | 0 (0.0%) |
| 35 to 64 Years | 127 (2.5%) | 0 (0.0%) |
| 65 to 74 Years | 15 (1.1%) | 33 (2.2%) |
| 75 Years and over | 68 (12.6%) | 115 (13.3%) |
Disability Class: Cognitive Difficulty
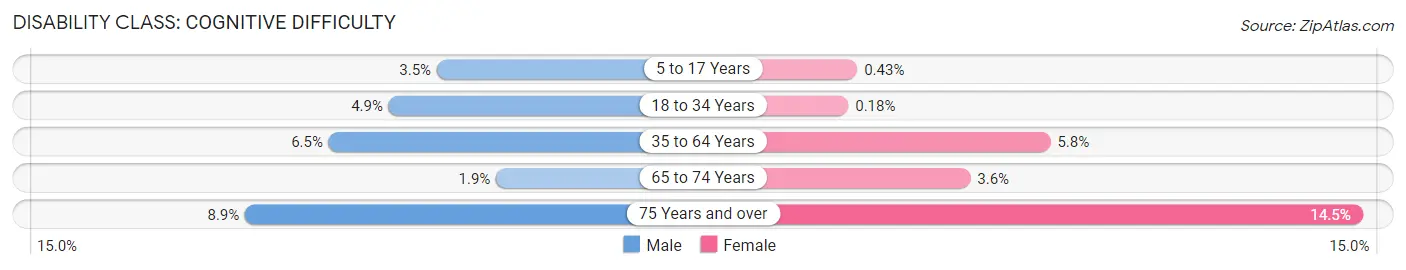
| Age Bracket | Male | Female |
| 5 to 17 Years | 59 (3.5%) | 6 (0.4%) |
| 18 to 34 Years | 103 (4.9%) | 5 (0.2%) |
| 35 to 64 Years | 327 (6.5%) | 303 (5.8%) |
| 65 to 74 Years | 25 (1.9%) | 54 (3.6%) |
| 75 Years and over | 48 (8.9%) | 125 (14.5%) |
Disability Class: Ambulatory Difficulty
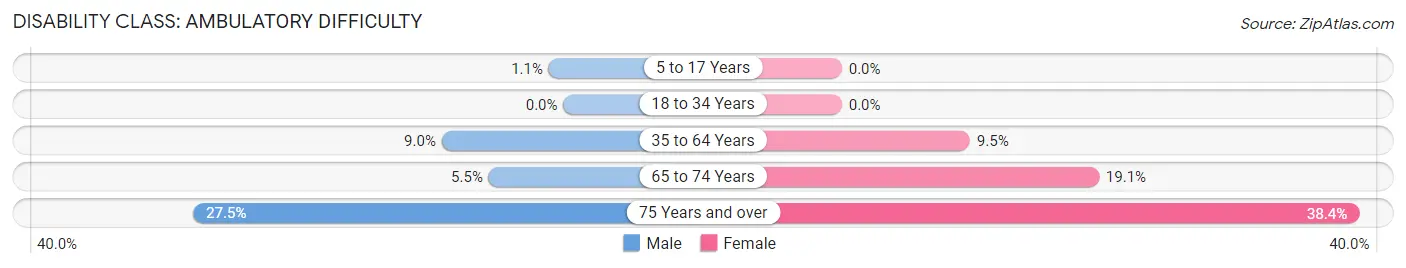
| Age Bracket | Male | Female |
| 5 to 17 Years | 18 (1.1%) | 0 (0.0%) |
| 18 to 34 Years | 0 (0.0%) | 0 (0.0%) |
| 35 to 64 Years | 452 (9.0%) | 496 (9.5%) |
| 65 to 74 Years | 74 (5.5%) | 288 (19.1%) |
| 75 Years and over | 149 (27.5%) | 331 (38.4%) |
Disability Class: Self-Care Difficulty
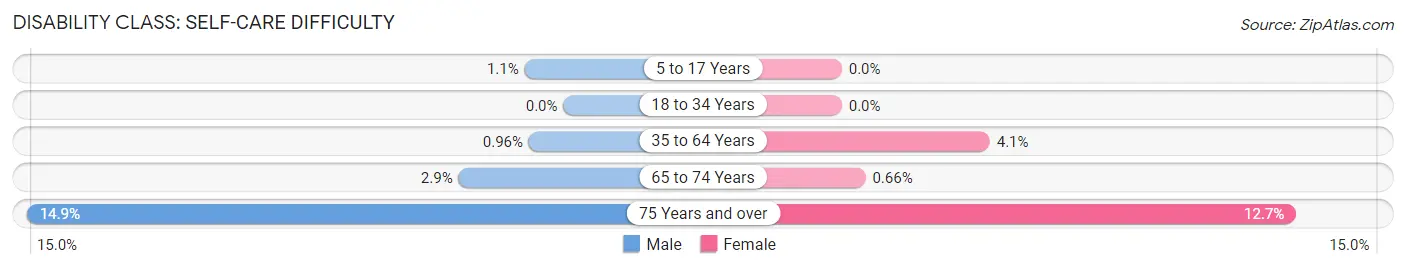
| Age Bracket | Male | Female |
| 5 to 17 Years | 18 (1.1%) | 0 (0.0%) |
| 18 to 34 Years | 0 (0.0%) | 0 (0.0%) |
| 35 to 64 Years | 48 (1.0%) | 215 (4.1%) |
| 65 to 74 Years | 39 (2.9%) | 10 (0.7%) |
| 75 Years and over | 81 (14.9%) | 109 (12.7%) |
Technology Access in North Augusta
Computing Device Access in North Augusta
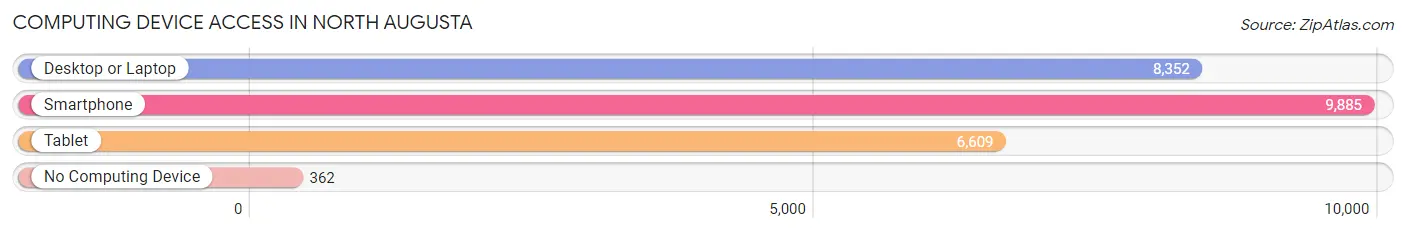
| Device Type | # Households | % Households |
| Desktop or Laptop | 8,352 | 76.8% |
| Smartphone | 9,885 | 90.9% |
| Tablet | 6,609 | 60.8% |
| No Computing Device | 362 | 3.3% |
| Total | 10,875 | 100.0% |
Internet Access in North Augusta
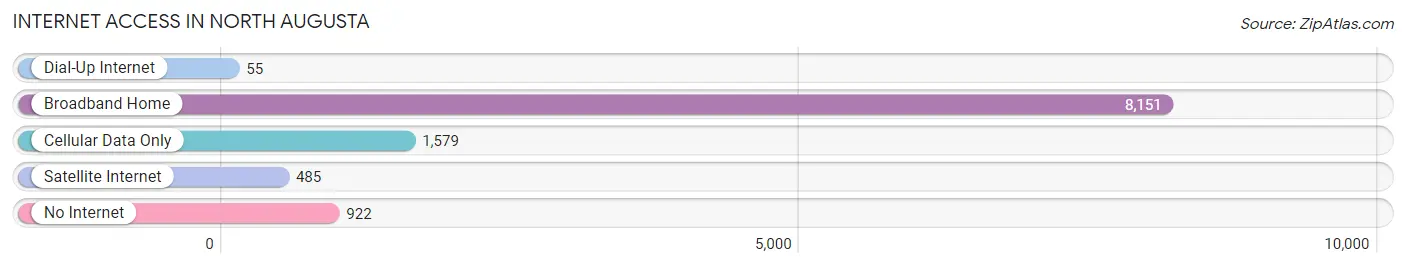
| Internet Type | # Households | % Households |
| Dial-Up Internet | 55 | 0.5% |
| Broadband Home | 8,151 | 75.0% |
| Cellular Data Only | 1,579 | 14.5% |
| Satellite Internet | 485 | 4.5% |
| No Internet | 922 | 8.5% |
| Total | 10,875 | 100.0% |
North Augusta Summary
History
North Augusta is a city located in Aiken County, South Carolina, United States. It is situated on the Savannah River, across from Augusta, Georgia. The city is part of the Augusta-Richmond County Metropolitan Statistical Area. North Augusta was founded in 1891 and incorporated in 1904. It was named for its location on the north side of the Savannah River.
The area that is now North Augusta was originally inhabited by the Creek and Cherokee Native American tribes. The first European settlers arrived in the area in the late 1700s. The area was part of the original land grant given to the Georgia Colony in 1763. In 1785, the area was divided into two counties, Richmond and Edgefield.
In 1813, the area was divided again, this time into two townships, Hamburg and Hamburg Cross Roads. The area was known as Hamburg until 1891, when it was renamed North Augusta. The city was officially incorporated in 1904.
Geography
North Augusta is located in Aiken County, South Carolina, United States. It is situated on the Savannah River, across from Augusta, Georgia. The city is part of the Augusta-Richmond County Metropolitan Statistical Area.
The city has a total area of 16.2 square miles, of which 15.9 square miles is land and 0.3 square miles is water. The city is located in the Piedmont region of South Carolina, and is characterized by rolling hills and a temperate climate.
Economy
North Augusta is a major economic center in the region. The city is home to several large employers, including Savannah River Nuclear Solutions, Kimberly-Clark, and Bridgestone. The city is also home to several smaller businesses, including restaurants, retail stores, and professional services.
The city is also home to several industrial parks, including the North Augusta Industrial Park, the North Augusta Commerce Park, and the North Augusta Technology Park. These parks are home to a variety of businesses, including manufacturing, distribution, and technology companies.
Demographics
As of the 2010 census, North Augusta had a population of 21,348. The racial makeup of the city was 73.2% White, 22.2% African American, 0.3% Native American, 1.7% Asian, 0.1% Pacific Islander, 1.2% from other races, and 1.4% from two or more races. Hispanic or Latino of any race were 3.2% of the population.
The median income for a household in the city was $45,945, and the median income for a family was $54,945. The per capita income for the city was $22,945. About 10.2% of families and 13.2% of the population were below the poverty line, including 17.2% of those under age 18 and 8.2% of those age 65 or over.
Common Questions
What is Per Capita Income in North Augusta?
Per Capita income in North Augusta is $46,452.
What is the Median Family Income in North Augusta?
Median Family Income in North Augusta is $98,389.
What is the Median Household income in North Augusta?
Median Household Income in North Augusta is $85,093.
What is Income or Wage Gap in North Augusta?
Income or Wage Gap in North Augusta is 34.5%.
Women in North Augusta earn 65.5 cents for every dollar earned by a man.
What is Inequality or Gini Index in North Augusta?
Inequality or Gini Index in North Augusta is 0.44.
What is the Total Population of North Augusta?
Total Population of North Augusta is 24,425.
What is the Total Male Population of North Augusta?
Total Male Population of North Augusta is 11,728.
What is the Total Female Population of North Augusta?
Total Female Population of North Augusta is 12,697.
What is the Ratio of Males per 100 Females in North Augusta?
There are 92.37 Males per 100 Females in North Augusta.
What is the Ratio of Females per 100 Males in North Augusta?
There are 108.26 Females per 100 Males in North Augusta.
What is the Median Population Age in North Augusta?
Median Population Age in North Augusta is 43.4 Years.
What is the Average Family Size in North Augusta
Average Family Size in North Augusta is 2.8 People.
What is the Average Household Size in North Augusta
Average Household Size in North Augusta is 2.2 People.
How Large is the Labor Force in North Augusta?
There are 13,291 People in the Labor Forcein in North Augusta.
What is the Percentage of People in the Labor Force in North Augusta?
64.9% of People are in the Labor Force in North Augusta.
What is the Unemployment Rate in North Augusta?
Unemployment Rate in North Augusta is 3.8%.