Zip Codes with the Highest Percentage of Population Employed in Life, Physical & Social Science in Simpsonville, SC
RELATED REPORTS & OPTIONS
Life, Physical & Social Science
Simpsonville
Compare Zip Codes
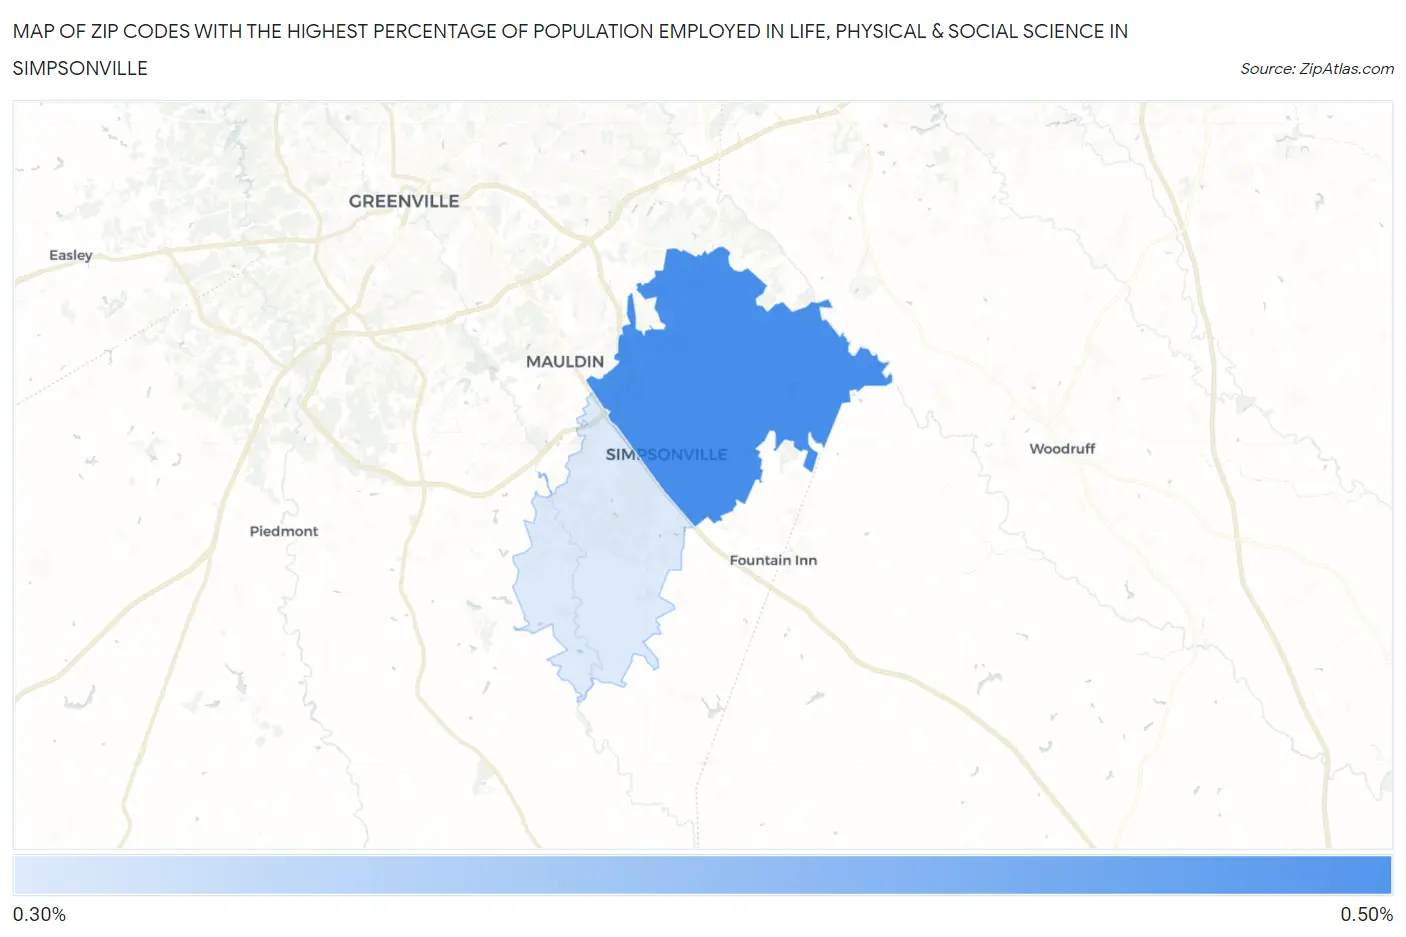
Map of Zip Codes with the Highest Percentage of Population Employed in Life, Physical & Social Science in Simpsonville
0.37%
0.48%
Zip Codes with the Highest Percentage of Population Employed in Life, Physical & Social Science in Simpsonville, SC
| Zip Code | % Employed | vs State | vs National | |
| 1. | 29681 | 0.48% | 0.73%(-0.242)#156 | 1.1%(-0.607)#14,699 |
| 2. | 29680 | 0.37% | 0.73%(-0.355)#182 | 1.1%(-0.720)#16,120 |
1
Common Questions
What are the Top Zip Codes with the Highest Percentage of Population Employed in Life, Physical & Social Science in Simpsonville, SC?
Top Zip Codes with the Highest Percentage of Population Employed in Life, Physical & Social Science in Simpsonville, SC are:
What zip code has the Highest Percentage of Population Employed in Life, Physical & Social Science in Simpsonville, SC?
29681 has the Highest Percentage of Population Employed in Life, Physical & Social Science in Simpsonville, SC with 0.48%.
What is the Percentage of Population Employed in Life, Physical & Social Science in Simpsonville, SC?
Percentage of Population Employed in Life, Physical & Social Science in Simpsonville is 0.19%.
What is the Percentage of Population Employed in Life, Physical & Social Science in South Carolina?
Percentage of Population Employed in Life, Physical & Social Science in South Carolina is 0.73%.
What is the Percentage of Population Employed in Life, Physical & Social Science in the United States?
Percentage of Population Employed in Life, Physical & Social Science in the United States is 1.1%.