Zip Codes with the Highest Percentage of Population Employed in Life, Physical & Social Science in Greenwood, SC
RELATED REPORTS & OPTIONS
Life, Physical & Social Science
Greenwood
Compare Zip Codes
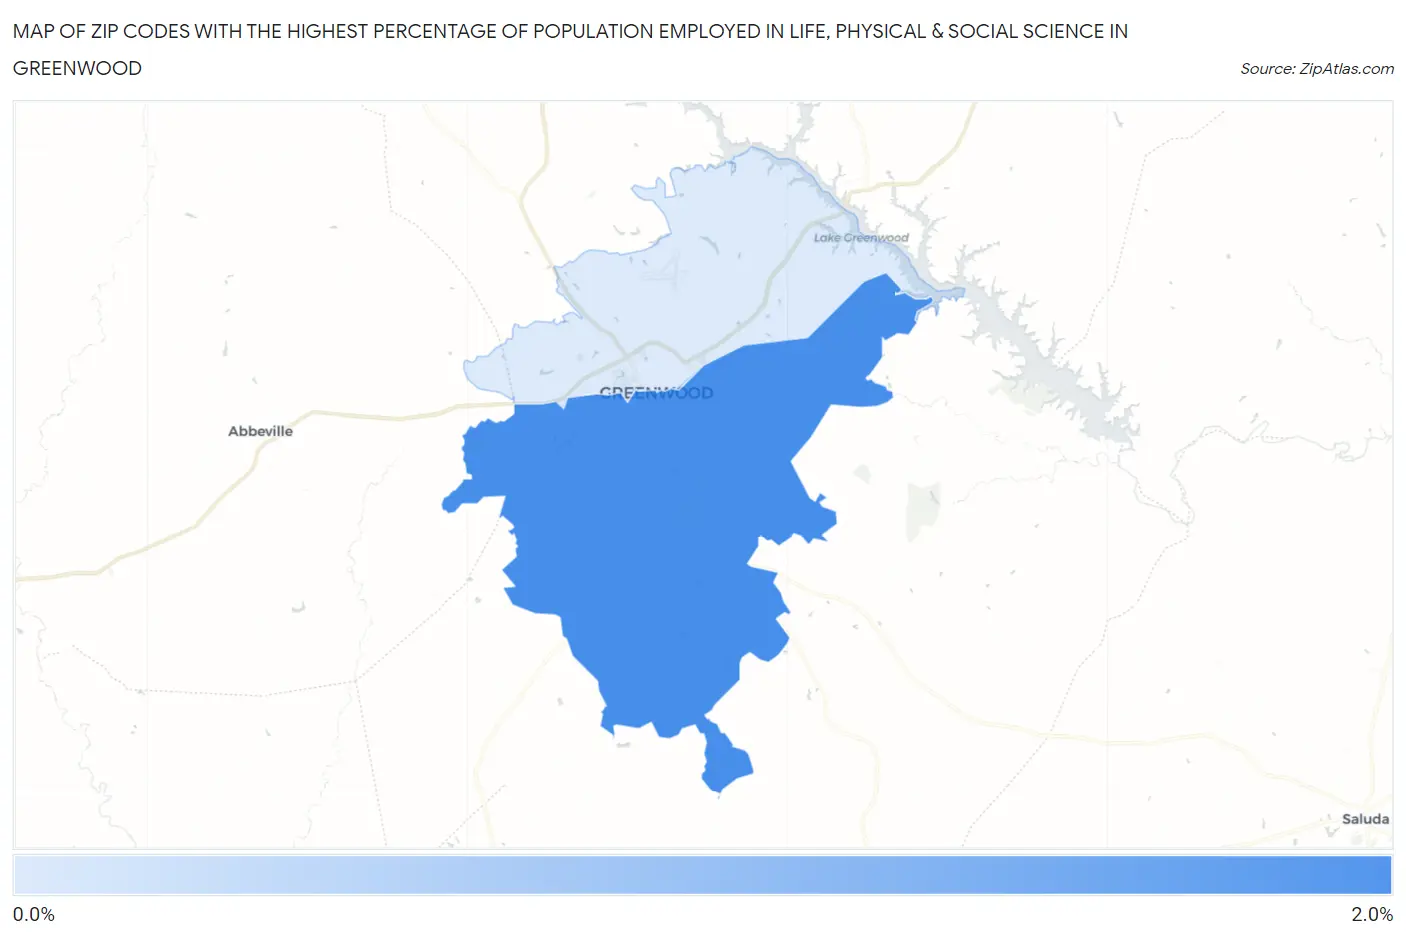
Map of Zip Codes with the Highest Percentage of Population Employed in Life, Physical & Social Science in Greenwood
0.83%
1.8%
Zip Codes with the Highest Percentage of Population Employed in Life, Physical & Social Science in Greenwood, SC
| Zip Code | % Employed | vs State | vs National | |
| 1. | 29646 | 1.8% | 0.73%(+1.10)#24 | 1.1%(+0.740)#4,210 |
| 2. | 29649 | 0.83% | 0.73%(+0.106)#98 | 1.1%(-0.259)#10,672 |
1
Common Questions
What are the Top Zip Codes with the Highest Percentage of Population Employed in Life, Physical & Social Science in Greenwood, SC?
Top Zip Codes with the Highest Percentage of Population Employed in Life, Physical & Social Science in Greenwood, SC are:
What zip code has the Highest Percentage of Population Employed in Life, Physical & Social Science in Greenwood, SC?
29646 has the Highest Percentage of Population Employed in Life, Physical & Social Science in Greenwood, SC with 1.8%.
What is the Percentage of Population Employed in Life, Physical & Social Science in Greenwood, SC?
Percentage of Population Employed in Life, Physical & Social Science in Greenwood is 1.6%.
What is the Percentage of Population Employed in Life, Physical & Social Science in South Carolina?
Percentage of Population Employed in Life, Physical & Social Science in South Carolina is 0.73%.
What is the Percentage of Population Employed in Life, Physical & Social Science in the United States?
Percentage of Population Employed in Life, Physical & Social Science in the United States is 1.1%.