Sumter, SC Map & Demographics
Sumter Map
Sumter Overview
$27,742
PER CAPITA INCOME
$64,609
AVG FAMILY INCOME
$48,900
AVG HOUSEHOLD INCOME
33.5%
WAGE / INCOME GAP [ % ]
66.5¢/ $1
WAGE / INCOME GAP [ $ ]
$10,794
FAMILY INCOME DEFICIT
0.48
INEQUALITY / GINI INDEX
43,046
TOTAL POPULATION
21,121
MALE POPULATION
21,925
FEMALE POPULATION
96.33
MALES / 100 FEMALES
103.81
FEMALES / 100 MALES
33.1
MEDIAN AGE
3.3
AVG FAMILY SIZE
2.5
AVG HOUSEHOLD SIZE
19,713
LABOR FORCE [ PEOPLE ]
60.0%
PERCENT IN LABOR FORCE
7.8%
UNEMPLOYMENT RATE
Sumter Area Codes
Income in Sumter
Income Overview in Sumter
Per Capita Income in Sumter is $27,742, while median incomes of families and households are $64,609 and $48,900 respectively.
| Characteristic | Number | Measure |
| Per Capita Income | 43,046 | $27,742 |
| Median Family Income | 10,337 | $64,609 |
| Mean Family Income | 10,337 | $88,183 |
| Median Household Income | 16,394 | $48,900 |
| Mean Household Income | 16,394 | $70,530 |
| Income Deficit | 10,337 | $10,794 |
| Wage / Income Gap (%) | 43,046 | 33.48% |
| Wage / Income Gap ($) | 43,046 | 66.52¢ per $1 |
| Gini / Inequality Index | 43,046 | 0.48 |
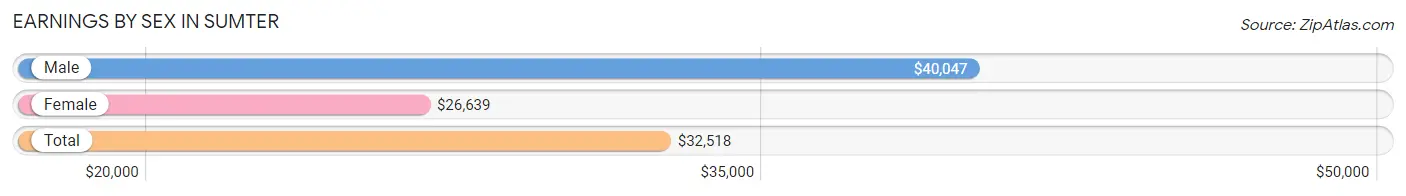
Earnings by Sex in Sumter
Average Earnings in Sumter are $32,518, $40,047 for men and $26,639 for women, a difference of 33.5%.
| Sex | Number | Average Earnings |
| Male | 10,469 (51.3%) | $40,047 |
| Female | 9,918 (48.6%) | $26,639 |
| Total | 20,387 (100.0%) | $32,518 |
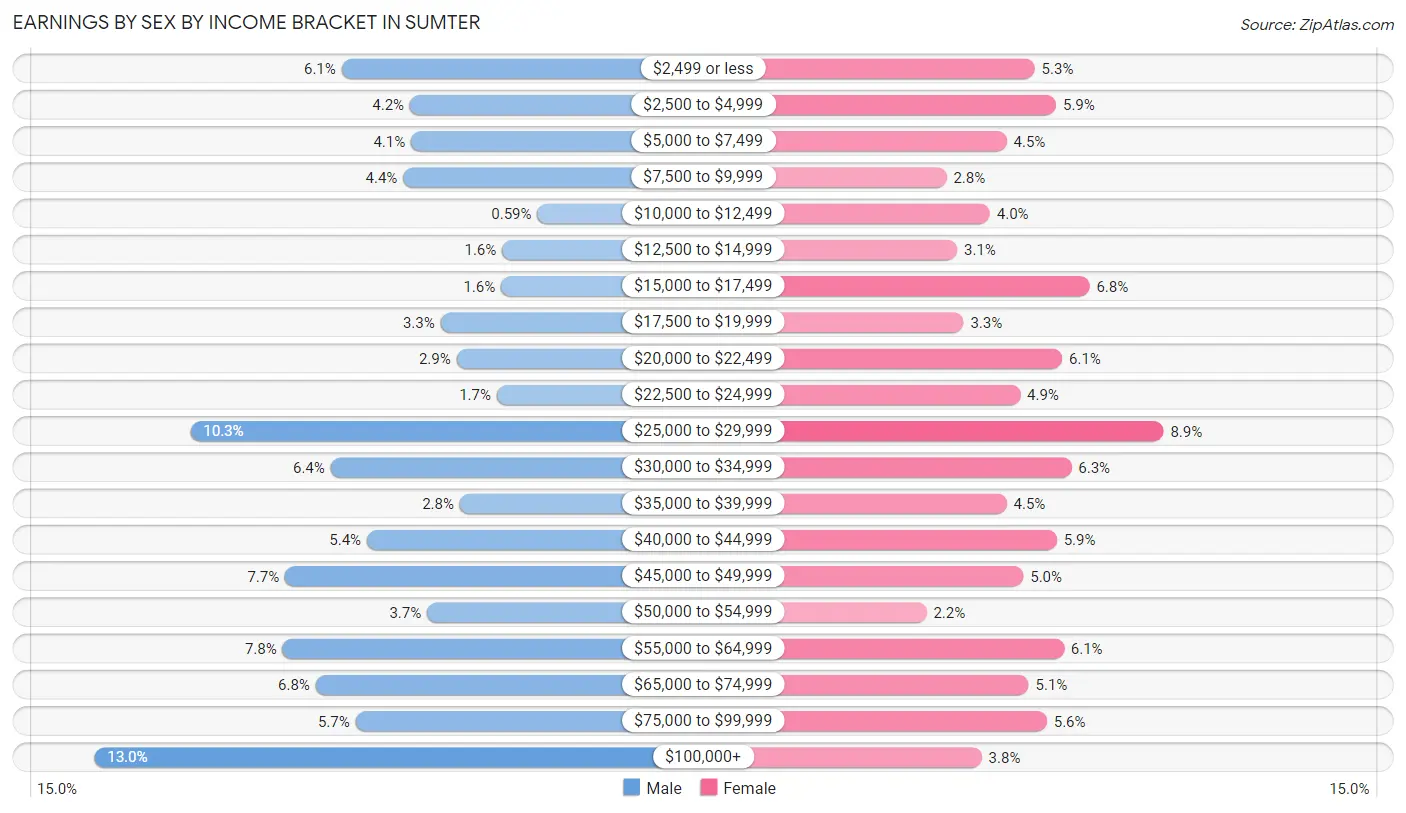
Earnings by Sex by Income Bracket in Sumter
The most common earnings brackets in Sumter are $100,000+ for men (1,365 | 13.0%) and $25,000 to $29,999 for women (883 | 8.9%).
| Income | Male | Female |
| $2,499 or less | 638 (6.1%) | 524 (5.3%) |
| $2,500 to $4,999 | 437 (4.2%) | 583 (5.9%) |
| $5,000 to $7,499 | 433 (4.1%) | 445 (4.5%) |
| $7,500 to $9,999 | 456 (4.4%) | 278 (2.8%) |
| $10,000 to $12,499 | 62 (0.6%) | 399 (4.0%) |
| $12,500 to $14,999 | 165 (1.6%) | 307 (3.1%) |
| $15,000 to $17,499 | 169 (1.6%) | 676 (6.8%) |
| $17,500 to $19,999 | 347 (3.3%) | 325 (3.3%) |
| $20,000 to $22,499 | 299 (2.9%) | 600 (6.0%) |
| $22,500 to $24,999 | 181 (1.7%) | 483 (4.9%) |
| $25,000 to $29,999 | 1,082 (10.3%) | 883 (8.9%) |
| $30,000 to $34,999 | 670 (6.4%) | 626 (6.3%) |
| $35,000 to $39,999 | 290 (2.8%) | 445 (4.5%) |
| $40,000 to $44,999 | 563 (5.4%) | 585 (5.9%) |
| $45,000 to $49,999 | 804 (7.7%) | 492 (5.0%) |
| $50,000 to $54,999 | 386 (3.7%) | 222 (2.2%) |
| $55,000 to $64,999 | 811 (7.7%) | 605 (6.1%) |
| $65,000 to $74,999 | 714 (6.8%) | 507 (5.1%) |
| $75,000 to $99,999 | 597 (5.7%) | 557 (5.6%) |
| $100,000+ | 1,365 (13.0%) | 376 (3.8%) |
| Total | 10,469 (100.0%) | 9,918 (100.0%) |
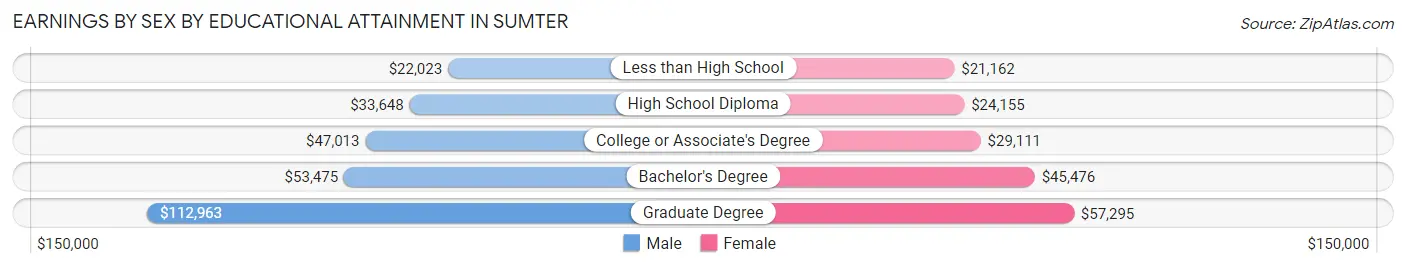
Earnings by Sex by Educational Attainment in Sumter
Average earnings in Sumter are $46,496 for men and $31,010 for women, a difference of 33.3%. Men with an educational attainment of graduate degree enjoy the highest average annual earnings of $112,963, while those with less than high school education earn the least with $22,023. Women with an educational attainment of graduate degree earn the most with the average annual earnings of $57,295, while those with less than high school education have the smallest earnings of $21,162.
| Educational Attainment | Male Income | Female Income |
| Less than High School | $22,023 | $21,162 |
| High School Diploma | $33,648 | $24,155 |
| College or Associate's Degree | $47,013 | $29,111 |
| Bachelor's Degree | $53,475 | $45,476 |
| Graduate Degree | $112,963 | $57,295 |
| Total | $46,496 | $31,010 |
Family Income in Sumter
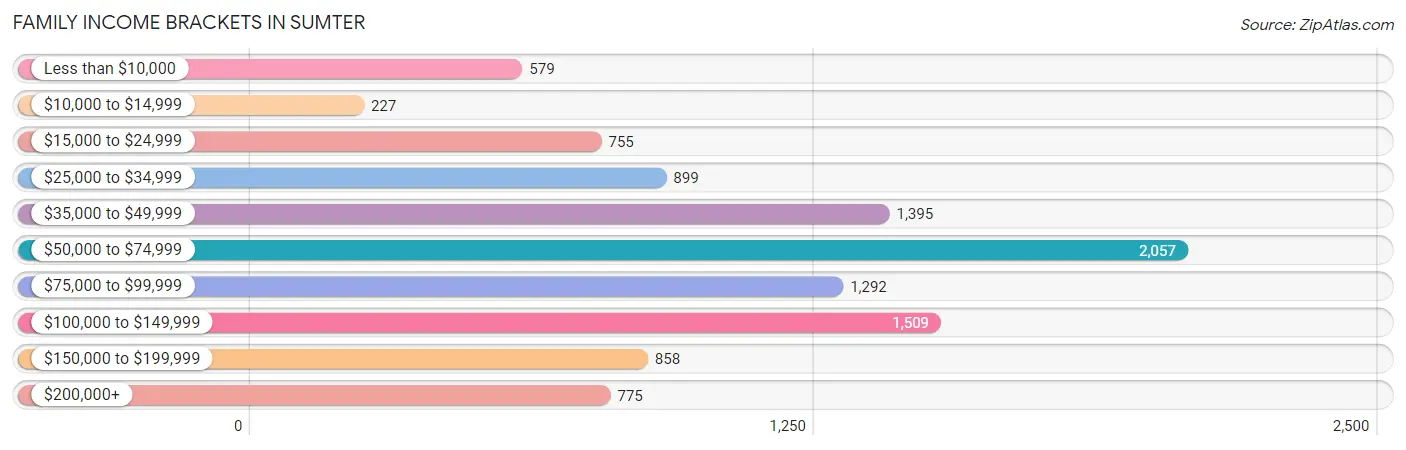
Family Income Brackets in Sumter
According to the Sumter family income data, there are 2,057 families falling into the $50,000 to $74,999 income range, which is the most common income bracket and makes up 19.9% of all families. Conversely, the $10,000 to $14,999 income bracket is the least frequent group with only 227 families (2.2%) belonging to this category.
| Income Bracket | # Families | % Families |
| Less than $10,000 | 579 | 5.6% |
| $10,000 to $14,999 | 227 | 2.2% |
| $15,000 to $24,999 | 755 | 7.3% |
| $25,000 to $34,999 | 899 | 8.7% |
| $35,000 to $49,999 | 1,395 | 13.5% |
| $50,000 to $74,999 | 2,057 | 19.9% |
| $75,000 to $99,999 | 1,292 | 12.5% |
| $100,000 to $149,999 | 1,509 | 14.6% |
| $150,000 to $199,999 | 858 | 8.3% |
| $200,000+ | 775 | 7.5% |
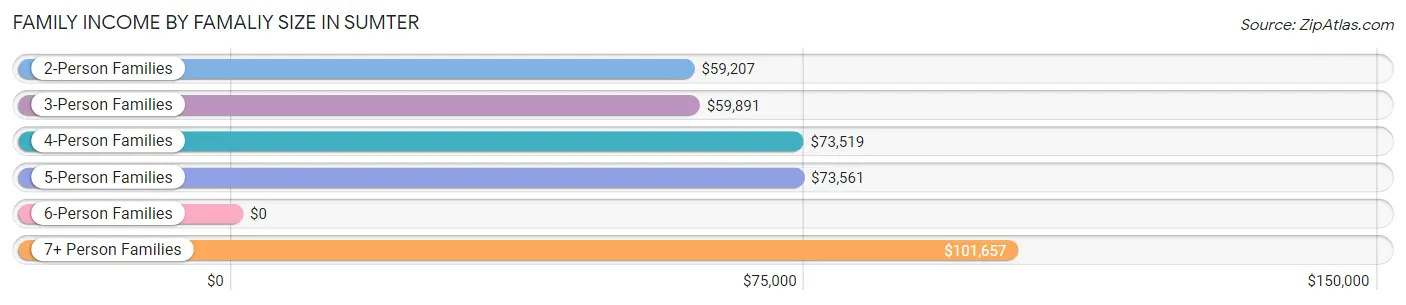
Family Income by Famaliy Size in Sumter
7+ person families (263 | 2.5%) account for the highest median family income in Sumter with $101,657 per family, while 2-person families (5,024 | 48.6%) have the highest median income of $29,604 per family member.
| Income Bracket | # Families | Median Income |
| 2-Person Families | 5,024 (48.6%) | $59,207 |
| 3-Person Families | 2,434 (23.5%) | $59,891 |
| 4-Person Families | 1,650 (16.0%) | $73,519 |
| 5-Person Families | 802 (7.8%) | $73,561 |
| 6-Person Families | 164 (1.6%) | $0 |
| 7+ Person Families | 263 (2.5%) | $101,657 |
| Total | 10,337 (100.0%) | $64,609 |
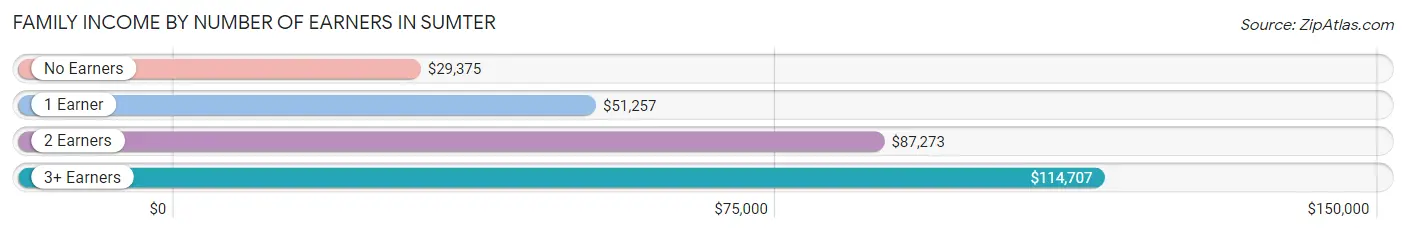
Family Income by Number of Earners in Sumter
The median family income in Sumter is $64,609, with families comprising 3+ earners (865) having the highest median family income of $114,707, while families with no earners (1,416) have the lowest median family income of $29,375, accounting for 8.4% and 13.7% of families, respectively.
| Number of Earners | # Families | Median Income |
| No Earners | 1,416 (13.7%) | $29,375 |
| 1 Earner | 4,071 (39.4%) | $51,257 |
| 2 Earners | 3,985 (38.6%) | $87,273 |
| 3+ Earners | 865 (8.4%) | $114,707 |
| Total | 10,337 (100.0%) | $64,609 |
Household Income in Sumter
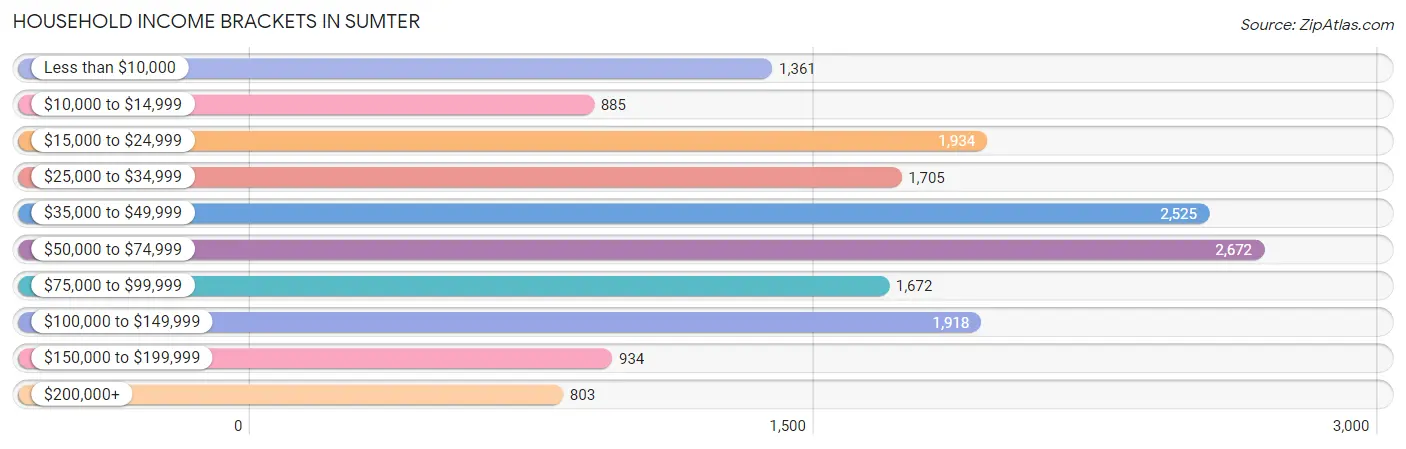
Household Income Brackets in Sumter
With 2,672 households falling in the category, the $50,000 to $74,999 income range is the most frequent in Sumter, accounting for 16.3% of all households. In contrast, only 803 households (4.9%) fall into the $200,000+ income bracket, making it the least populous group.
| Income Bracket | # Households | % Households |
| Less than $10,000 | 1,361 | 8.3% |
| $10,000 to $14,999 | 885 | 5.4% |
| $15,000 to $24,999 | 1,934 | 11.8% |
| $25,000 to $34,999 | 1,705 | 10.4% |
| $35,000 to $49,999 | 2,525 | 15.4% |
| $50,000 to $74,999 | 2,672 | 16.3% |
| $75,000 to $99,999 | 1,672 | 10.2% |
| $100,000 to $149,999 | 1,918 | 11.7% |
| $150,000 to $199,999 | 934 | 5.7% |
| $200,000+ | 803 | 4.9% |
Household Income by Householder Age in Sumter
The median household income in Sumter is $48,900, with the highest median household income of $58,279 found in the 25 to 44 years age bracket for the primary householder. A total of 5,734 households (35.0%) fall into this category. Meanwhile, the 65+ years age bracket for the primary householder has the lowest median household income of $36,509, with 4,370 households (26.7%) in this group.
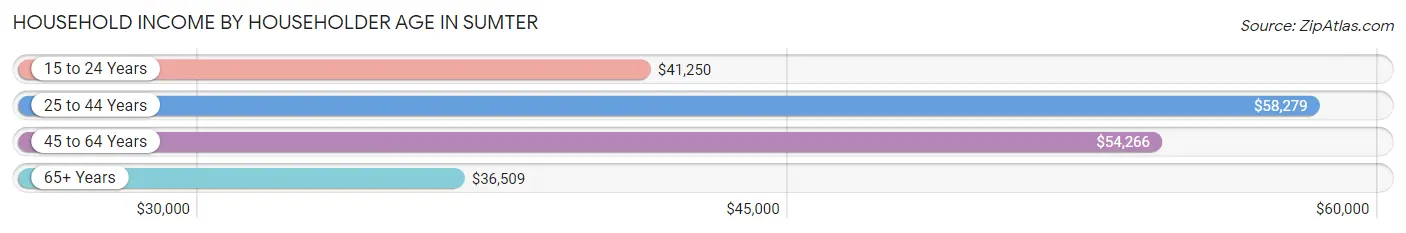
| Income Bracket | # Households | Median Income |
| 15 to 24 Years | 1,342 (8.2%) | $41,250 |
| 25 to 44 Years | 5,734 (35.0%) | $58,279 |
| 45 to 64 Years | 4,948 (30.2%) | $54,266 |
| 65+ Years | 4,370 (26.7%) | $36,509 |
| Total | 16,394 (100.0%) | $48,900 |
Poverty in Sumter
Income Below Poverty by Sex and Age in Sumter
With 15.4% poverty level for males and 19.5% for females among the residents of Sumter, 15 year old males and under 5 year old females are the most vulnerable to poverty, with 77 males (24.8%) and 424 females (28.8%) in their respective age groups living below the poverty level.
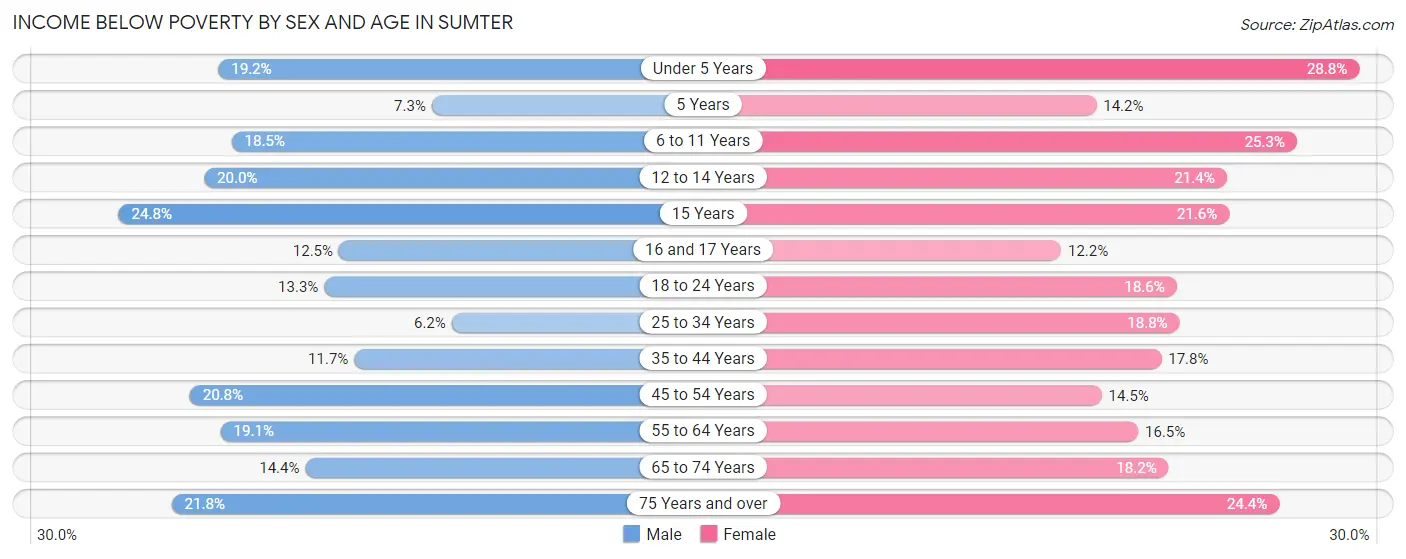
| Age Bracket | Male | Female |
| Under 5 Years | 316 (19.2%) | 424 (28.8%) |
| 5 Years | 22 (7.3%) | 51 (14.2%) |
| 6 to 11 Years | 363 (18.5%) | 480 (25.3%) |
| 12 to 14 Years | 256 (20.0%) | 133 (21.4%) |
| 15 Years | 77 (24.8%) | 58 (21.6%) |
| 16 and 17 Years | 91 (12.5%) | 63 (12.2%) |
| 18 to 24 Years | 271 (13.3%) | 356 (18.6%) |
| 25 to 34 Years | 181 (6.2%) | 604 (18.8%) |
| 35 to 44 Years | 280 (11.7%) | 423 (17.8%) |
| 45 to 54 Years | 380 (20.8%) | 317 (14.5%) |
| 55 to 64 Years | 425 (19.1%) | 392 (16.5%) |
| 65 to 74 Years | 238 (14.4%) | 388 (18.2%) |
| 75 Years and over | 226 (21.8%) | 438 (24.3%) |
| Total | 3,126 (15.4%) | 4,127 (19.5%) |
Income Above Poverty by Sex and Age in Sumter
According to the poverty statistics in Sumter, males aged 25 to 34 years and females aged 16 and 17 years are the age groups that are most secure financially, with 93.8% of males and 87.8% of females in these age groups living above the poverty line.
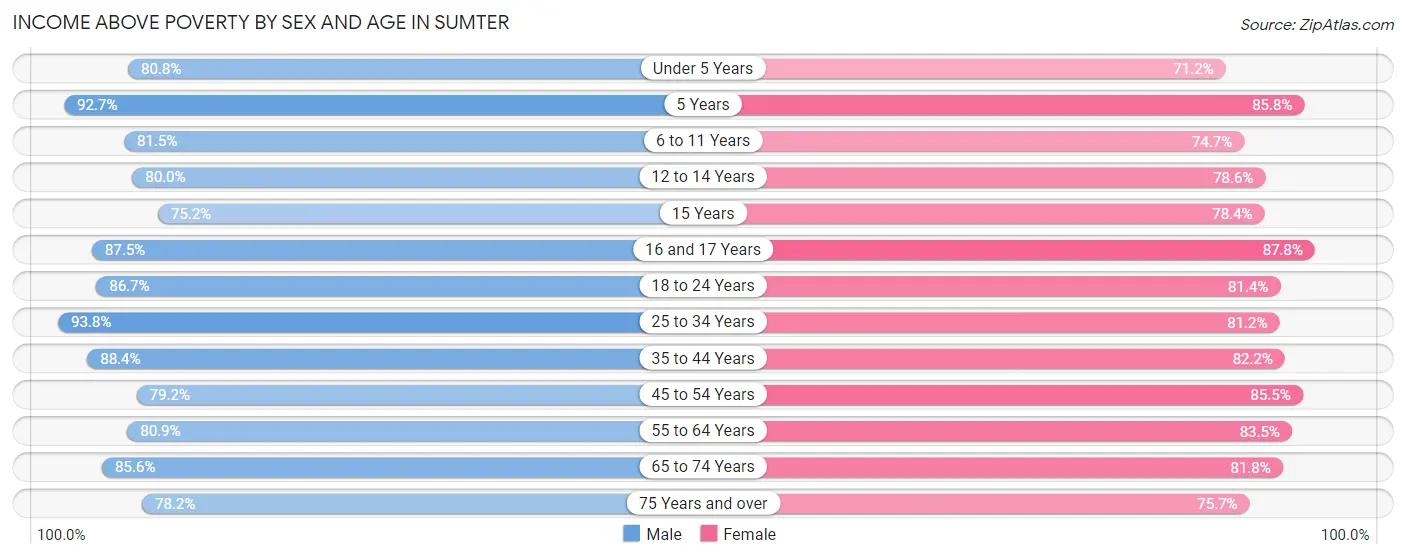
| Age Bracket | Male | Female |
| Under 5 Years | 1,329 (80.8%) | 1,048 (71.2%) |
| 5 Years | 278 (92.7%) | 309 (85.8%) |
| 6 to 11 Years | 1,602 (81.5%) | 1,415 (74.7%) |
| 12 to 14 Years | 1,024 (80.0%) | 488 (78.6%) |
| 15 Years | 234 (75.2%) | 211 (78.4%) |
| 16 and 17 Years | 637 (87.5%) | 453 (87.8%) |
| 18 to 24 Years | 1,764 (86.7%) | 1,554 (81.4%) |
| 25 to 34 Years | 2,727 (93.8%) | 2,609 (81.2%) |
| 35 to 44 Years | 2,123 (88.3%) | 1,955 (82.2%) |
| 45 to 54 Years | 1,447 (79.2%) | 1,873 (85.5%) |
| 55 to 64 Years | 1,803 (80.9%) | 1,984 (83.5%) |
| 65 to 74 Years | 1,418 (85.6%) | 1,745 (81.8%) |
| 75 Years and over | 810 (78.2%) | 1,361 (75.6%) |
| Total | 17,196 (84.6%) | 17,005 (80.5%) |
Income Below Poverty Among Married-Couple Families in Sumter
The poverty statistics for married-couple families in Sumter show that 5.6% or 374 of the total 6,652 families live below the poverty line. Families with 3 or 4 children have the highest poverty rate of 9.3%, comprising of 44 families. On the other hand, families with 5 or more children have the lowest poverty rate of 0.0%, which includes 0 families.
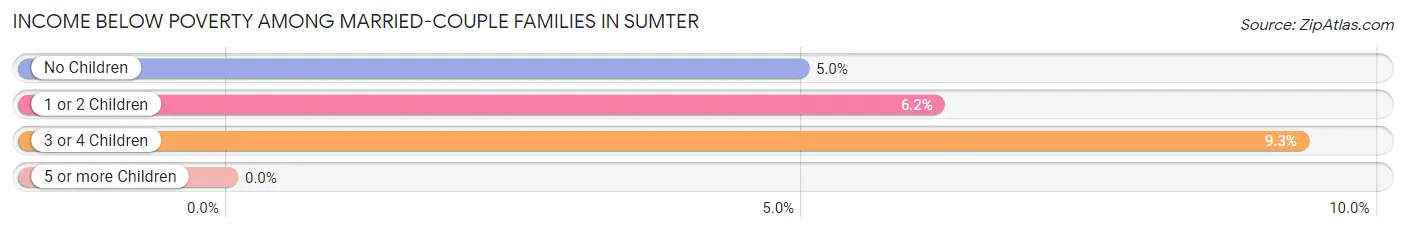
| Children | Above Poverty | Below Poverty |
| No Children | 3,785 (95.0%) | 198 (5.0%) |
| 1 or 2 Children | 2,014 (93.9%) | 132 (6.1%) |
| 3 or 4 Children | 428 (90.7%) | 44 (9.3%) |
| 5 or more Children | 51 (100.0%) | 0 (0.0%) |
| Total | 6,278 (94.4%) | 374 (5.6%) |
Income Below Poverty Among Single-Parent Households in Sumter
According to the poverty data in Sumter, 25.4% or 184 single-father households and 27.4% or 810 single-mother households are living below the poverty line. Among single-father households, those with 1 or 2 children have the highest poverty rate, with 154 households (53.3%) experiencing poverty. Likewise, among single-mother households, those with 5 or more children have the highest poverty rate, with 46 households (64.8%) falling below the poverty line.
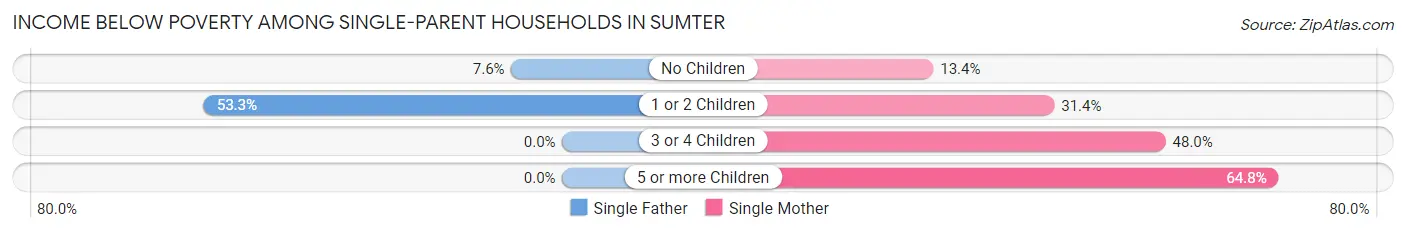
| Children | Single Father | Single Mother |
| No Children | 30 (7.6%) | 148 (13.4%) |
| 1 or 2 Children | 154 (53.3%) | 451 (31.4%) |
| 3 or 4 Children | 0 (0.0%) | 165 (48.0%) |
| 5 or more Children | 0 (0.0%) | 46 (64.8%) |
| Total | 184 (25.4%) | 810 (27.4%) |
Income Below Poverty Among Married-Couple vs Single-Parent Households in Sumter
The poverty data for Sumter shows that 374 of the married-couple family households (5.6%) and 994 of the single-parent households (27.0%) are living below the poverty level. Within the married-couple family households, those with 3 or 4 children have the highest poverty rate, with 44 households (9.3%) falling below the poverty line. Among the single-parent households, those with 5 or more children have the highest poverty rate, with 46 household (64.8%) living below poverty.
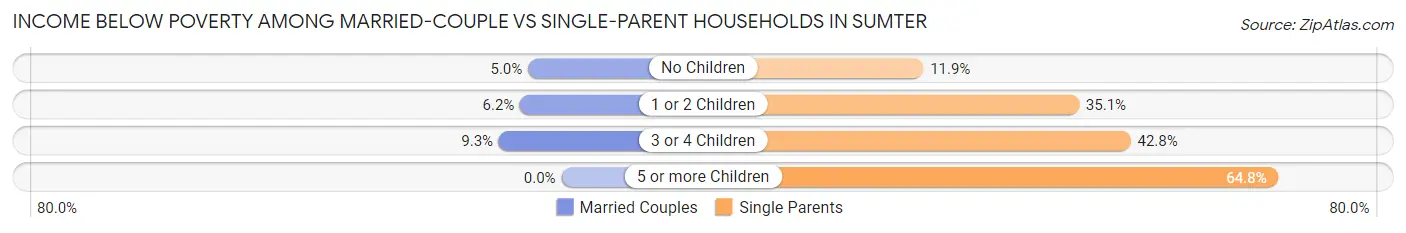
| Children | Married-Couple Families | Single-Parent Households |
| No Children | 198 (5.0%) | 178 (11.8%) |
| 1 or 2 Children | 132 (6.1%) | 605 (35.0%) |
| 3 or 4 Children | 44 (9.3%) | 165 (42.7%) |
| 5 or more Children | 0 (0.0%) | 46 (64.8%) |
| Total | 374 (5.6%) | 994 (27.0%) |
Race in Sumter
The most populous races in Sumter are Black / African American (20,400 | 47.4%), White / Caucasian (17,721 | 41.2%), and Hispanic or Latino (3,150 | 7.3%).
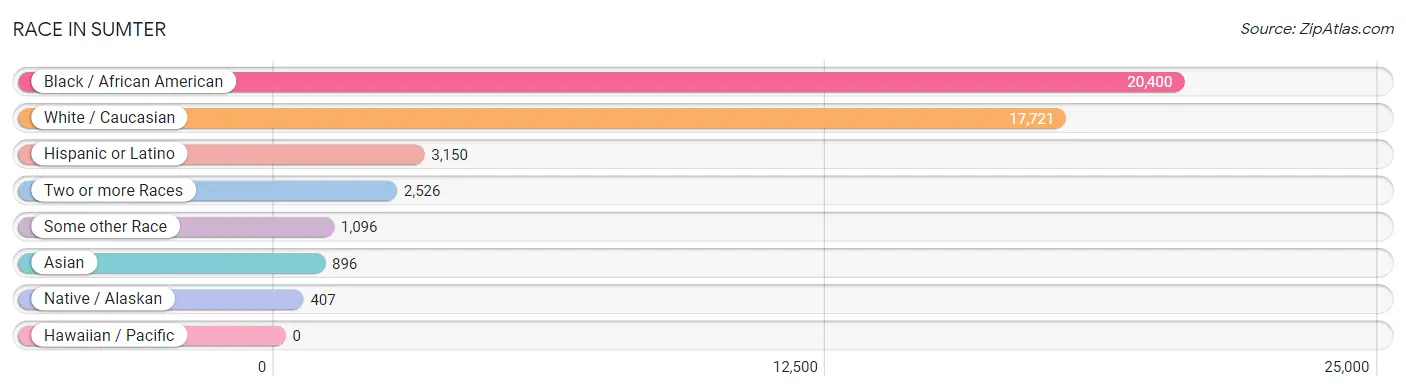
| Race | # Population | % Population |
| Asian | 896 | 2.1% |
| Black / African American | 20,400 | 47.4% |
| Hawaiian / Pacific | 0 | 0.0% |
| Hispanic or Latino | 3,150 | 7.3% |
| Native / Alaskan | 407 | 0.9% |
| White / Caucasian | 17,721 | 41.2% |
| Two or more Races | 2,526 | 5.9% |
| Some other Race | 1,096 | 2.5% |
| Total | 43,046 | 100.0% |
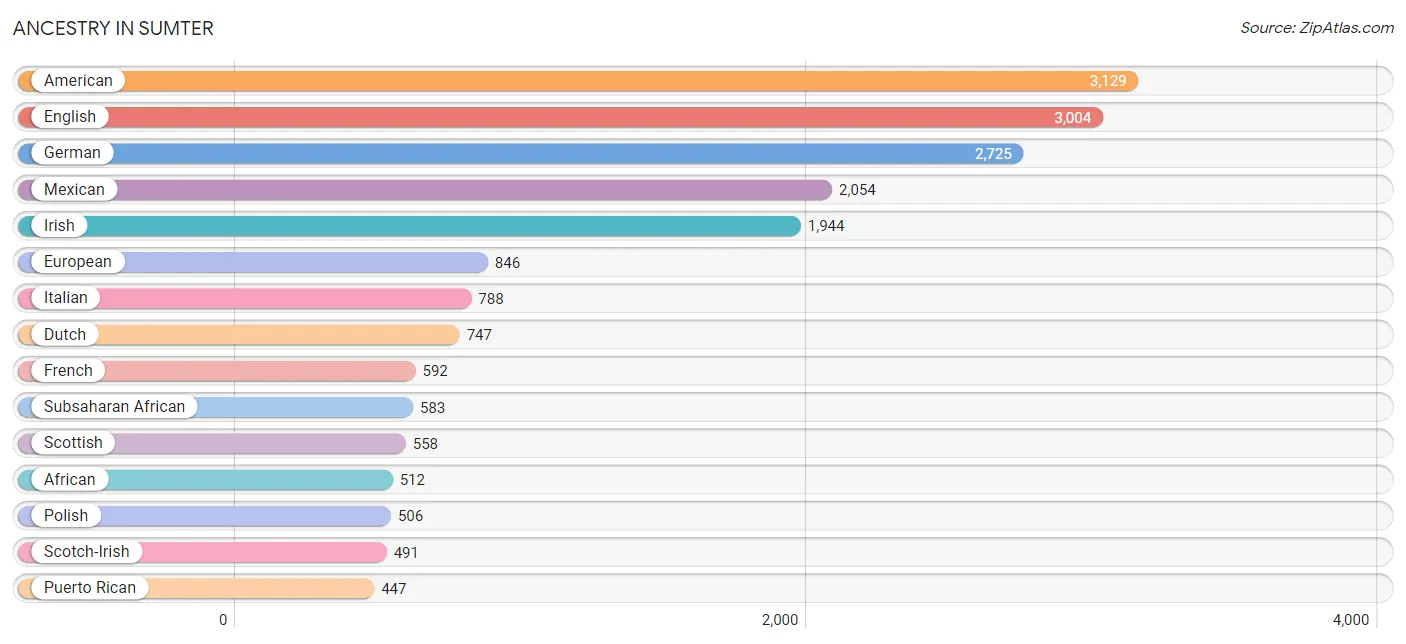
Ancestry in Sumter
The most populous ancestries reported in Sumter are American (3,129 | 7.3%), English (3,004 | 7.0%), German (2,725 | 6.3%), Mexican (2,054 | 4.8%), and Irish (1,944 | 4.5%), together accounting for 29.9% of all Sumter residents.
| Ancestry | # Population | % Population |
| African | 512 | 1.2% |
| American | 3,129 | 7.3% |
| Arab | 46 | 0.1% |
| Armenian | 19 | 0.0% |
| Austrian | 42 | 0.1% |
| Bangladeshi | 22 | 0.1% |
| Bhutanese | 21 | 0.1% |
| British | 184 | 0.4% |
| Burmese | 9 | 0.0% |
| Cajun | 13 | 0.0% |
| Canadian | 134 | 0.3% |
| Central American | 383 | 0.9% |
| Central American Indian | 34 | 0.1% |
| Cherokee | 145 | 0.3% |
| Choctaw | 18 | 0.0% |
| Colombian | 42 | 0.1% |
| Costa Rican | 12 | 0.0% |
| Cuban | 82 | 0.2% |
| Czech | 79 | 0.2% |
| Danish | 66 | 0.2% |
| Dutch | 747 | 1.7% |
| English | 3,004 | 7.0% |
| European | 846 | 2.0% |
| Finnish | 15 | 0.0% |
| French | 592 | 1.4% |
| French Canadian | 51 | 0.1% |
| German | 2,725 | 6.3% |
| Greek | 34 | 0.1% |
| Hungarian | 34 | 0.1% |
| Indian (Asian) | 208 | 0.5% |
| Irish | 1,944 | 4.5% |
| Iroquois | 12 | 0.0% |
| Italian | 788 | 1.8% |
| Jamaican | 149 | 0.4% |
| Korean | 328 | 0.8% |
| Laotian | 37 | 0.1% |
| Lebanese | 29 | 0.1% |
| Lumbee | 11 | 0.0% |
| Maltese | 8 | 0.0% |
| Mexican | 2,054 | 4.8% |
| Mexican American Indian | 318 | 0.7% |
| Native Hawaiian | 12 | 0.0% |
| Nigerian | 62 | 0.1% |
| Northern European | 261 | 0.6% |
| Norwegian | 71 | 0.2% |
| Panamanian | 371 | 0.9% |
| Pennsylvania German | 4 | 0.0% |
| Peruvian | 22 | 0.1% |
| Polish | 506 | 1.2% |
| Portuguese | 43 | 0.1% |
| Puerto Rican | 447 | 1.0% |
| Romanian | 132 | 0.3% |
| Russian | 83 | 0.2% |
| Scandinavian | 24 | 0.1% |
| Scotch-Irish | 491 | 1.1% |
| Scottish | 558 | 1.3% |
| Serbian | 53 | 0.1% |
| Slovak | 23 | 0.1% |
| Slovene | 9 | 0.0% |
| South American | 73 | 0.2% |
| Sri Lankan | 301 | 0.7% |
| Subsaharan African | 583 | 1.3% |
| Swedish | 64 | 0.2% |
| Swiss | 32 | 0.1% |
| Syrian | 17 | 0.0% |
| Thai | 277 | 0.6% |
| Trinidadian and Tobagonian | 7 | 0.0% |
| Ukrainian | 13 | 0.0% |
| Venezuelan | 9 | 0.0% |
| Welsh | 49 | 0.1% |
| West Indian | 11 | 0.0% | View All 71 Rows |
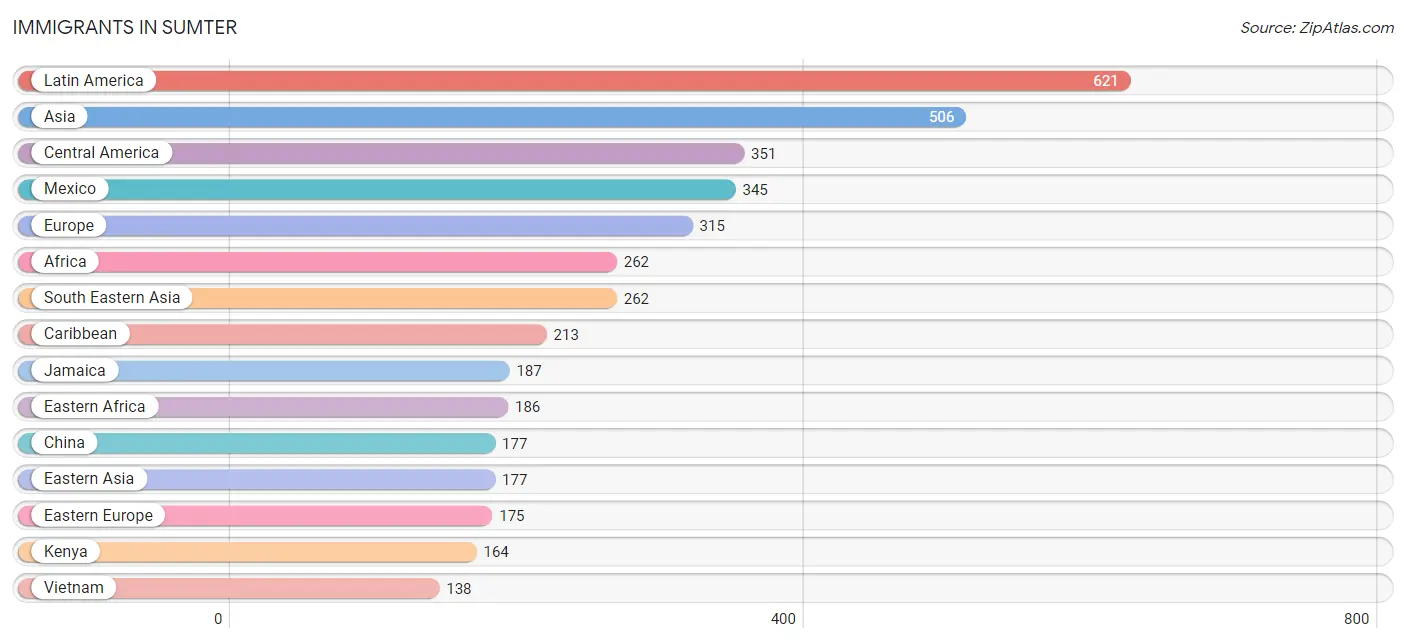
Immigrants in Sumter
The most numerous immigrant groups reported in Sumter came from Latin America (621 | 1.4%), Asia (506 | 1.2%), Central America (351 | 0.8%), Mexico (345 | 0.8%), and Europe (315 | 0.7%), together accounting for 5.0% of all Sumter residents.
| Immigration Origin | # Population | % Population |
| Africa | 262 | 0.6% |
| Asia | 506 | 1.2% |
| Brazil | 6 | 0.0% |
| Canada | 105 | 0.2% |
| Caribbean | 213 | 0.5% |
| Central America | 351 | 0.8% |
| China | 177 | 0.4% |
| Colombia | 20 | 0.1% |
| Costa Rica | 6 | 0.0% |
| Cuba | 9 | 0.0% |
| Dominica | 17 | 0.0% |
| Eastern Africa | 186 | 0.4% |
| Eastern Asia | 177 | 0.4% |
| Eastern Europe | 175 | 0.4% |
| England | 54 | 0.1% |
| Europe | 315 | 0.7% |
| France | 19 | 0.0% |
| Germany | 35 | 0.1% |
| India | 26 | 0.1% |
| Indonesia | 37 | 0.1% |
| Italy | 19 | 0.0% |
| Jamaica | 187 | 0.4% |
| Kenya | 164 | 0.4% |
| Latin America | 621 | 1.4% |
| Lebanon | 19 | 0.0% |
| Mexico | 345 | 0.8% |
| Nigeria | 22 | 0.1% |
| Northern Europe | 67 | 0.2% |
| Oceania | 9 | 0.0% |
| Peru | 22 | 0.1% |
| Philippines | 71 | 0.2% |
| Poland | 21 | 0.1% |
| Romania | 68 | 0.2% |
| Russia | 86 | 0.2% |
| South America | 57 | 0.1% |
| South Central Asia | 26 | 0.1% |
| South Eastern Asia | 262 | 0.6% |
| Southern Europe | 19 | 0.0% |
| Sweden | 13 | 0.0% |
| Syria | 9 | 0.0% |
| Taiwan | 12 | 0.0% |
| Thailand | 16 | 0.0% |
| Venezuela | 9 | 0.0% |
| Vietnam | 138 | 0.3% |
| Western Africa | 22 | 0.1% |
| Western Asia | 41 | 0.1% |
| Western Europe | 54 | 0.1% |
| Yemen | 13 | 0.0% | View All 48 Rows |
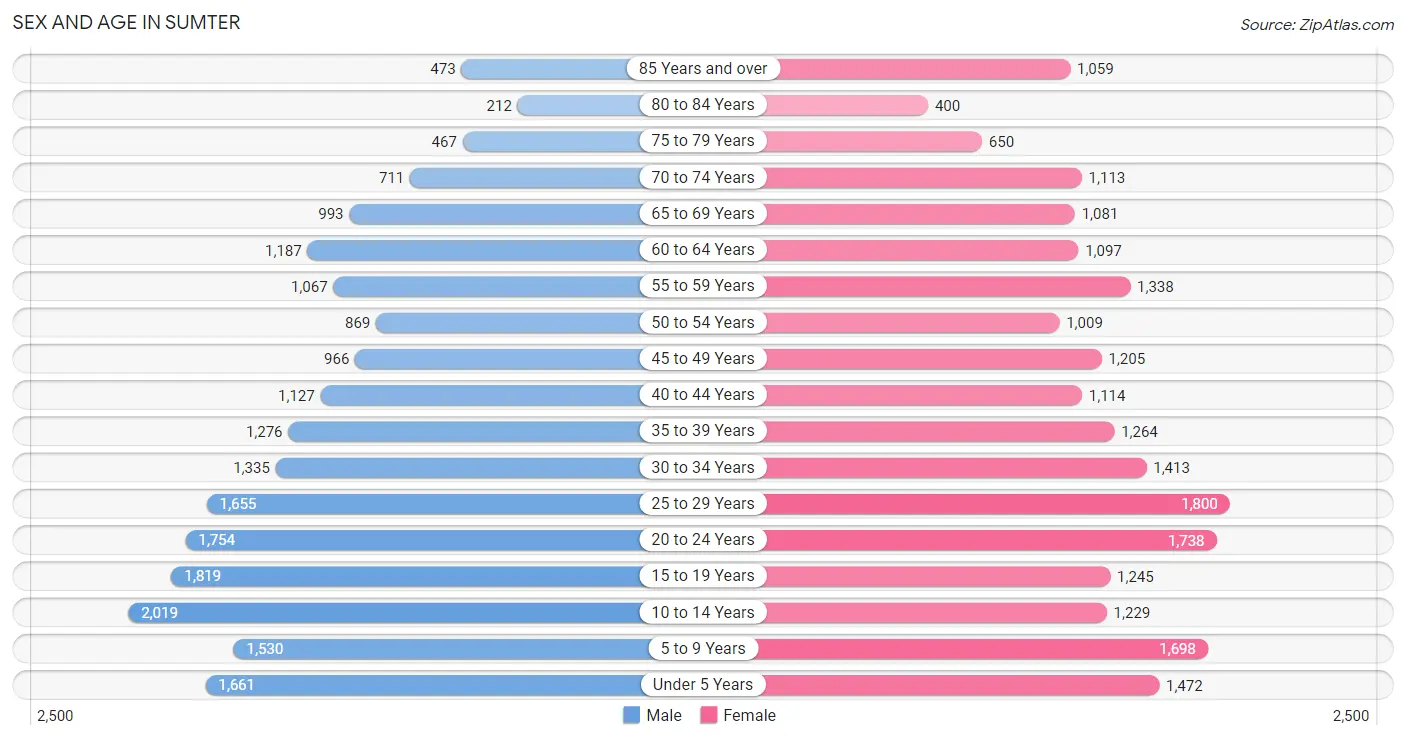
Sex and Age in Sumter
Sex and Age in Sumter
The most populous age groups in Sumter are 10 to 14 Years (2,019 | 9.6%) for men and 25 to 29 Years (1,800 | 8.2%) for women.
| Age Bracket | Male | Female |
| Under 5 Years | 1,661 (7.9%) | 1,472 (6.7%) |
| 5 to 9 Years | 1,530 (7.2%) | 1,698 (7.7%) |
| 10 to 14 Years | 2,019 (9.6%) | 1,229 (5.6%) |
| 15 to 19 Years | 1,819 (8.6%) | 1,245 (5.7%) |
| 20 to 24 Years | 1,754 (8.3%) | 1,738 (7.9%) |
| 25 to 29 Years | 1,655 (7.8%) | 1,800 (8.2%) |
| 30 to 34 Years | 1,335 (6.3%) | 1,413 (6.4%) |
| 35 to 39 Years | 1,276 (6.0%) | 1,264 (5.8%) |
| 40 to 44 Years | 1,127 (5.3%) | 1,114 (5.1%) |
| 45 to 49 Years | 966 (4.6%) | 1,205 (5.5%) |
| 50 to 54 Years | 869 (4.1%) | 1,009 (4.6%) |
| 55 to 59 Years | 1,067 (5.1%) | 1,338 (6.1%) |
| 60 to 64 Years | 1,187 (5.6%) | 1,097 (5.0%) |
| 65 to 69 Years | 993 (4.7%) | 1,081 (4.9%) |
| 70 to 74 Years | 711 (3.4%) | 1,113 (5.1%) |
| 75 to 79 Years | 467 (2.2%) | 650 (3.0%) |
| 80 to 84 Years | 212 (1.0%) | 400 (1.8%) |
| 85 Years and over | 473 (2.2%) | 1,059 (4.8%) |
| Total | 21,121 (100.0%) | 21,925 (100.0%) |
Families and Households in Sumter
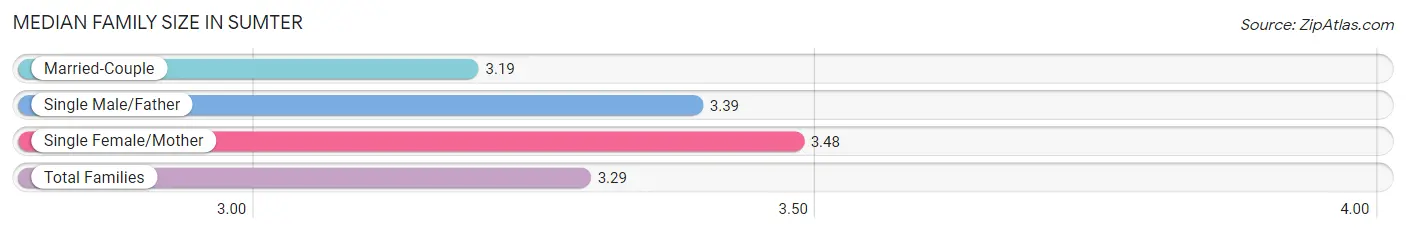
Median Family Size in Sumter
The median family size in Sumter is 3.29 persons per family, with single female/mother families (2,960 | 28.6%) accounting for the largest median family size of 3.48 persons per family. On the other hand, married-couple families (6,652 | 64.3%) represent the smallest median family size with 3.19 persons per family.
| Family Type | # Families | Family Size |
| Married-Couple | 6,652 (64.3%) | 3.19 |
| Single Male/Father | 725 (7.0%) | 3.39 |
| Single Female/Mother | 2,960 (28.6%) | 3.48 |
| Total Families | 10,337 (100.0%) | 3.29 |
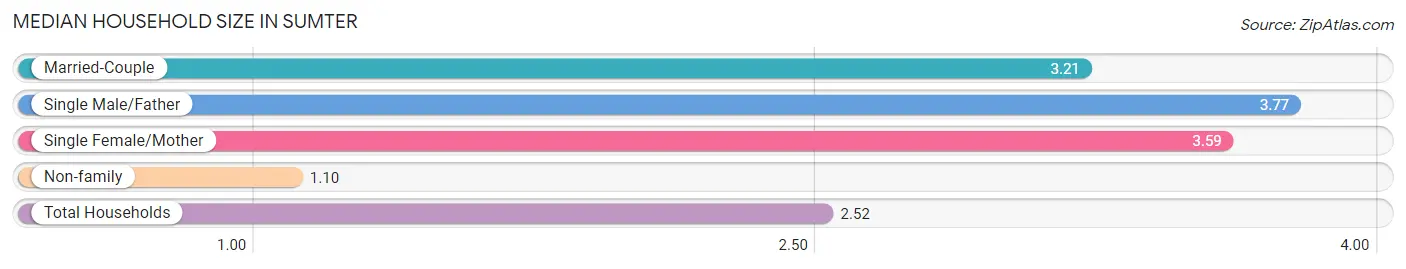
Median Household Size in Sumter
The median household size in Sumter is 2.52 persons per household, with single male/father households (725 | 4.4%) accounting for the largest median household size of 3.77 persons per household. non-family households (6,057 | 36.9%) represent the smallest median household size with 1.10 persons per household.
| Household Type | # Households | Household Size |
| Married-Couple | 6,652 (40.6%) | 3.21 |
| Single Male/Father | 725 (4.4%) | 3.77 |
| Single Female/Mother | 2,960 (18.1%) | 3.59 |
| Non-family | 6,057 (36.9%) | 1.10 |
| Total Households | 16,394 (100.0%) | 2.52 |
Household Size by Marriage Status in Sumter
Out of a total of 16,394 households in Sumter, 10,337 (63.0%) are family households, while 6,057 (36.9%) are nonfamily households. The most numerous type of family households are 2-person households, comprising 4,784, and the most common type of nonfamily households are 1-person households, comprising 5,527.
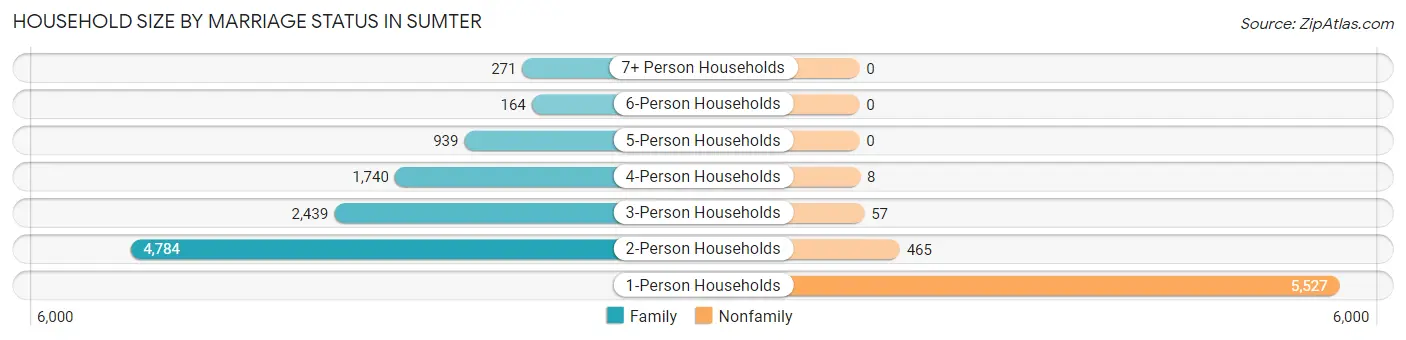
| Household Size | Family Households | Nonfamily Households |
| 1-Person Households | - | 5,527 (33.7%) |
| 2-Person Households | 4,784 (29.2%) | 465 (2.8%) |
| 3-Person Households | 2,439 (14.9%) | 57 (0.4%) |
| 4-Person Households | 1,740 (10.6%) | 8 (0.1%) |
| 5-Person Households | 939 (5.7%) | 0 (0.0%) |
| 6-Person Households | 164 (1.0%) | 0 (0.0%) |
| 7+ Person Households | 271 (1.7%) | 0 (0.0%) |
| Total | 10,337 (63.0%) | 6,057 (36.9%) |
Female Fertility in Sumter
Fertility by Age in Sumter
Average fertility rate in Sumter is 71.0 births per 1,000 women. Women in the age bracket of 20 to 34 years have the highest fertility rate with 137.0 births per 1,000 women. Women in the age bracket of 20 to 34 years acount for 95.8% of all women with births.
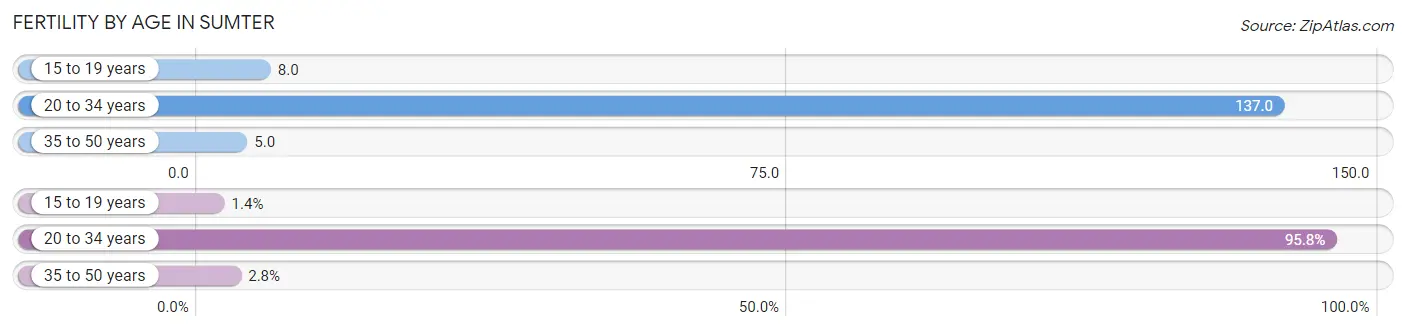
| Age Bracket | Women with Births | Births / 1,000 Women |
| 15 to 19 years | 10 (1.4%) | 8.0 |
| 20 to 34 years | 680 (95.8%) | 137.0 |
| 35 to 50 years | 20 (2.8%) | 5.0 |
| Total | 710 (100.0%) | 71.0 |
Fertility by Age by Marriage Status in Sumter
49.6% of women with births (710) in Sumter are married. The highest percentage of unmarried women with births falls into 20 to 34 years age bracket with 52.6% of them unmarried at the time of birth, while the lowest percentage of unmarried women with births belong to 15 to 19 years age bracket with 0.0% of them unmarried.
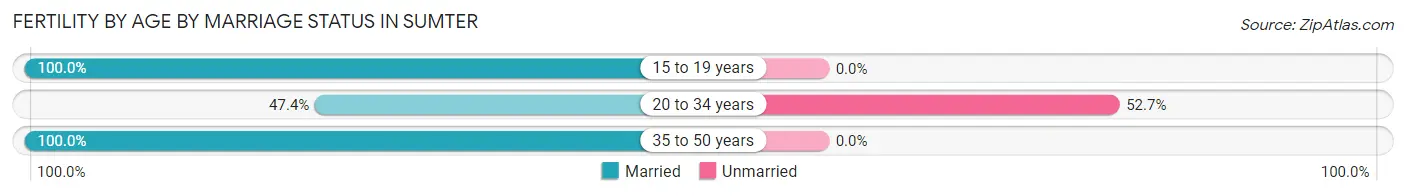
| Age Bracket | Married | Unmarried |
| 15 to 19 years | 10 (100.0%) | 0 (0.0%) |
| 20 to 34 years | 322 (47.3%) | 358 (52.6%) |
| 35 to 50 years | 20 (100.0%) | 0 (0.0%) |
| Total | 352 (49.6%) | 358 (50.4%) |
Fertility by Education in Sumter
Average fertility rate in Sumter is 71.0 births per 1,000 women. Women with the education attainment of college or associate's degree have the highest fertility rate of 96.0 births per 1,000 women, while women with the education attainment of graduate degree have the lowest fertility at 48.0 births per 1,000 women. Women with the education attainment of college or associate's degree represent 51.3% of all women with births.
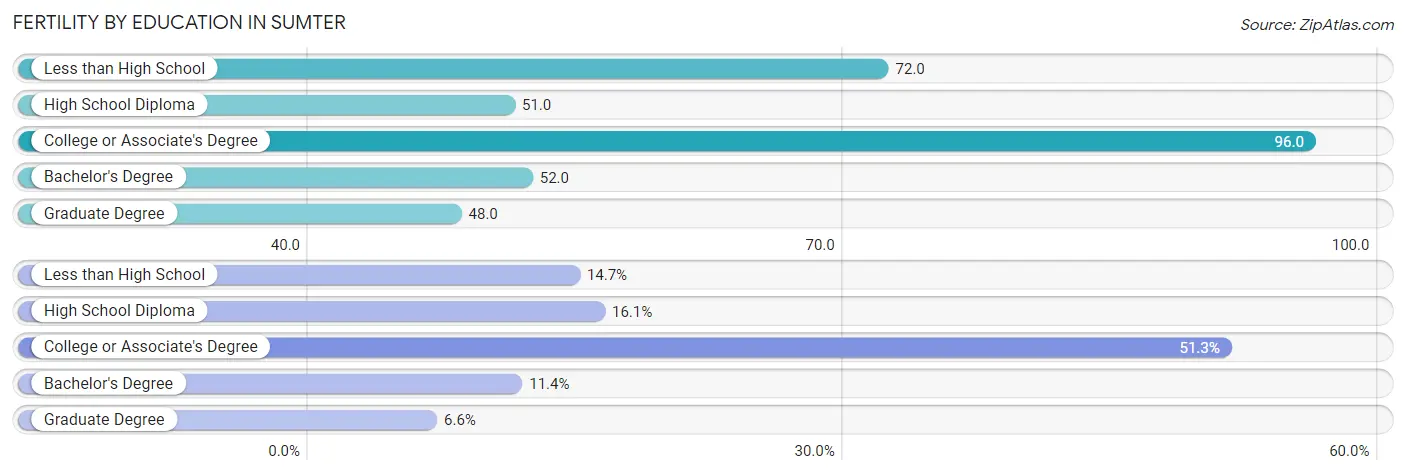
| Educational Attainment | Women with Births | Births / 1,000 Women |
| Less than High School | 104 (14.6%) | 72.0 |
| High School Diploma | 114 (16.1%) | 51.0 |
| College or Associate's Degree | 364 (51.3%) | 96.0 |
| Bachelor's Degree | 81 (11.4%) | 52.0 |
| Graduate Degree | 47 (6.6%) | 48.0 |
| Total | 710 (100.0%) | 71.0 |
Fertility by Education by Marriage Status in Sumter
50.4% of women with births in Sumter are unmarried. Women with the educational attainment of bachelor's degree are most likely to be married with 100.0% of them married at childbirth, while women with the educational attainment of less than high school are least likely to be married with 90.4% of them unmarried at childbirth.
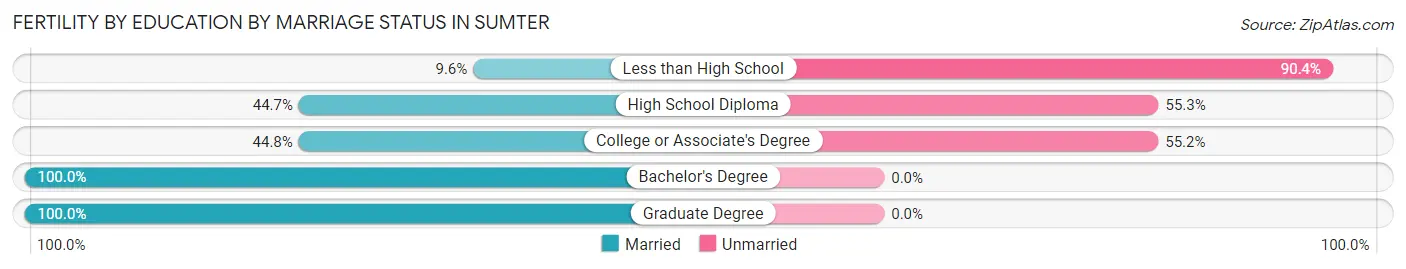
| Educational Attainment | Married | Unmarried |
| Less than High School | 10 (9.6%) | 94 (90.4%) |
| High School Diploma | 51 (44.7%) | 63 (55.3%) |
| College or Associate's Degree | 163 (44.8%) | 201 (55.2%) |
| Bachelor's Degree | 81 (100.0%) | 0 (0.0%) |
| Graduate Degree | 47 (100.0%) | 0 (0.0%) |
| Total | 352 (49.6%) | 358 (50.4%) |
Employment Characteristics in Sumter
Employment by Class of Employer in Sumter
Among the 17,993 employed individuals in Sumter, private company employees (10,218 | 56.8%), federal government employees (3,226 | 17.9%), and not-for-profit organizations (1,319 | 7.3%) make up the most common classes of employment.
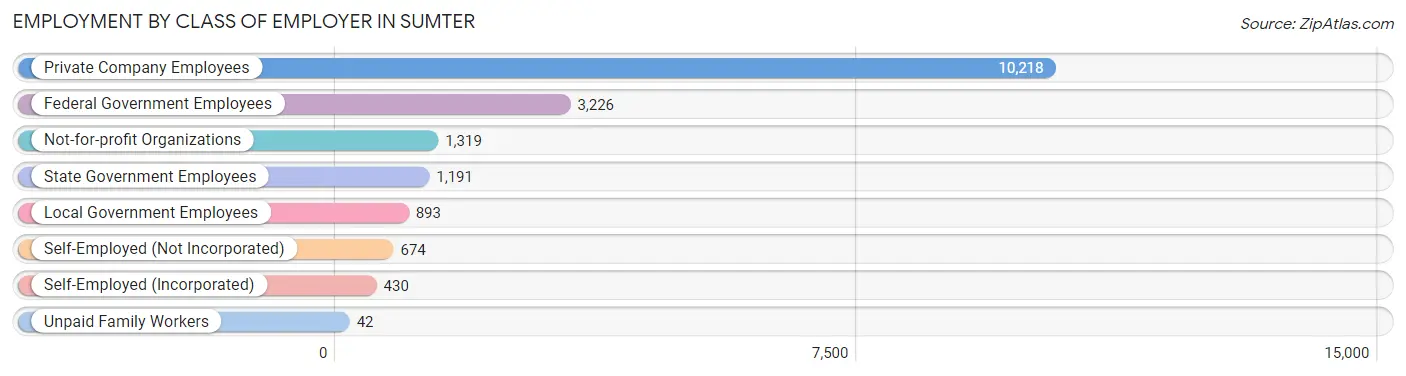
| Employer Class | # Employees | % Employees |
| Private Company Employees | 10,218 | 56.8% |
| Self-Employed (Incorporated) | 430 | 2.4% |
| Self-Employed (Not Incorporated) | 674 | 3.7% |
| Not-for-profit Organizations | 1,319 | 7.3% |
| Local Government Employees | 893 | 5.0% |
| State Government Employees | 1,191 | 6.6% |
| Federal Government Employees | 3,226 | 17.9% |
| Unpaid Family Workers | 42 | 0.2% |
| Total | 17,993 | 100.0% |
Employment Status by Age in Sumter
According to the labor force statistics for Sumter, out of the total population over 16 years of age (32,855), 60.0% or 19,713 individuals are in the labor force, with 7.8% or 1,538 of them unemployed. The age group with the highest labor force participation rate is 30 to 34 years, with 85.2% or 2,341 individuals in the labor force. Within the labor force, the 16 to 19 years age range has the highest percentage of unemployed individuals, with 13.4% or 146 of them being unemployed.
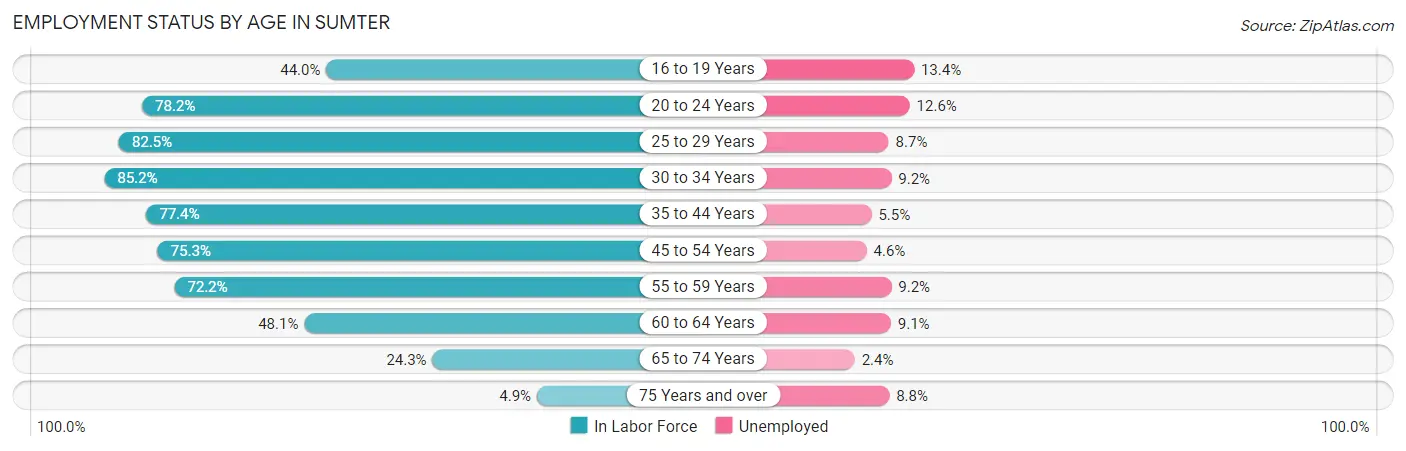
| Age Bracket | In Labor Force | Unemployed |
| 16 to 19 Years | 1,092 (44.0%) | 146 (13.4%) |
| 20 to 24 Years | 2,731 (78.2%) | 344 (12.6%) |
| 25 to 29 Years | 2,850 (82.5%) | 248 (8.7%) |
| 30 to 34 Years | 2,341 (85.2%) | 215 (9.2%) |
| 35 to 44 Years | 3,700 (77.4%) | 204 (5.5%) |
| 45 to 54 Years | 3,049 (75.3%) | 140 (4.6%) |
| 55 to 59 Years | 1,736 (72.2%) | 160 (9.2%) |
| 60 to 64 Years | 1,099 (48.1%) | 100 (9.1%) |
| 65 to 74 Years | 947 (24.3%) | 23 (2.4%) |
| 75 Years and over | 160 (4.9%) | 14 (8.8%) |
| Total | 19,713 (60.0%) | 1,538 (7.8%) |
Employment Status by Educational Attainment in Sumter
According to labor force statistics for Sumter, 74.9% of individuals (14,772) out of the total population between 25 and 64 years of age (19,722) are in the labor force, with 7.2% or 1,064 of them being unemployed. The group with the highest labor force participation rate are those with the educational attainment of bachelor's degree or higher, with 85.5% or 4,646 individuals in the labor force. Within the labor force, individuals with high school diploma education have the highest percentage of unemployment, with 9.3% or 349 of them being unemployed.
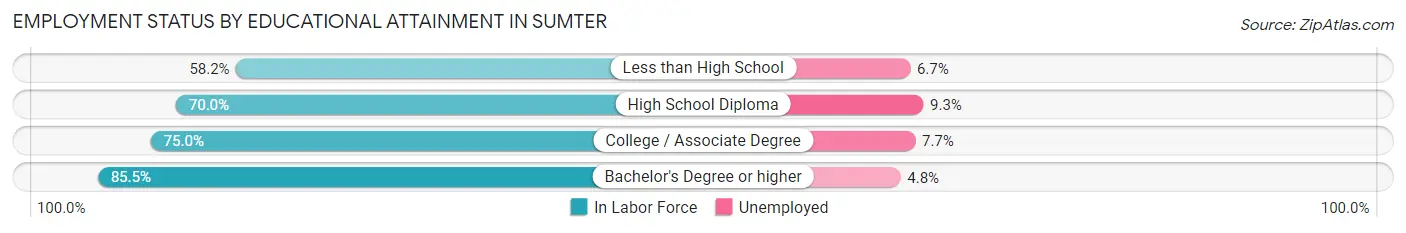
| Educational Attainment | In Labor Force | Unemployed |
| Less than High School | 1,097 (58.2%) | 126 (6.7%) |
| High School Diploma | 3,750 (70.0%) | 498 (9.3%) |
| College / Associate Degree | 5,284 (75.0%) | 543 (7.7%) |
| Bachelor's Degree or higher | 4,646 (85.5%) | 261 (4.8%) |
| Total | 14,772 (74.9%) | 1,420 (7.2%) |
Employment Occupations by Sex in Sumter
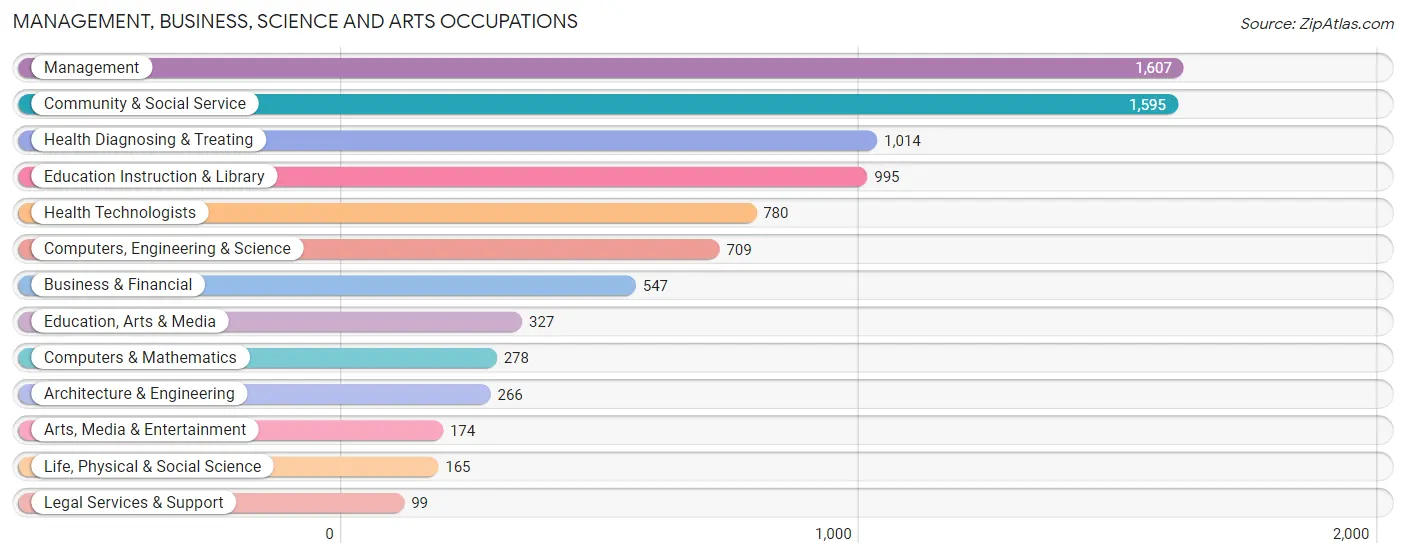
Management, Business, Science and Arts Occupations
The most common Management, Business, Science and Arts occupations in Sumter are Management (1,607 | 10.1%), Community & Social Service (1,595 | 10.0%), Health Diagnosing & Treating (1,014 | 6.4%), Education Instruction & Library (995 | 6.2%), and Health Technologists (780 | 4.9%).
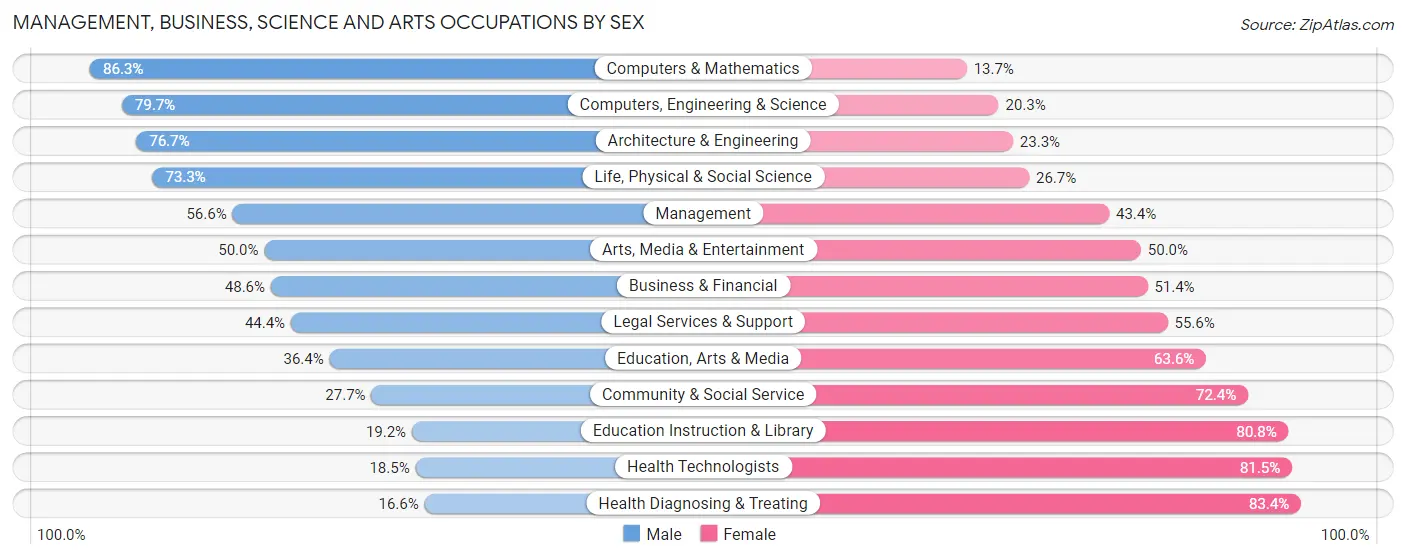
Management, Business, Science and Arts Occupations by Sex
Within the Management, Business, Science and Arts occupations in Sumter, the most male-oriented occupations are Computers & Mathematics (86.3%), Computers, Engineering & Science (79.7%), and Architecture & Engineering (76.7%), while the most female-oriented occupations are Health Diagnosing & Treating (83.4%), Health Technologists (81.5%), and Education Instruction & Library (80.8%).
| Occupation | Male | Female |
| Management | 910 (56.6%) | 697 (43.4%) |
| Business & Financial | 266 (48.6%) | 281 (51.4%) |
| Computers, Engineering & Science | 565 (79.7%) | 144 (20.3%) |
| Computers & Mathematics | 240 (86.3%) | 38 (13.7%) |
| Architecture & Engineering | 204 (76.7%) | 62 (23.3%) |
| Life, Physical & Social Science | 121 (73.3%) | 44 (26.7%) |
| Community & Social Service | 441 (27.7%) | 1,154 (72.4%) |
| Education, Arts & Media | 119 (36.4%) | 208 (63.6%) |
| Legal Services & Support | 44 (44.4%) | 55 (55.6%) |
| Education Instruction & Library | 191 (19.2%) | 804 (80.8%) |
| Arts, Media & Entertainment | 87 (50.0%) | 87 (50.0%) |
| Health Diagnosing & Treating | 168 (16.6%) | 846 (83.4%) |
| Health Technologists | 144 (18.5%) | 636 (81.5%) |
| Total (Category) | 2,350 (42.9%) | 3,122 (57.1%) |
| Total (Overall) | 7,470 (46.9%) | 8,460 (53.1%) |
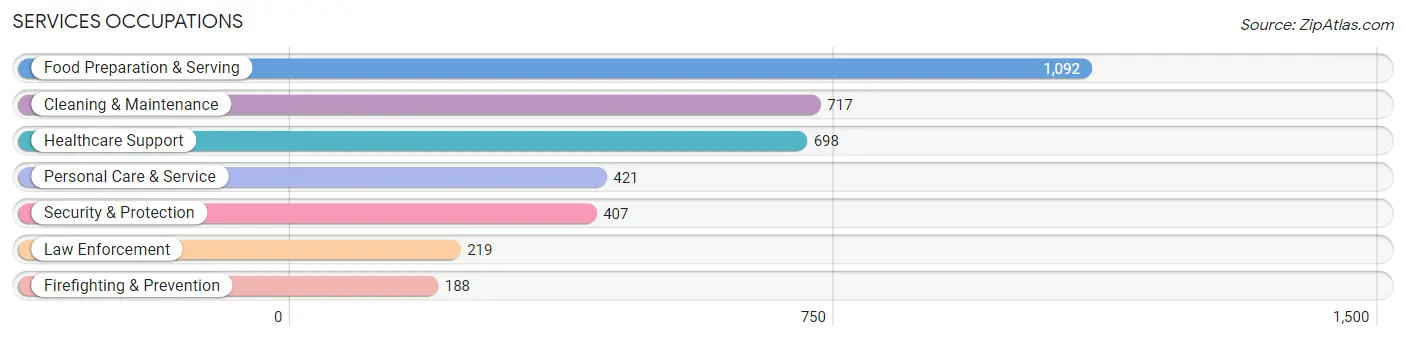
Services Occupations
The most common Services occupations in Sumter are Food Preparation & Serving (1,092 | 6.9%), Cleaning & Maintenance (717 | 4.5%), Healthcare Support (698 | 4.4%), Personal Care & Service (421 | 2.6%), and Security & Protection (407 | 2.5%).
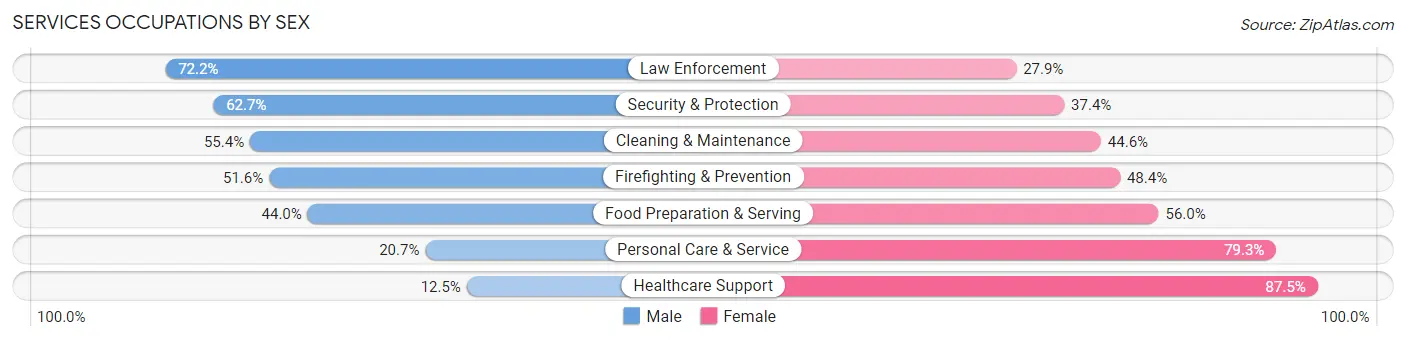
Services Occupations by Sex
Within the Services occupations in Sumter, the most male-oriented occupations are Law Enforcement (72.2%), Security & Protection (62.6%), and Cleaning & Maintenance (55.4%), while the most female-oriented occupations are Healthcare Support (87.5%), Personal Care & Service (79.3%), and Food Preparation & Serving (56.0%).
| Occupation | Male | Female |
| Healthcare Support | 87 (12.5%) | 611 (87.5%) |
| Security & Protection | 255 (62.6%) | 152 (37.3%) |
| Firefighting & Prevention | 97 (51.6%) | 91 (48.4%) |
| Law Enforcement | 158 (72.2%) | 61 (27.9%) |
| Food Preparation & Serving | 480 (44.0%) | 612 (56.0%) |
| Cleaning & Maintenance | 397 (55.4%) | 320 (44.6%) |
| Personal Care & Service | 87 (20.7%) | 334 (79.3%) |
| Total (Category) | 1,306 (39.2%) | 2,029 (60.8%) |
| Total (Overall) | 7,470 (46.9%) | 8,460 (53.1%) |
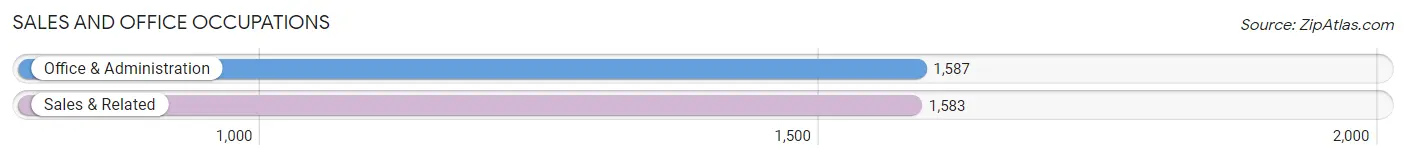
Sales and Office Occupations
The most common Sales and Office occupations in Sumter are Office & Administration (1,587 | 10.0%), and Sales & Related (1,583 | 9.9%).
Sales and Office Occupations by Sex
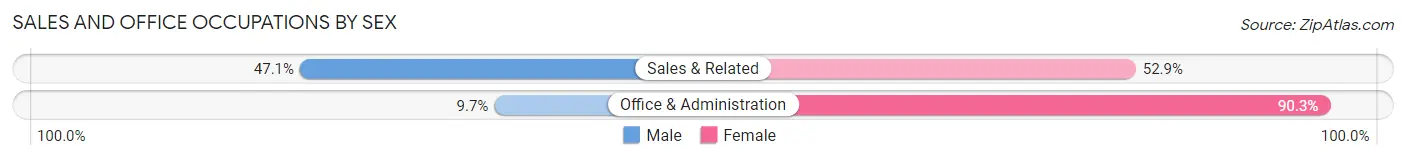
| Occupation | Male | Female |
| Sales & Related | 745 (47.1%) | 838 (52.9%) |
| Office & Administration | 154 (9.7%) | 1,433 (90.3%) |
| Total (Category) | 899 (28.4%) | 2,271 (71.6%) |
| Total (Overall) | 7,470 (46.9%) | 8,460 (53.1%) |
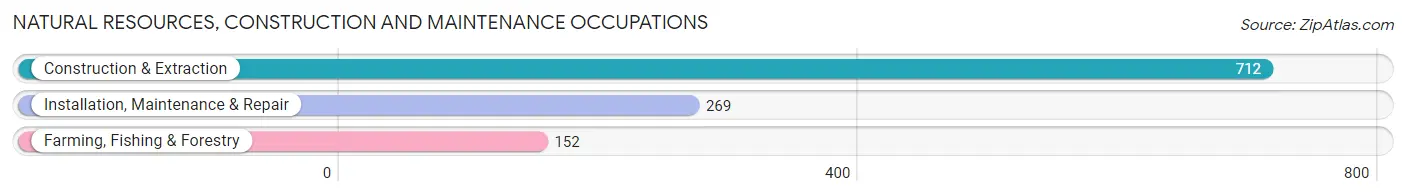
Natural Resources, Construction and Maintenance Occupations
The most common Natural Resources, Construction and Maintenance occupations in Sumter are Construction & Extraction (712 | 4.5%), Installation, Maintenance & Repair (269 | 1.7%), and Farming, Fishing & Forestry (152 | 0.9%).
Natural Resources, Construction and Maintenance Occupations by Sex
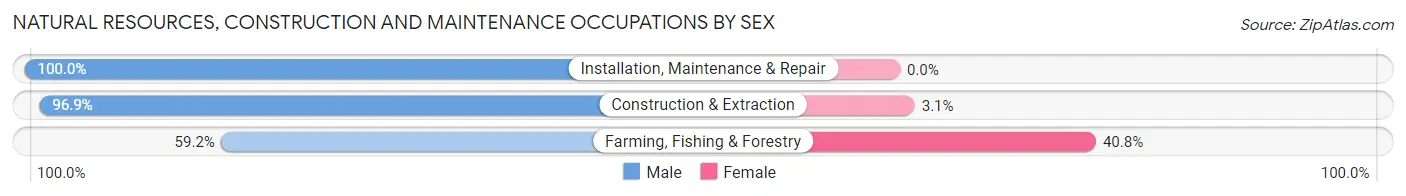
| Occupation | Male | Female |
| Farming, Fishing & Forestry | 90 (59.2%) | 62 (40.8%) |
| Construction & Extraction | 690 (96.9%) | 22 (3.1%) |
| Installation, Maintenance & Repair | 269 (100.0%) | 0 (0.0%) |
| Total (Category) | 1,049 (92.6%) | 84 (7.4%) |
| Total (Overall) | 7,470 (46.9%) | 8,460 (53.1%) |
Production, Transportation and Moving Occupations
The most common Production, Transportation and Moving occupations in Sumter are Production (1,751 | 11.0%), Material Moving (686 | 4.3%), and Transportation (383 | 2.4%).
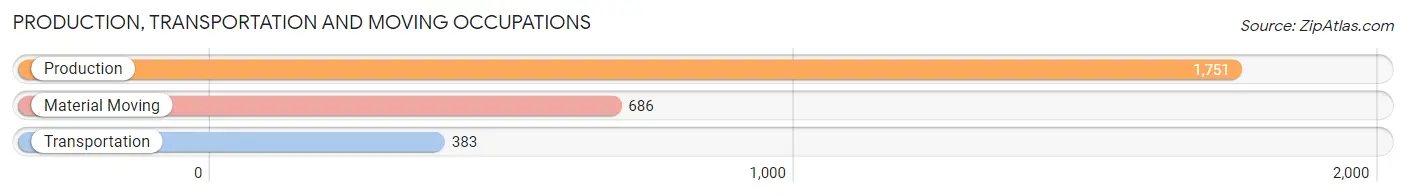
Production, Transportation and Moving Occupations by Sex
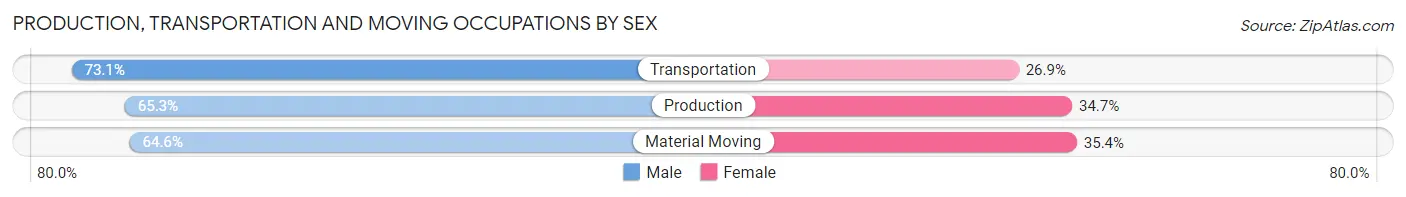
| Occupation | Male | Female |
| Production | 1,143 (65.3%) | 608 (34.7%) |
| Transportation | 280 (73.1%) | 103 (26.9%) |
| Material Moving | 443 (64.6%) | 243 (35.4%) |
| Total (Category) | 1,866 (66.2%) | 954 (33.8%) |
| Total (Overall) | 7,470 (46.9%) | 8,460 (53.1%) |
Employment Industries by Sex in Sumter
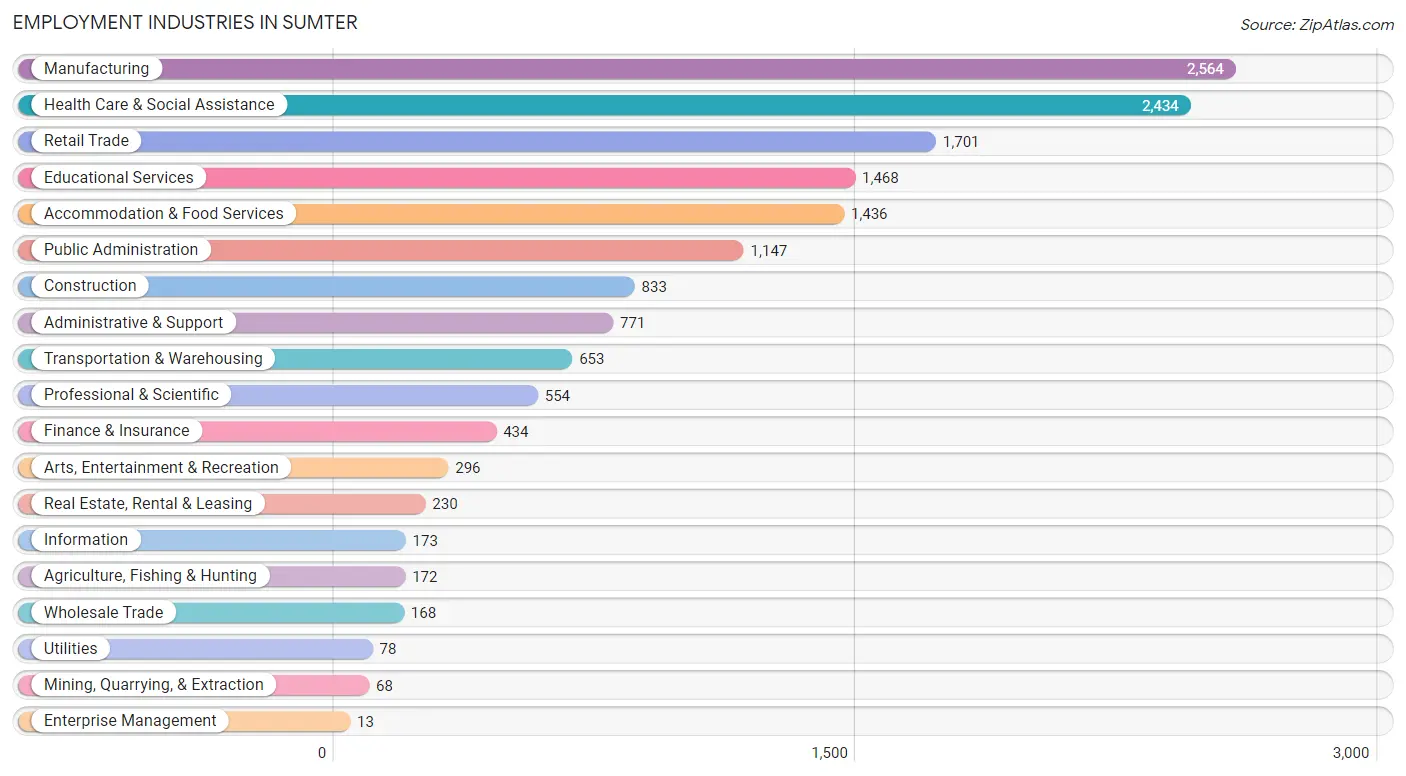
Employment Industries in Sumter
The major employment industries in Sumter include Manufacturing (2,564 | 16.1%), Health Care & Social Assistance (2,434 | 15.3%), Retail Trade (1,701 | 10.7%), Educational Services (1,468 | 9.2%), and Accommodation & Food Services (1,436 | 9.0%).
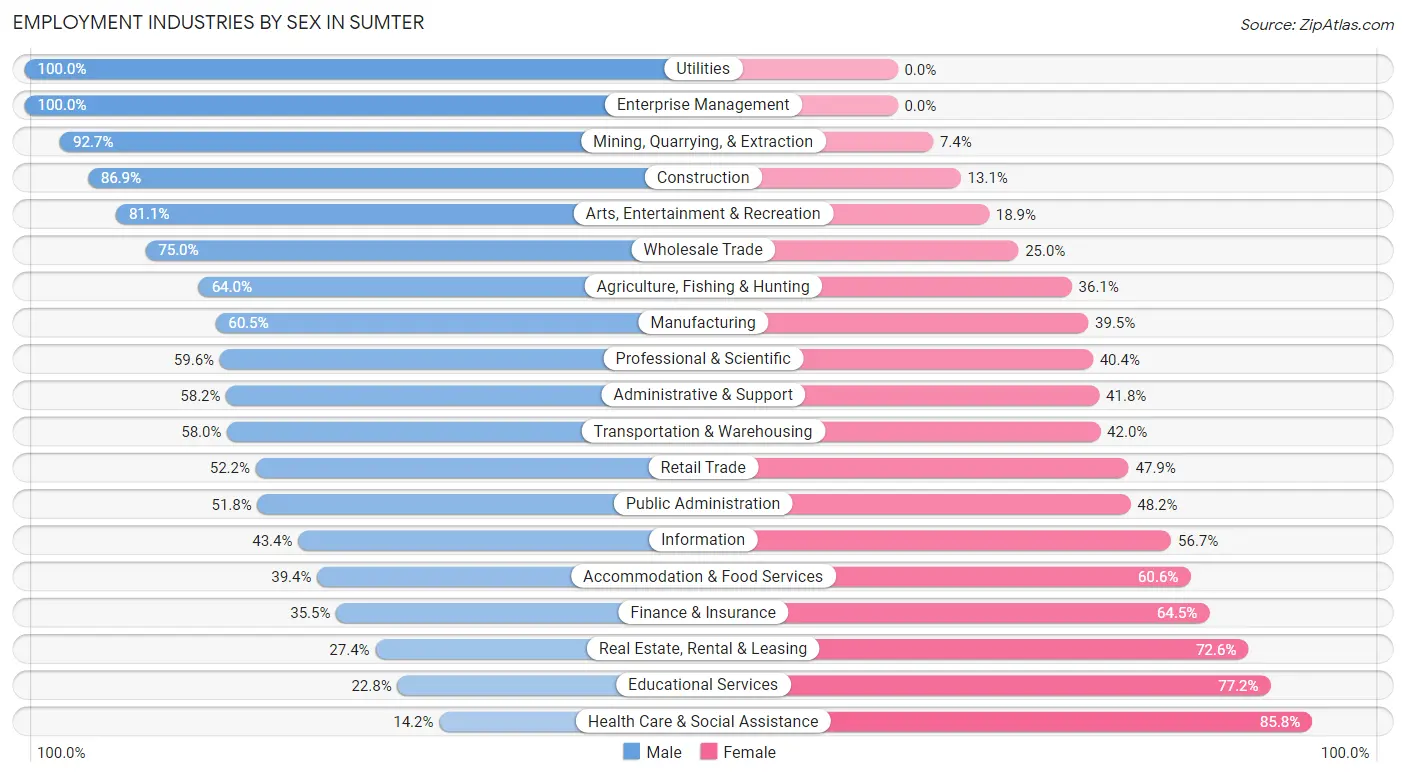
Employment Industries by Sex in Sumter
The Sumter industries that see more men than women are Utilities (100.0%), Enterprise Management (100.0%), and Mining, Quarrying, & Extraction (92.6%), whereas the industries that tend to have a higher number of women are Health Care & Social Assistance (85.8%), Educational Services (77.2%), and Real Estate, Rental & Leasing (72.6%).
| Industry | Male | Female |
| Agriculture, Fishing & Hunting | 110 (63.9%) | 62 (36.0%) |
| Mining, Quarrying, & Extraction | 63 (92.6%) | 5 (7.3%) |
| Construction | 724 (86.9%) | 109 (13.1%) |
| Manufacturing | 1,552 (60.5%) | 1,012 (39.5%) |
| Wholesale Trade | 126 (75.0%) | 42 (25.0%) |
| Retail Trade | 887 (52.1%) | 814 (47.8%) |
| Transportation & Warehousing | 379 (58.0%) | 274 (42.0%) |
| Utilities | 78 (100.0%) | 0 (0.0%) |
| Information | 75 (43.3%) | 98 (56.7%) |
| Finance & Insurance | 154 (35.5%) | 280 (64.5%) |
| Real Estate, Rental & Leasing | 63 (27.4%) | 167 (72.6%) |
| Professional & Scientific | 330 (59.6%) | 224 (40.4%) |
| Enterprise Management | 13 (100.0%) | 0 (0.0%) |
| Administrative & Support | 449 (58.2%) | 322 (41.8%) |
| Educational Services | 335 (22.8%) | 1,133 (77.2%) |
| Health Care & Social Assistance | 345 (14.2%) | 2,089 (85.8%) |
| Arts, Entertainment & Recreation | 240 (81.1%) | 56 (18.9%) |
| Accommodation & Food Services | 566 (39.4%) | 870 (60.6%) |
| Public Administration | 594 (51.8%) | 553 (48.2%) |
| Total | 7,470 (46.9%) | 8,460 (53.1%) |
Education in Sumter
School Enrollment in Sumter
The most common levels of schooling among the 12,101 students in Sumter are college / undergraduate (2,686 | 22.2%), middle school (2,618 | 21.6%), and elementary school (2,491 | 20.6%).
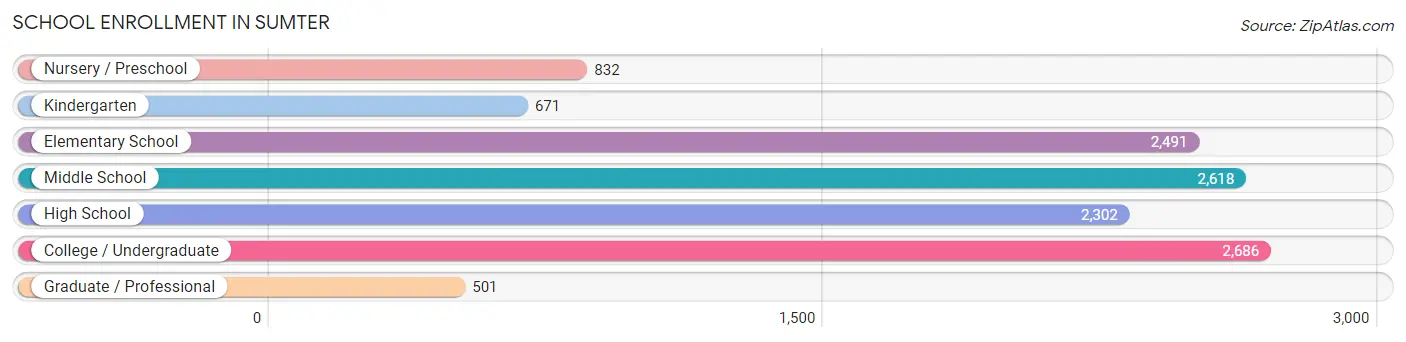
| School Level | # Students | % Students |
| Nursery / Preschool | 832 | 6.9% |
| Kindergarten | 671 | 5.5% |
| Elementary School | 2,491 | 20.6% |
| Middle School | 2,618 | 21.6% |
| High School | 2,302 | 19.0% |
| College / Undergraduate | 2,686 | 22.2% |
| Graduate / Professional | 501 | 4.1% |
| Total | 12,101 | 100.0% |
School Enrollment by Age by Funding Source in Sumter
Out of a total of 12,101 students who are enrolled in schools in Sumter, 1,997 (16.5%) attend a private institution, while the remaining 10,104 (83.5%) are enrolled in public schools. The age group of 20 to 24 year olds has the highest likelihood of being enrolled in private schools, with 281 (29.9% in the age bracket) enrolled. Conversely, the age group of 25 to 34 year olds has the lowest likelihood of being enrolled in a private school, with 711 (97.1% in the age bracket) attending a public institution.
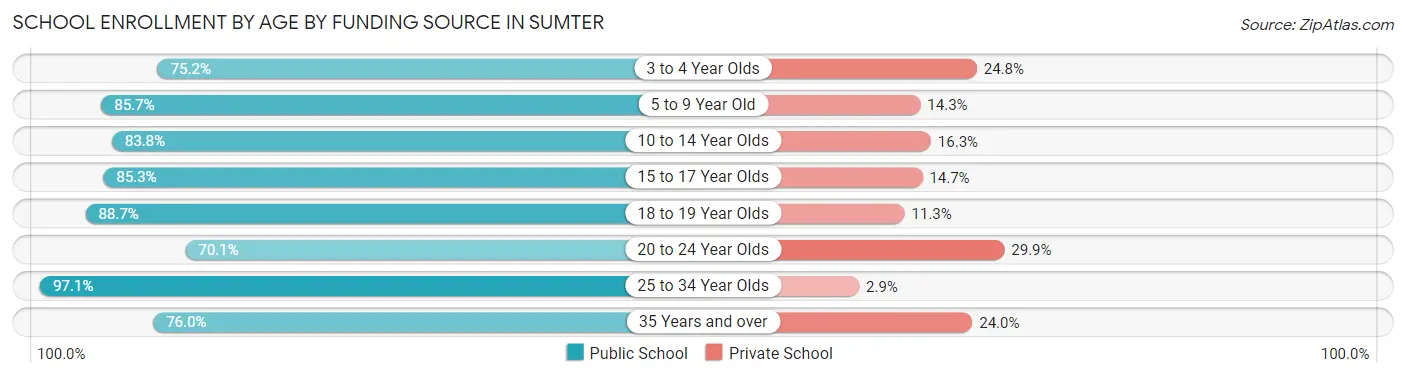
| Age Bracket | Public School | Private School |
| 3 to 4 Year Olds | 446 (75.2%) | 147 (24.8%) |
| 5 to 9 Year Old | 2,676 (85.7%) | 446 (14.3%) |
| 10 to 14 Year Olds | 2,603 (83.8%) | 505 (16.3%) |
| 15 to 17 Year Olds | 1,512 (85.3%) | 260 (14.7%) |
| 18 to 19 Year Olds | 735 (88.7%) | 94 (11.3%) |
| 20 to 24 Year Olds | 658 (70.1%) | 281 (29.9%) |
| 25 to 34 Year Olds | 711 (97.1%) | 21 (2.9%) |
| 35 Years and over | 765 (76.0%) | 241 (24.0%) |
| Total | 10,104 (83.5%) | 1,997 (16.5%) |
Educational Attainment by Field of Study in Sumter
Business (1,888 | 23.4%), education (1,208 | 15.0%), arts & humanities (969 | 12.0%), science & technology (779 | 9.7%), and social sciences (513 | 6.4%) are the most common fields of study among 8,068 individuals in Sumter who have obtained a bachelor's degree or higher.
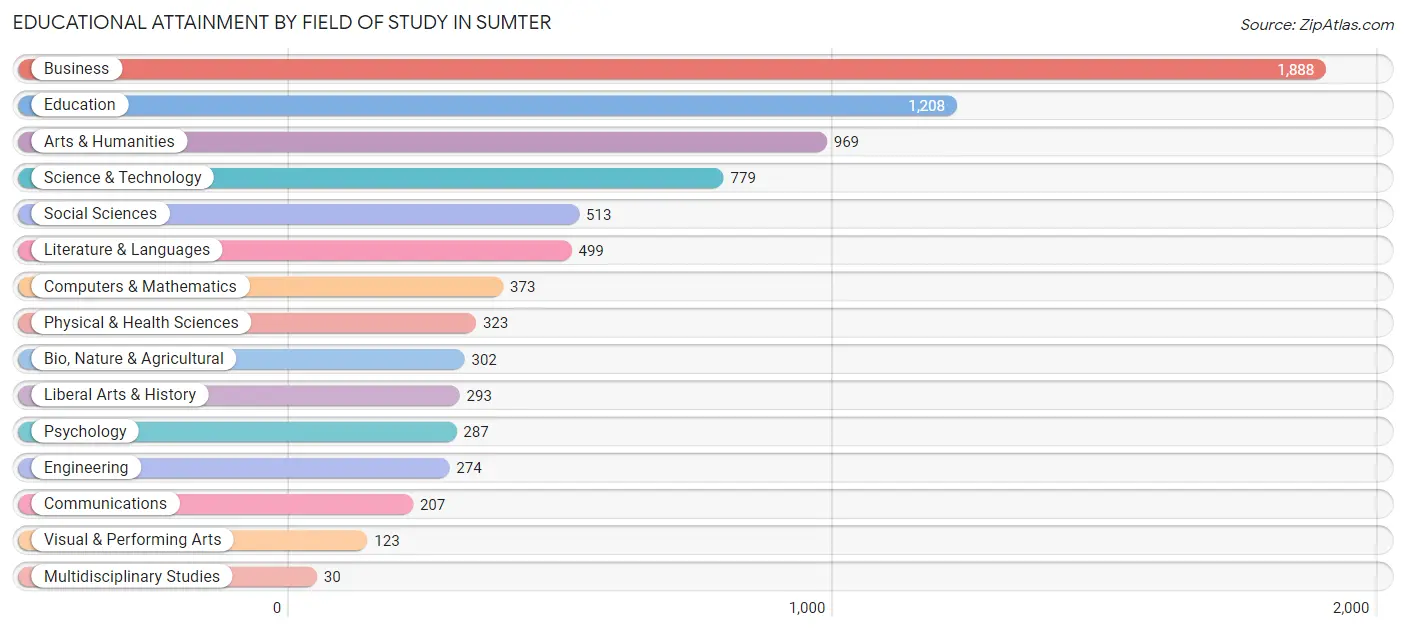
| Field of Study | # Graduates | % Graduates |
| Computers & Mathematics | 373 | 4.6% |
| Bio, Nature & Agricultural | 302 | 3.7% |
| Physical & Health Sciences | 323 | 4.0% |
| Psychology | 287 | 3.6% |
| Social Sciences | 513 | 6.4% |
| Engineering | 274 | 3.4% |
| Multidisciplinary Studies | 30 | 0.4% |
| Science & Technology | 779 | 9.7% |
| Business | 1,888 | 23.4% |
| Education | 1,208 | 15.0% |
| Literature & Languages | 499 | 6.2% |
| Liberal Arts & History | 293 | 3.6% |
| Visual & Performing Arts | 123 | 1.5% |
| Communications | 207 | 2.6% |
| Arts & Humanities | 969 | 12.0% |
| Total | 8,068 | 100.0% |
Transportation & Commute in Sumter
Vehicle Availability by Sex in Sumter
The most prevalent vehicle ownership categories in Sumter are males with 2 vehicles (3,489, accounting for 39.8%) and females with 2 vehicles (3,293, making up 40.5%).
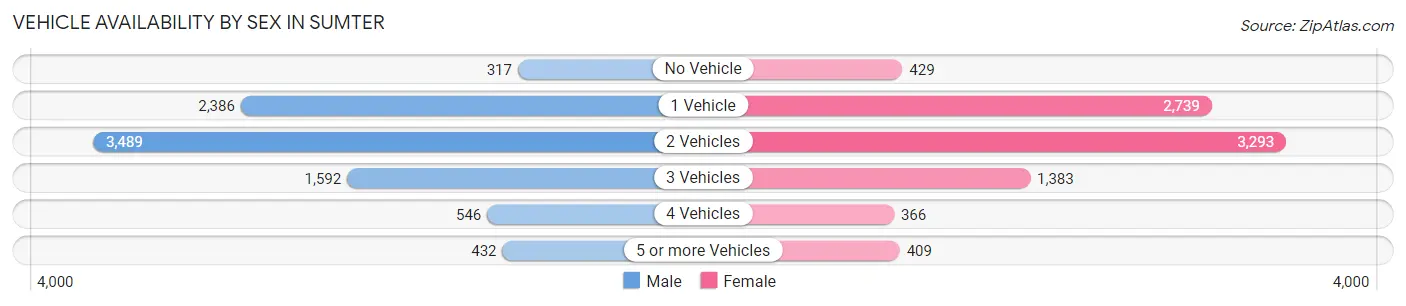
| Vehicles Available | Male | Female |
| No Vehicle | 317 (3.6%) | 429 (5.0%) |
| 1 Vehicle | 2,386 (27.2%) | 2,739 (31.8%) |
| 2 Vehicles | 3,489 (39.8%) | 3,293 (38.2%) |
| 3 Vehicles | 1,592 (18.2%) | 1,383 (16.1%) |
| 4 Vehicles | 546 (6.2%) | 366 (4.3%) |
| 5 or more Vehicles | 432 (4.9%) | 409 (4.8%) |
| Total | 8,762 (100.0%) | 8,619 (100.0%) |
Commute Time in Sumter
The most frequently occuring commute durations in Sumter are 10 to 14 minutes (4,958 commuters, 29.0%), 15 to 19 minutes (3,639 commuters, 21.3%), and 5 to 9 minutes (2,654 commuters, 15.5%).
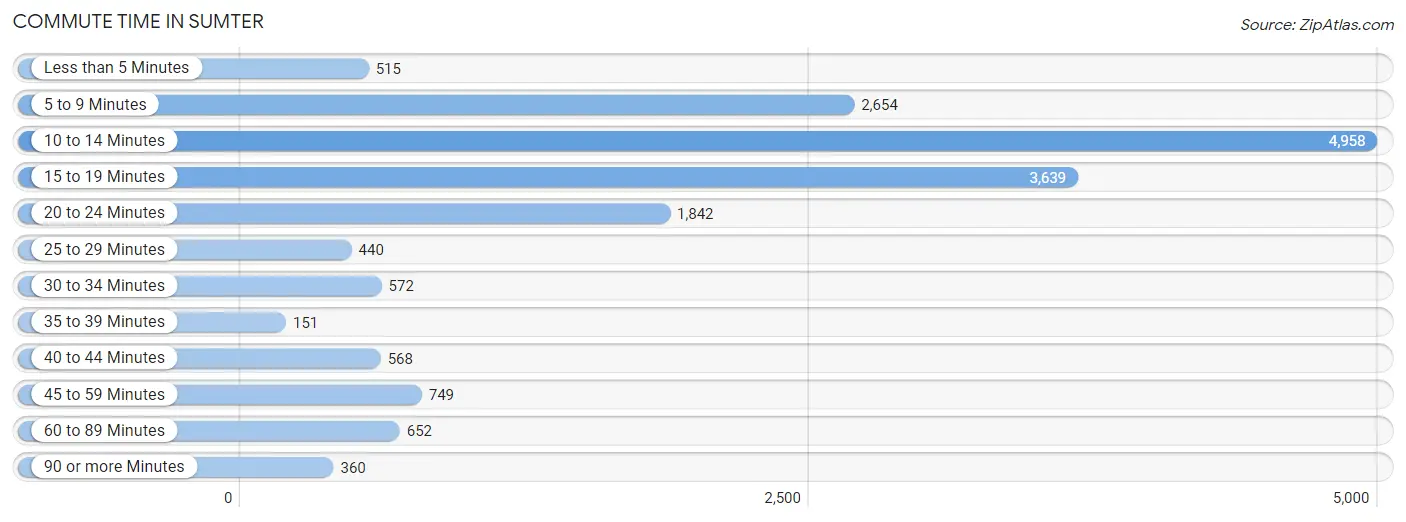
| Commute Time | # Commuters | % Commuters |
| Less than 5 Minutes | 515 | 3.0% |
| 5 to 9 Minutes | 2,654 | 15.5% |
| 10 to 14 Minutes | 4,958 | 29.0% |
| 15 to 19 Minutes | 3,639 | 21.3% |
| 20 to 24 Minutes | 1,842 | 10.8% |
| 25 to 29 Minutes | 440 | 2.6% |
| 30 to 34 Minutes | 572 | 3.4% |
| 35 to 39 Minutes | 151 | 0.9% |
| 40 to 44 Minutes | 568 | 3.3% |
| 45 to 59 Minutes | 749 | 4.4% |
| 60 to 89 Minutes | 652 | 3.8% |
| 90 or more Minutes | 360 | 2.1% |
Commute Time by Sex in Sumter
The most common commute times in Sumter are 10 to 14 minutes (2,496 commuters, 28.4%) for males and 10 to 14 minutes (2,462 commuters, 29.7%) for females.
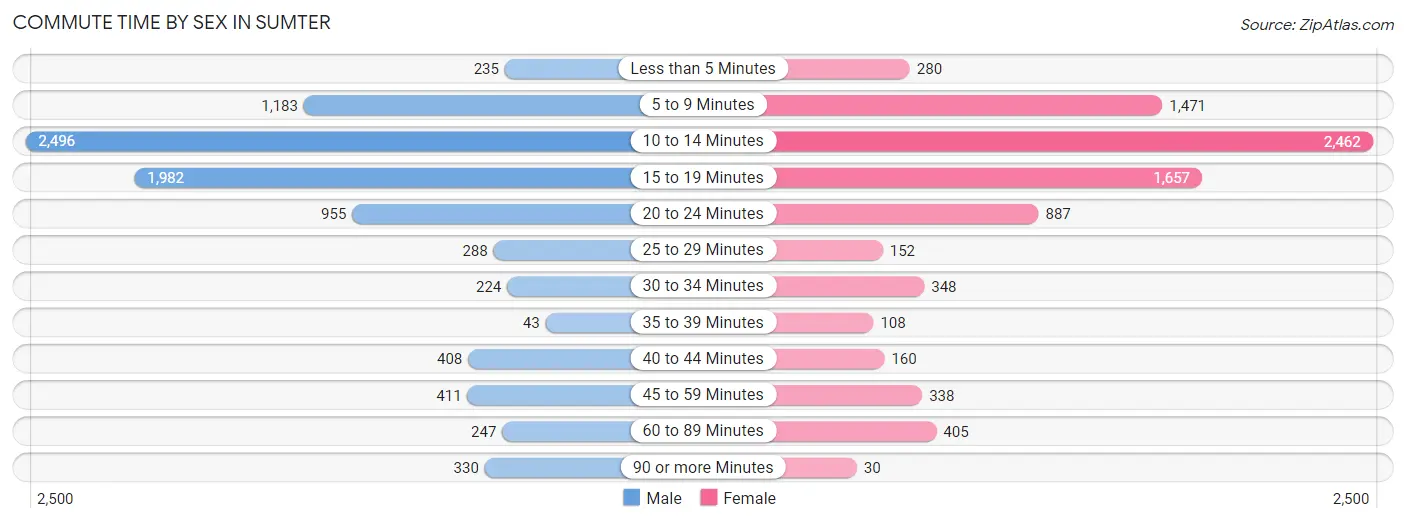
| Commute Time | Male | Female |
| Less than 5 Minutes | 235 (2.7%) | 280 (3.4%) |
| 5 to 9 Minutes | 1,183 (13.4%) | 1,471 (17.7%) |
| 10 to 14 Minutes | 2,496 (28.4%) | 2,462 (29.7%) |
| 15 to 19 Minutes | 1,982 (22.5%) | 1,657 (20.0%) |
| 20 to 24 Minutes | 955 (10.8%) | 887 (10.7%) |
| 25 to 29 Minutes | 288 (3.3%) | 152 (1.8%) |
| 30 to 34 Minutes | 224 (2.5%) | 348 (4.2%) |
| 35 to 39 Minutes | 43 (0.5%) | 108 (1.3%) |
| 40 to 44 Minutes | 408 (4.6%) | 160 (1.9%) |
| 45 to 59 Minutes | 411 (4.7%) | 338 (4.1%) |
| 60 to 89 Minutes | 247 (2.8%) | 405 (4.9%) |
| 90 or more Minutes | 330 (3.7%) | 30 (0.4%) |
Time of Departure to Work by Sex in Sumter
The most frequent times of departure to work in Sumter are 7:00 AM to 7:29 AM (1,278, 14.5%) for males and 8:00 AM to 8:29 AM (1,139, 13.7%) for females.
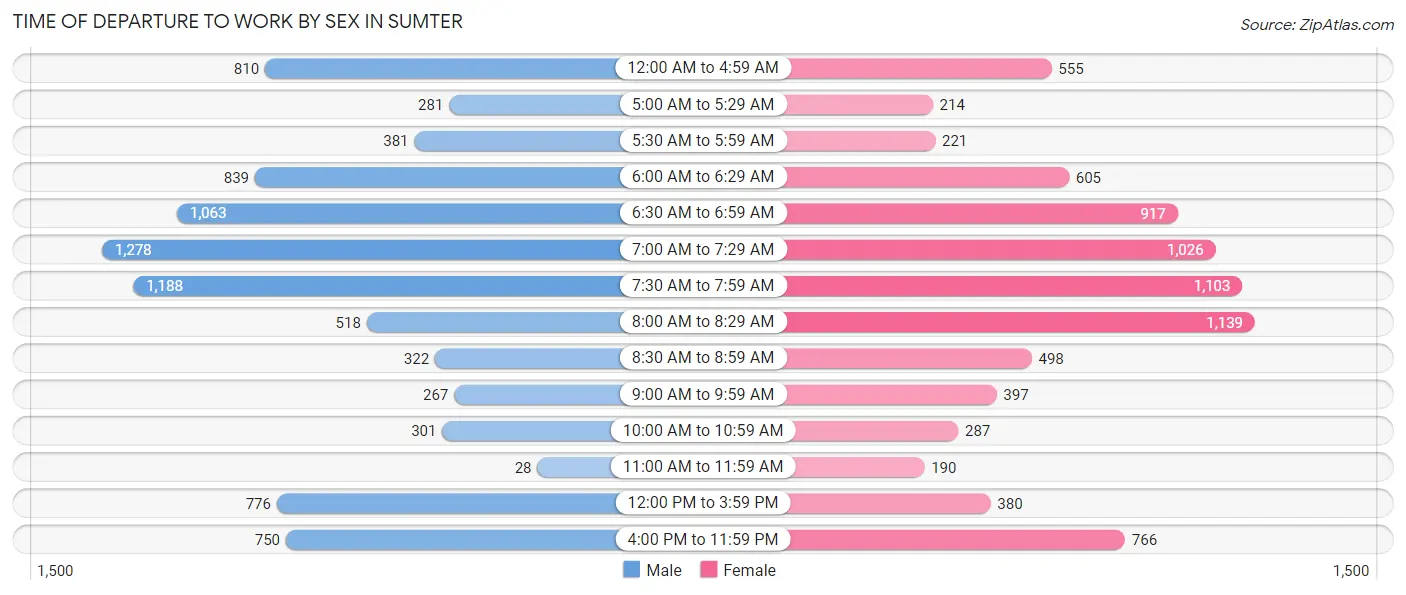
| Time of Departure | Male | Female |
| 12:00 AM to 4:59 AM | 810 (9.2%) | 555 (6.7%) |
| 5:00 AM to 5:29 AM | 281 (3.2%) | 214 (2.6%) |
| 5:30 AM to 5:59 AM | 381 (4.3%) | 221 (2.7%) |
| 6:00 AM to 6:29 AM | 839 (9.5%) | 605 (7.3%) |
| 6:30 AM to 6:59 AM | 1,063 (12.1%) | 917 (11.1%) |
| 7:00 AM to 7:29 AM | 1,278 (14.5%) | 1,026 (12.4%) |
| 7:30 AM to 7:59 AM | 1,188 (13.5%) | 1,103 (13.3%) |
| 8:00 AM to 8:29 AM | 518 (5.9%) | 1,139 (13.7%) |
| 8:30 AM to 8:59 AM | 322 (3.7%) | 498 (6.0%) |
| 9:00 AM to 9:59 AM | 267 (3.0%) | 397 (4.8%) |
| 10:00 AM to 10:59 AM | 301 (3.4%) | 287 (3.5%) |
| 11:00 AM to 11:59 AM | 28 (0.3%) | 190 (2.3%) |
| 12:00 PM to 3:59 PM | 776 (8.8%) | 380 (4.6%) |
| 4:00 PM to 11:59 PM | 750 (8.5%) | 766 (9.2%) |
| Total | 8,802 (100.0%) | 8,298 (100.0%) |
Housing Occupancy in Sumter
Occupancy by Ownership in Sumter
Of the total 16,394 dwellings in Sumter, owner-occupied units account for 8,852 (54.0%), while renter-occupied units make up 7,542 (46.0%).
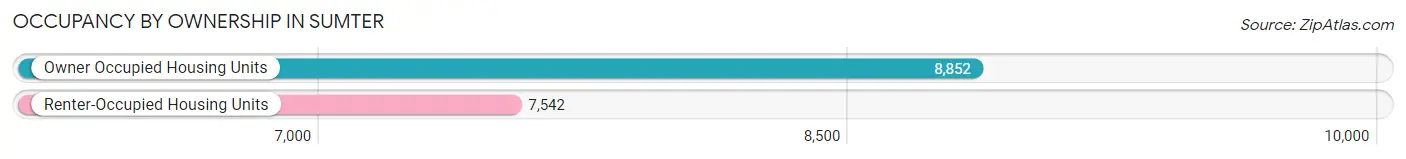
| Occupancy | # Housing Units | % Housing Units |
| Owner Occupied Housing Units | 8,852 | 54.0% |
| Renter-Occupied Housing Units | 7,542 | 46.0% |
| Total Occupied Housing Units | 16,394 | 100.0% |
Occupancy by Household Size in Sumter
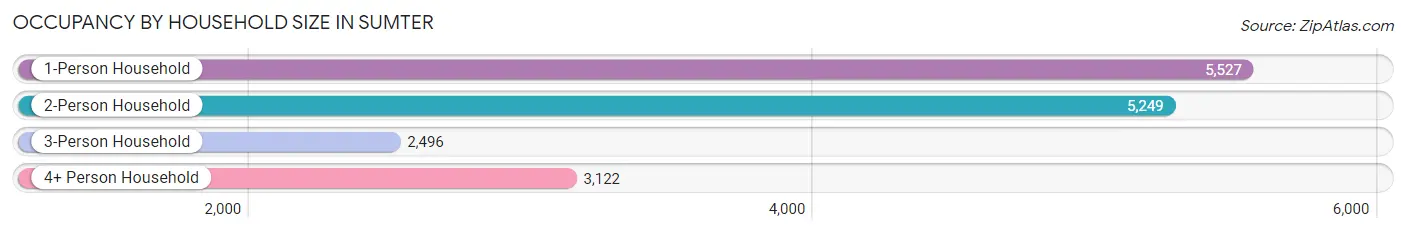
| Household Size | # Housing Units | % Housing Units |
| 1-Person Household | 5,527 | 33.7% |
| 2-Person Household | 5,249 | 32.0% |
| 3-Person Household | 2,496 | 15.2% |
| 4+ Person Household | 3,122 | 19.0% |
| Total Housing Units | 16,394 | 100.0% |
Occupancy by Ownership by Household Size in Sumter
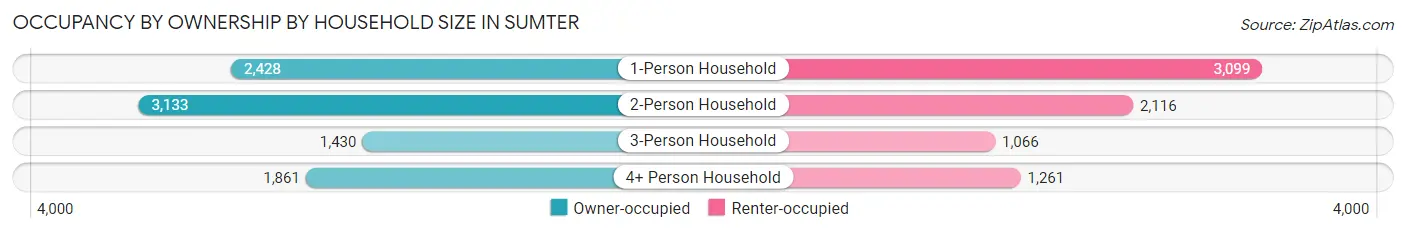
| Household Size | Owner-occupied | Renter-occupied |
| 1-Person Household | 2,428 (43.9%) | 3,099 (56.1%) |
| 2-Person Household | 3,133 (59.7%) | 2,116 (40.3%) |
| 3-Person Household | 1,430 (57.3%) | 1,066 (42.7%) |
| 4+ Person Household | 1,861 (59.6%) | 1,261 (40.4%) |
| Total Housing Units | 8,852 (54.0%) | 7,542 (46.0%) |
Occupancy by Educational Attainment in Sumter
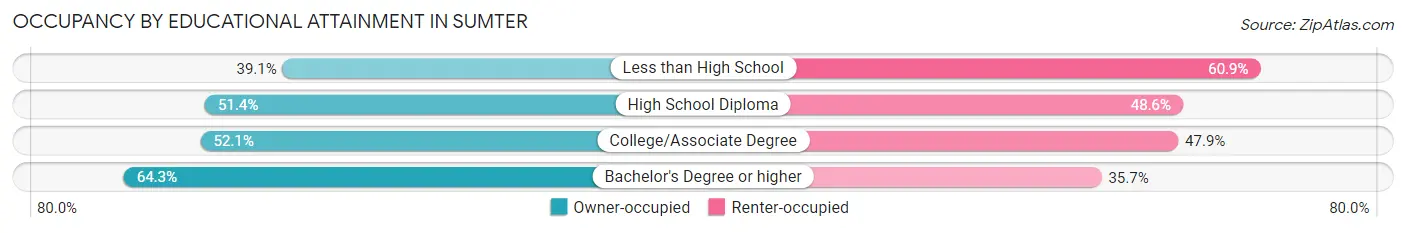
| Household Size | Owner-occupied | Renter-occupied |
| Less than High School | 623 (39.1%) | 971 (60.9%) |
| High School Diploma | 2,155 (51.4%) | 2,041 (48.6%) |
| College/Associate Degree | 3,169 (52.1%) | 2,914 (47.9%) |
| Bachelor's Degree or higher | 2,905 (64.3%) | 1,616 (35.7%) |
Occupancy by Age of Householder in Sumter
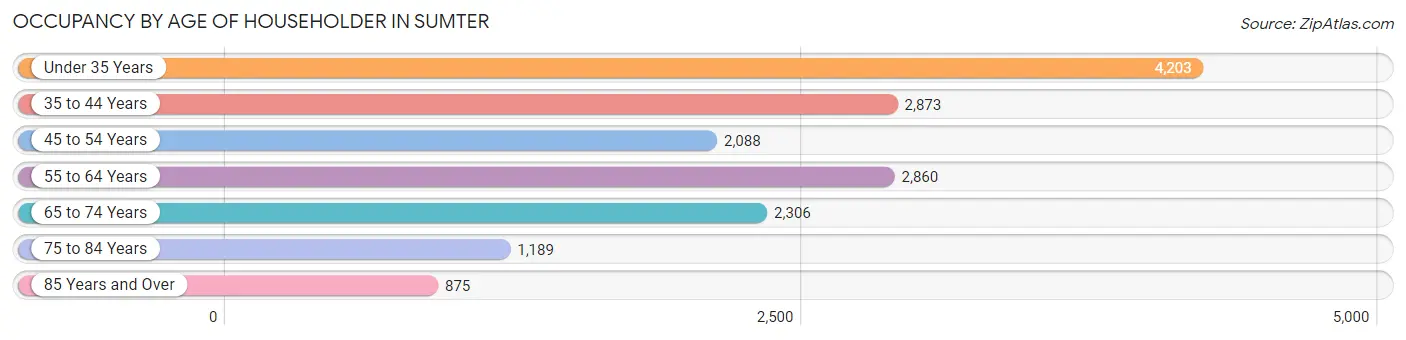
| Age Bracket | # Households | % Households |
| Under 35 Years | 4,203 | 25.6% |
| 35 to 44 Years | 2,873 | 17.5% |
| 45 to 54 Years | 2,088 | 12.7% |
| 55 to 64 Years | 2,860 | 17.4% |
| 65 to 74 Years | 2,306 | 14.1% |
| 75 to 84 Years | 1,189 | 7.2% |
| 85 Years and Over | 875 | 5.3% |
| Total | 16,394 | 100.0% |
Housing Finances in Sumter
Median Income by Occupancy in Sumter
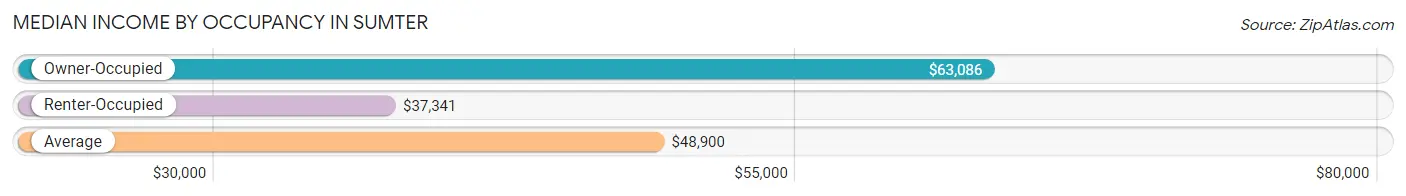
| Occupancy Type | # Households | Median Income |
| Owner-Occupied | 8,852 (54.0%) | $63,086 |
| Renter-Occupied | 7,542 (46.0%) | $37,341 |
| Average | 16,394 (100.0%) | $48,900 |
Occupancy by Householder Income Bracket in Sumter
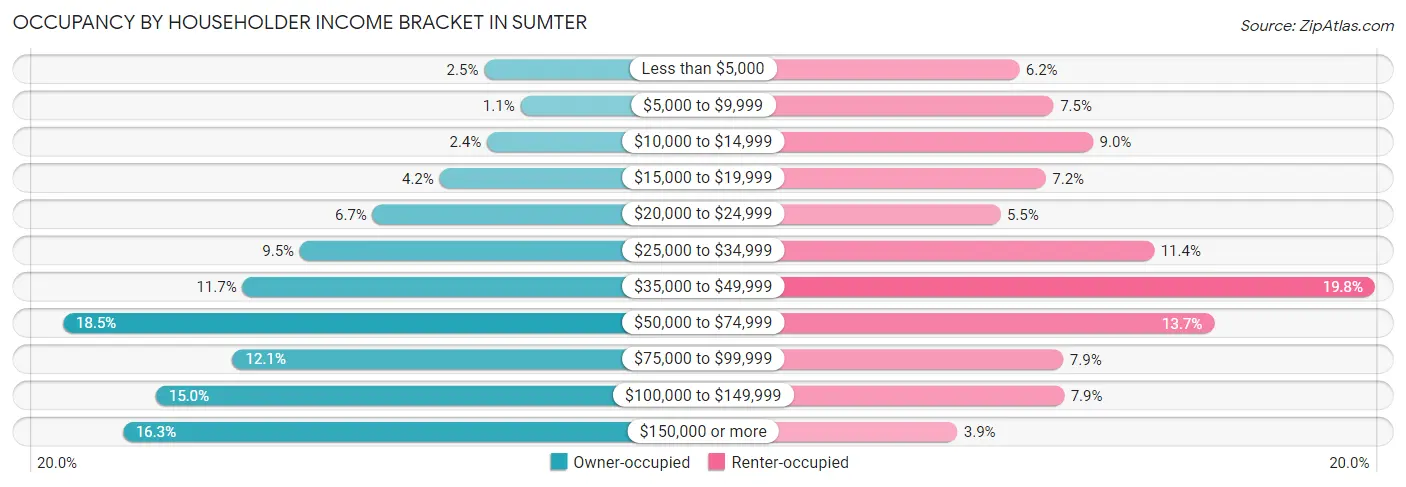
| Income Bracket | Owner-occupied | Renter-occupied |
| Less than $5,000 | 220 (2.5%) | 469 (6.2%) |
| $5,000 to $9,999 | 98 (1.1%) | 568 (7.5%) |
| $10,000 to $14,999 | 211 (2.4%) | 681 (9.0%) |
| $15,000 to $19,999 | 371 (4.2%) | 545 (7.2%) |
| $20,000 to $24,999 | 597 (6.7%) | 415 (5.5%) |
| $25,000 to $34,999 | 842 (9.5%) | 857 (11.4%) |
| $35,000 to $49,999 | 1,036 (11.7%) | 1,492 (19.8%) |
| $50,000 to $74,999 | 1,641 (18.5%) | 1,030 (13.7%) |
| $75,000 to $99,999 | 1,069 (12.1%) | 596 (7.9%) |
| $100,000 to $149,999 | 1,328 (15.0%) | 598 (7.9%) |
| $150,000 or more | 1,439 (16.3%) | 291 (3.9%) |
| Total | 8,852 (100.0%) | 7,542 (100.0%) |
Monthly Housing Cost Tiers in Sumter
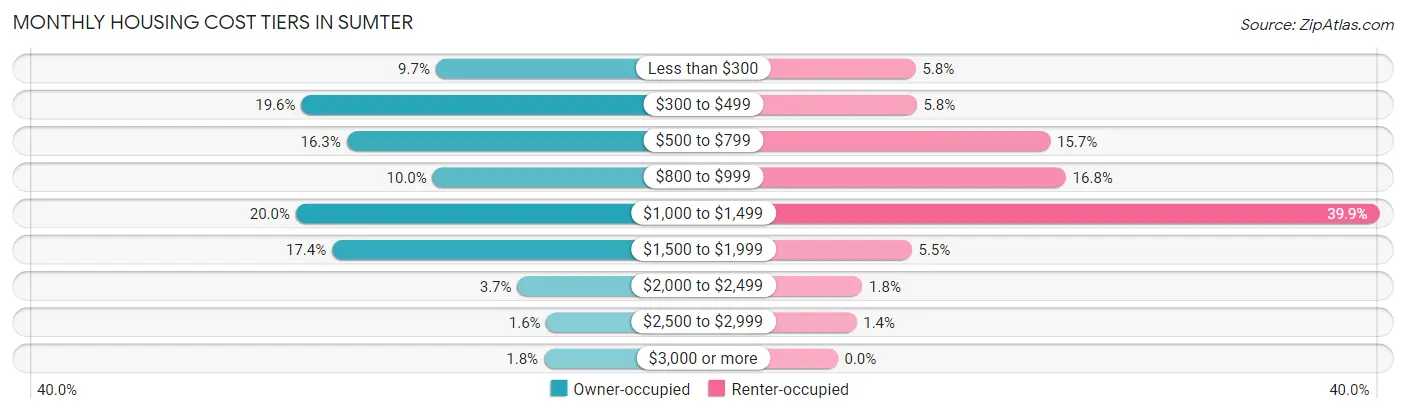
| Monthly Cost | Owner-occupied | Renter-occupied |
| Less than $300 | 860 (9.7%) | 434 (5.8%) |
| $300 to $499 | 1,737 (19.6%) | 439 (5.8%) |
| $500 to $799 | 1,442 (16.3%) | 1,181 (15.7%) |
| $800 to $999 | 881 (10.0%) | 1,268 (16.8%) |
| $1,000 to $1,499 | 1,773 (20.0%) | 3,010 (39.9%) |
| $1,500 to $1,999 | 1,537 (17.4%) | 412 (5.5%) |
| $2,000 to $2,499 | 328 (3.7%) | 137 (1.8%) |
| $2,500 to $2,999 | 139 (1.6%) | 105 (1.4%) |
| $3,000 or more | 155 (1.8%) | 0 (0.0%) |
| Total | 8,852 (100.0%) | 7,542 (100.0%) |
Physical Housing Characteristics in Sumter
Housing Structures in Sumter
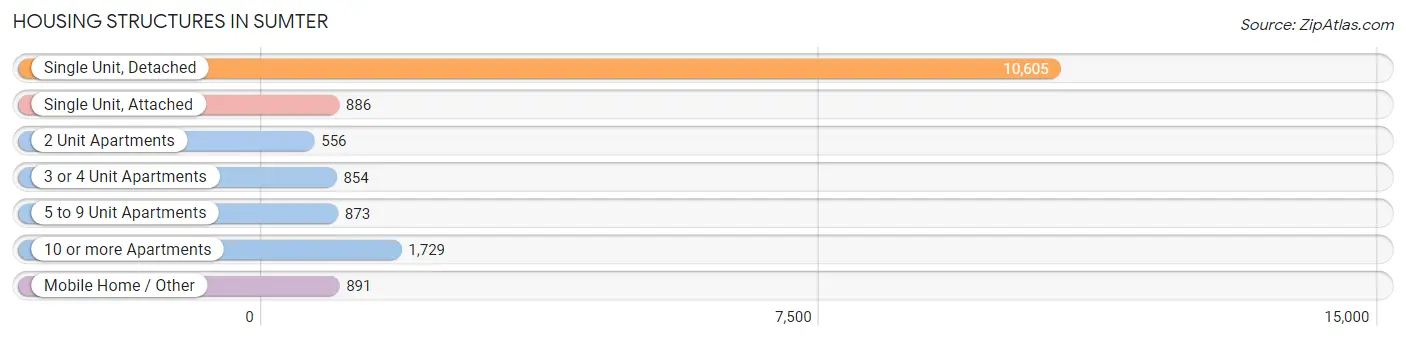
| Structure Type | # Housing Units | % Housing Units |
| Single Unit, Detached | 10,605 | 64.7% |
| Single Unit, Attached | 886 | 5.4% |
| 2 Unit Apartments | 556 | 3.4% |
| 3 or 4 Unit Apartments | 854 | 5.2% |
| 5 to 9 Unit Apartments | 873 | 5.3% |
| 10 or more Apartments | 1,729 | 10.5% |
| Mobile Home / Other | 891 | 5.4% |
| Total | 16,394 | 100.0% |
Housing Structures by Occupancy in Sumter
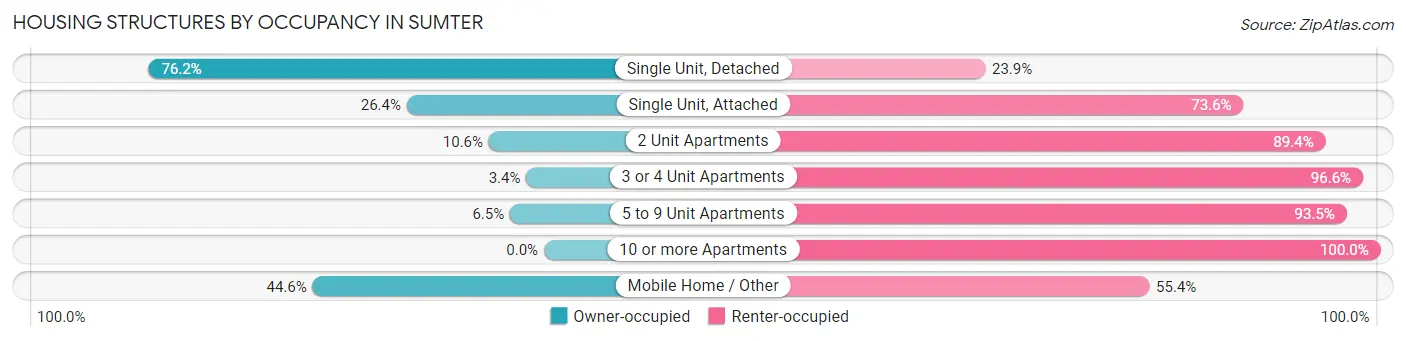
| Structure Type | Owner-occupied | Renter-occupied |
| Single Unit, Detached | 8,076 (76.1%) | 2,529 (23.8%) |
| Single Unit, Attached | 234 (26.4%) | 652 (73.6%) |
| 2 Unit Apartments | 59 (10.6%) | 497 (89.4%) |
| 3 or 4 Unit Apartments | 29 (3.4%) | 825 (96.6%) |
| 5 to 9 Unit Apartments | 57 (6.5%) | 816 (93.5%) |
| 10 or more Apartments | 0 (0.0%) | 1,729 (100.0%) |
| Mobile Home / Other | 397 (44.6%) | 494 (55.4%) |
| Total | 8,852 (54.0%) | 7,542 (46.0%) |
Housing Structures by Number of Rooms in Sumter
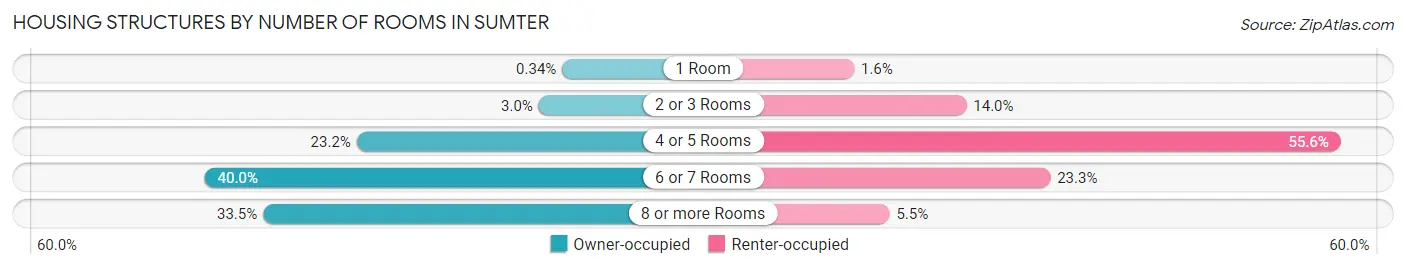
| Number of Rooms | Owner-occupied | Renter-occupied |
| 1 Room | 30 (0.3%) | 118 (1.6%) |
| 2 or 3 Rooms | 261 (2.9%) | 1,058 (14.0%) |
| 4 or 5 Rooms | 2,049 (23.2%) | 4,191 (55.6%) |
| 6 or 7 Rooms | 3,543 (40.0%) | 1,760 (23.3%) |
| 8 or more Rooms | 2,969 (33.5%) | 415 (5.5%) |
| Total | 8,852 (100.0%) | 7,542 (100.0%) |
Housing Structure by Heating Type in Sumter
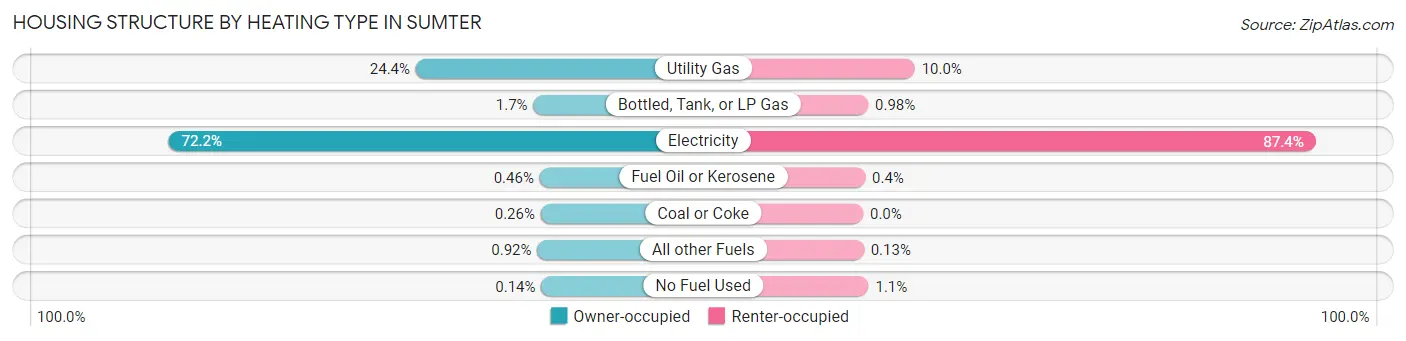
| Heating Type | Owner-occupied | Renter-occupied |
| Utility Gas | 2,159 (24.4%) | 753 (10.0%) |
| Bottled, Tank, or LP Gas | 148 (1.7%) | 74 (1.0%) |
| Electricity | 6,388 (72.2%) | 6,595 (87.4%) |
| Fuel Oil or Kerosene | 41 (0.5%) | 30 (0.4%) |
| Coal or Coke | 23 (0.3%) | 0 (0.0%) |
| All other Fuels | 81 (0.9%) | 10 (0.1%) |
| No Fuel Used | 12 (0.1%) | 80 (1.1%) |
| Total | 8,852 (100.0%) | 7,542 (100.0%) |
Household Vehicle Usage in Sumter
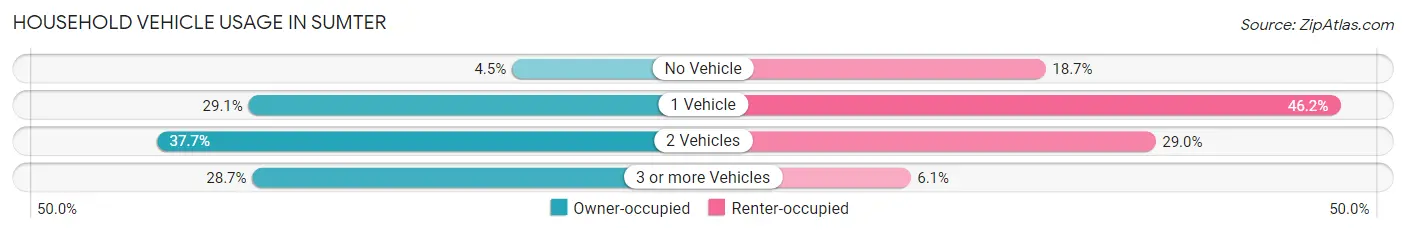
| Vehicles per Household | Owner-occupied | Renter-occupied |
| No Vehicle | 398 (4.5%) | 1,411 (18.7%) |
| 1 Vehicle | 2,575 (29.1%) | 3,486 (46.2%) |
| 2 Vehicles | 3,335 (37.7%) | 2,185 (29.0%) |
| 3 or more Vehicles | 2,544 (28.7%) | 460 (6.1%) |
| Total | 8,852 (100.0%) | 7,542 (100.0%) |
Real Estate & Mortgages in Sumter
Real Estate and Mortgage Overview in Sumter
| Characteristic | Without Mortgage | With Mortgage |
| Housing Units | 3,562 | 5,290 |
| Median Property Value | $117,700 | $197,000 |
| Median Household Income | $48,132 | $994 |
| Monthly Housing Costs | $391 | $155 |
| Real Estate Taxes | $798 | $359 |
Property Value by Mortgage Status in Sumter
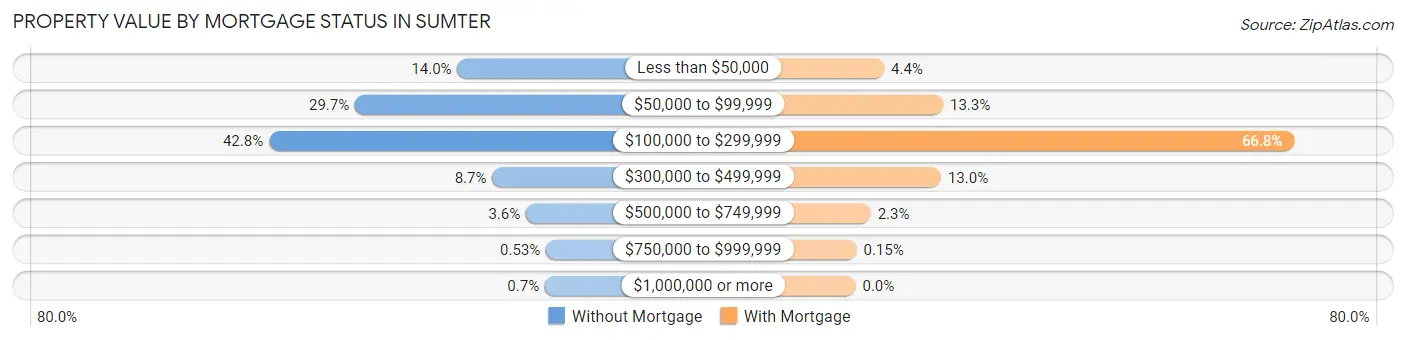
| Property Value | Without Mortgage | With Mortgage |
| Less than $50,000 | 500 (14.0%) | 230 (4.3%) |
| $50,000 to $99,999 | 1,056 (29.6%) | 705 (13.3%) |
| $100,000 to $299,999 | 1,523 (42.8%) | 3,536 (66.8%) |
| $300,000 to $499,999 | 311 (8.7%) | 689 (13.0%) |
| $500,000 to $749,999 | 128 (3.6%) | 122 (2.3%) |
| $750,000 to $999,999 | 19 (0.5%) | 8 (0.2%) |
| $1,000,000 or more | 25 (0.7%) | 0 (0.0%) |
| Total | 3,562 (100.0%) | 5,290 (100.0%) |
Household Income by Mortgage Status in Sumter
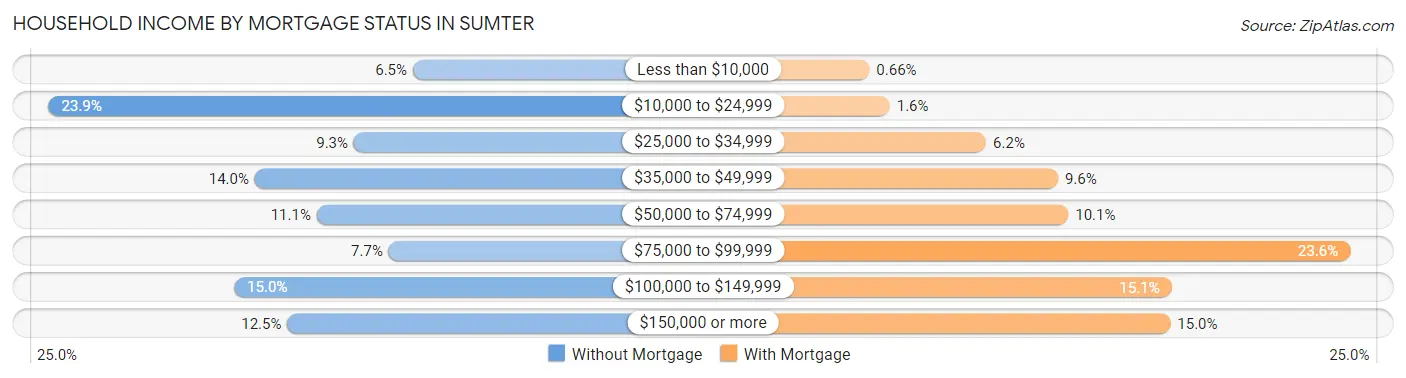
| Household Income | Without Mortgage | With Mortgage |
| Less than $10,000 | 232 (6.5%) | 35 (0.7%) |
| $10,000 to $24,999 | 850 (23.9%) | 86 (1.6%) |
| $25,000 to $34,999 | 332 (9.3%) | 329 (6.2%) |
| $35,000 to $49,999 | 500 (14.0%) | 510 (9.6%) |
| $50,000 to $74,999 | 395 (11.1%) | 536 (10.1%) |
| $75,000 to $99,999 | 273 (7.7%) | 1,246 (23.5%) |
| $100,000 to $149,999 | 535 (15.0%) | 796 (15.0%) |
| $150,000 or more | 445 (12.5%) | 793 (15.0%) |
| Total | 3,562 (100.0%) | 5,290 (100.0%) |
Property Value to Household Income Ratio in Sumter
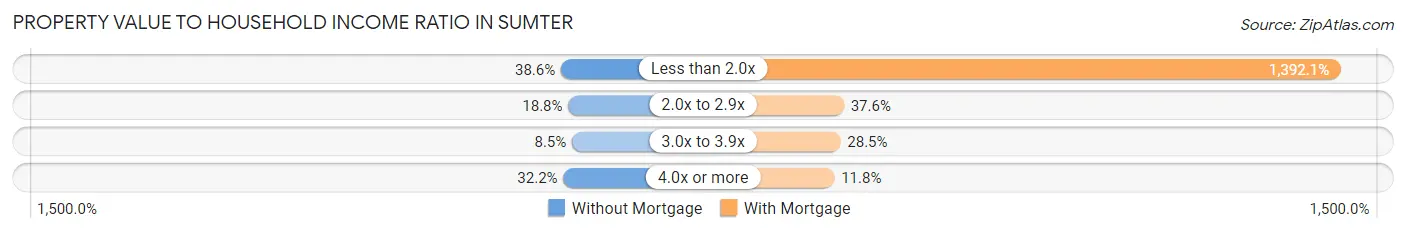
| Value-to-Income Ratio | Without Mortgage | With Mortgage |
| Less than 2.0x | 1,374 (38.6%) | 73,640 (1,392.1%) |
| 2.0x to 2.9x | 669 (18.8%) | 1,991 (37.6%) |
| 3.0x to 3.9x | 303 (8.5%) | 1,506 (28.5%) |
| 4.0x or more | 1,146 (32.2%) | 622 (11.8%) |
| Total | 3,562 (100.0%) | 5,290 (100.0%) |
Real Estate Taxes by Mortgage Status in Sumter
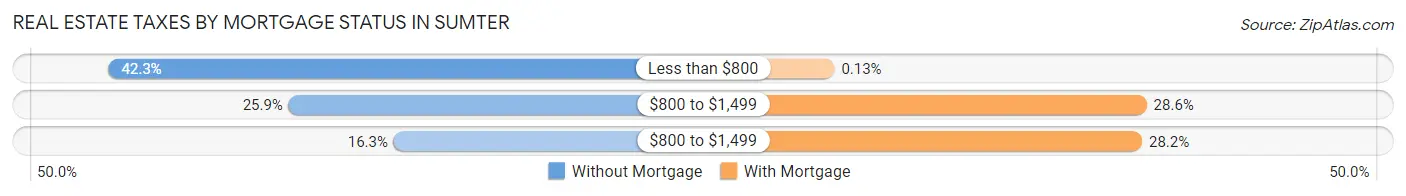
| Property Taxes | Without Mortgage | With Mortgage |
| Less than $800 | 1,508 (42.3%) | 7 (0.1%) |
| $800 to $1,499 | 922 (25.9%) | 1,515 (28.6%) |
| $800 to $1,499 | 580 (16.3%) | 1,493 (28.2%) |
| Total | 3,562 (100.0%) | 5,290 (100.0%) |
Health & Disability in Sumter
Health Insurance Coverage by Age in Sumter
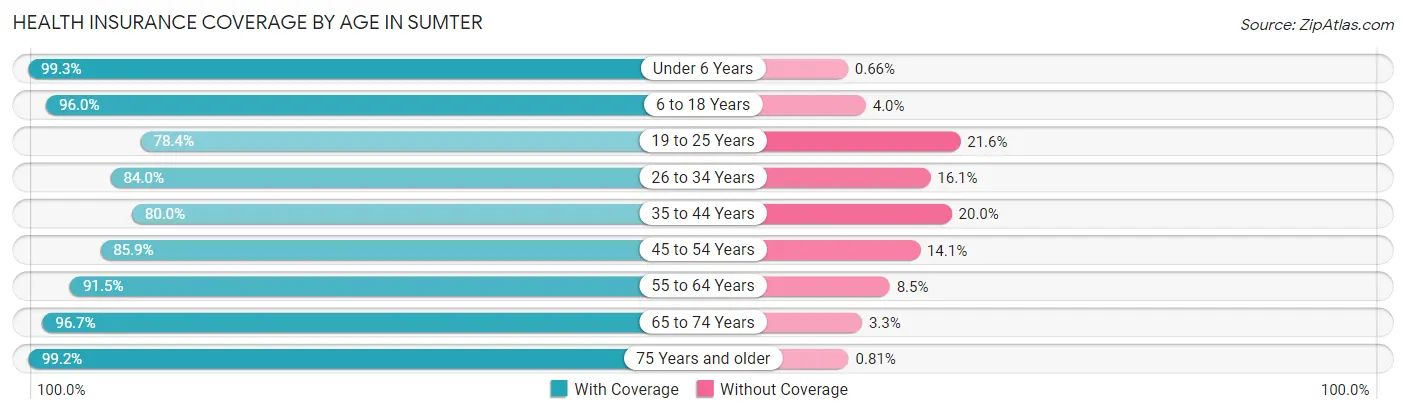
| Age Bracket | With Coverage | Without Coverage |
| Under 6 Years | 3,787 (99.3%) | 25 (0.7%) |
| 6 to 18 Years | 7,832 (96.0%) | 327 (4.0%) |
| 19 to 25 Years | 3,044 (78.4%) | 840 (21.6%) |
| 26 to 34 Years | 3,762 (84.0%) | 719 (16.1%) |
| 35 to 44 Years | 3,534 (80.0%) | 884 (20.0%) |
| 45 to 54 Years | 3,361 (85.9%) | 552 (14.1%) |
| 55 to 64 Years | 4,214 (91.5%) | 390 (8.5%) |
| 65 to 74 Years | 3,664 (96.7%) | 125 (3.3%) |
| 75 Years and older | 2,812 (99.2%) | 23 (0.8%) |
| Total | 36,010 (90.3%) | 3,885 (9.7%) |
Health Insurance Coverage by Citizenship Status in Sumter
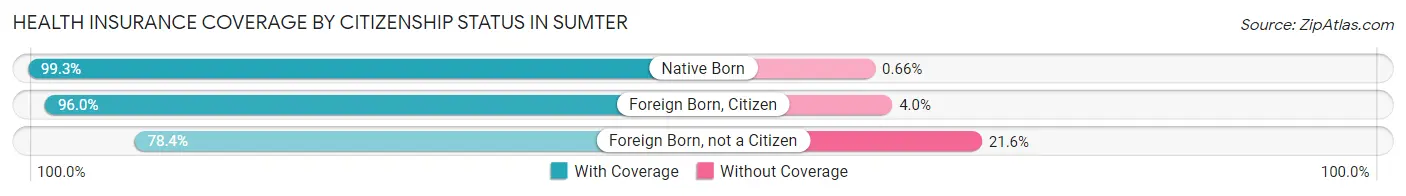
| Citizenship Status | With Coverage | Without Coverage |
| Native Born | 3,787 (99.3%) | 25 (0.7%) |
| Foreign Born, Citizen | 7,832 (96.0%) | 327 (4.0%) |
| Foreign Born, not a Citizen | 3,044 (78.4%) | 840 (21.6%) |
Health Insurance Coverage by Household Income in Sumter
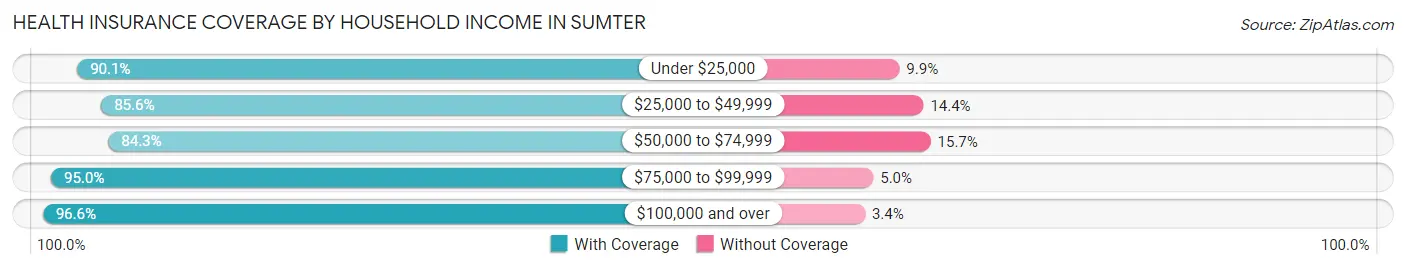
| Household Income | With Coverage | Without Coverage |
| Under $25,000 | 6,581 (90.1%) | 720 (9.9%) |
| $25,000 to $49,999 | 7,632 (85.6%) | 1,280 (14.4%) |
| $50,000 to $74,999 | 5,879 (84.3%) | 1,095 (15.7%) |
| $75,000 to $99,999 | 4,507 (95.0%) | 235 (5.0%) |
| $100,000 and over | 10,912 (96.6%) | 384 (3.4%) |
Public vs Private Health Insurance Coverage by Age in Sumter
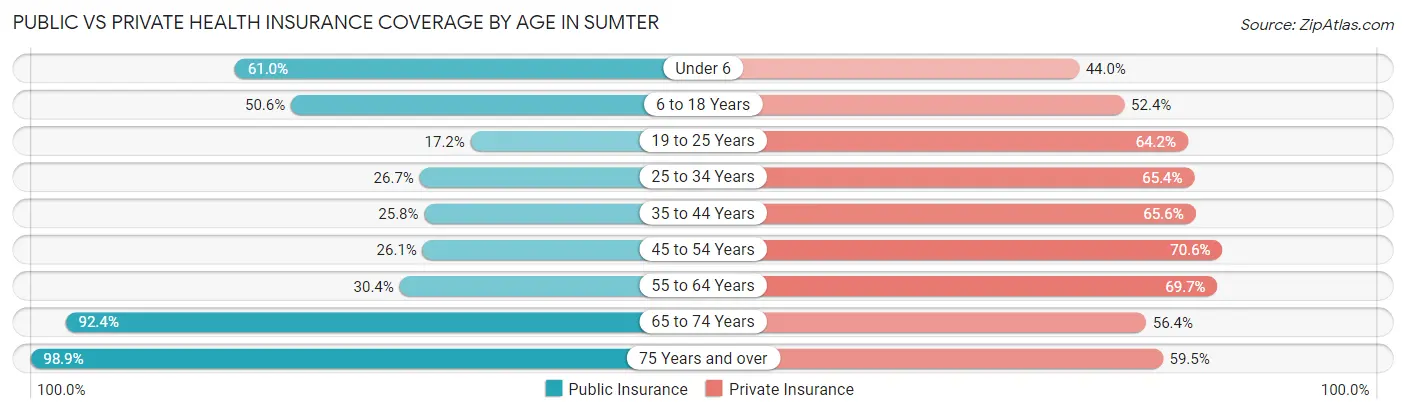
| Age Bracket | Public Insurance | Private Insurance |
| Under 6 | 2,324 (61.0%) | 1,676 (44.0%) |
| 6 to 18 Years | 4,124 (50.5%) | 4,276 (52.4%) |
| 19 to 25 Years | 669 (17.2%) | 2,494 (64.2%) |
| 25 to 34 Years | 1,195 (26.7%) | 2,932 (65.4%) |
| 35 to 44 Years | 1,140 (25.8%) | 2,900 (65.6%) |
| 45 to 54 Years | 1,022 (26.1%) | 2,764 (70.6%) |
| 55 to 64 Years | 1,399 (30.4%) | 3,210 (69.7%) |
| 65 to 74 Years | 3,501 (92.4%) | 2,138 (56.4%) |
| 75 Years and over | 2,805 (98.9%) | 1,688 (59.5%) |
| Total | 18,179 (45.6%) | 24,078 (60.4%) |
Disability Status by Sex by Age in Sumter
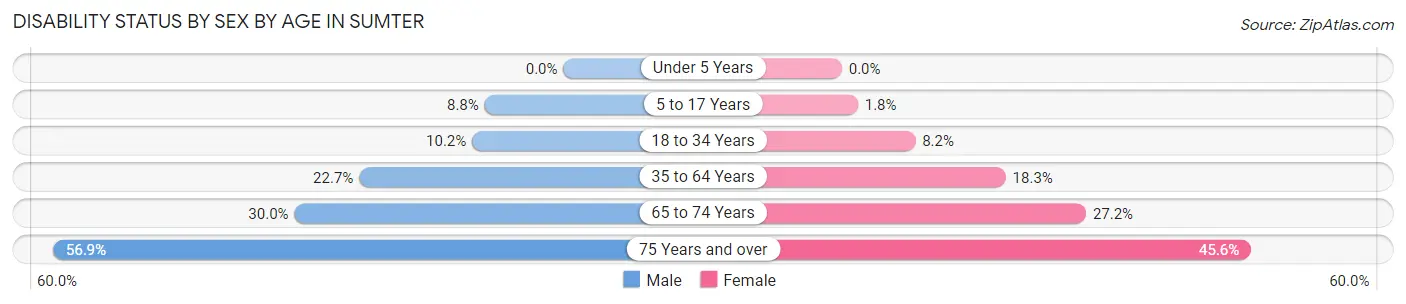
| Age Bracket | Male | Female |
| Under 5 Years | 0 (0.0%) | 0 (0.0%) |
| 5 to 17 Years | 402 (8.8%) | 66 (1.8%) |
| 18 to 34 Years | 397 (10.2%) | 409 (8.2%) |
| 35 to 64 Years | 1,381 (22.7%) | 1,252 (18.2%) |
| 65 to 74 Years | 496 (29.9%) | 580 (27.2%) |
| 75 Years and over | 589 (56.9%) | 820 (45.6%) |
Disability Class by Sex by Age in Sumter
Disability Class: Hearing Difficulty
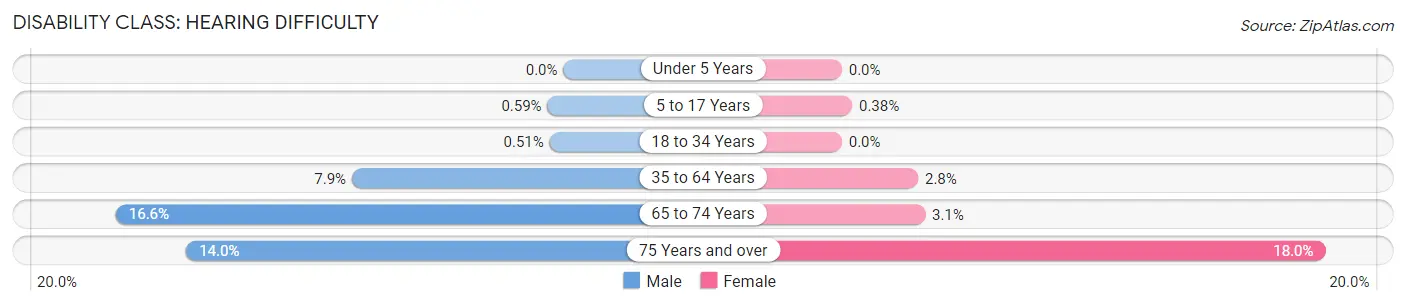
| Age Bracket | Male | Female |
| Under 5 Years | 0 (0.0%) | 0 (0.0%) |
| 5 to 17 Years | 27 (0.6%) | 14 (0.4%) |
| 18 to 34 Years | 20 (0.5%) | 0 (0.0%) |
| 35 to 64 Years | 477 (7.9%) | 194 (2.8%) |
| 65 to 74 Years | 275 (16.6%) | 66 (3.1%) |
| 75 Years and over | 145 (14.0%) | 323 (17.9%) |
Disability Class: Vision Difficulty
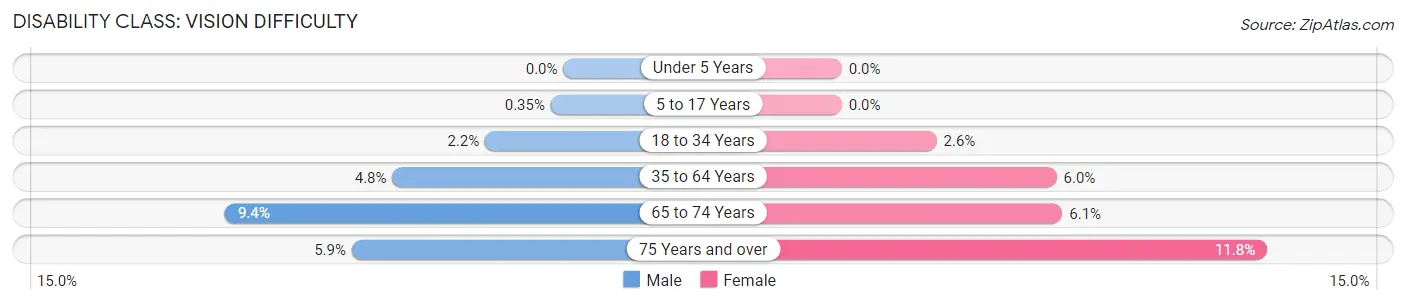
| Age Bracket | Male | Female |
| Under 5 Years | 0 (0.0%) | 0 (0.0%) |
| 5 to 17 Years | 16 (0.4%) | 0 (0.0%) |
| 18 to 34 Years | 85 (2.2%) | 132 (2.6%) |
| 35 to 64 Years | 289 (4.8%) | 410 (6.0%) |
| 65 to 74 Years | 156 (9.4%) | 131 (6.1%) |
| 75 Years and over | 61 (5.9%) | 213 (11.8%) |
Disability Class: Cognitive Difficulty
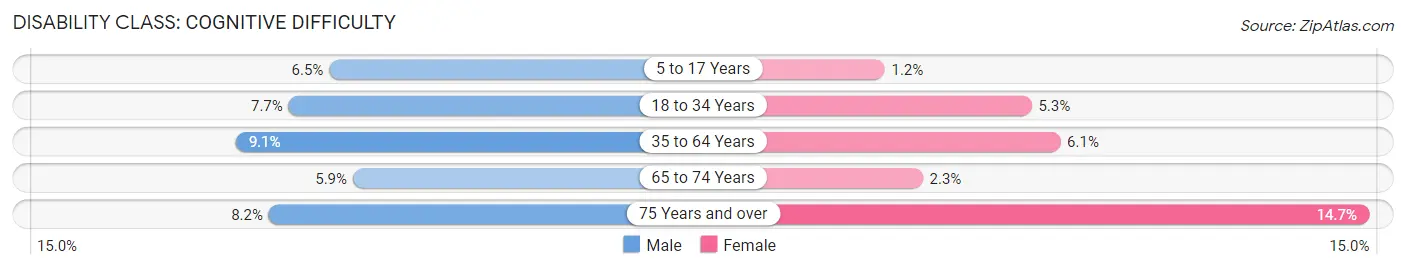
| Age Bracket | Male | Female |
| 5 to 17 Years | 299 (6.5%) | 44 (1.2%) |
| 18 to 34 Years | 299 (7.6%) | 264 (5.3%) |
| 35 to 64 Years | 554 (9.1%) | 417 (6.1%) |
| 65 to 74 Years | 97 (5.9%) | 48 (2.2%) |
| 75 Years and over | 85 (8.2%) | 264 (14.7%) |
Disability Class: Ambulatory Difficulty
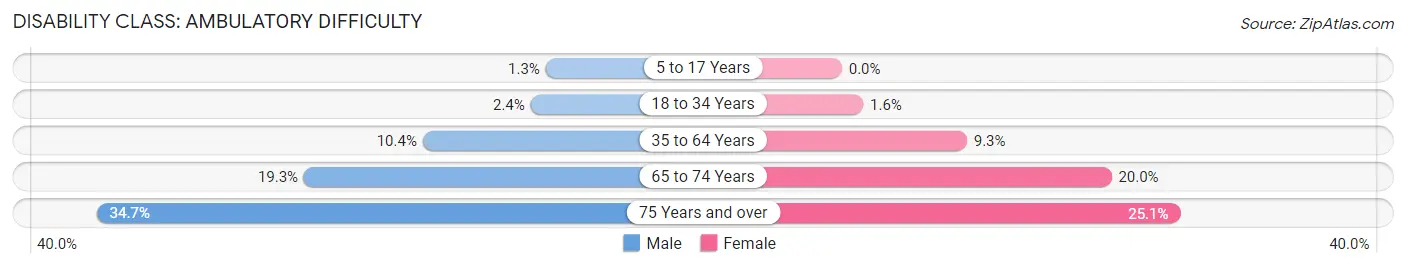
| Age Bracket | Male | Female |
| 5 to 17 Years | 60 (1.3%) | 0 (0.0%) |
| 18 to 34 Years | 95 (2.4%) | 79 (1.6%) |
| 35 to 64 Years | 634 (10.4%) | 637 (9.3%) |
| 65 to 74 Years | 319 (19.3%) | 427 (20.0%) |
| 75 Years and over | 359 (34.6%) | 452 (25.1%) |
Disability Class: Self-Care Difficulty
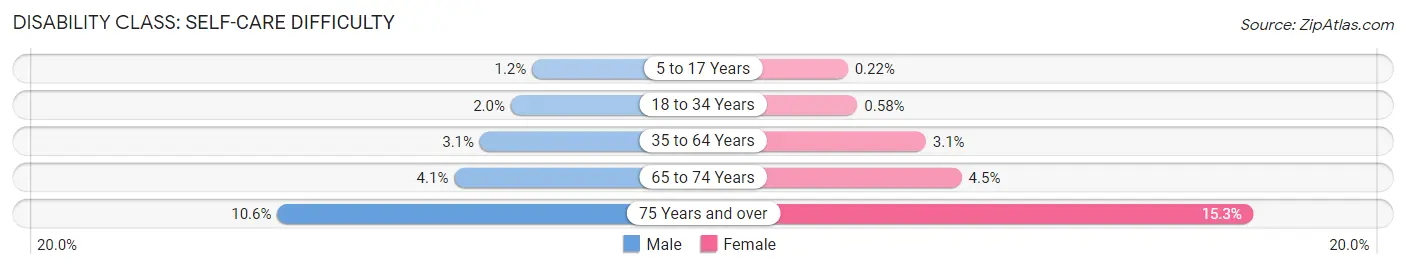
| Age Bracket | Male | Female |
| 5 to 17 Years | 53 (1.2%) | 8 (0.2%) |
| 18 to 34 Years | 76 (1.9%) | 29 (0.6%) |
| 35 to 64 Years | 188 (3.1%) | 214 (3.1%) |
| 65 to 74 Years | 67 (4.1%) | 95 (4.4%) |
| 75 Years and over | 110 (10.6%) | 275 (15.3%) |
Technology Access in Sumter
Computing Device Access in Sumter
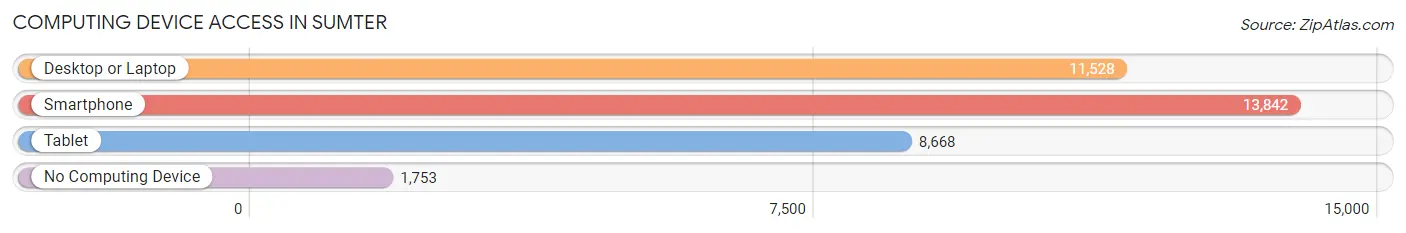
| Device Type | # Households | % Households |
| Desktop or Laptop | 11,528 | 70.3% |
| Smartphone | 13,842 | 84.4% |
| Tablet | 8,668 | 52.9% |
| No Computing Device | 1,753 | 10.7% |
| Total | 16,394 | 100.0% |
Internet Access in Sumter
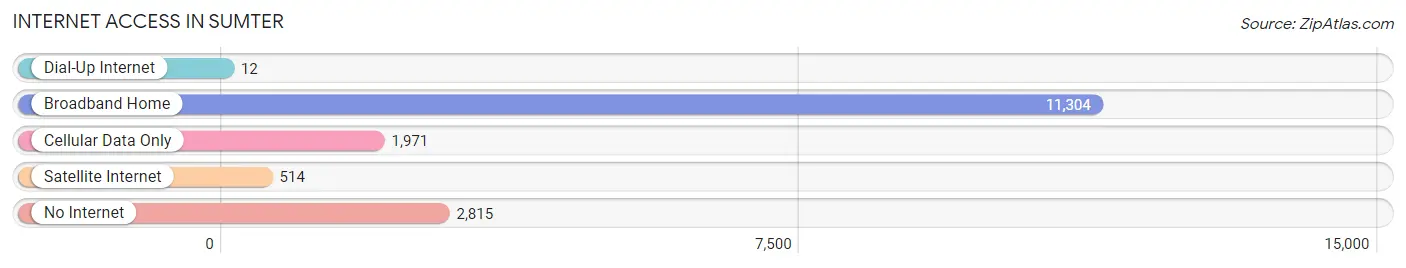
| Internet Type | # Households | % Households |
| Dial-Up Internet | 12 | 0.1% |
| Broadband Home | 11,304 | 69.0% |
| Cellular Data Only | 1,971 | 12.0% |
| Satellite Internet | 514 | 3.1% |
| No Internet | 2,815 | 17.2% |
| Total | 16,394 | 100.0% |
Sumter Summary
Sumter, South Carolina is a city located in the central part of the state, in Sumter County. It is the county seat and the largest city in the county. The city is located in the heart of the Pee Dee region of South Carolina, and is part of the Columbia, South Carolina metropolitan area.
History
The area that is now Sumter was first inhabited by the Catawba Indians, who were part of the Siouan-speaking tribes. The Catawba were displaced by the English in the late 17th century, and the area was settled by Europeans in the early 18th century. The first settlers were mostly Scots-Irish immigrants, who established a trading post in the area in 1740. The settlement was named Sumterville in honor of General Thomas Sumter, a Revolutionary War hero.
In 1798, Sumterville was incorporated as a town, and in 1845, it was chartered as a city. During the Civil War, Sumter was the site of several battles, including the Battle of Sumter in April 1861, which was the first battle of the war. After the war, the city experienced a period of growth and prosperity, and by the early 20th century, it had become an important center for commerce and industry.
Geography
Sumter is located in the central part of South Carolina, in Sumter County. It is situated at the intersection of U.S. Routes 15 and 76, about 50 miles east of Columbia, the state capital. The city is located in the Pee Dee region of the state, and is part of the Columbia metropolitan area.
Sumter has a total area of 28.3 square miles, of which 28.2 square miles is land and 0.1 square miles is water. The city is located in the Coastal Plain region of the state, and is characterized by flat terrain and sandy soils. The city is located near several rivers, including the Black River, the Wateree River, and the Santee River.
Economy
Sumter has a diversified economy, with a mix of manufacturing, retail, and service industries. The city is home to several major employers, including Shaw Air Force Base, which is the largest employer in the city. Other major employers include Sumter School District, Sumter County Government, and Walmart.
Sumter is also home to several manufacturing companies, including Continental Tire, which produces tires for cars and trucks, and Sonoco Products Company, which produces paper and plastic products. The city is also home to several retail stores, including Walmart, Target, and Lowe's.
Demographics
As of the 2010 census, Sumter had a population of 40,524. The racial makeup of the city was 57.2% African American, 37.3% White, 0.5% Native American, 1.2% Asian, 0.1% Pacific Islander, 1.7% from other races, and 2.1% from two or more races. Hispanic or Latino of any race were 4.2% of the population.
The median household income in Sumter was $37,845, and the median family income was $45,945. The per capita income in the city was $20,845. About 17.2% of the population was below the poverty line.
Sumter is served by the Sumter School District, which includes seven elementary schools, three middle schools, and two high schools. The city is also home to several higher education institutions, including Central Carolina Technical College and the University of South Carolina Sumter.
Common Questions
What is Per Capita Income in Sumter?
Per Capita income in Sumter is $27,742.
What is the Median Family Income in Sumter?
Median Family Income in Sumter is $64,609.
What is the Median Household income in Sumter?
Median Household Income in Sumter is $48,900.
What is Income or Wage Gap in Sumter?
Income or Wage Gap in Sumter is 33.5%.
Women in Sumter earn 66.5 cents for every dollar earned by a man.
What is Family Income Deficit in Sumter?
Family Income Deficit in Sumter is $10,794.
Families that are below poverty line in Sumter earn $10,794 less on average than the poverty threshold level.
What is Inequality or Gini Index in Sumter?
Inequality or Gini Index in Sumter is 0.48.
What is the Total Population of Sumter?
Total Population of Sumter is 43,046.
What is the Total Male Population of Sumter?
Total Male Population of Sumter is 21,121.
What is the Total Female Population of Sumter?
Total Female Population of Sumter is 21,925.
What is the Ratio of Males per 100 Females in Sumter?
There are 96.33 Males per 100 Females in Sumter.
What is the Ratio of Females per 100 Males in Sumter?
There are 103.81 Females per 100 Males in Sumter.
What is the Median Population Age in Sumter?
Median Population Age in Sumter is 33.1 Years.
What is the Average Family Size in Sumter
Average Family Size in Sumter is 3.3 People.
What is the Average Household Size in Sumter
Average Household Size in Sumter is 2.5 People.
How Large is the Labor Force in Sumter?
There are 19,713 People in the Labor Forcein in Sumter.
What is the Percentage of People in the Labor Force in Sumter?
60.0% of People are in the Labor Force in Sumter.
What is the Unemployment Rate in Sumter?
Unemployment Rate in Sumter is 7.8%.