Cane Savannah, SC Map & Demographics
Cane Savannah Map
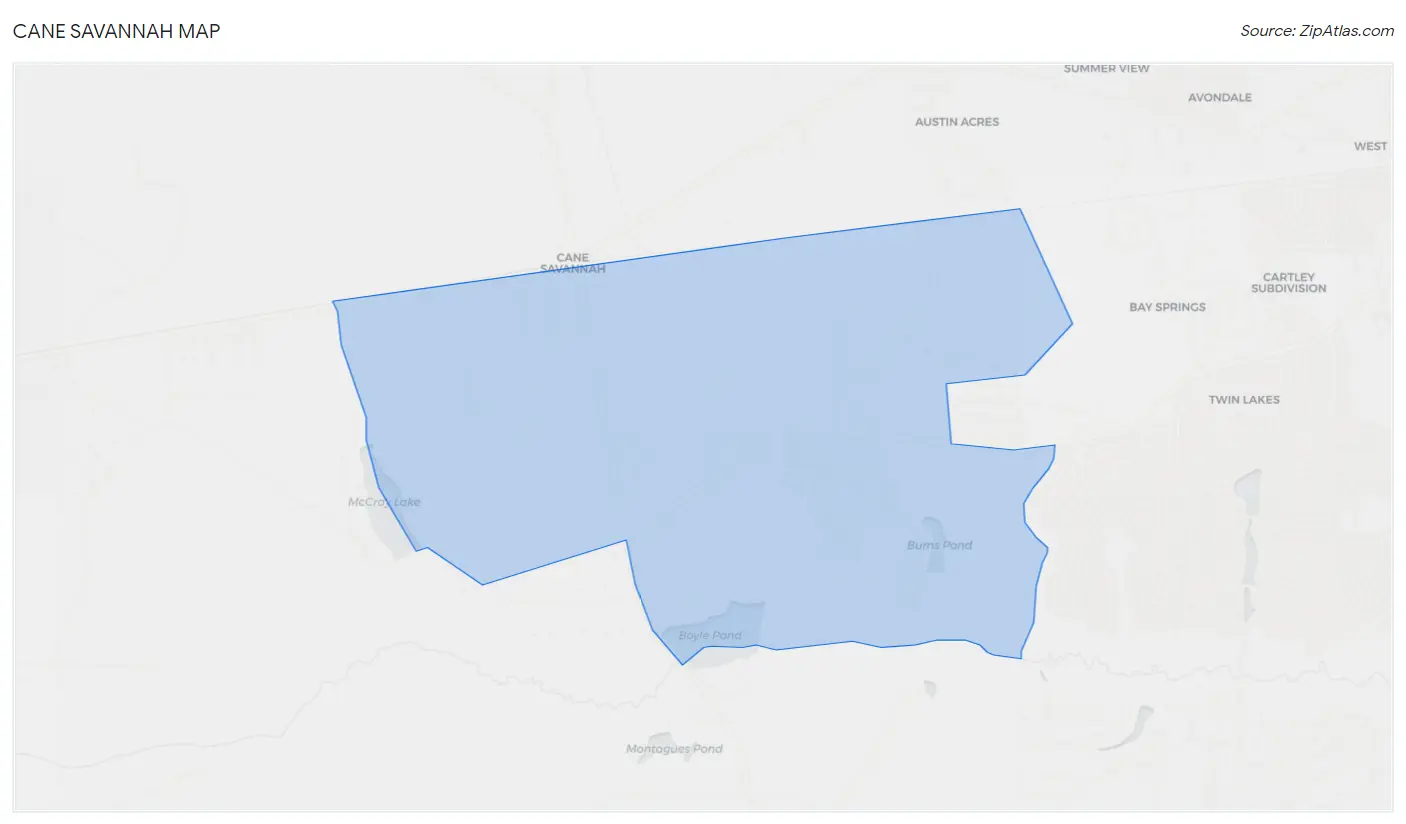
Cane Savannah Overview
$33,531
PER CAPITA INCOME
$124,727
AVG FAMILY INCOME
$67,619
AVG HOUSEHOLD INCOME
24.6%
WAGE / INCOME GAP [ % ]
75.4¢/ $1
WAGE / INCOME GAP [ $ ]
0.39
INEQUALITY / GINI INDEX
1,534
TOTAL POPULATION
785
MALE POPULATION
749
FEMALE POPULATION
104.81
MALES / 100 FEMALES
95.41
FEMALES / 100 MALES
44.6
MEDIAN AGE
4.1
AVG FAMILY SIZE
2.9
AVG HOUSEHOLD SIZE
988
LABOR FORCE [ PEOPLE ]
79.8%
PERCENT IN LABOR FORCE
10.9%
UNEMPLOYMENT RATE
Income in Cane Savannah
Income Overview in Cane Savannah
Per Capita Income in Cane Savannah is $33,531, while median incomes of families and households are $124,727 and $67,619 respectively.
| Characteristic | Number | Measure |
| Per Capita Income | 1,534 | $33,531 |
| Median Family Income | 307 | $124,727 |
| Mean Family Income | 307 | $120,562 |
| Median Household Income | 524 | $67,619 |
| Mean Household Income | 524 | $89,167 |
| Income Deficit | 307 | $0 |
| Wage / Income Gap (%) | 1,534 | 24.63% |
| Wage / Income Gap ($) | 1,534 | 75.37¢ per $1 |
| Gini / Inequality Index | 1,534 | 0.39 |
Earnings by Sex in Cane Savannah
Average Earnings in Cane Savannah are $34,226, $40,798 for men and $30,750 for women, a difference of 24.6%.
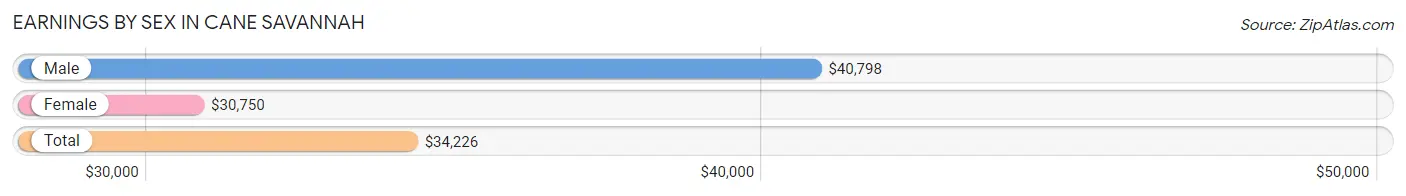
| Sex | Number | Average Earnings |
| Male | 514 (53.5%) | $40,798 |
| Female | 446 (46.5%) | $30,750 |
| Total | 960 (100.0%) | $34,226 |
Earnings by Sex by Income Bracket in Cane Savannah
The most common earnings brackets in Cane Savannah are $7,500 to $9,999 for men (86 | 16.7%) and $25,000 to $29,999 for women (97 | 21.7%).
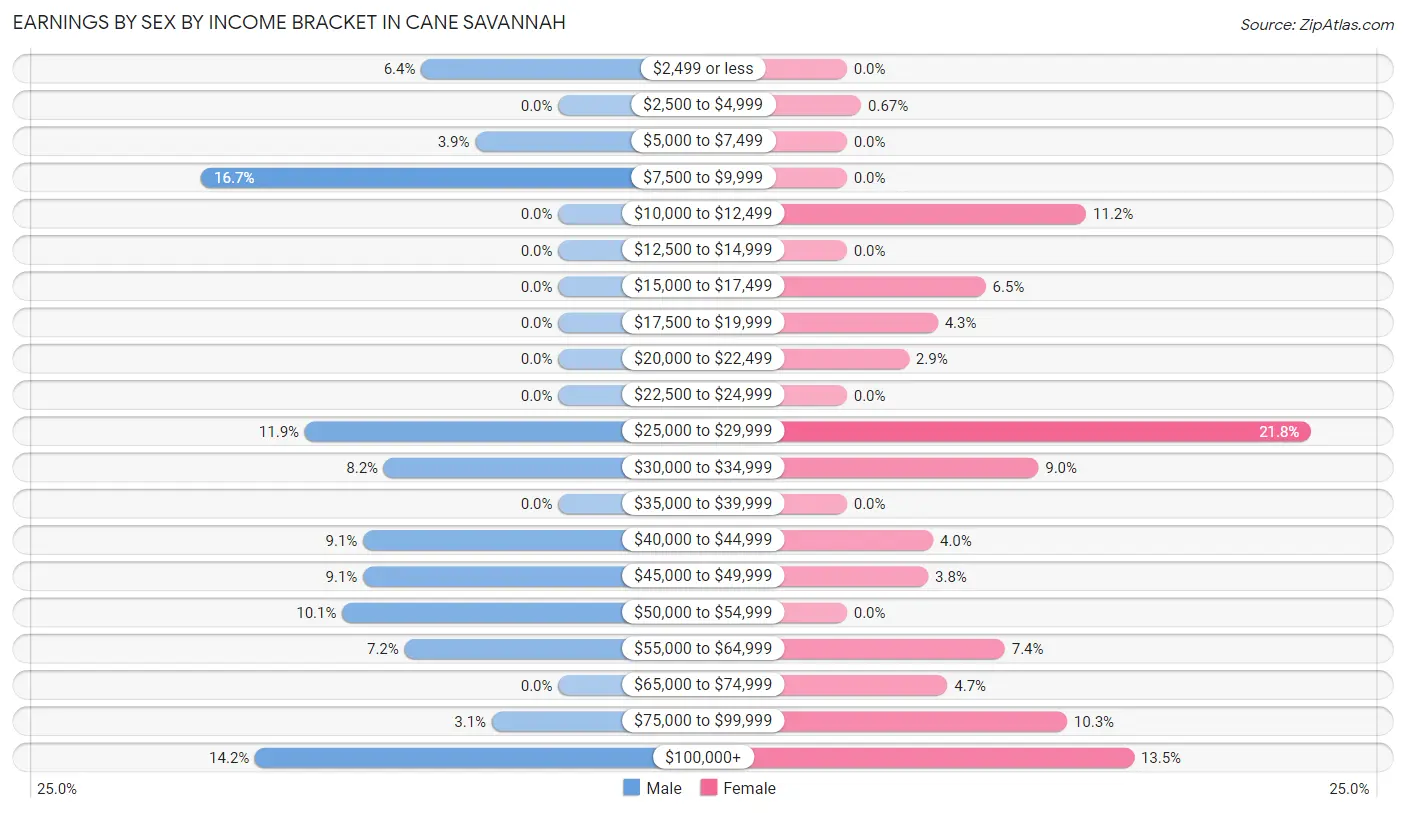
| Income | Male | Female |
| $2,499 or less | 33 (6.4%) | 0 (0.0%) |
| $2,500 to $4,999 | 0 (0.0%) | 3 (0.7%) |
| $5,000 to $7,499 | 20 (3.9%) | 0 (0.0%) |
| $7,500 to $9,999 | 86 (16.7%) | 0 (0.0%) |
| $10,000 to $12,499 | 0 (0.0%) | 50 (11.2%) |
| $12,500 to $14,999 | 0 (0.0%) | 0 (0.0%) |
| $15,000 to $17,499 | 0 (0.0%) | 29 (6.5%) |
| $17,500 to $19,999 | 0 (0.0%) | 19 (4.3%) |
| $20,000 to $22,499 | 0 (0.0%) | 13 (2.9%) |
| $22,500 to $24,999 | 0 (0.0%) | 0 (0.0%) |
| $25,000 to $29,999 | 61 (11.9%) | 97 (21.7%) |
| $30,000 to $34,999 | 42 (8.2%) | 40 (9.0%) |
| $35,000 to $39,999 | 0 (0.0%) | 0 (0.0%) |
| $40,000 to $44,999 | 47 (9.1%) | 18 (4.0%) |
| $45,000 to $49,999 | 47 (9.1%) | 17 (3.8%) |
| $50,000 to $54,999 | 52 (10.1%) | 0 (0.0%) |
| $55,000 to $64,999 | 37 (7.2%) | 33 (7.4%) |
| $65,000 to $74,999 | 0 (0.0%) | 21 (4.7%) |
| $75,000 to $99,999 | 16 (3.1%) | 46 (10.3%) |
| $100,000+ | 73 (14.2%) | 60 (13.5%) |
| Total | 514 (100.0%) | 446 (100.0%) |
Earnings by Sex by Educational Attainment in Cane Savannah
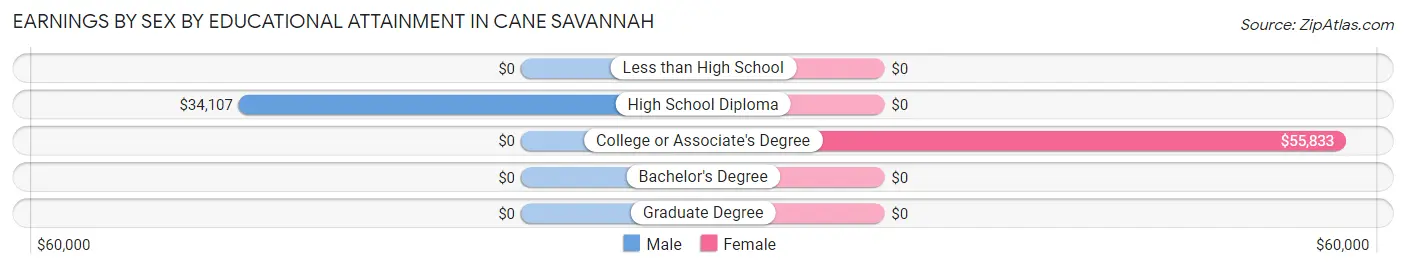
| Educational Attainment | Male Income | Female Income |
| Less than High School | - | - |
| High School Diploma | $34,107 | $0 |
| College or Associate's Degree | - | - |
| Bachelor's Degree | - | - |
| Graduate Degree | - | - |
| Total | $48,963 | $0 |
Family Income in Cane Savannah
Family Income Brackets in Cane Savannah
According to the Cane Savannah family income data, there are 117 families falling into the $100,000 to $149,999 income range, which is the most common income bracket and makes up 38.1% of all families.
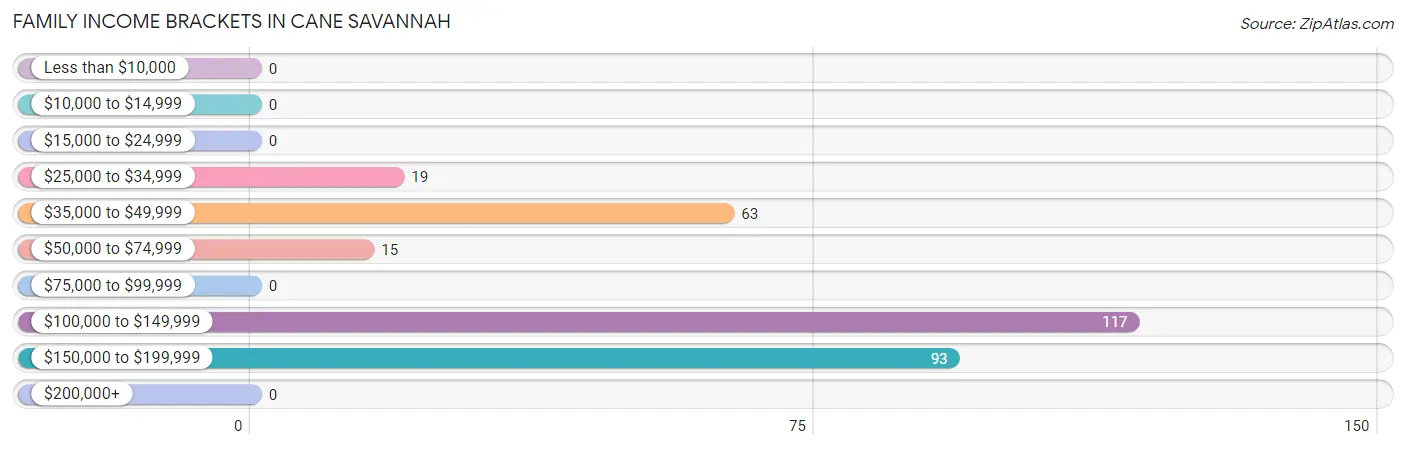
| Income Bracket | # Families | % Families |
| Less than $10,000 | 0 | 0.0% |
| $10,000 to $14,999 | 0 | 0.0% |
| $15,000 to $24,999 | 0 | 0.0% |
| $25,000 to $34,999 | 19 | 6.2% |
| $35,000 to $49,999 | 63 | 20.5% |
| $50,000 to $74,999 | 15 | 4.9% |
| $75,000 to $99,999 | 0 | 0.0% |
| $100,000 to $149,999 | 117 | 38.1% |
| $150,000 to $199,999 | 93 | 30.3% |
| $200,000+ | 0 | 0.0% |
Family Income by Famaliy Size in Cane Savannah
3-person families (153 | 49.8%) account for the highest median family income in Cane Savannah with $146,172 per family, while 3-person families (153 | 49.8%) have the highest median income of $48,724 per family member.
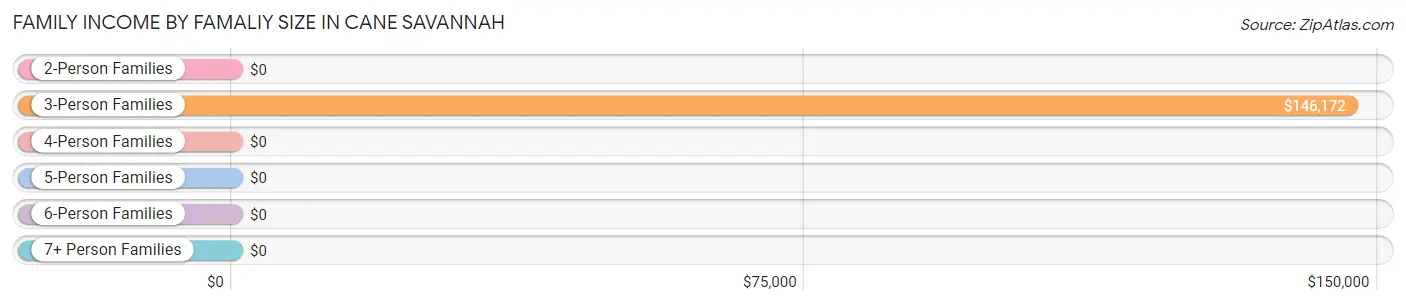
| Income Bracket | # Families | Median Income |
| 2-Person Families | 65 (21.2%) | $0 |
| 3-Person Families | 153 (49.8%) | $146,172 |
| 4-Person Families | 47 (15.3%) | $0 |
| 5-Person Families | 10 (3.3%) | $0 |
| 6-Person Families | 32 (10.4%) | $0 |
| 7+ Person Families | 0 (0.0%) | $0 |
| Total | 307 (100.0%) | $124,727 |
Family Income by Number of Earners in Cane Savannah
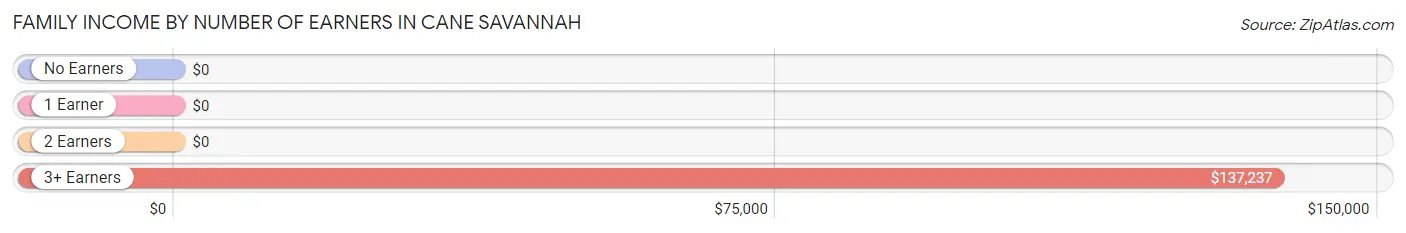
| Number of Earners | # Families | Median Income |
| No Earners | 19 (6.2%) | $0 |
| 1 Earner | 38 (12.4%) | $0 |
| 2 Earners | 152 (49.5%) | $0 |
| 3+ Earners | 98 (31.9%) | $137,237 |
| Total | 307 (100.0%) | $124,727 |
Household Income in Cane Savannah
Household Income Brackets in Cane Savannah
With 129 households falling in the category, the $100,000 to $149,999 income range is the most frequent in Cane Savannah, accounting for 24.6% of all households.
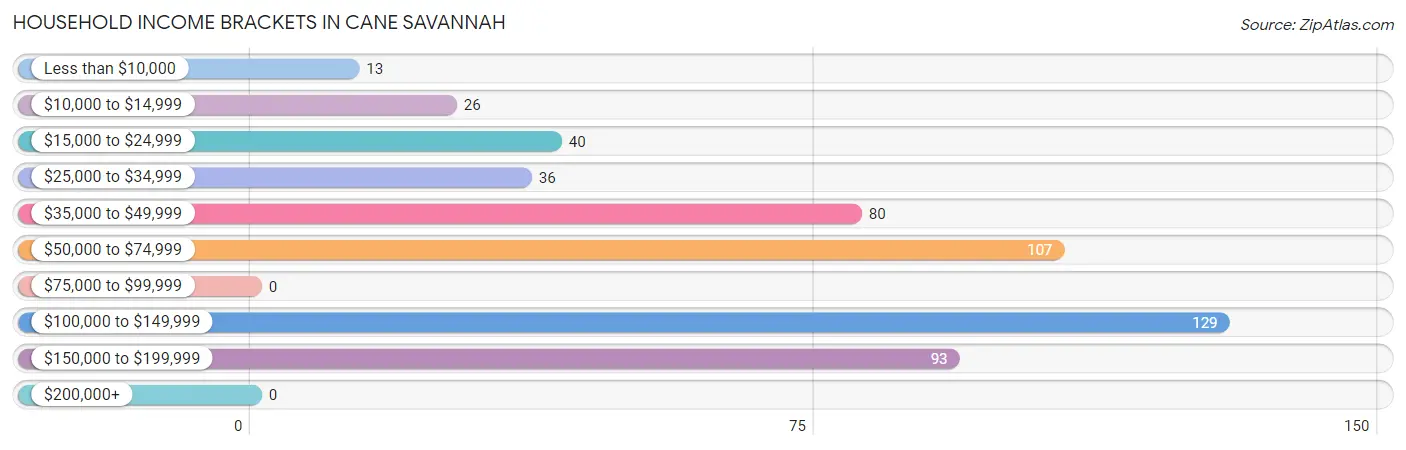
| Income Bracket | # Households | % Households |
| Less than $10,000 | 13 | 2.5% |
| $10,000 to $14,999 | 26 | 5.0% |
| $15,000 to $24,999 | 40 | 7.6% |
| $25,000 to $34,999 | 36 | 6.9% |
| $35,000 to $49,999 | 80 | 15.3% |
| $50,000 to $74,999 | 107 | 20.4% |
| $75,000 to $99,999 | 0 | 0.0% |
| $100,000 to $149,999 | 129 | 24.6% |
| $150,000 to $199,999 | 93 | 17.7% |
| $200,000+ | 0 | 0.0% |
Household Income by Householder Age in Cane Savannah
The median household income in Cane Savannah is $67,619, with the highest median household income of $18,854 found in the 65+ years age bracket for the primary householder. A total of 110 households (21.0%) fall into this category.
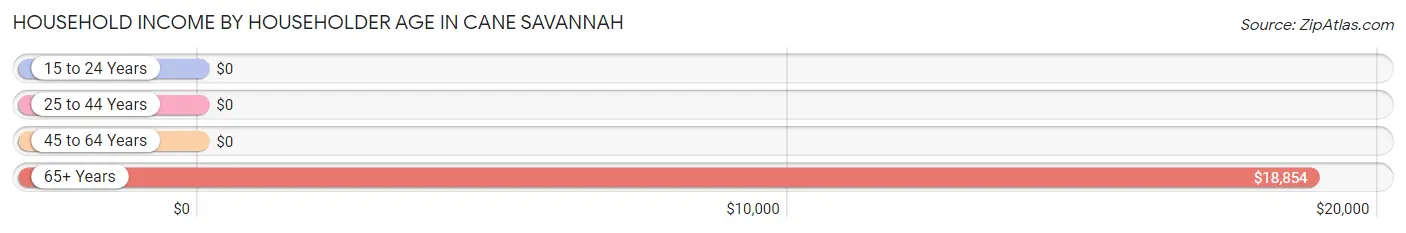
| Income Bracket | # Households | Median Income |
| 15 to 24 Years | 0 (0.0%) | $0 |
| 25 to 44 Years | 104 (19.9%) | $0 |
| 45 to 64 Years | 310 (59.2%) | $0 |
| 65+ Years | 110 (21.0%) | $18,854 |
| Total | 524 (100.0%) | $67,619 |
Poverty in Cane Savannah
Income Below Poverty by Sex and Age in Cane Savannah
With 1.7% poverty level for males and 4.8% for females among the residents of Cane Savannah, 55 to 64 year old males and 55 to 64 year old females are the most vulnerable to poverty, with 13 males (5.7%) and 28 females (35.4%) in their respective age groups living below the poverty level.
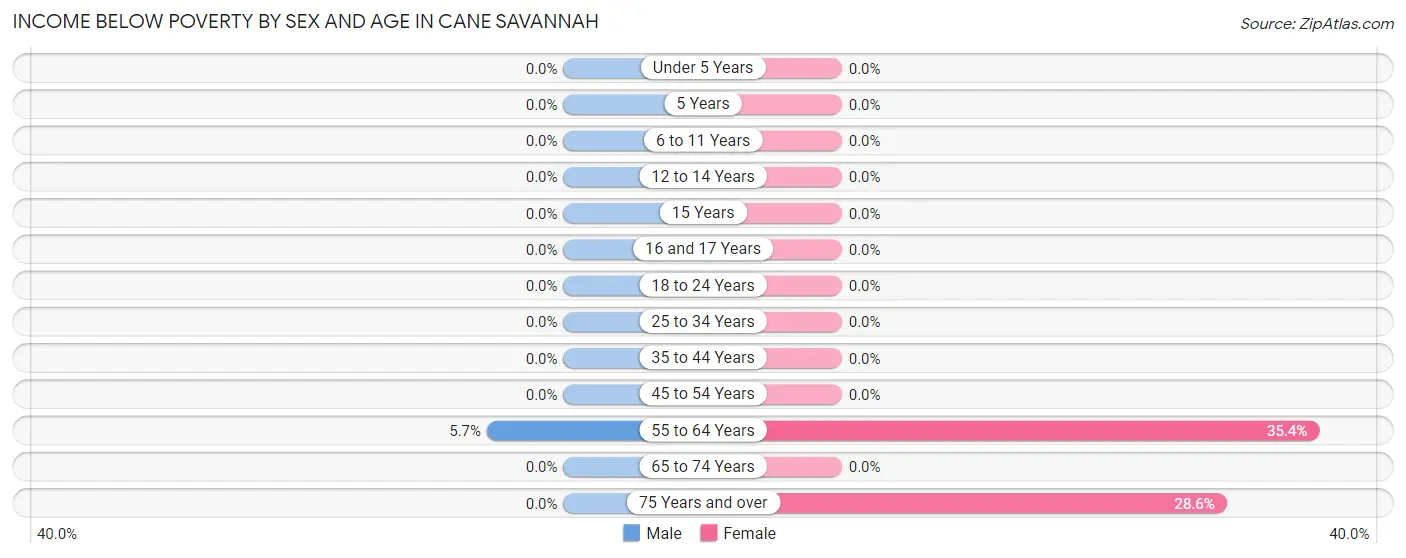
| Age Bracket | Male | Female |
| Under 5 Years | 0 (0.0%) | 0 (0.0%) |
| 5 Years | 0 (0.0%) | 0 (0.0%) |
| 6 to 11 Years | 0 (0.0%) | 0 (0.0%) |
| 12 to 14 Years | 0 (0.0%) | 0 (0.0%) |
| 15 Years | 0 (0.0%) | 0 (0.0%) |
| 16 and 17 Years | 0 (0.0%) | 0 (0.0%) |
| 18 to 24 Years | 0 (0.0%) | 0 (0.0%) |
| 25 to 34 Years | 0 (0.0%) | 0 (0.0%) |
| 35 to 44 Years | 0 (0.0%) | 0 (0.0%) |
| 45 to 54 Years | 0 (0.0%) | 0 (0.0%) |
| 55 to 64 Years | 13 (5.7%) | 28 (35.4%) |
| 65 to 74 Years | 0 (0.0%) | 0 (0.0%) |
| 75 Years and over | 0 (0.0%) | 8 (28.6%) |
| Total | 13 (1.7%) | 36 (4.8%) |
Income Above Poverty by Sex and Age in Cane Savannah
According to the poverty statistics in Cane Savannah, males aged 6 to 11 years and females aged under 5 years are the age groups that are most secure financially, with 100.0% of males and 100.0% of females in these age groups living above the poverty line.
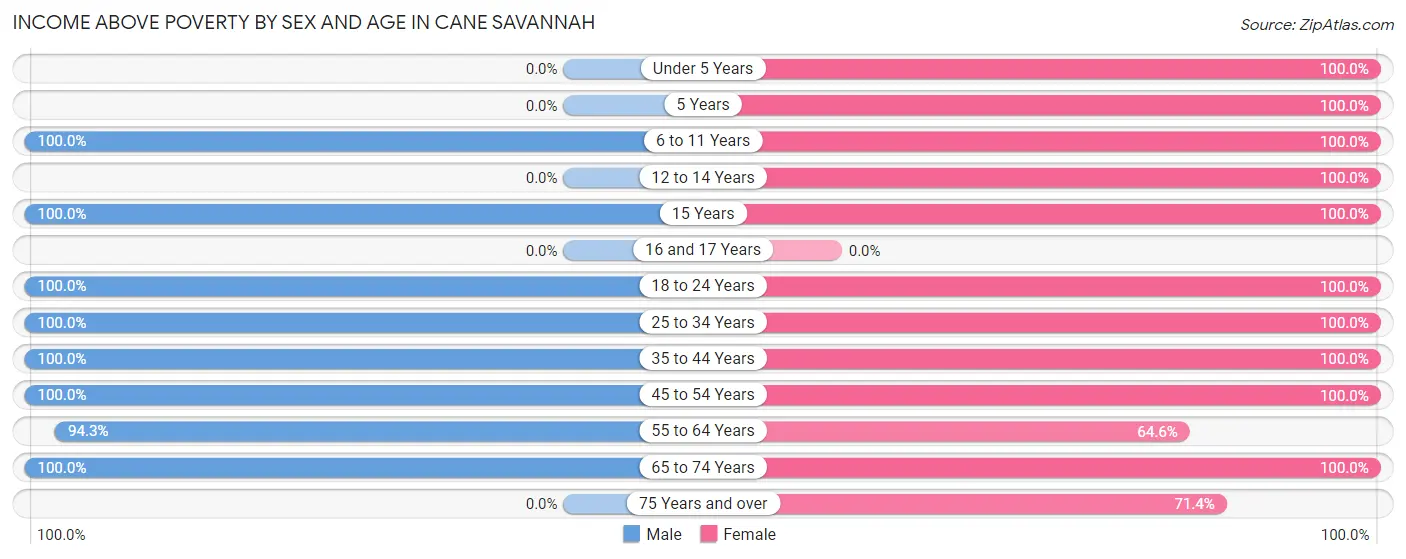
| Age Bracket | Male | Female |
| Under 5 Years | 0 (0.0%) | 21 (100.0%) |
| 5 Years | 0 (0.0%) | 53 (100.0%) |
| 6 to 11 Years | 20 (100.0%) | 41 (100.0%) |
| 12 to 14 Years | 0 (0.0%) | 41 (100.0%) |
| 15 Years | 106 (100.0%) | 14 (100.0%) |
| 16 and 17 Years | 0 (0.0%) | 0 (0.0%) |
| 18 to 24 Years | 119 (100.0%) | 29 (100.0%) |
| 25 to 34 Years | 109 (100.0%) | 105 (100.0%) |
| 35 to 44 Years | 16 (100.0%) | 120 (100.0%) |
| 45 to 54 Years | 155 (100.0%) | 167 (100.0%) |
| 55 to 64 Years | 216 (94.3%) | 51 (64.6%) |
| 65 to 74 Years | 31 (100.0%) | 51 (100.0%) |
| 75 Years and over | 0 (0.0%) | 20 (71.4%) |
| Total | 772 (98.3%) | 713 (95.2%) |
Income Below Poverty Among Married-Couple Families in Cane Savannah
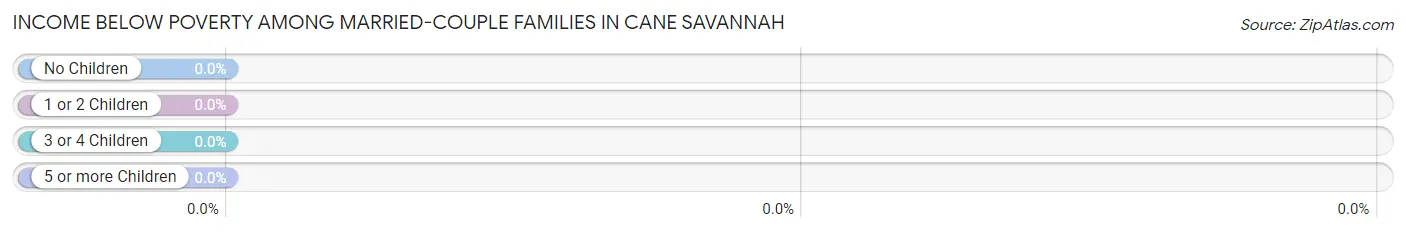
| Children | Above Poverty | Below Poverty |
| No Children | 119 (100.0%) | 0 (0.0%) |
| 1 or 2 Children | 151 (100.0%) | 0 (0.0%) |
| 3 or 4 Children | 0 (0.0%) | 0 (0.0%) |
| 5 or more Children | 0 (0.0%) | 0 (0.0%) |
| Total | 270 (100.0%) | 0 (0.0%) |
Income Below Poverty Among Single-Parent Households in Cane Savannah
| Children | Single Father | Single Mother |
| No Children | 0 (0.0%) | 0 (0.0%) |
| 1 or 2 Children | 0 (0.0%) | 0 (0.0%) |
| 3 or 4 Children | 0 (0.0%) | 0 (0.0%) |
| 5 or more Children | 0 (0.0%) | 0 (0.0%) |
| Total | 0 (0.0%) | 0 (0.0%) |
Income Below Poverty Among Married-Couple vs Single-Parent Households in Cane Savannah
| Children | Married-Couple Families | Single-Parent Households |
| No Children | 0 (0.0%) | 0 (0.0%) |
| 1 or 2 Children | 0 (0.0%) | 0 (0.0%) |
| 3 or 4 Children | 0 (0.0%) | 0 (0.0%) |
| 5 or more Children | 0 (0.0%) | 0 (0.0%) |
| Total | 0 (0.0%) | 0 (0.0%) |
Race in Cane Savannah
The most populous races in Cane Savannah are Black / African American (882 | 57.5%), White / Caucasian (619 | 40.4%), and Two or more Races (33 | 2.1%).
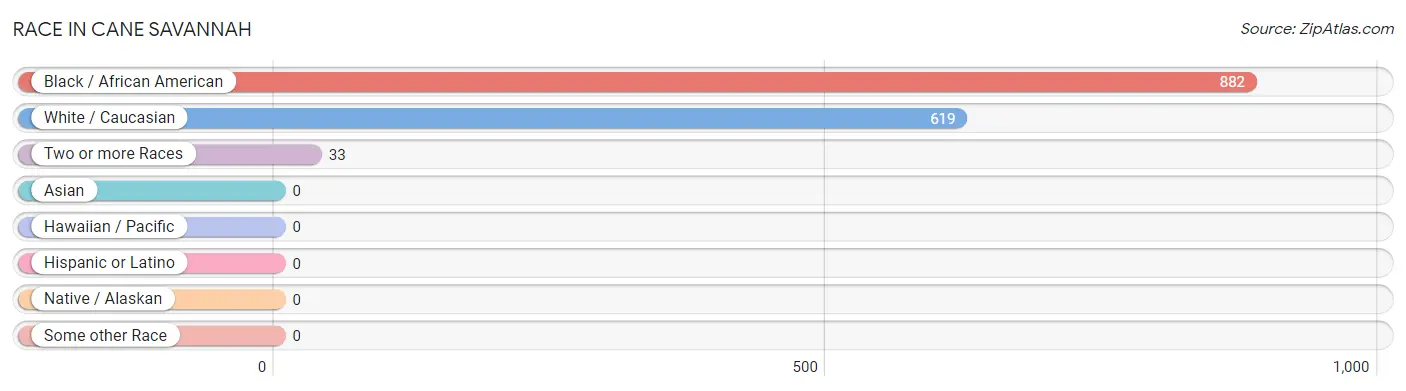
| Race | # Population | % Population |
| Asian | 0 | 0.0% |
| Black / African American | 882 | 57.5% |
| Hawaiian / Pacific | 0 | 0.0% |
| Hispanic or Latino | 0 | 0.0% |
| Native / Alaskan | 0 | 0.0% |
| White / Caucasian | 619 | 40.4% |
| Two or more Races | 33 | 2.1% |
| Some other Race | 0 | 0.0% |
| Total | 1,534 | 100.0% |
Ancestry in Cane Savannah
The most populous ancestries reported in Cane Savannah are Irish (193 | 12.6%), English (91 | 5.9%), German (82 | 5.3%), American (45 | 2.9%), and African (17 | 1.1%), together accounting for 27.9% of all Cane Savannah residents.
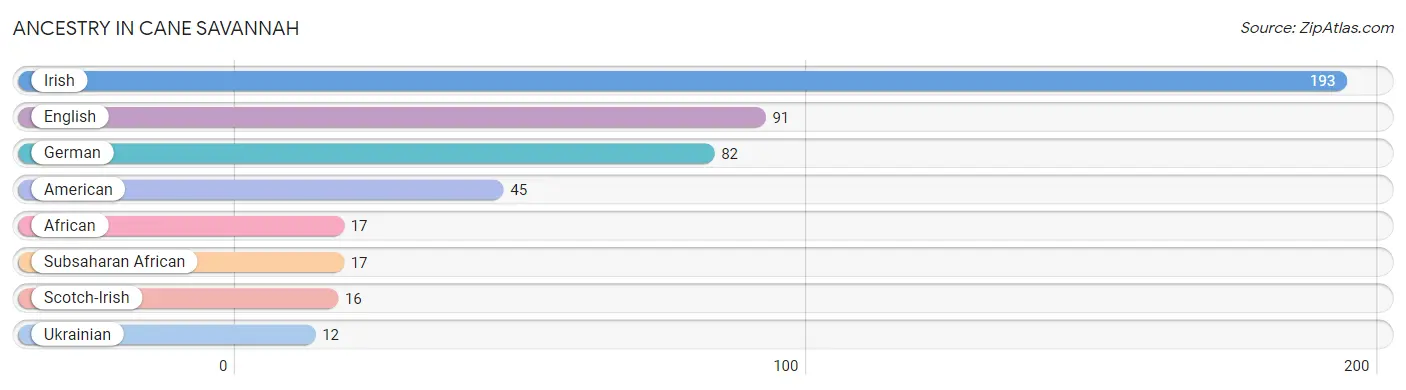
| Ancestry | # Population | % Population |
| African | 17 | 1.1% |
| American | 45 | 2.9% |
| English | 91 | 5.9% |
| German | 82 | 5.3% |
| Irish | 193 | 12.6% |
| Scotch-Irish | 16 | 1.0% |
| Subsaharan African | 17 | 1.1% |
| Ukrainian | 12 | 0.8% | View All 8 Rows |
Immigrants in Cane Savannah
The most numerous immigrant groups reported in Cane Savannah came from Europe (2 | 0.1%), Germany (2 | 0.1%), and Western Europe (2 | 0.1%), together accounting for 0.4% of all Cane Savannah residents.
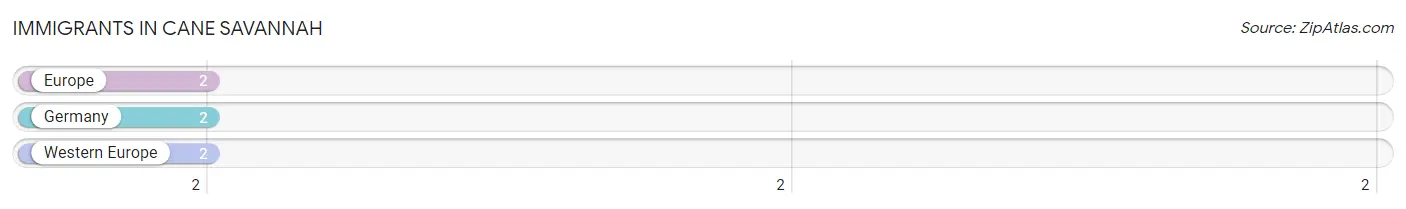
| Immigration Origin | # Population | % Population |
| Europe | 2 | 0.1% |
| Germany | 2 | 0.1% |
| Western Europe | 2 | 0.1% | View All 3 Rows |
Sex and Age in Cane Savannah
Sex and Age in Cane Savannah
The most populous age groups in Cane Savannah are 15 to 19 Years (153 | 19.5%) for men and 40 to 44 Years (106 | 14.1%) for women.
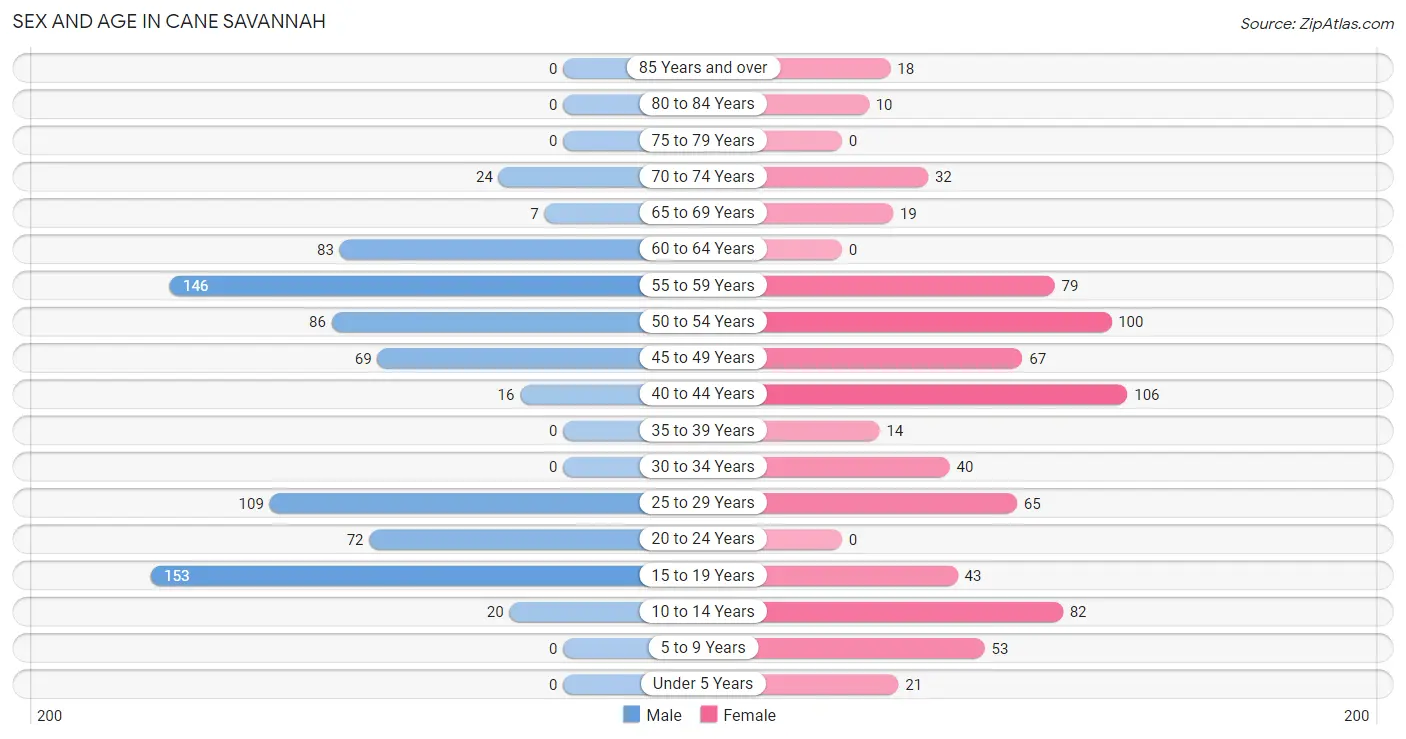
| Age Bracket | Male | Female |
| Under 5 Years | 0 (0.0%) | 21 (2.8%) |
| 5 to 9 Years | 0 (0.0%) | 53 (7.1%) |
| 10 to 14 Years | 20 (2.5%) | 82 (11.0%) |
| 15 to 19 Years | 153 (19.5%) | 43 (5.7%) |
| 20 to 24 Years | 72 (9.2%) | 0 (0.0%) |
| 25 to 29 Years | 109 (13.9%) | 65 (8.7%) |
| 30 to 34 Years | 0 (0.0%) | 40 (5.3%) |
| 35 to 39 Years | 0 (0.0%) | 14 (1.9%) |
| 40 to 44 Years | 16 (2.0%) | 106 (14.1%) |
| 45 to 49 Years | 69 (8.8%) | 67 (8.9%) |
| 50 to 54 Years | 86 (11.0%) | 100 (13.4%) |
| 55 to 59 Years | 146 (18.6%) | 79 (10.5%) |
| 60 to 64 Years | 83 (10.6%) | 0 (0.0%) |
| 65 to 69 Years | 7 (0.9%) | 19 (2.5%) |
| 70 to 74 Years | 24 (3.1%) | 32 (4.3%) |
| 75 to 79 Years | 0 (0.0%) | 0 (0.0%) |
| 80 to 84 Years | 0 (0.0%) | 10 (1.3%) |
| 85 Years and over | 0 (0.0%) | 18 (2.4%) |
| Total | 785 (100.0%) | 749 (100.0%) |
Families and Households in Cane Savannah
Median Family Size in Cane Savannah
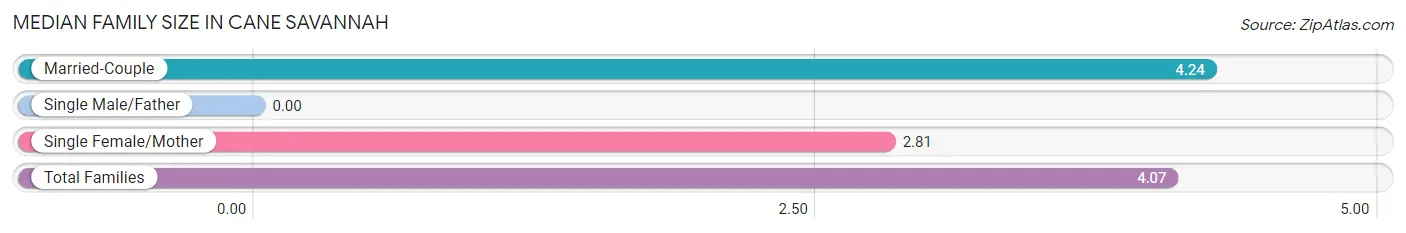
| Family Type | # Families | Family Size |
| Married-Couple | 270 (87.9%) | 4.24 |
| Single Male/Father | 0 (0.0%) | - |
| Single Female/Mother | 37 (12.0%) | 2.81 |
| Total Families | 307 (100.0%) | 4.07 |
Median Household Size in Cane Savannah
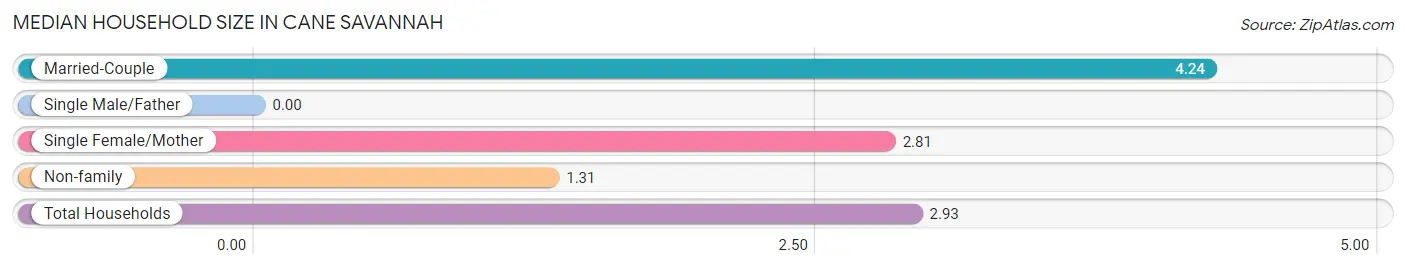
| Household Type | # Households | Household Size |
| Married-Couple | 270 (51.5%) | 4.24 |
| Single Male/Father | 0 (0.0%) | - |
| Single Female/Mother | 37 (7.1%) | 2.81 |
| Non-family | 217 (41.4%) | 1.31 |
| Total Households | 524 (100.0%) | 2.93 |
Household Size by Marriage Status in Cane Savannah
Out of a total of 524 households in Cane Savannah, 307 (58.6%) are family households, while 217 (41.4%) are nonfamily households. The most numerous type of family households are 3-person households, comprising 153, and the most common type of nonfamily households are 1-person households, comprising 151.
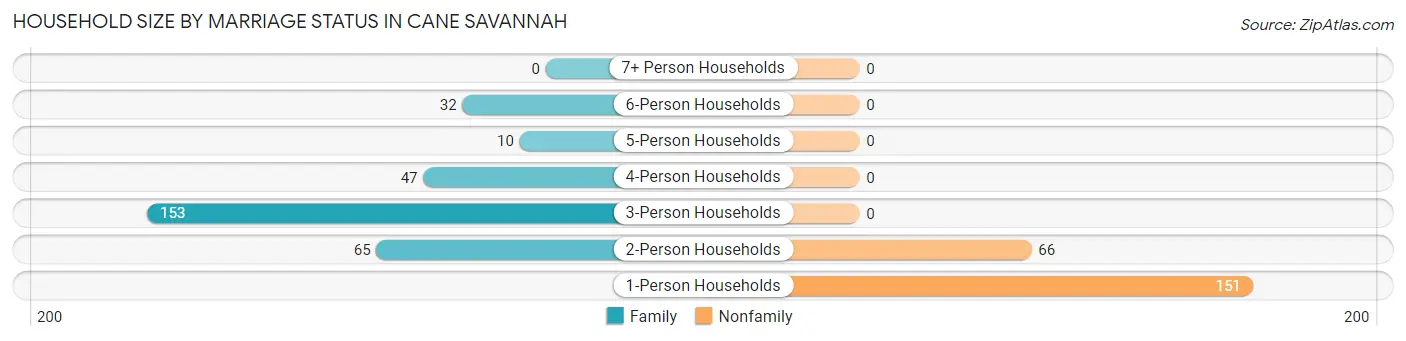
| Household Size | Family Households | Nonfamily Households |
| 1-Person Households | - | 151 (28.8%) |
| 2-Person Households | 65 (12.4%) | 66 (12.6%) |
| 3-Person Households | 153 (29.2%) | 0 (0.0%) |
| 4-Person Households | 47 (9.0%) | 0 (0.0%) |
| 5-Person Households | 10 (1.9%) | 0 (0.0%) |
| 6-Person Households | 32 (6.1%) | 0 (0.0%) |
| 7+ Person Households | 0 (0.0%) | 0 (0.0%) |
| Total | 307 (58.6%) | 217 (41.4%) |
Female Fertility in Cane Savannah
Fertility by Age in Cane Savannah
| Age Bracket | Women with Births | Births / 1,000 Women |
| 15 to 19 years | 0 (0.0%) | 0.0 |
| 20 to 34 years | 0 (0.0%) | 0.0 |
| 35 to 50 years | 0 (0.0%) | 0.0 |
| Total | 0 (0.0%) | 0.0 |
Fertility by Age by Marriage Status in Cane Savannah
| Age Bracket | Married | Unmarried |
| 15 to 19 years | 0 (0.0%) | 0 (0.0%) |
| 20 to 34 years | 0 (0.0%) | 0 (0.0%) |
| 35 to 50 years | 0 (0.0%) | 0 (0.0%) |
| Total | 0 (0.0%) | 0 (0.0%) |
Fertility by Education in Cane Savannah
| Educational Attainment | Women with Births | Births / 1,000 Women |
| Less than High School | 0 (0.0%) | 0.0 |
| High School Diploma | 0 (0.0%) | 0.0 |
| College or Associate's Degree | 0 (0.0%) | 0.0 |
| Bachelor's Degree | 0 (0.0%) | 0.0 |
| Graduate Degree | 0 (0.0%) | 0.0 |
| Total | 0 (0.0%) | 0.0 |
Fertility by Education by Marriage Status in Cane Savannah
| Educational Attainment | Married | Unmarried |
| Less than High School | 0 (0.0%) | 0 (0.0%) |
| High School Diploma | 0 (0.0%) | 0 (0.0%) |
| College or Associate's Degree | 0 (0.0%) | 0 (0.0%) |
| Bachelor's Degree | 0 (0.0%) | 0 (0.0%) |
| Graduate Degree | 0 (0.0%) | 0 (0.0%) |
| Total | 0 (0.0%) | 0 (0.0%) |
Employment Characteristics in Cane Savannah
Employment by Class of Employer in Cane Savannah
Among the 838 employed individuals in Cane Savannah, private company employees (505 | 60.3%), not-for-profit organizations (154 | 18.4%), and federal government employees (58 | 6.9%) make up the most common classes of employment.
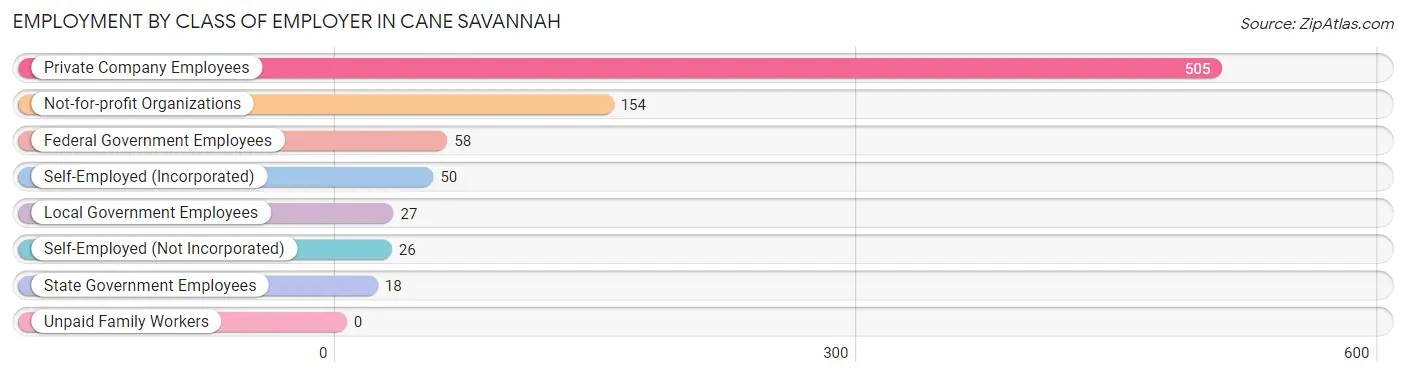
| Employer Class | # Employees | % Employees |
| Private Company Employees | 505 | 60.3% |
| Self-Employed (Incorporated) | 50 | 6.0% |
| Self-Employed (Not Incorporated) | 26 | 3.1% |
| Not-for-profit Organizations | 154 | 18.4% |
| Local Government Employees | 27 | 3.2% |
| State Government Employees | 18 | 2.1% |
| Federal Government Employees | 58 | 6.9% |
| Unpaid Family Workers | 0 | 0.0% |
| Total | 838 | 100.0% |
Employment Status by Age in Cane Savannah
According to the labor force statistics for Cane Savannah, out of the total population over 16 years of age (1,238), 79.8% or 988 individuals are in the labor force, with 10.9% or 108 of them unemployed. The age group with the highest labor force participation rate is 16 to 19 years, with 100.0% or 76 individuals in the labor force. Within the labor force, the 20 to 24 years age range has the highest percentage of unemployed individuals, with 45.8% or 33 of them being unemployed.
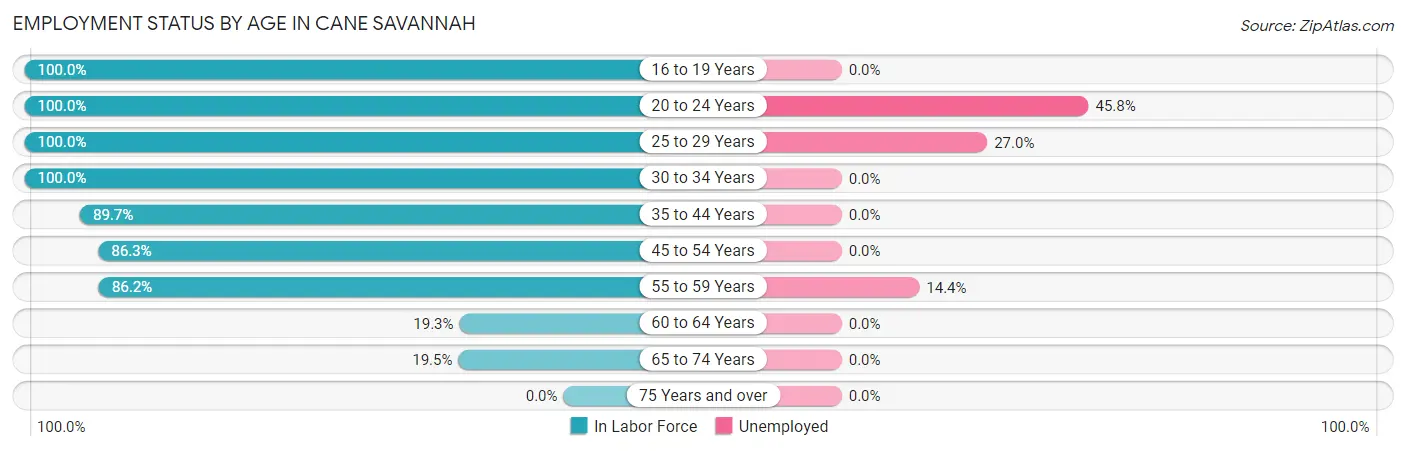
| Age Bracket | In Labor Force | Unemployed |
| 16 to 19 Years | 76 (100.0%) | 0 (0.0%) |
| 20 to 24 Years | 72 (100.0%) | 33 (45.8%) |
| 25 to 29 Years | 174 (100.0%) | 47 (27.0%) |
| 30 to 34 Years | 40 (100.0%) | 0 (0.0%) |
| 35 to 44 Years | 122 (89.7%) | 0 (0.0%) |
| 45 to 54 Years | 278 (86.3%) | 0 (0.0%) |
| 55 to 59 Years | 194 (86.2%) | 28 (14.4%) |
| 60 to 64 Years | 16 (19.3%) | 0 (0.0%) |
| 65 to 74 Years | 16 (19.5%) | 0 (0.0%) |
| 75 Years and over | 0 (0.0%) | 0 (0.0%) |
| Total | 988 (79.8%) | 108 (10.9%) |
Employment Status by Educational Attainment in Cane Savannah
According to labor force statistics for Cane Savannah, 84.1% of individuals (824) out of the total population between 25 and 64 years of age (980) are in the labor force, with 9.1% or 75 of them being unemployed. The group with the highest labor force participation rate are those with the educational attainment of bachelor's degree or higher, with 100.0% or 384 individuals in the labor force. Within the labor force, individuals with high school diploma education have the highest percentage of unemployment, with 22.2% or 75 of them being unemployed.
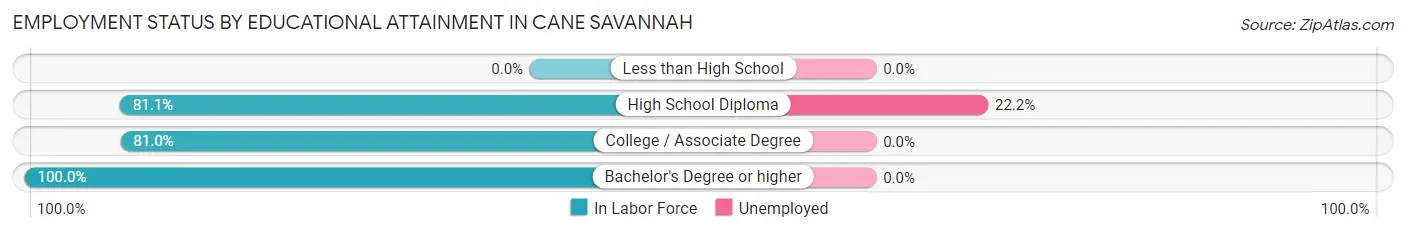
| Educational Attainment | In Labor Force | Unemployed |
| Less than High School | 0 (0.0%) | 0 (0.0%) |
| High School Diploma | 338 (81.1%) | 93 (22.2%) |
| College / Associate Degree | 102 (81.0%) | 0 (0.0%) |
| Bachelor's Degree or higher | 384 (100.0%) | 0 (0.0%) |
| Total | 824 (84.1%) | 89 (9.1%) |
Employment Occupations by Sex in Cane Savannah
Management, Business, Science and Arts Occupations
The most common Management, Business, Science and Arts occupations in Cane Savannah are Health Diagnosing & Treating (221 | 25.1%), Health Technologists (156 | 17.7%), Community & Social Service (118 | 13.4%), Management (54 | 6.1%), and Legal Services & Support (47 | 5.3%).
Management, Business, Science and Arts Occupations by Sex
Within the Management, Business, Science and Arts occupations in Cane Savannah, the most male-oriented occupations are Computers, Engineering & Science (100.0%), Architecture & Engineering (100.0%), and Life, Physical & Social Science (100.0%), while the most female-oriented occupations are Management (100.0%), Education Instruction & Library (100.0%), and Health Diagnosing & Treating (100.0%).
| Occupation | Male | Female |
| Management | 0 (0.0%) | 54 (100.0%) |
| Business & Financial | 0 (0.0%) | 0 (0.0%) |
| Computers, Engineering & Science | 28 (100.0%) | 0 (0.0%) |
| Computers & Mathematics | 0 (0.0%) | 0 (0.0%) |
| Architecture & Engineering | 12 (100.0%) | 0 (0.0%) |
| Life, Physical & Social Science | 16 (100.0%) | 0 (0.0%) |
| Community & Social Service | 81 (68.6%) | 37 (31.4%) |
| Education, Arts & Media | 20 (52.6%) | 18 (47.4%) |
| Legal Services & Support | 47 (100.0%) | 0 (0.0%) |
| Education Instruction & Library | 0 (0.0%) | 19 (100.0%) |
| Arts, Media & Entertainment | 14 (100.0%) | 0 (0.0%) |
| Health Diagnosing & Treating | 0 (0.0%) | 221 (100.0%) |
| Health Technologists | 0 (0.0%) | 156 (100.0%) |
| Total (Category) | 109 (25.9%) | 312 (74.1%) |
| Total (Overall) | 434 (49.3%) | 446 (50.7%) |
Services Occupations
The most common Services occupations in Cane Savannah are Security & Protection (50 | 5.7%), Firefighting & Prevention (50 | 5.7%), and Food Preparation & Serving (39 | 4.4%).
Services Occupations by Sex
| Occupation | Male | Female |
| Healthcare Support | 0 (0.0%) | 0 (0.0%) |
| Security & Protection | 50 (100.0%) | 0 (0.0%) |
| Firefighting & Prevention | 50 (100.0%) | 0 (0.0%) |
| Law Enforcement | 0 (0.0%) | 0 (0.0%) |
| Food Preparation & Serving | 39 (100.0%) | 0 (0.0%) |
| Cleaning & Maintenance | 0 (0.0%) | 0 (0.0%) |
| Personal Care & Service | 0 (0.0%) | 0 (0.0%) |
| Total (Category) | 89 (100.0%) | 0 (0.0%) |
| Total (Overall) | 434 (49.3%) | 446 (50.7%) |
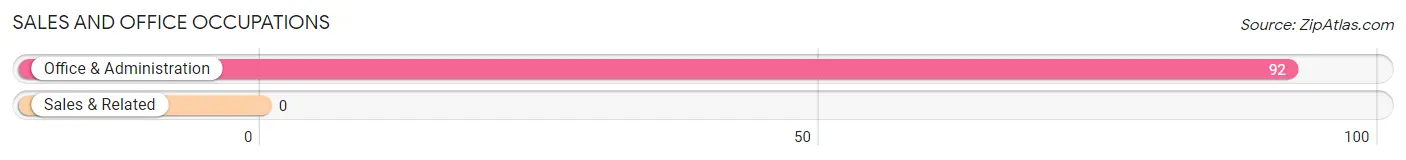
Sales and Office Occupations
The most common Sales and Office occupations in Cane Savannah are , and Office & Administration (92 | 10.4%).
Sales and Office Occupations by Sex
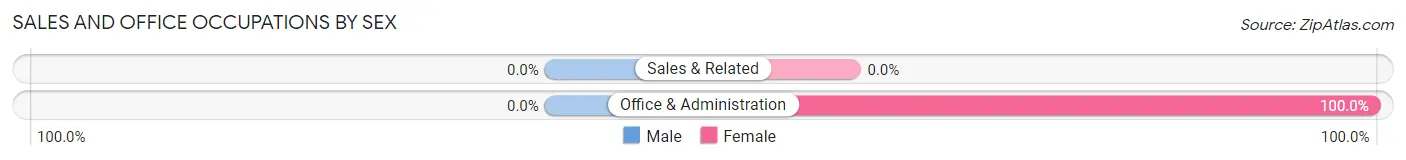
| Occupation | Male | Female |
| Sales & Related | 0 (0.0%) | 0 (0.0%) |
| Office & Administration | 0 (0.0%) | 92 (100.0%) |
| Total (Category) | 0 (0.0%) | 92 (100.0%) |
| Total (Overall) | 434 (49.3%) | 446 (50.7%) |
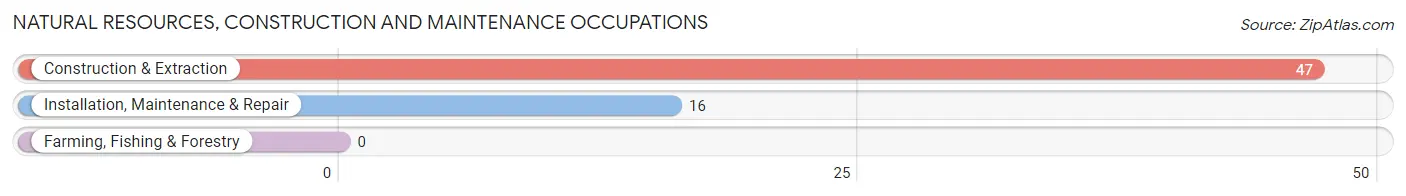
Natural Resources, Construction and Maintenance Occupations
The most common Natural Resources, Construction and Maintenance occupations in Cane Savannah are Construction & Extraction (47 | 5.3%), and Installation, Maintenance & Repair (16 | 1.8%).
Natural Resources, Construction and Maintenance Occupations by Sex
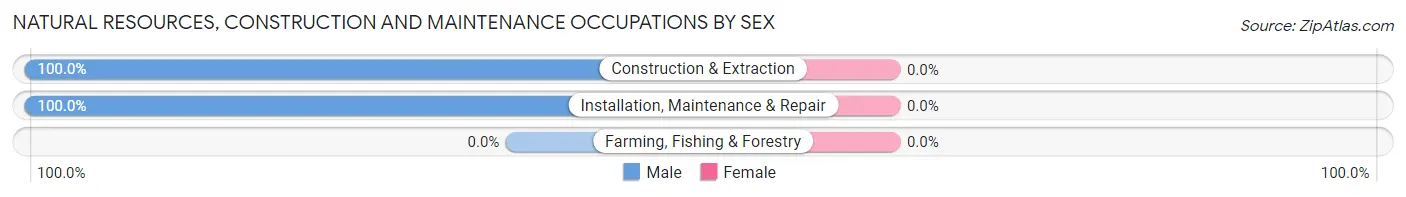
| Occupation | Male | Female |
| Farming, Fishing & Forestry | 0 (0.0%) | 0 (0.0%) |
| Construction & Extraction | 47 (100.0%) | 0 (0.0%) |
| Installation, Maintenance & Repair | 16 (100.0%) | 0 (0.0%) |
| Total (Category) | 63 (100.0%) | 0 (0.0%) |
| Total (Overall) | 434 (49.3%) | 446 (50.7%) |
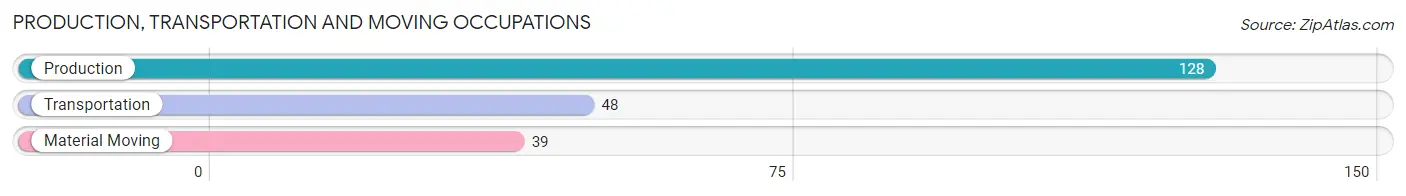
Production, Transportation and Moving Occupations
The most common Production, Transportation and Moving occupations in Cane Savannah are Production (128 | 14.5%), Transportation (48 | 5.4%), and Material Moving (39 | 4.4%).
Production, Transportation and Moving Occupations by Sex
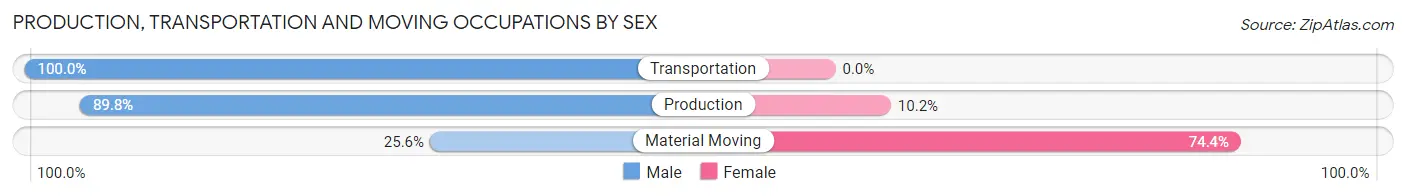
| Occupation | Male | Female |
| Production | 115 (89.8%) | 13 (10.2%) |
| Transportation | 48 (100.0%) | 0 (0.0%) |
| Material Moving | 10 (25.6%) | 29 (74.4%) |
| Total (Category) | 173 (80.5%) | 42 (19.5%) |
| Total (Overall) | 434 (49.3%) | 446 (50.7%) |
Employment Industries by Sex in Cane Savannah
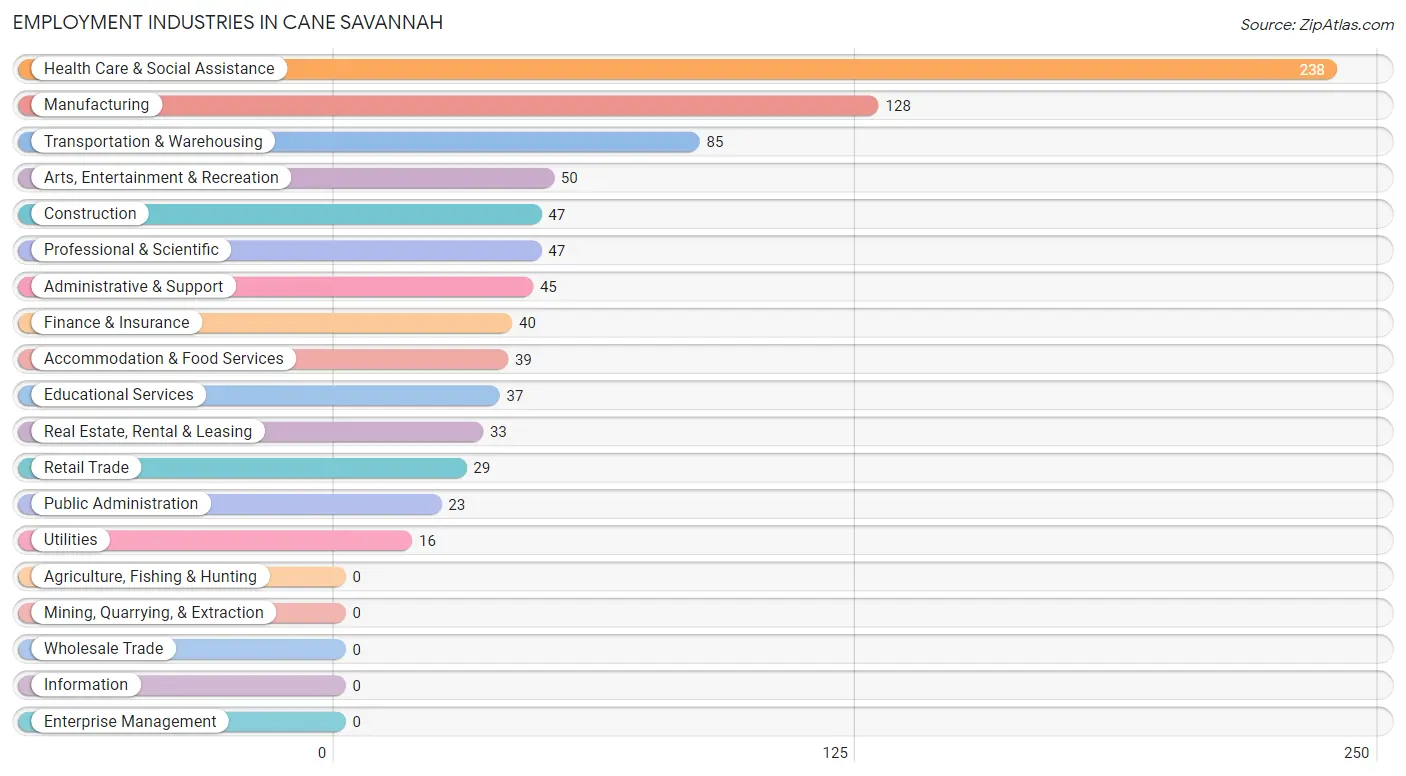
Employment Industries in Cane Savannah
The major employment industries in Cane Savannah include Health Care & Social Assistance (238 | 27.1%), Manufacturing (128 | 14.5%), Transportation & Warehousing (85 | 9.7%), Arts, Entertainment & Recreation (50 | 5.7%), and Construction (47 | 5.3%).
Employment Industries by Sex in Cane Savannah
The Cane Savannah industries that see more men than women are Construction (100.0%), Utilities (100.0%), and Professional & Scientific (100.0%), whereas the industries that tend to have a higher number of women are Retail Trade (100.0%), Finance & Insurance (100.0%), and Real Estate, Rental & Leasing (100.0%).
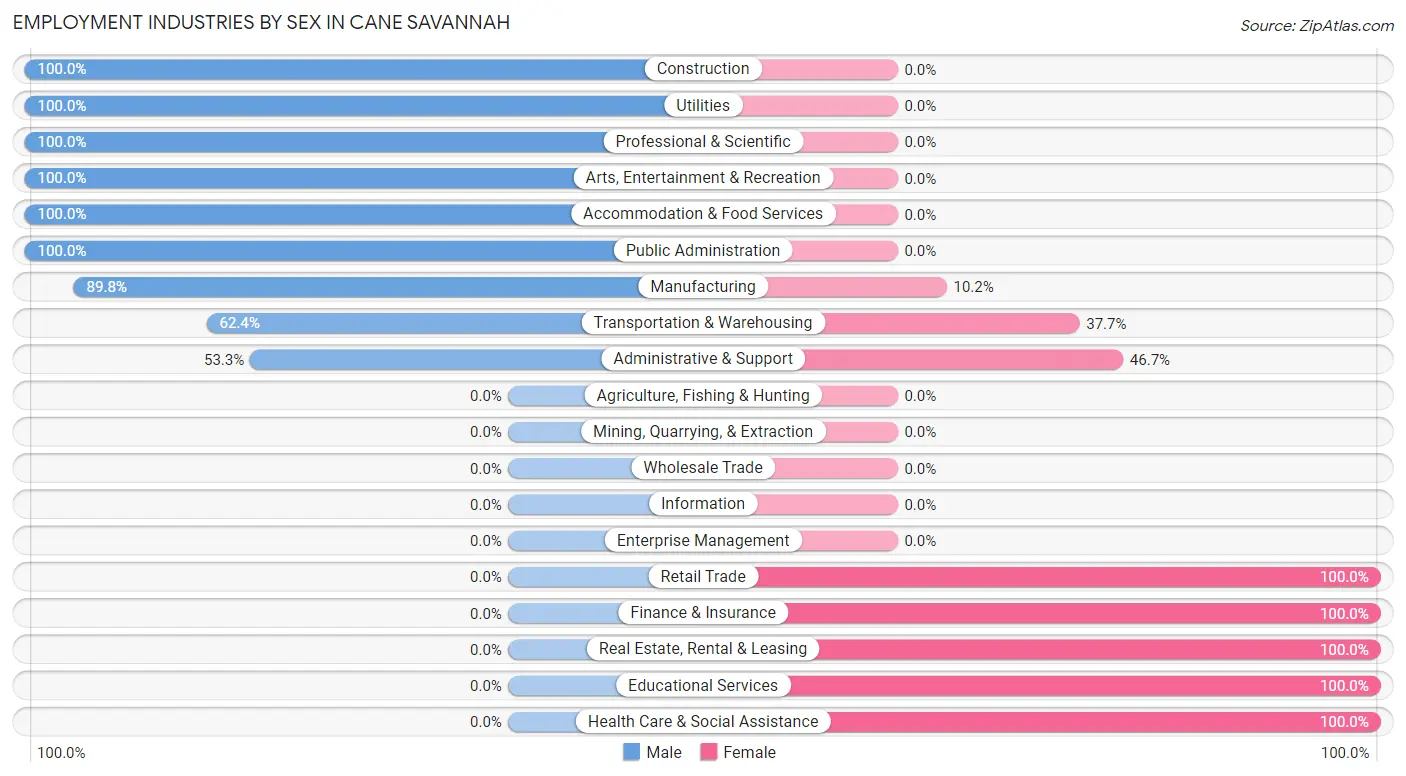
| Industry | Male | Female |
| Agriculture, Fishing & Hunting | 0 (0.0%) | 0 (0.0%) |
| Mining, Quarrying, & Extraction | 0 (0.0%) | 0 (0.0%) |
| Construction | 47 (100.0%) | 0 (0.0%) |
| Manufacturing | 115 (89.8%) | 13 (10.2%) |
| Wholesale Trade | 0 (0.0%) | 0 (0.0%) |
| Retail Trade | 0 (0.0%) | 29 (100.0%) |
| Transportation & Warehousing | 53 (62.4%) | 32 (37.7%) |
| Utilities | 16 (100.0%) | 0 (0.0%) |
| Information | 0 (0.0%) | 0 (0.0%) |
| Finance & Insurance | 0 (0.0%) | 40 (100.0%) |
| Real Estate, Rental & Leasing | 0 (0.0%) | 33 (100.0%) |
| Professional & Scientific | 47 (100.0%) | 0 (0.0%) |
| Enterprise Management | 0 (0.0%) | 0 (0.0%) |
| Administrative & Support | 24 (53.3%) | 21 (46.7%) |
| Educational Services | 0 (0.0%) | 37 (100.0%) |
| Health Care & Social Assistance | 0 (0.0%) | 238 (100.0%) |
| Arts, Entertainment & Recreation | 50 (100.0%) | 0 (0.0%) |
| Accommodation & Food Services | 39 (100.0%) | 0 (0.0%) |
| Public Administration | 23 (100.0%) | 0 (0.0%) |
| Total | 434 (49.3%) | 446 (50.7%) |
Education in Cane Savannah
School Enrollment in Cane Savannah
The most common levels of schooling among the 375 students in Cane Savannah are high school (120 | 32.0%), middle school (102 | 27.2%), and nursery / preschool (74 | 19.7%).
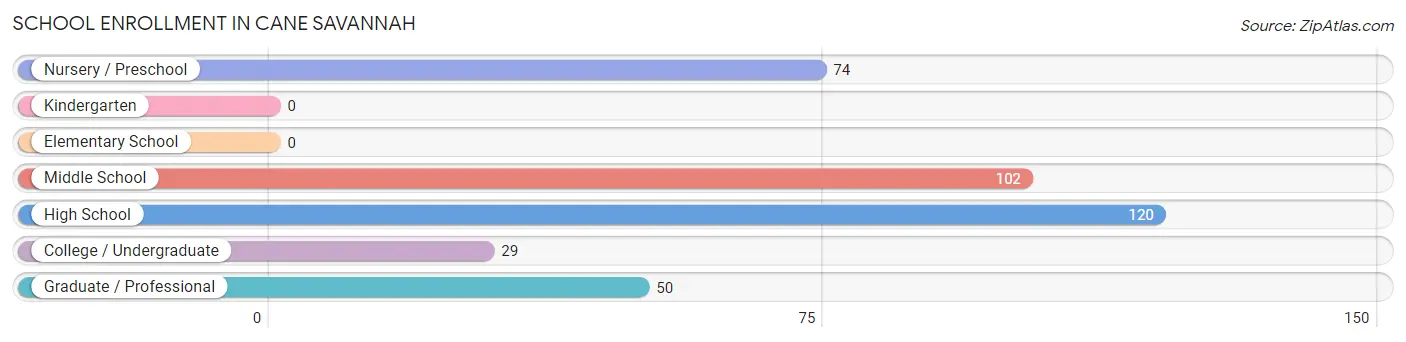
| School Level | # Students | % Students |
| Nursery / Preschool | 74 | 19.7% |
| Kindergarten | 0 | 0.0% |
| Elementary School | 0 | 0.0% |
| Middle School | 102 | 27.2% |
| High School | 120 | 32.0% |
| College / Undergraduate | 29 | 7.7% |
| Graduate / Professional | 50 | 13.3% |
| Total | 375 | 100.0% |
School Enrollment by Age by Funding Source in Cane Savannah
Out of a total of 375 students who are enrolled in schools in Cane Savannah, 124 (33.1%) attend a private institution, while the remaining 251 (66.9%) are enrolled in public schools. The age group of 3 to 4 year olds has the highest likelihood of being enrolled in private schools, with 21 (100.0% in the age bracket) enrolled. Conversely, the age group of 10 to 14 year olds has the lowest likelihood of being enrolled in a private school, with 102 (100.0% in the age bracket) attending a public institution.
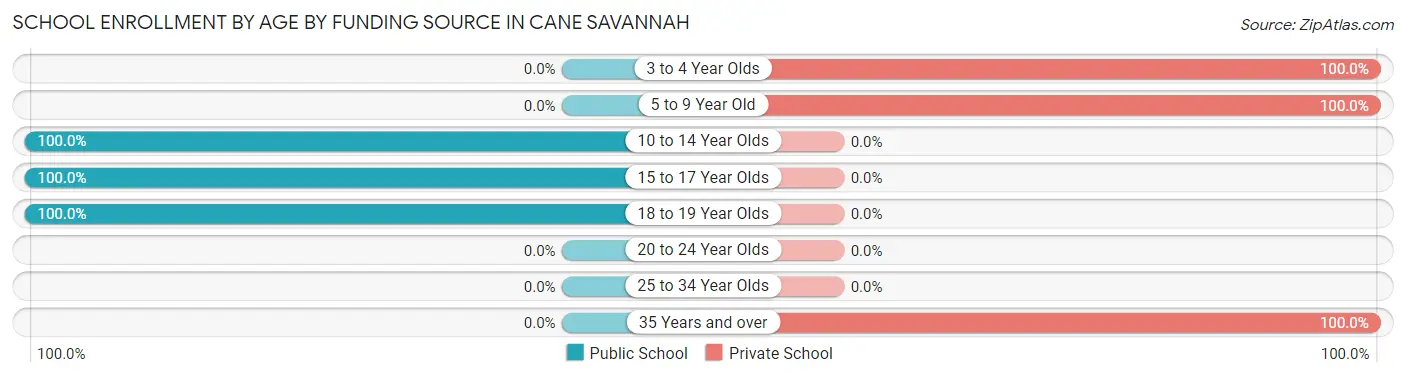
| Age Bracket | Public School | Private School |
| 3 to 4 Year Olds | 0 (0.0%) | 21 (100.0%) |
| 5 to 9 Year Old | 0 (0.0%) | 53 (100.0%) |
| 10 to 14 Year Olds | 102 (100.0%) | 0 (0.0%) |
| 15 to 17 Year Olds | 120 (100.0%) | 0 (0.0%) |
| 18 to 19 Year Olds | 29 (100.0%) | 0 (0.0%) |
| 20 to 24 Year Olds | 0 (0.0%) | 0 (0.0%) |
| 25 to 34 Year Olds | 0 (0.0%) | 0 (0.0%) |
| 35 Years and over | 0 (0.0%) | 50 (100.0%) |
| Total | 251 (66.9%) | 124 (33.1%) |
Educational Attainment by Field of Study in Cane Savannah
Science & technology (168 | 39.0%), social sciences (65 | 15.1%), visual & performing arts (65 | 15.1%), liberal arts & history (47 | 10.9%), and business (33 | 7.7%) are the most common fields of study among 431 individuals in Cane Savannah who have obtained a bachelor's degree or higher.
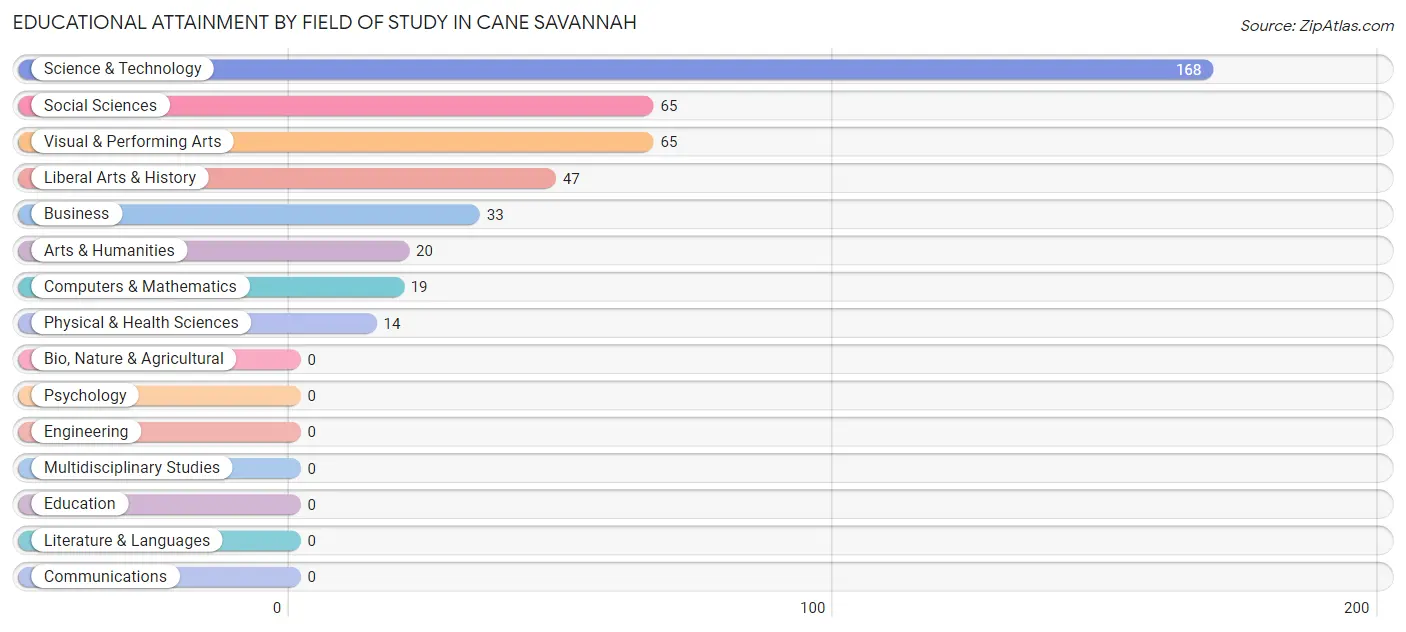
| Field of Study | # Graduates | % Graduates |
| Computers & Mathematics | 19 | 4.4% |
| Bio, Nature & Agricultural | 0 | 0.0% |
| Physical & Health Sciences | 14 | 3.3% |
| Psychology | 0 | 0.0% |
| Social Sciences | 65 | 15.1% |
| Engineering | 0 | 0.0% |
| Multidisciplinary Studies | 0 | 0.0% |
| Science & Technology | 168 | 39.0% |
| Business | 33 | 7.7% |
| Education | 0 | 0.0% |
| Literature & Languages | 0 | 0.0% |
| Liberal Arts & History | 47 | 10.9% |
| Visual & Performing Arts | 65 | 15.1% |
| Communications | 0 | 0.0% |
| Arts & Humanities | 20 | 4.6% |
| Total | 431 | 100.0% |
Transportation & Commute in Cane Savannah
Vehicle Availability by Sex in Cane Savannah
The most prevalent vehicle ownership categories in Cane Savannah are males with 4 vehicles (178, accounting for 41.0%) and females with 4 vehicles (138, making up 44.1%).
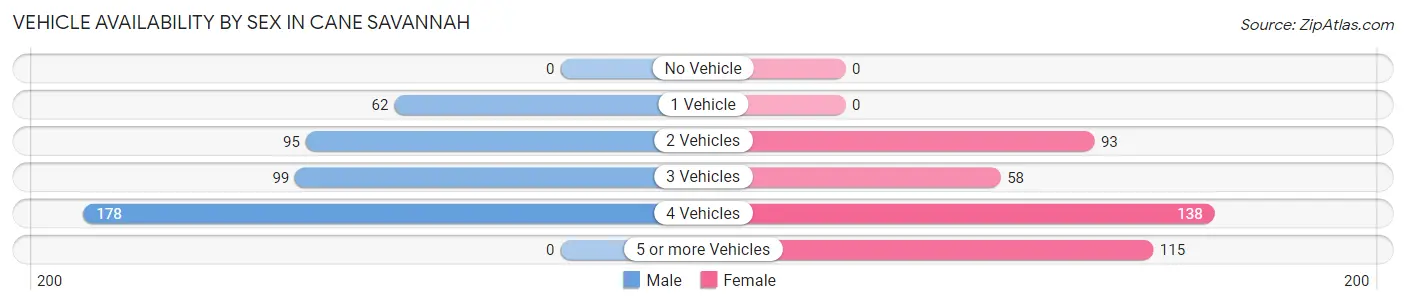
| Vehicles Available | Male | Female |
| No Vehicle | 0 (0.0%) | 0 (0.0%) |
| 1 Vehicle | 62 (14.3%) | 0 (0.0%) |
| 2 Vehicles | 95 (21.9%) | 93 (23.0%) |
| 3 Vehicles | 99 (22.8%) | 58 (14.4%) |
| 4 Vehicles | 178 (41.0%) | 138 (34.2%) |
| 5 or more Vehicles | 0 (0.0%) | 115 (28.5%) |
| Total | 434 (100.0%) | 404 (100.0%) |
Commute Time in Cane Savannah
The most frequently occuring commute durations in Cane Savannah are 15 to 19 minutes (265 commuters, 31.6%), 45 to 59 minutes (190 commuters, 22.7%), and 10 to 14 minutes (147 commuters, 17.5%).
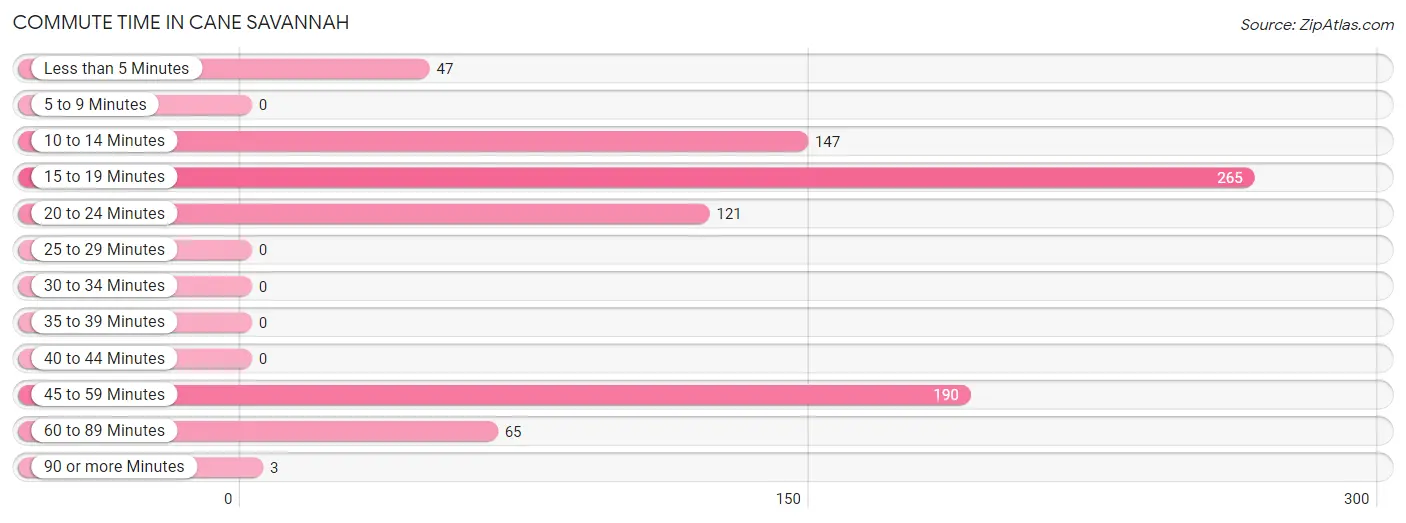
| Commute Time | # Commuters | % Commuters |
| Less than 5 Minutes | 47 | 5.6% |
| 5 to 9 Minutes | 0 | 0.0% |
| 10 to 14 Minutes | 147 | 17.5% |
| 15 to 19 Minutes | 265 | 31.6% |
| 20 to 24 Minutes | 121 | 14.4% |
| 25 to 29 Minutes | 0 | 0.0% |
| 30 to 34 Minutes | 0 | 0.0% |
| 35 to 39 Minutes | 0 | 0.0% |
| 40 to 44 Minutes | 0 | 0.0% |
| 45 to 59 Minutes | 190 | 22.7% |
| 60 to 89 Minutes | 65 | 7.8% |
| 90 or more Minutes | 3 | 0.4% |
Commute Time by Sex in Cane Savannah
The most common commute times in Cane Savannah are 15 to 19 minutes (182 commuters, 41.9%) for males and 45 to 59 minutes (103 commuters, 25.5%) for females.
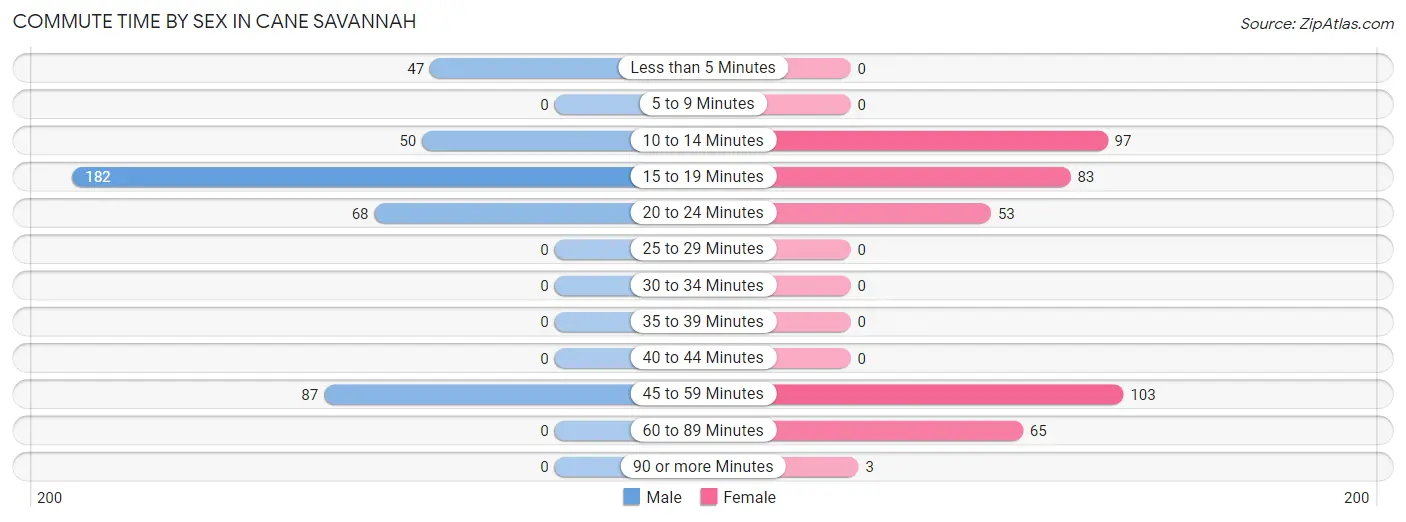
| Commute Time | Male | Female |
| Less than 5 Minutes | 47 (10.8%) | 0 (0.0%) |
| 5 to 9 Minutes | 0 (0.0%) | 0 (0.0%) |
| 10 to 14 Minutes | 50 (11.5%) | 97 (24.0%) |
| 15 to 19 Minutes | 182 (41.9%) | 83 (20.5%) |
| 20 to 24 Minutes | 68 (15.7%) | 53 (13.1%) |
| 25 to 29 Minutes | 0 (0.0%) | 0 (0.0%) |
| 30 to 34 Minutes | 0 (0.0%) | 0 (0.0%) |
| 35 to 39 Minutes | 0 (0.0%) | 0 (0.0%) |
| 40 to 44 Minutes | 0 (0.0%) | 0 (0.0%) |
| 45 to 59 Minutes | 87 (20.1%) | 103 (25.5%) |
| 60 to 89 Minutes | 0 (0.0%) | 65 (16.1%) |
| 90 or more Minutes | 0 (0.0%) | 3 (0.7%) |
Time of Departure to Work by Sex in Cane Savannah
The most frequent times of departure to work in Cane Savannah are 4:00 PM to 11:59 PM (118, 27.2%) for males and 7:30 AM to 7:59 AM (118, 29.2%) for females.
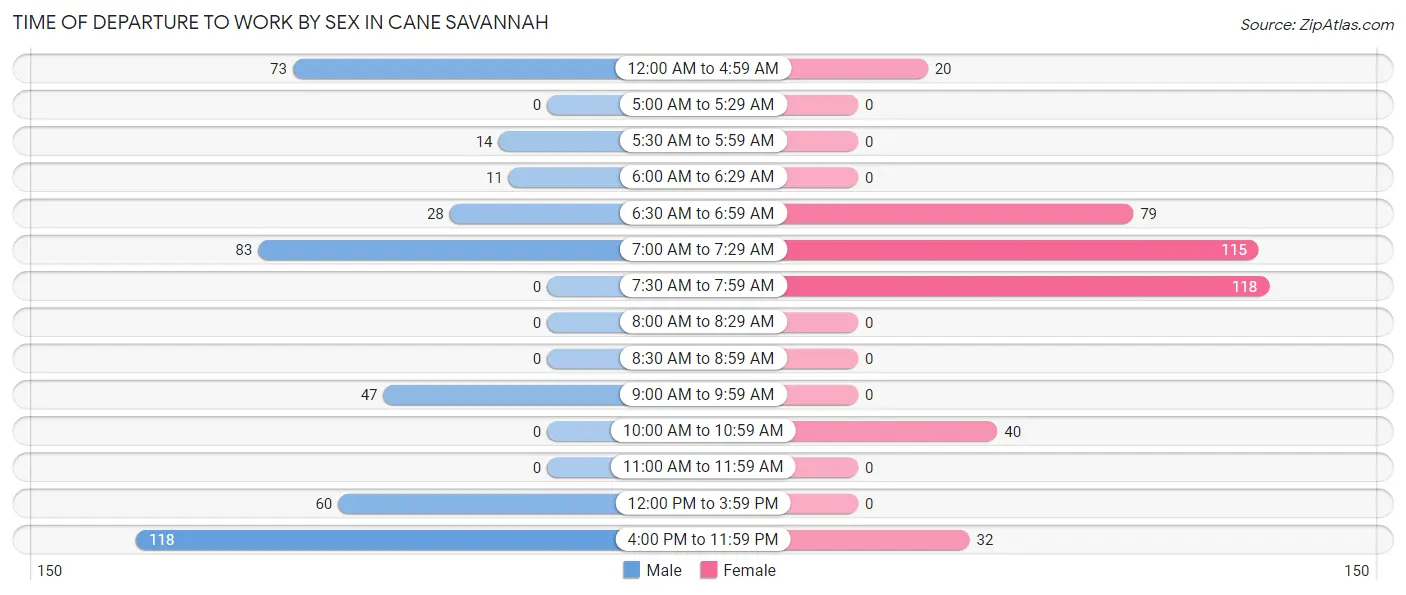
| Time of Departure | Male | Female |
| 12:00 AM to 4:59 AM | 73 (16.8%) | 20 (5.0%) |
| 5:00 AM to 5:29 AM | 0 (0.0%) | 0 (0.0%) |
| 5:30 AM to 5:59 AM | 14 (3.2%) | 0 (0.0%) |
| 6:00 AM to 6:29 AM | 11 (2.5%) | 0 (0.0%) |
| 6:30 AM to 6:59 AM | 28 (6.5%) | 79 (19.6%) |
| 7:00 AM to 7:29 AM | 83 (19.1%) | 115 (28.5%) |
| 7:30 AM to 7:59 AM | 0 (0.0%) | 118 (29.2%) |
| 8:00 AM to 8:29 AM | 0 (0.0%) | 0 (0.0%) |
| 8:30 AM to 8:59 AM | 0 (0.0%) | 0 (0.0%) |
| 9:00 AM to 9:59 AM | 47 (10.8%) | 0 (0.0%) |
| 10:00 AM to 10:59 AM | 0 (0.0%) | 40 (9.9%) |
| 11:00 AM to 11:59 AM | 0 (0.0%) | 0 (0.0%) |
| 12:00 PM to 3:59 PM | 60 (13.8%) | 0 (0.0%) |
| 4:00 PM to 11:59 PM | 118 (27.2%) | 32 (7.9%) |
| Total | 434 (100.0%) | 404 (100.0%) |
Housing Occupancy in Cane Savannah
Occupancy by Ownership in Cane Savannah
Of the total 524 dwellings in Cane Savannah, owner-occupied units account for 407 (77.7%), while renter-occupied units make up 117 (22.3%).
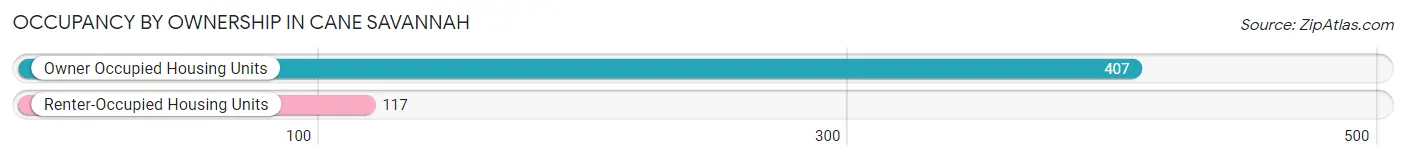
| Occupancy | # Housing Units | % Housing Units |
| Owner Occupied Housing Units | 407 | 77.7% |
| Renter-Occupied Housing Units | 117 | 22.3% |
| Total Occupied Housing Units | 524 | 100.0% |
Occupancy by Household Size in Cane Savannah
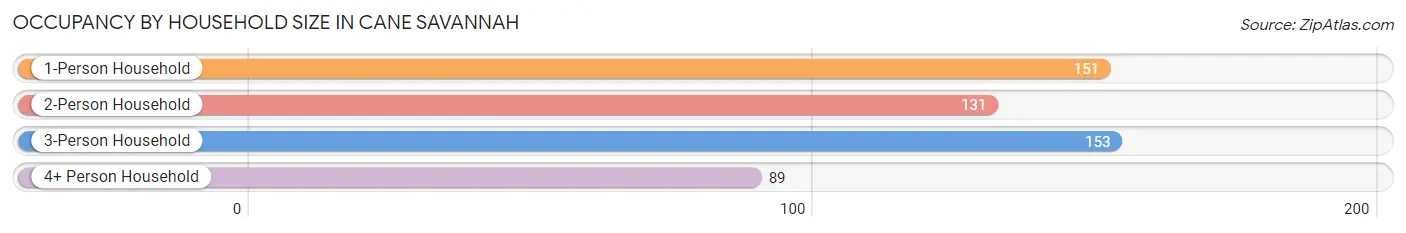
| Household Size | # Housing Units | % Housing Units |
| 1-Person Household | 151 | 28.8% |
| 2-Person Household | 131 | 25.0% |
| 3-Person Household | 153 | 29.2% |
| 4+ Person Household | 89 | 17.0% |
| Total Housing Units | 524 | 100.0% |
Occupancy by Ownership by Household Size in Cane Savannah
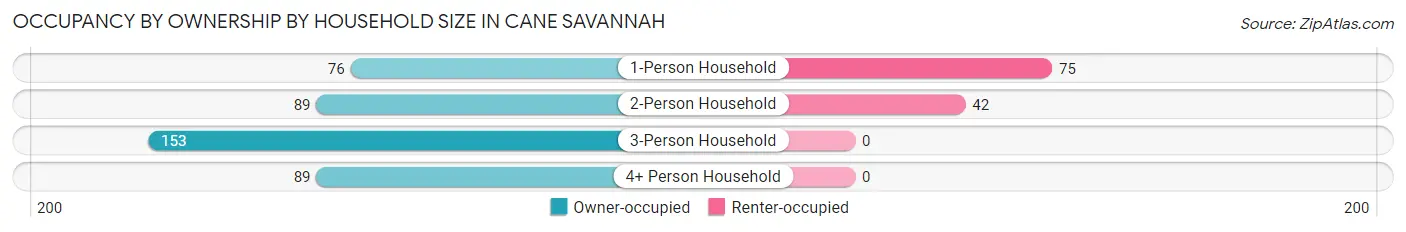
| Household Size | Owner-occupied | Renter-occupied |
| 1-Person Household | 76 (50.3%) | 75 (49.7%) |
| 2-Person Household | 89 (67.9%) | 42 (32.1%) |
| 3-Person Household | 153 (100.0%) | 0 (0.0%) |
| 4+ Person Household | 89 (100.0%) | 0 (0.0%) |
| Total Housing Units | 407 (77.7%) | 117 (22.3%) |
Occupancy by Educational Attainment in Cane Savannah
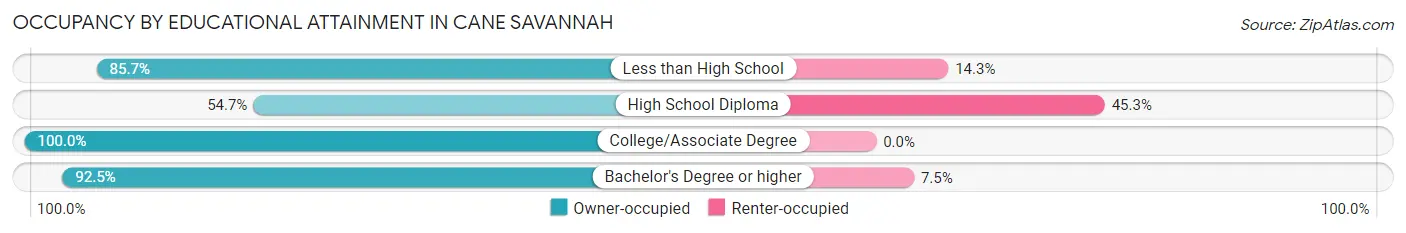
| Household Size | Owner-occupied | Renter-occupied |
| Less than High School | 78 (85.7%) | 13 (14.3%) |
| High School Diploma | 111 (54.7%) | 92 (45.3%) |
| College/Associate Degree | 70 (100.0%) | 0 (0.0%) |
| Bachelor's Degree or higher | 148 (92.5%) | 12 (7.5%) |
Occupancy by Age of Householder in Cane Savannah
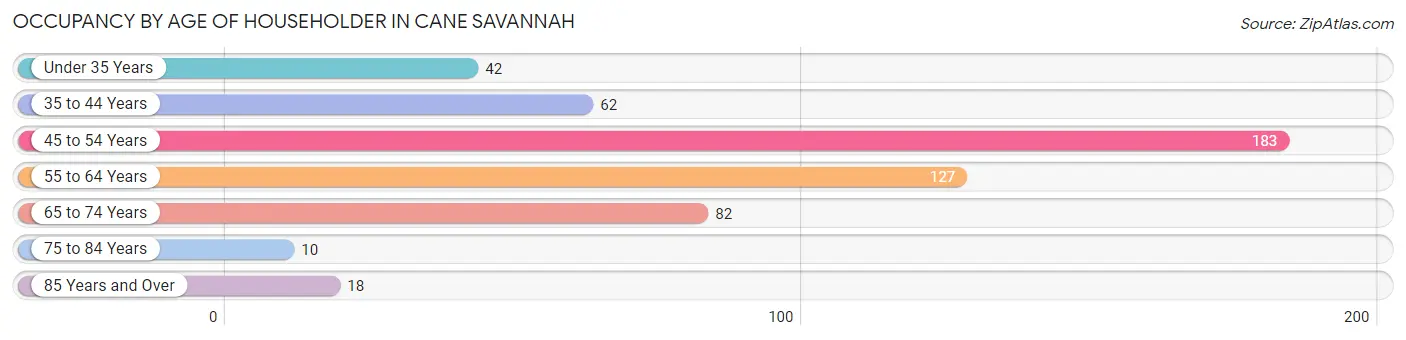
| Age Bracket | # Households | % Households |
| Under 35 Years | 42 | 8.0% |
| 35 to 44 Years | 62 | 11.8% |
| 45 to 54 Years | 183 | 34.9% |
| 55 to 64 Years | 127 | 24.2% |
| 65 to 74 Years | 82 | 15.7% |
| 75 to 84 Years | 10 | 1.9% |
| 85 Years and Over | 18 | 3.4% |
| Total | 524 | 100.0% |
Housing Finances in Cane Savannah
Median Income by Occupancy in Cane Savannah
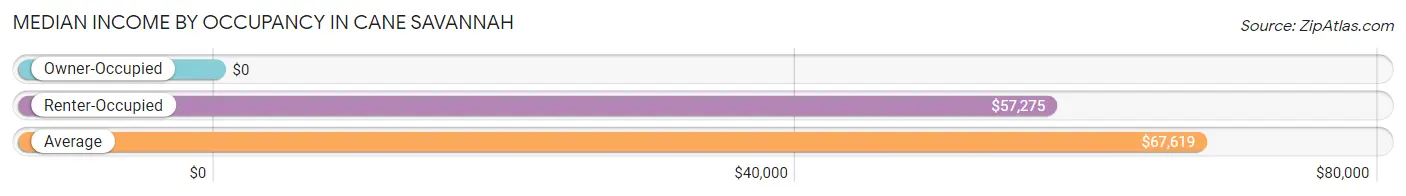
| Occupancy Type | # Households | Median Income |
| Owner-Occupied | 407 (77.7%) | $0 |
| Renter-Occupied | 117 (22.3%) | $57,275 |
| Average | 524 (100.0%) | $67,619 |
Occupancy by Householder Income Bracket in Cane Savannah
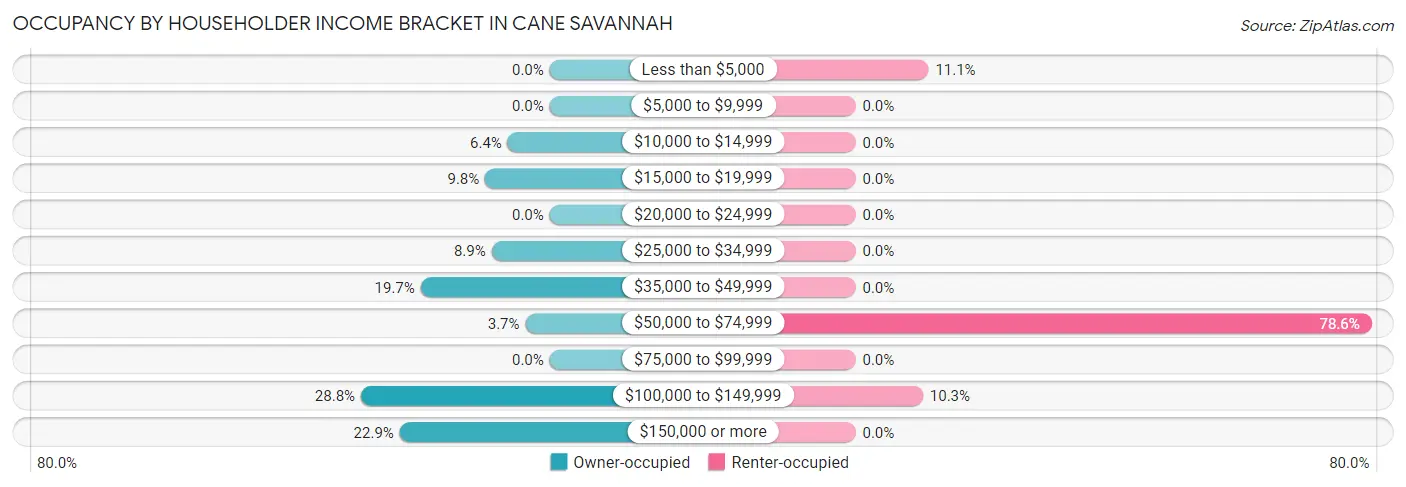
| Income Bracket | Owner-occupied | Renter-occupied |
| Less than $5,000 | 0 (0.0%) | 13 (11.1%) |
| $5,000 to $9,999 | 0 (0.0%) | 0 (0.0%) |
| $10,000 to $14,999 | 26 (6.4%) | 0 (0.0%) |
| $15,000 to $19,999 | 40 (9.8%) | 0 (0.0%) |
| $20,000 to $24,999 | 0 (0.0%) | 0 (0.0%) |
| $25,000 to $34,999 | 36 (8.8%) | 0 (0.0%) |
| $35,000 to $49,999 | 80 (19.7%) | 0 (0.0%) |
| $50,000 to $74,999 | 15 (3.7%) | 92 (78.6%) |
| $75,000 to $99,999 | 0 (0.0%) | 0 (0.0%) |
| $100,000 to $149,999 | 117 (28.7%) | 12 (10.3%) |
| $150,000 or more | 93 (22.9%) | 0 (0.0%) |
| Total | 407 (100.0%) | 117 (100.0%) |
Monthly Housing Cost Tiers in Cane Savannah
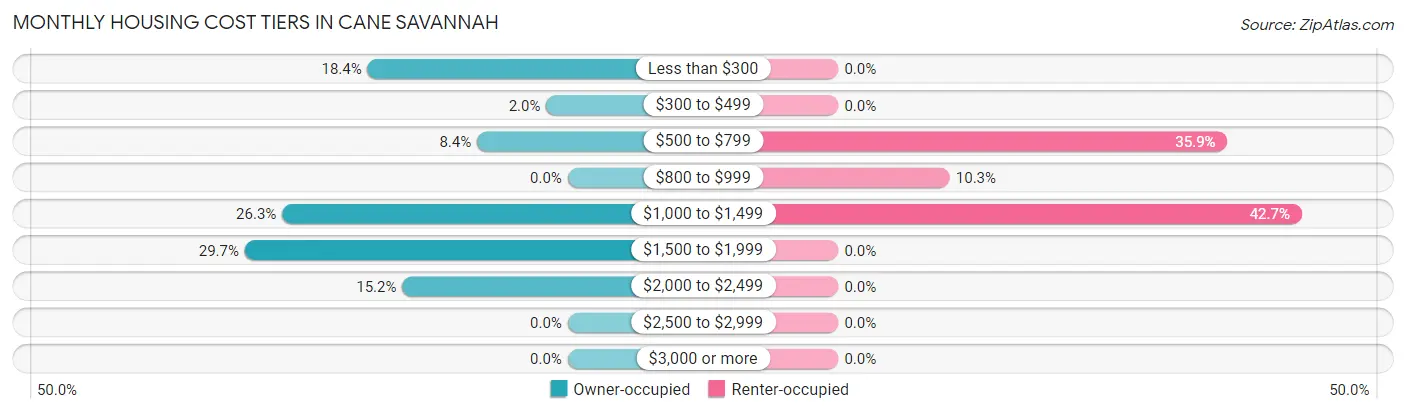
| Monthly Cost | Owner-occupied | Renter-occupied |
| Less than $300 | 75 (18.4%) | 0 (0.0%) |
| $300 to $499 | 8 (2.0%) | 0 (0.0%) |
| $500 to $799 | 34 (8.4%) | 42 (35.9%) |
| $800 to $999 | 0 (0.0%) | 12 (10.3%) |
| $1,000 to $1,499 | 107 (26.3%) | 50 (42.7%) |
| $1,500 to $1,999 | 121 (29.7%) | 0 (0.0%) |
| $2,000 to $2,499 | 62 (15.2%) | 0 (0.0%) |
| $2,500 to $2,999 | 0 (0.0%) | 0 (0.0%) |
| $3,000 or more | 0 (0.0%) | 0 (0.0%) |
| Total | 407 (100.0%) | 117 (100.0%) |
Physical Housing Characteristics in Cane Savannah
Housing Structures in Cane Savannah
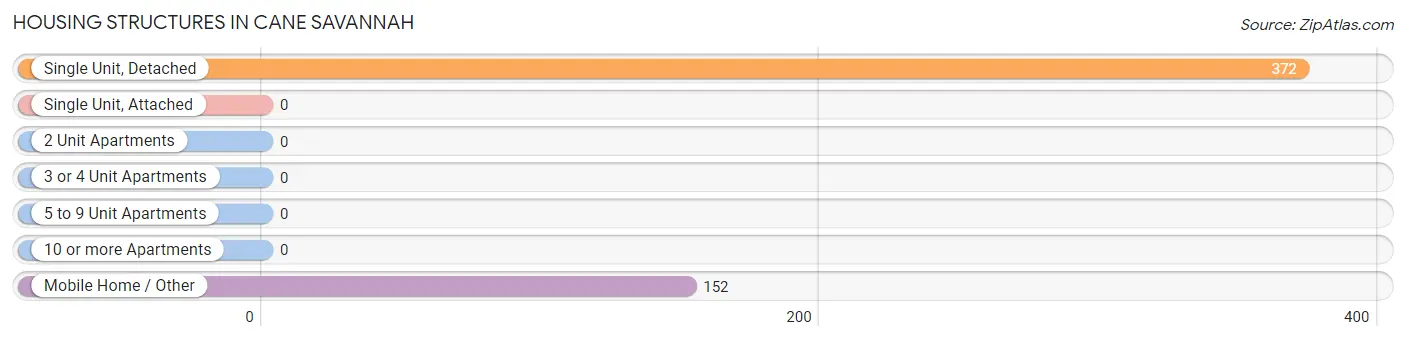
| Structure Type | # Housing Units | % Housing Units |
| Single Unit, Detached | 372 | 71.0% |
| Single Unit, Attached | 0 | 0.0% |
| 2 Unit Apartments | 0 | 0.0% |
| 3 or 4 Unit Apartments | 0 | 0.0% |
| 5 to 9 Unit Apartments | 0 | 0.0% |
| 10 or more Apartments | 0 | 0.0% |
| Mobile Home / Other | 152 | 29.0% |
| Total | 524 | 100.0% |
Housing Structures by Occupancy in Cane Savannah
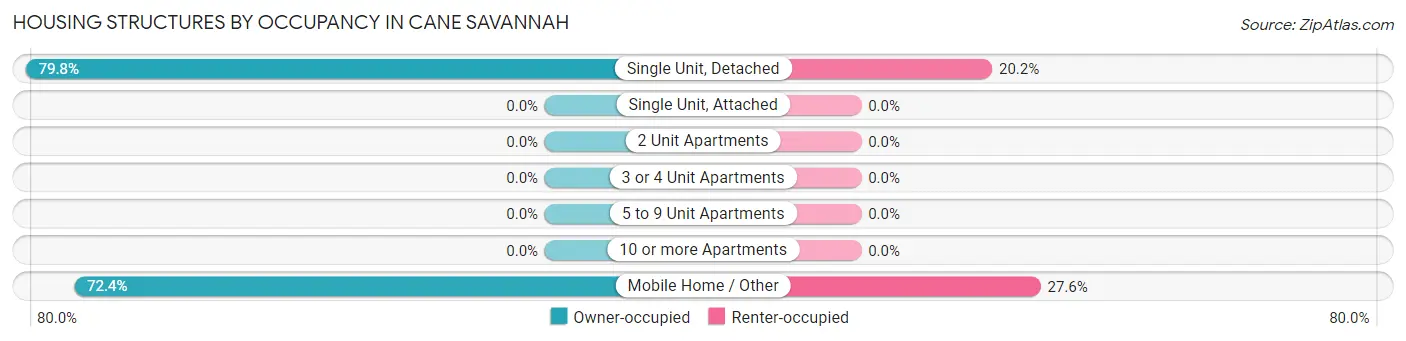
| Structure Type | Owner-occupied | Renter-occupied |
| Single Unit, Detached | 297 (79.8%) | 75 (20.2%) |
| Single Unit, Attached | 0 (0.0%) | 0 (0.0%) |
| 2 Unit Apartments | 0 (0.0%) | 0 (0.0%) |
| 3 or 4 Unit Apartments | 0 (0.0%) | 0 (0.0%) |
| 5 to 9 Unit Apartments | 0 (0.0%) | 0 (0.0%) |
| 10 or more Apartments | 0 (0.0%) | 0 (0.0%) |
| Mobile Home / Other | 110 (72.4%) | 42 (27.6%) |
| Total | 407 (77.7%) | 117 (22.3%) |
Housing Structures by Number of Rooms in Cane Savannah
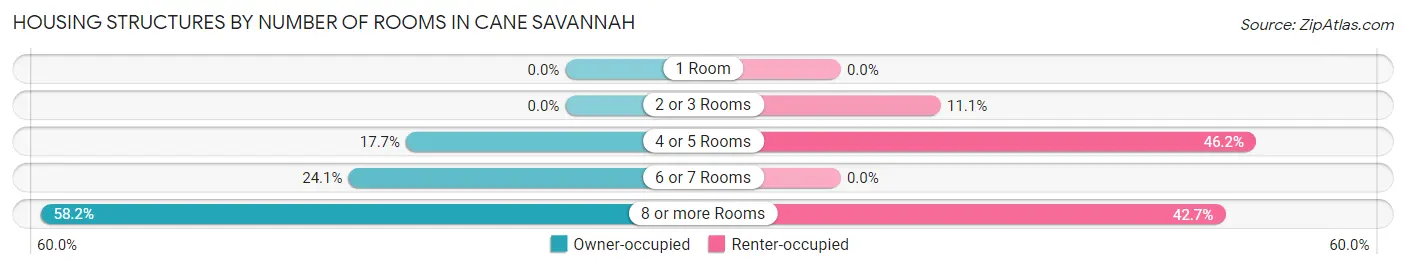
| Number of Rooms | Owner-occupied | Renter-occupied |
| 1 Room | 0 (0.0%) | 0 (0.0%) |
| 2 or 3 Rooms | 0 (0.0%) | 13 (11.1%) |
| 4 or 5 Rooms | 72 (17.7%) | 54 (46.2%) |
| 6 or 7 Rooms | 98 (24.1%) | 0 (0.0%) |
| 8 or more Rooms | 237 (58.2%) | 50 (42.7%) |
| Total | 407 (100.0%) | 117 (100.0%) |
Housing Structure by Heating Type in Cane Savannah
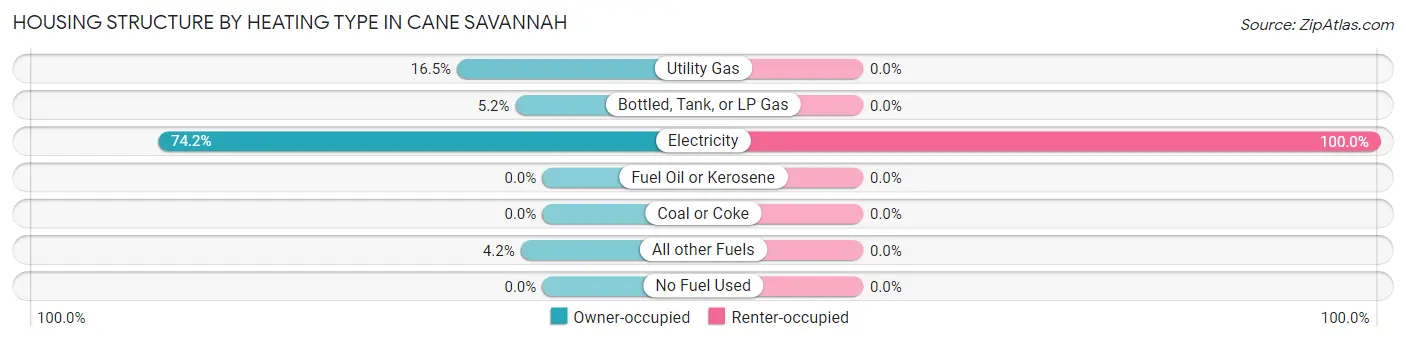
| Heating Type | Owner-occupied | Renter-occupied |
| Utility Gas | 67 (16.5%) | 0 (0.0%) |
| Bottled, Tank, or LP Gas | 21 (5.2%) | 0 (0.0%) |
| Electricity | 302 (74.2%) | 117 (100.0%) |
| Fuel Oil or Kerosene | 0 (0.0%) | 0 (0.0%) |
| Coal or Coke | 0 (0.0%) | 0 (0.0%) |
| All other Fuels | 17 (4.2%) | 0 (0.0%) |
| No Fuel Used | 0 (0.0%) | 0 (0.0%) |
| Total | 407 (100.0%) | 117 (100.0%) |
Household Vehicle Usage in Cane Savannah
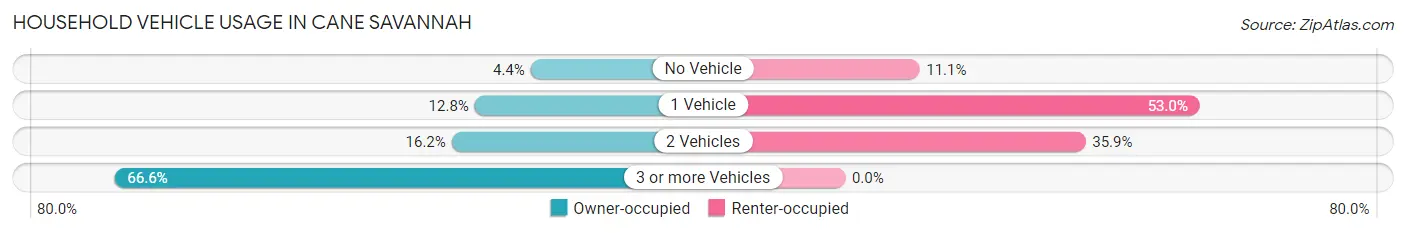
| Vehicles per Household | Owner-occupied | Renter-occupied |
| No Vehicle | 18 (4.4%) | 13 (11.1%) |
| 1 Vehicle | 52 (12.8%) | 62 (53.0%) |
| 2 Vehicles | 66 (16.2%) | 42 (35.9%) |
| 3 or more Vehicles | 271 (66.6%) | 0 (0.0%) |
| Total | 407 (100.0%) | 117 (100.0%) |
Real Estate & Mortgages in Cane Savannah
Real Estate and Mortgage Overview in Cane Savannah
| Characteristic | Without Mortgage | With Mortgage |
| Housing Units | 128 | 279 |
| Median Property Value | $29,200 | $253,900 |
| Median Household Income | $19,792 | $93 |
| Monthly Housing Costs | $238 | $0 |
| Real Estate Taxes | $199 | $0 |
Property Value by Mortgage Status in Cane Savannah
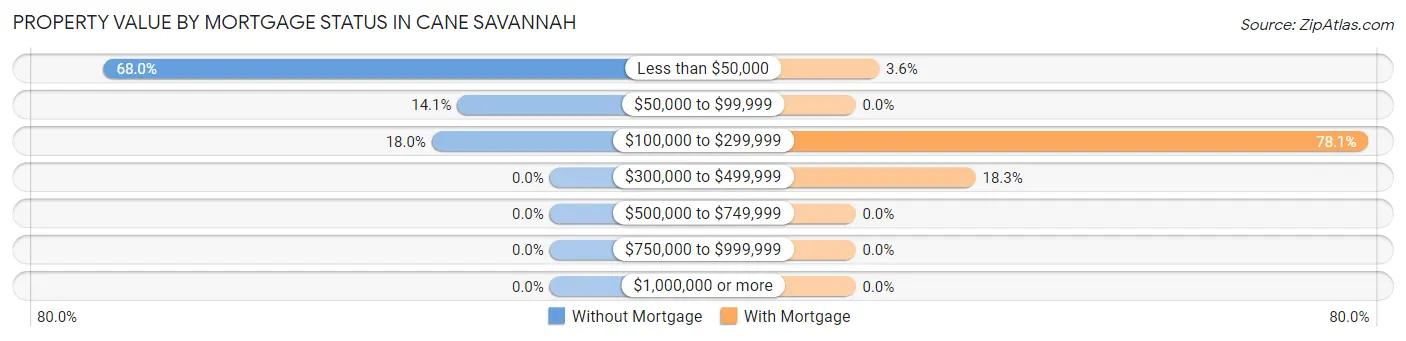
| Property Value | Without Mortgage | With Mortgage |
| Less than $50,000 | 87 (68.0%) | 10 (3.6%) |
| $50,000 to $99,999 | 18 (14.1%) | 0 (0.0%) |
| $100,000 to $299,999 | 23 (18.0%) | 218 (78.1%) |
| $300,000 to $499,999 | 0 (0.0%) | 51 (18.3%) |
| $500,000 to $749,999 | 0 (0.0%) | 0 (0.0%) |
| $750,000 to $999,999 | 0 (0.0%) | 0 (0.0%) |
| $1,000,000 or more | 0 (0.0%) | 0 (0.0%) |
| Total | 128 (100.0%) | 279 (100.0%) |
Household Income by Mortgage Status in Cane Savannah
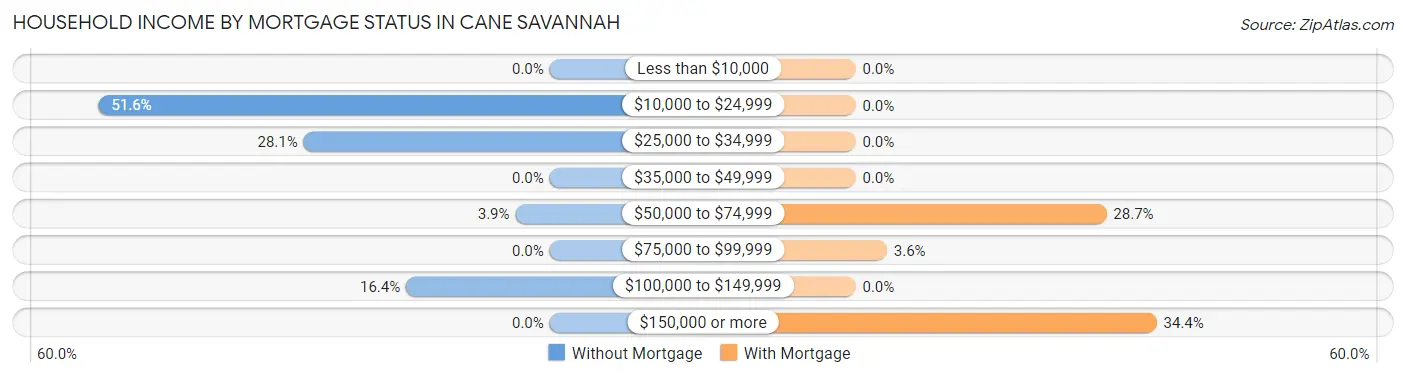
| Household Income | Without Mortgage | With Mortgage |
| Less than $10,000 | 0 (0.0%) | 0 (0.0%) |
| $10,000 to $24,999 | 66 (51.6%) | 0 (0.0%) |
| $25,000 to $34,999 | 36 (28.1%) | 0 (0.0%) |
| $35,000 to $49,999 | 0 (0.0%) | 0 (0.0%) |
| $50,000 to $74,999 | 5 (3.9%) | 80 (28.7%) |
| $75,000 to $99,999 | 0 (0.0%) | 10 (3.6%) |
| $100,000 to $149,999 | 21 (16.4%) | 0 (0.0%) |
| $150,000 or more | 0 (0.0%) | 96 (34.4%) |
| Total | 128 (100.0%) | 279 (100.0%) |
Property Value to Household Income Ratio in Cane Savannah
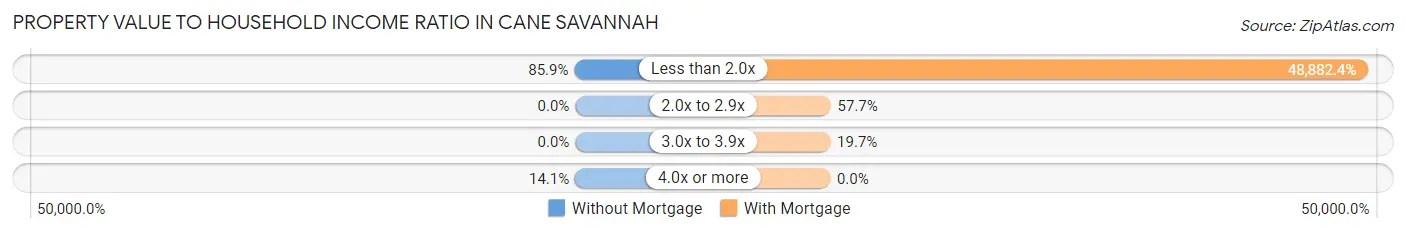
| Value-to-Income Ratio | Without Mortgage | With Mortgage |
| Less than 2.0x | 110 (85.9%) | 136,382 (48,882.4%) |
| 2.0x to 2.9x | 0 (0.0%) | 161 (57.7%) |
| 3.0x to 3.9x | 0 (0.0%) | 55 (19.7%) |
| 4.0x or more | 18 (14.1%) | 0 (0.0%) |
| Total | 128 (100.0%) | 279 (100.0%) |
Real Estate Taxes by Mortgage Status in Cane Savannah
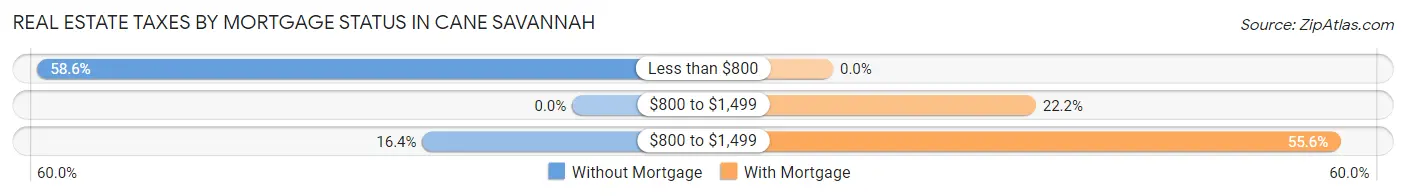
| Property Taxes | Without Mortgage | With Mortgage |
| Less than $800 | 75 (58.6%) | 0 (0.0%) |
| $800 to $1,499 | 0 (0.0%) | 62 (22.2%) |
| $800 to $1,499 | 21 (16.4%) | 155 (55.6%) |
| Total | 128 (100.0%) | 279 (100.0%) |
Health & Disability in Cane Savannah
Health Insurance Coverage by Age in Cane Savannah
| Age Bracket | With Coverage | Without Coverage |
| Under 6 Years | 74 (100.0%) | 0 (0.0%) |
| 6 to 18 Years | 222 (100.0%) | 0 (0.0%) |
| 19 to 25 Years | 168 (100.0%) | 0 (0.0%) |
| 26 to 34 Years | 40 (20.6%) | 154 (79.4%) |
| 35 to 44 Years | 136 (100.0%) | 0 (0.0%) |
| 45 to 54 Years | 322 (100.0%) | 0 (0.0%) |
| 55 to 64 Years | 267 (86.7%) | 41 (13.3%) |
| 65 to 74 Years | 82 (100.0%) | 0 (0.0%) |
| 75 Years and older | 28 (100.0%) | 0 (0.0%) |
| Total | 1,339 (87.3%) | 195 (12.7%) |
Health Insurance Coverage by Citizenship Status in Cane Savannah
| Citizenship Status | With Coverage | Without Coverage |
| Native Born | 74 (100.0%) | 0 (0.0%) |
| Foreign Born, Citizen | 222 (100.0%) | 0 (0.0%) |
| Foreign Born, not a Citizen | 168 (100.0%) | 0 (0.0%) |
Health Insurance Coverage by Household Income in Cane Savannah
| Household Income | With Coverage | Without Coverage |
| Under $25,000 | 66 (61.7%) | 41 (38.3%) |
| $25,000 to $49,999 | 196 (75.1%) | 65 (24.9%) |
| $50,000 to $74,999 | 225 (84.3%) | 42 (15.7%) |
| $75,000 to $99,999 | 0 (0.0%) | 0 (0.0%) |
| $100,000 and over | 852 (94.8%) | 47 (5.2%) |
Public vs Private Health Insurance Coverage by Age in Cane Savannah
| Age Bracket | Public Insurance | Private Insurance |
| Under 6 | 0 (0.0%) | 74 (100.0%) |
| 6 to 18 Years | 116 (52.2%) | 106 (47.7%) |
| 19 to 25 Years | 68 (40.5%) | 100 (59.5%) |
| 25 to 34 Years | 0 (0.0%) | 40 (20.6%) |
| 35 to 44 Years | 16 (11.8%) | 136 (100.0%) |
| 45 to 54 Years | 33 (10.2%) | 300 (93.2%) |
| 55 to 64 Years | 35 (11.4%) | 249 (80.8%) |
| 65 to 74 Years | 82 (100.0%) | 20 (24.4%) |
| 75 Years and over | 28 (100.0%) | 10 (35.7%) |
| Total | 378 (24.6%) | 1,035 (67.5%) |
Disability Status by Sex by Age in Cane Savannah
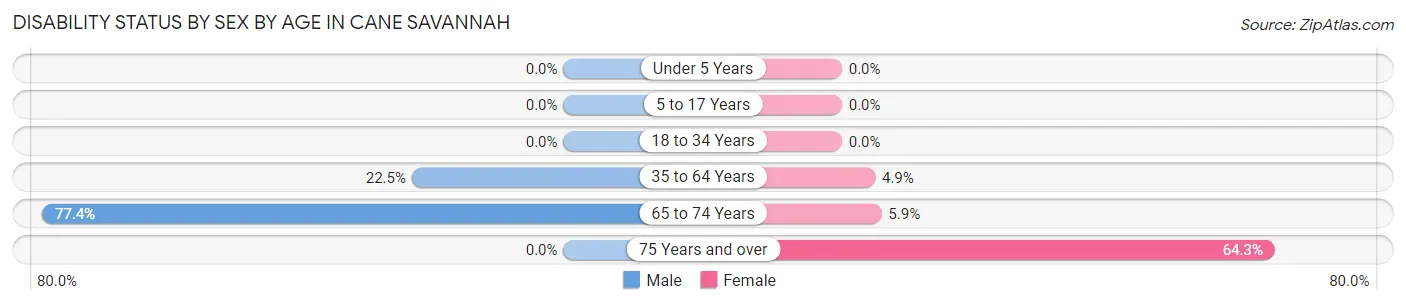
| Age Bracket | Male | Female |
| Under 5 Years | 0 (0.0%) | 0 (0.0%) |
| 5 to 17 Years | 0 (0.0%) | 0 (0.0%) |
| 18 to 34 Years | 0 (0.0%) | 0 (0.0%) |
| 35 to 64 Years | 90 (22.5%) | 18 (4.9%) |
| 65 to 74 Years | 24 (77.4%) | 3 (5.9%) |
| 75 Years and over | 0 (0.0%) | 18 (64.3%) |
Disability Class by Sex by Age in Cane Savannah
Disability Class: Hearing Difficulty
| Age Bracket | Male | Female |
| Under 5 Years | 0 (0.0%) | 0 (0.0%) |
| 5 to 17 Years | 0 (0.0%) | 0 (0.0%) |
| 18 to 34 Years | 0 (0.0%) | 0 (0.0%) |
| 35 to 64 Years | 0 (0.0%) | 0 (0.0%) |
| 65 to 74 Years | 0 (0.0%) | 0 (0.0%) |
| 75 Years and over | 0 (0.0%) | 0 (0.0%) |
Disability Class: Vision Difficulty
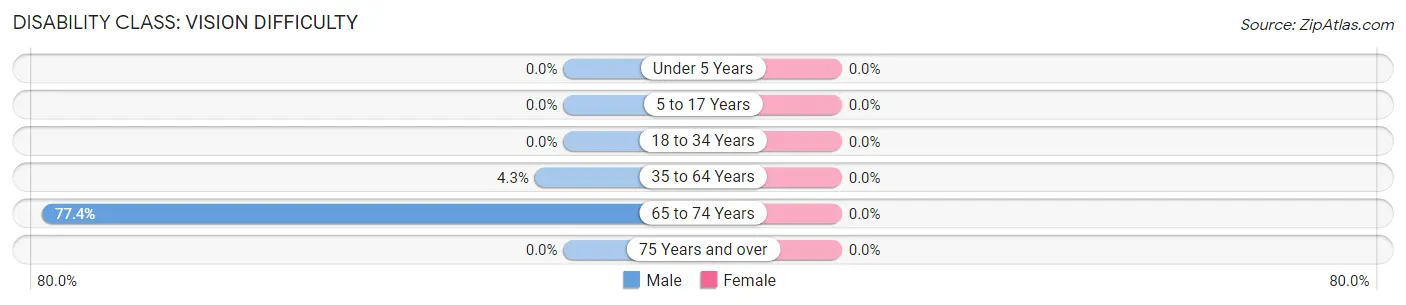
| Age Bracket | Male | Female |
| Under 5 Years | 0 (0.0%) | 0 (0.0%) |
| 5 to 17 Years | 0 (0.0%) | 0 (0.0%) |
| 18 to 34 Years | 0 (0.0%) | 0 (0.0%) |
| 35 to 64 Years | 17 (4.3%) | 0 (0.0%) |
| 65 to 74 Years | 24 (77.4%) | 0 (0.0%) |
| 75 Years and over | 0 (0.0%) | 0 (0.0%) |
Disability Class: Cognitive Difficulty
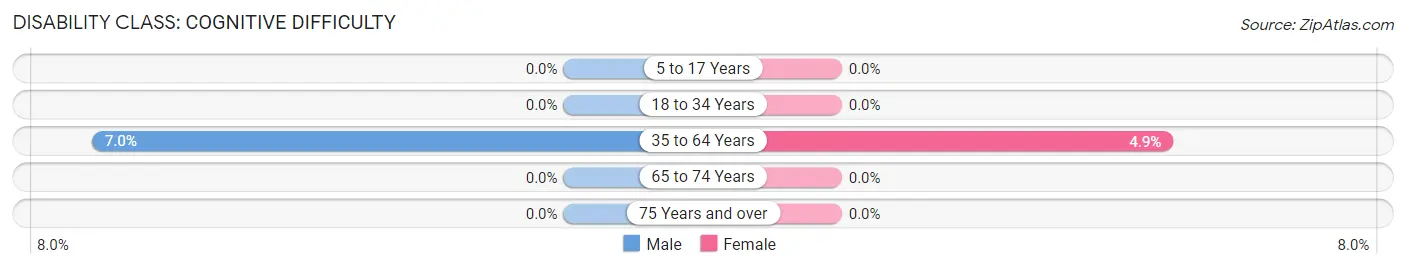
| Age Bracket | Male | Female |
| 5 to 17 Years | 0 (0.0%) | 0 (0.0%) |
| 18 to 34 Years | 0 (0.0%) | 0 (0.0%) |
| 35 to 64 Years | 28 (7.0%) | 18 (4.9%) |
| 65 to 74 Years | 0 (0.0%) | 0 (0.0%) |
| 75 Years and over | 0 (0.0%) | 0 (0.0%) |
Disability Class: Ambulatory Difficulty
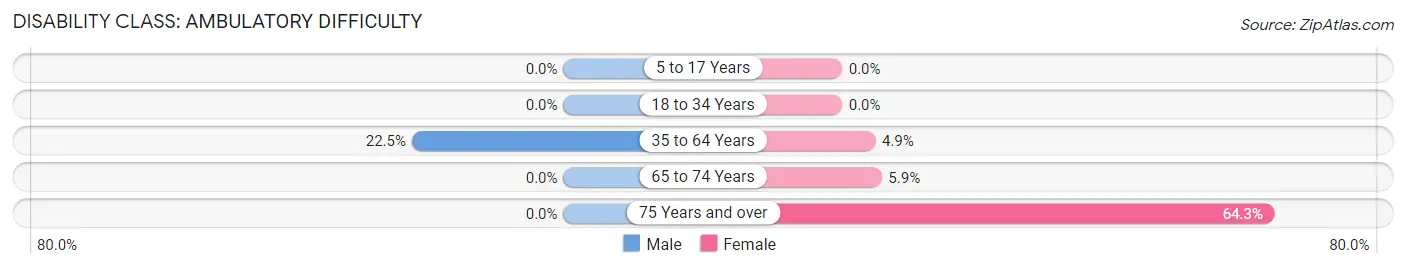
| Age Bracket | Male | Female |
| 5 to 17 Years | 0 (0.0%) | 0 (0.0%) |
| 18 to 34 Years | 0 (0.0%) | 0 (0.0%) |
| 35 to 64 Years | 90 (22.5%) | 18 (4.9%) |
| 65 to 74 Years | 0 (0.0%) | 3 (5.9%) |
| 75 Years and over | 0 (0.0%) | 18 (64.3%) |
Disability Class: Self-Care Difficulty
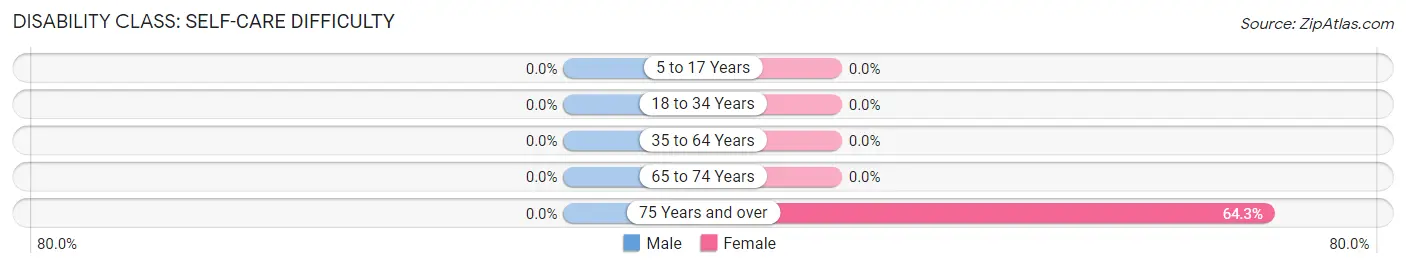
| Age Bracket | Male | Female |
| 5 to 17 Years | 0 (0.0%) | 0 (0.0%) |
| 18 to 34 Years | 0 (0.0%) | 0 (0.0%) |
| 35 to 64 Years | 0 (0.0%) | 0 (0.0%) |
| 65 to 74 Years | 0 (0.0%) | 0 (0.0%) |
| 75 Years and over | 0 (0.0%) | 18 (64.3%) |
Technology Access in Cane Savannah
Computing Device Access in Cane Savannah
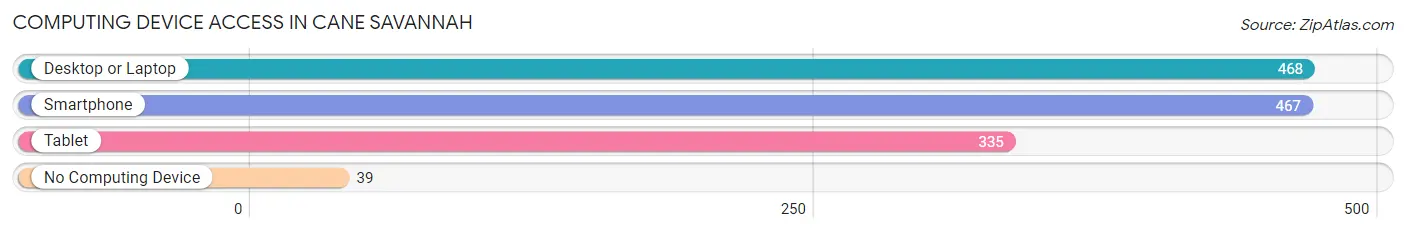
| Device Type | # Households | % Households |
| Desktop or Laptop | 468 | 89.3% |
| Smartphone | 467 | 89.1% |
| Tablet | 335 | 63.9% |
| No Computing Device | 39 | 7.4% |
| Total | 524 | 100.0% |
Internet Access in Cane Savannah
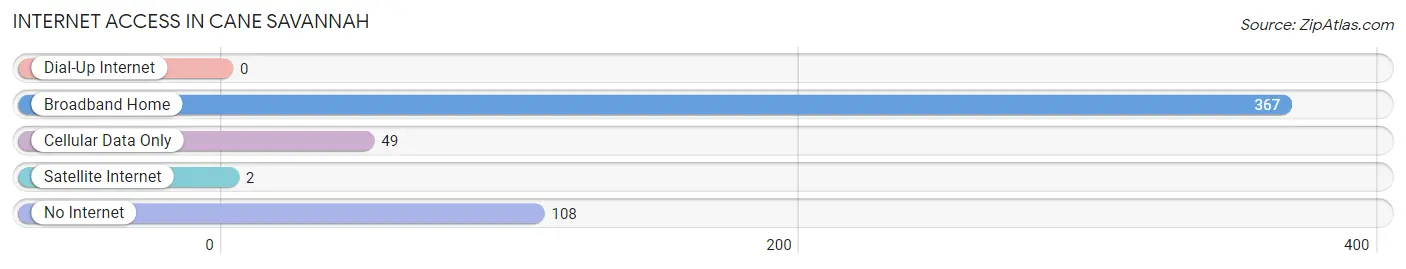
| Internet Type | # Households | % Households |
| Dial-Up Internet | 0 | 0.0% |
| Broadband Home | 367 | 70.0% |
| Cellular Data Only | 49 | 9.3% |
| Satellite Internet | 2 | 0.4% |
| No Internet | 108 | 20.6% |
| Total | 524 | 100.0% |
Cane Savannah Summary
Savannah, Georgia is a city located in the southeastern United States, in the state of Georgia. It is the oldest city in the state and the county seat of Chatham County. Savannah is located along the Savannah River, approximately 20 miles (32 km) upriver from the Atlantic Ocean. The city is the economic and cultural center of the Savannah metropolitan area, which includes all of Chatham County and portions of Bryan, Effingham, and Liberty counties.
History
The area that is now Savannah was first inhabited by Native Americans, including the Yamacraw, Creek, and Cherokee tribes. The first European settlers arrived in 1733, led by James Oglethorpe, who founded the city of Savannah. The city was named after the Savannah River, which was named after the Shawnee tribe.
Savannah quickly became a major port city, and was the fourth largest city in the United States by the time of the American Revolution. During the Revolutionary War, Savannah was captured by the British in 1778, and was later recaptured by the Americans in 1782.
In the 19th century, Savannah became a major cotton port, and was the largest cotton exporting port in the world. The city also became a major center for the slave trade, and was the largest slave port in the United States.
Geography
Savannah is located in the southeastern United States, in the state of Georgia. It is situated along the Savannah River, approximately 20 miles (32 km) upriver from the Atlantic Ocean. The city is located at the intersection of the Savannah and Ogeechee Rivers.
The city has a total area of 108.7 square miles (281.3 km2), of which 106.1 square miles (274.9 km2) is land and 2.6 square miles (6.7 km2) is water. Savannah is located in the humid subtropical climate zone, and has hot, humid summers and mild winters.
Economy
Savannah is the economic and cultural center of the Savannah metropolitan area, which includes all of Chatham County and portions of Bryan, Effingham, and Liberty counties. The city is a major port city, and is home to the Port of Savannah, the fourth busiest port in the United States.
The city is also a major center for tourism, and is home to numerous historic sites, including the Savannah Historic District, which is listed on the National Register of Historic Places. The city is also home to several colleges and universities, including Savannah State University, Armstrong State University, and South University.
Demographics
As of the 2010 census, the population of Savannah was 136,286. The racial makeup of the city was 54.2% African American, 37.2% White, 0.3% Native American, 2.2% Asian, 0.1% Pacific Islander, 3.3% from other races, and 2.7% from two or more races. Hispanic or Latino of any race were 8.2% of the population.
The median household income in Savannah was $37,845, and the median family income was $45,845. The per capita income in the city was $21,845. About 19.2% of the population was below the poverty line.
Common Questions
What is Per Capita Income in Cane Savannah?
Per Capita income in Cane Savannah is $33,531.
What is the Median Family Income in Cane Savannah?
Median Family Income in Cane Savannah is $124,727.
What is the Median Household income in Cane Savannah?
Median Household Income in Cane Savannah is $67,619.
What is Income or Wage Gap in Cane Savannah?
Income or Wage Gap in Cane Savannah is 24.6%.
Women in Cane Savannah earn 75.4 cents for every dollar earned by a man.
What is Inequality or Gini Index in Cane Savannah?
Inequality or Gini Index in Cane Savannah is 0.39.
What is the Total Population of Cane Savannah?
Total Population of Cane Savannah is 1,534.
What is the Total Male Population of Cane Savannah?
Total Male Population of Cane Savannah is 785.
What is the Total Female Population of Cane Savannah?
Total Female Population of Cane Savannah is 749.
What is the Ratio of Males per 100 Females in Cane Savannah?
There are 104.81 Males per 100 Females in Cane Savannah.
What is the Ratio of Females per 100 Males in Cane Savannah?
There are 95.41 Females per 100 Males in Cane Savannah.
What is the Median Population Age in Cane Savannah?
Median Population Age in Cane Savannah is 44.6 Years.
What is the Average Family Size in Cane Savannah
Average Family Size in Cane Savannah is 4.1 People.
What is the Average Household Size in Cane Savannah
Average Household Size in Cane Savannah is 2.9 People.
How Large is the Labor Force in Cane Savannah?
There are 988 People in the Labor Forcein in Cane Savannah.
What is the Percentage of People in the Labor Force in Cane Savannah?
79.8% of People are in the Labor Force in Cane Savannah.
What is the Unemployment Rate in Cane Savannah?
Unemployment Rate in Cane Savannah is 10.9%.