Zip Codes with the Highest Percentage of Population Employed in Life, Physical & Social Science in Seneca, SC
RELATED REPORTS & OPTIONS
Life, Physical & Social Science
Seneca
Compare Zip Codes
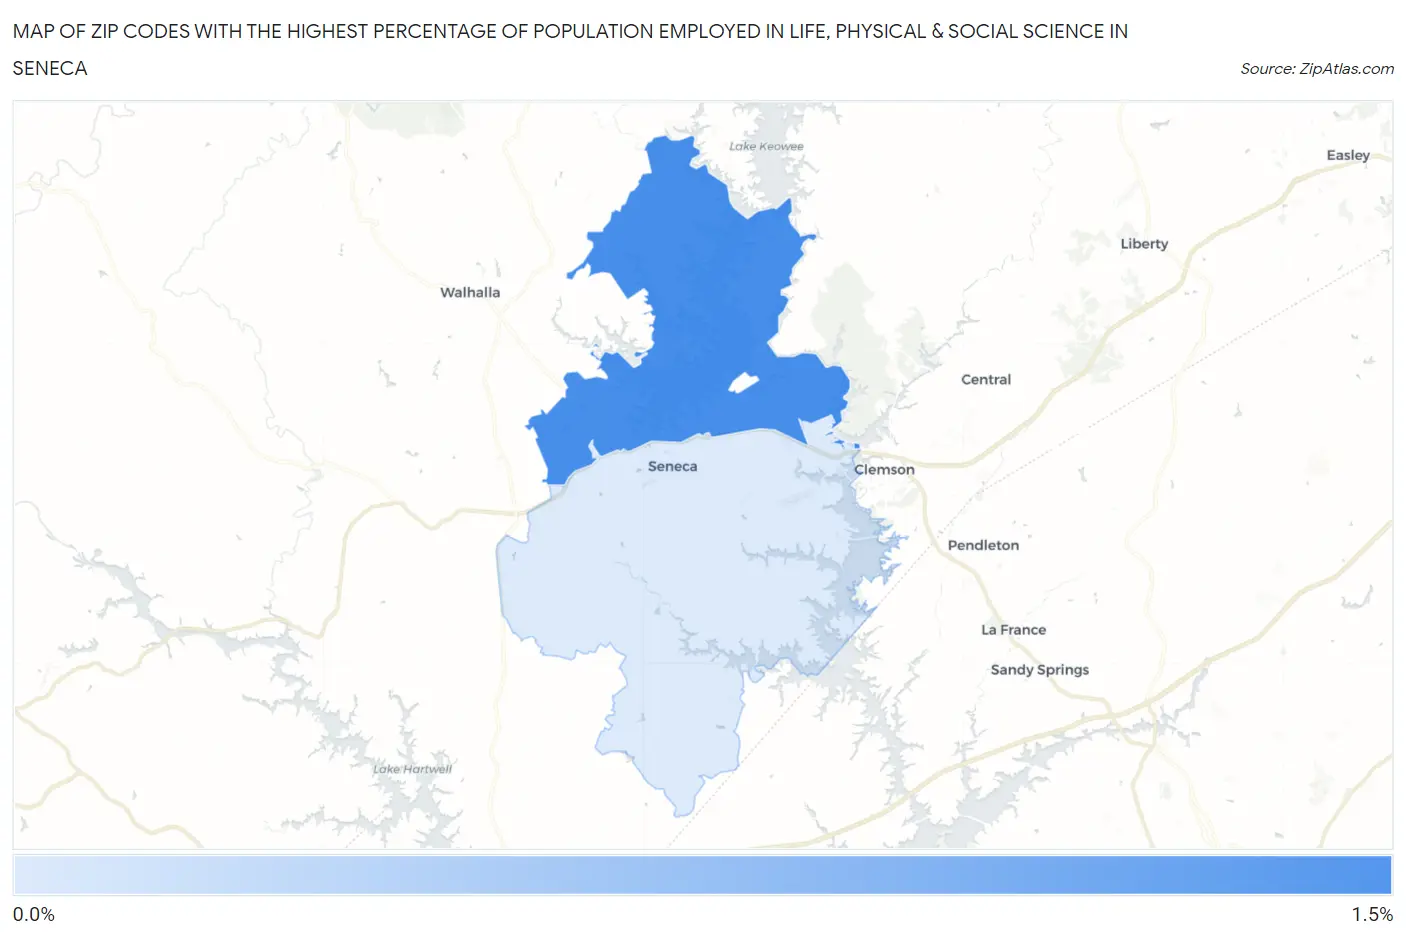
Map of Zip Codes with the Highest Percentage of Population Employed in Life, Physical & Social Science in Seneca
0.43%
1.4%
Zip Codes with the Highest Percentage of Population Employed in Life, Physical & Social Science in Seneca, SC
| Zip Code | % Employed | vs State | vs National | |
| 1. | 29672 | 1.4% | 0.73%(+0.640)#59 | 1.1%(+0.275)#6,381 |
| 2. | 29678 | 0.43% | 0.73%(-0.295)#167 | 1.1%(-0.660)#15,364 |
1
Common Questions
What are the Top Zip Codes with the Highest Percentage of Population Employed in Life, Physical & Social Science in Seneca, SC?
Top Zip Codes with the Highest Percentage of Population Employed in Life, Physical & Social Science in Seneca, SC are:
What zip code has the Highest Percentage of Population Employed in Life, Physical & Social Science in Seneca, SC?
29672 has the Highest Percentage of Population Employed in Life, Physical & Social Science in Seneca, SC with 1.4%.
What is the Percentage of Population Employed in Life, Physical & Social Science in Seneca, SC?
Percentage of Population Employed in Life, Physical & Social Science in Seneca is 0.49%.
What is the Percentage of Population Employed in Life, Physical & Social Science in South Carolina?
Percentage of Population Employed in Life, Physical & Social Science in South Carolina is 0.73%.
What is the Percentage of Population Employed in Life, Physical & Social Science in the United States?
Percentage of Population Employed in Life, Physical & Social Science in the United States is 1.1%.