St Andrews, SC Map & Demographics
St Andrews Map
St Andrews Overview
$24,471
PER CAPITA INCOME
$47,626
AVG FAMILY INCOME
$43,273
AVG HOUSEHOLD INCOME
10.8%
WAGE / INCOME GAP [ % ]
89.2¢/ $1
WAGE / INCOME GAP [ $ ]
0.39
INEQUALITY / GINI INDEX
21,909
TOTAL POPULATION
10,137
MALE POPULATION
11,772
FEMALE POPULATION
86.11
MALES / 100 FEMALES
116.13
FEMALES / 100 MALES
32.4
MEDIAN AGE
3.0
AVG FAMILY SIZE
2.1
AVG HOUSEHOLD SIZE
11,890
LABOR FORCE [ PEOPLE ]
68.0%
PERCENT IN LABOR FORCE
8.7%
UNEMPLOYMENT RATE
Income in St Andrews
Income Overview in St Andrews
Per Capita Income in St Andrews is $24,471, while median incomes of families and households are $47,626 and $43,273 respectively.
| Characteristic | Number | Measure |
| Per Capita Income | 21,909 | $24,471 |
| Median Family Income | 4,954 | $47,626 |
| Mean Family Income | 4,954 | $53,769 |
| Median Household Income | 10,195 | $43,273 |
| Mean Household Income | 10,195 | $52,228 |
| Income Deficit | 4,954 | $0 |
| Wage / Income Gap (%) | 21,909 | 10.83% |
| Wage / Income Gap ($) | 21,909 | 89.17¢ per $1 |
| Gini / Inequality Index | 21,909 | 0.39 |
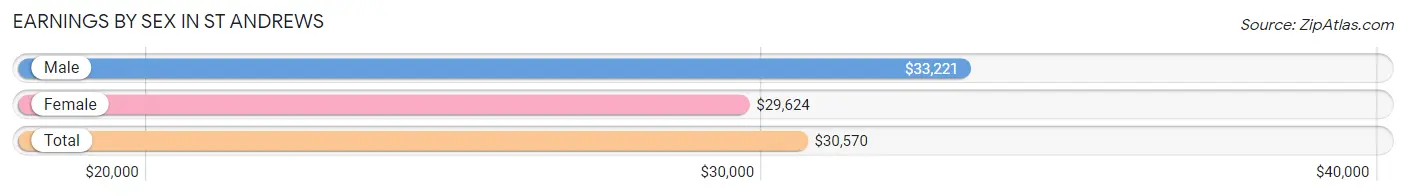
Earnings by Sex in St Andrews
Average Earnings in St Andrews are $30,570, $33,221 for men and $29,624 for women, a difference of 10.8%.
| Sex | Number | Average Earnings |
| Male | 5,762 (47.1%) | $33,221 |
| Female | 6,458 (52.8%) | $29,624 |
| Total | 12,220 (100.0%) | $30,570 |
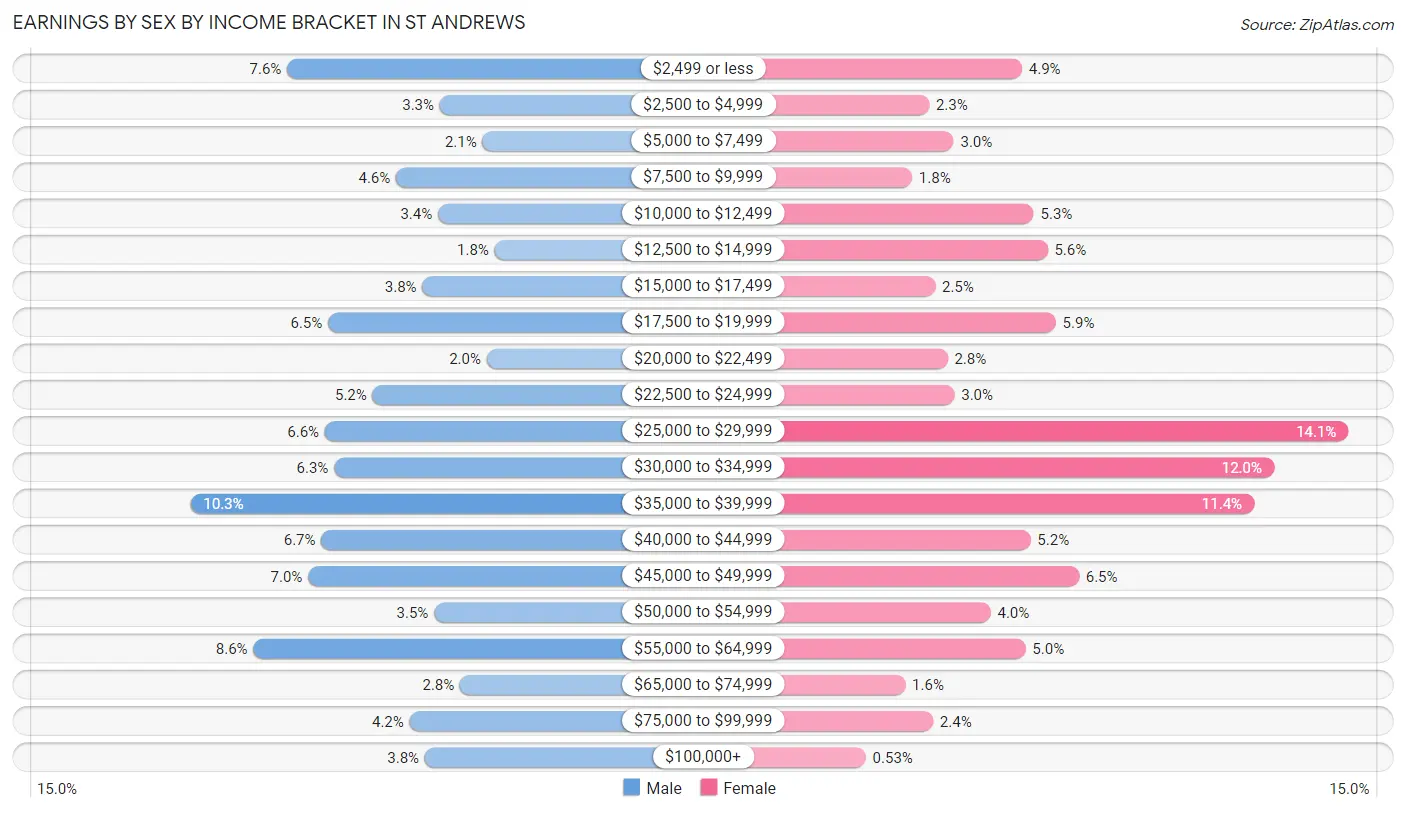
Earnings by Sex by Income Bracket in St Andrews
The most common earnings brackets in St Andrews are $35,000 to $39,999 for men (596 | 10.3%) and $25,000 to $29,999 for women (910 | 14.1%).
| Income | Male | Female |
| $2,499 or less | 439 (7.6%) | 318 (4.9%) |
| $2,500 to $4,999 | 192 (3.3%) | 149 (2.3%) |
| $5,000 to $7,499 | 123 (2.1%) | 194 (3.0%) |
| $7,500 to $9,999 | 263 (4.6%) | 118 (1.8%) |
| $10,000 to $12,499 | 195 (3.4%) | 339 (5.2%) |
| $12,500 to $14,999 | 103 (1.8%) | 364 (5.6%) |
| $15,000 to $17,499 | 220 (3.8%) | 160 (2.5%) |
| $17,500 to $19,999 | 373 (6.5%) | 379 (5.9%) |
| $20,000 to $22,499 | 116 (2.0%) | 183 (2.8%) |
| $22,500 to $24,999 | 301 (5.2%) | 195 (3.0%) |
| $25,000 to $29,999 | 378 (6.6%) | 910 (14.1%) |
| $30,000 to $34,999 | 363 (6.3%) | 775 (12.0%) |
| $35,000 to $39,999 | 596 (10.3%) | 739 (11.4%) |
| $40,000 to $44,999 | 384 (6.7%) | 333 (5.2%) |
| $45,000 to $49,999 | 405 (7.0%) | 421 (6.5%) |
| $50,000 to $54,999 | 201 (3.5%) | 261 (4.0%) |
| $55,000 to $64,999 | 494 (8.6%) | 324 (5.0%) |
| $65,000 to $74,999 | 159 (2.8%) | 106 (1.6%) |
| $75,000 to $99,999 | 241 (4.2%) | 156 (2.4%) |
| $100,000+ | 216 (3.7%) | 34 (0.5%) |
| Total | 5,762 (100.0%) | 6,458 (100.0%) |
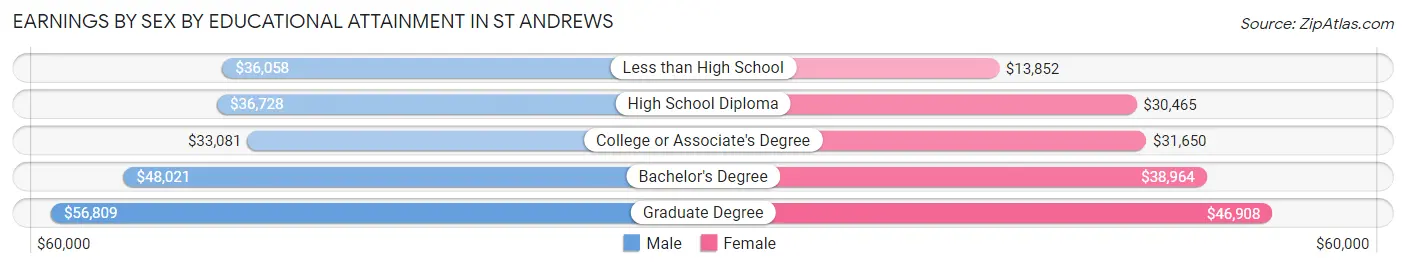
Earnings by Sex by Educational Attainment in St Andrews
Average earnings in St Andrews are $37,900 for men and $32,657 for women, a difference of 13.8%. Men with an educational attainment of graduate degree enjoy the highest average annual earnings of $56,809, while those with college or associate's degree education earn the least with $33,081. Women with an educational attainment of graduate degree earn the most with the average annual earnings of $46,908, while those with less than high school education have the smallest earnings of $13,852.
| Educational Attainment | Male Income | Female Income |
| Less than High School | $36,058 | $13,852 |
| High School Diploma | $36,728 | $30,465 |
| College or Associate's Degree | $33,081 | $31,650 |
| Bachelor's Degree | $48,021 | $38,964 |
| Graduate Degree | $56,809 | $46,908 |
| Total | $37,900 | $32,657 |
Family Income in St Andrews
Family Income Brackets in St Andrews
According to the St Andrews family income data, there are 1,362 families falling into the $50,000 to $74,999 income range, which is the most common income bracket and makes up 27.5% of all families. Conversely, the $200,000+ income bracket is the least frequent group with only 74 families (1.5%) belonging to this category.
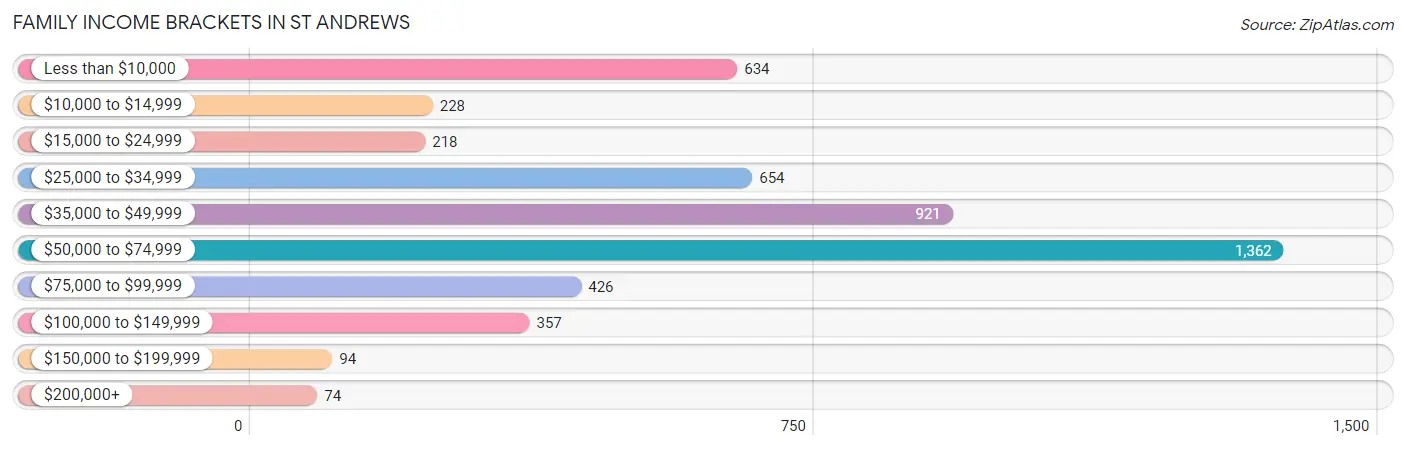
| Income Bracket | # Families | % Families |
| Less than $10,000 | 634 | 12.8% |
| $10,000 to $14,999 | 228 | 4.6% |
| $15,000 to $24,999 | 218 | 4.4% |
| $25,000 to $34,999 | 654 | 13.2% |
| $35,000 to $49,999 | 921 | 18.6% |
| $50,000 to $74,999 | 1,362 | 27.5% |
| $75,000 to $99,999 | 426 | 8.6% |
| $100,000 to $149,999 | 357 | 7.2% |
| $150,000 to $199,999 | 94 | 1.9% |
| $200,000+ | 74 | 1.5% |
Family Income by Famaliy Size in St Andrews
3-person families (1,382 | 27.9%) account for the highest median family income in St Andrews with $60,303 per family, while 2-person families (2,468 | 49.8%) have the highest median income of $23,730 per family member.
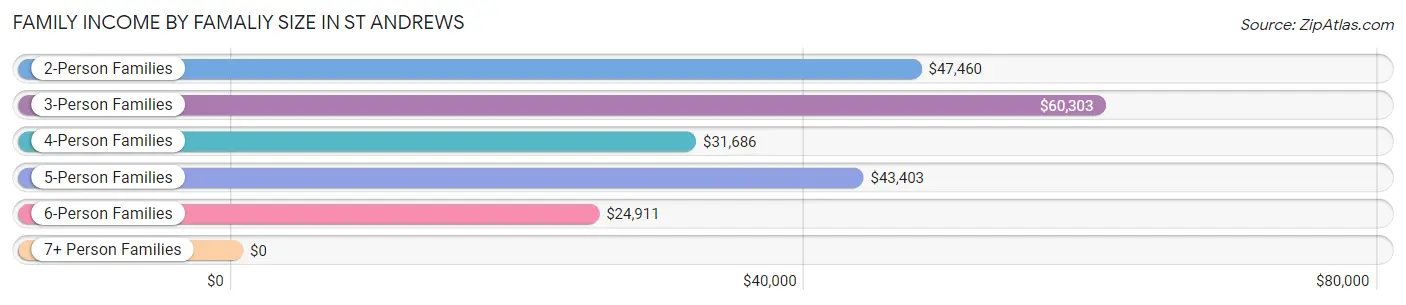
| Income Bracket | # Families | Median Income |
| 2-Person Families | 2,468 (49.8%) | $47,460 |
| 3-Person Families | 1,382 (27.9%) | $60,303 |
| 4-Person Families | 490 (9.9%) | $31,686 |
| 5-Person Families | 421 (8.5%) | $43,403 |
| 6-Person Families | 49 (1.0%) | $24,911 |
| 7+ Person Families | 144 (2.9%) | $0 |
| Total | 4,954 (100.0%) | $47,626 |
Family Income by Number of Earners in St Andrews
The median family income in St Andrews is $47,626, with families comprising 3+ earners (204) having the highest median family income of $68,690, while families with no earners (921) have the lowest median family income of $26,450, accounting for 4.1% and 18.6% of families, respectively.
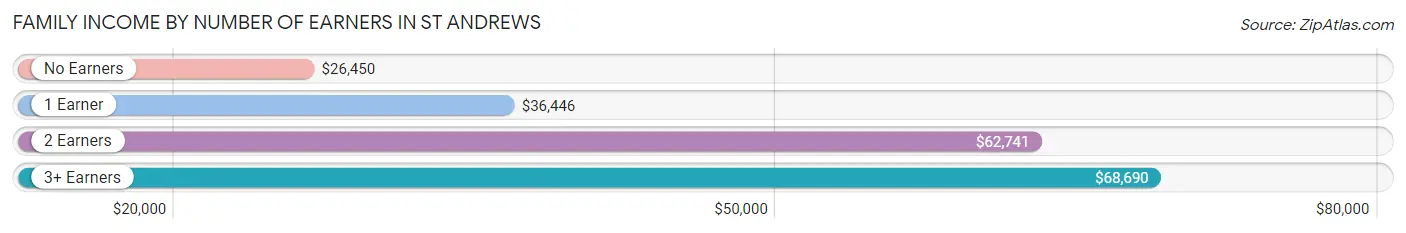
| Number of Earners | # Families | Median Income |
| No Earners | 921 (18.6%) | $26,450 |
| 1 Earner | 1,895 (38.3%) | $36,446 |
| 2 Earners | 1,934 (39.0%) | $62,741 |
| 3+ Earners | 204 (4.1%) | $68,690 |
| Total | 4,954 (100.0%) | $47,626 |
Household Income in St Andrews
Household Income Brackets in St Andrews
With 2,365 households falling in the category, the $50,000 to $74,999 income range is the most frequent in St Andrews, accounting for 23.2% of all households. In contrast, only 153 households (1.5%) fall into the $200,000+ income bracket, making it the least populous group.
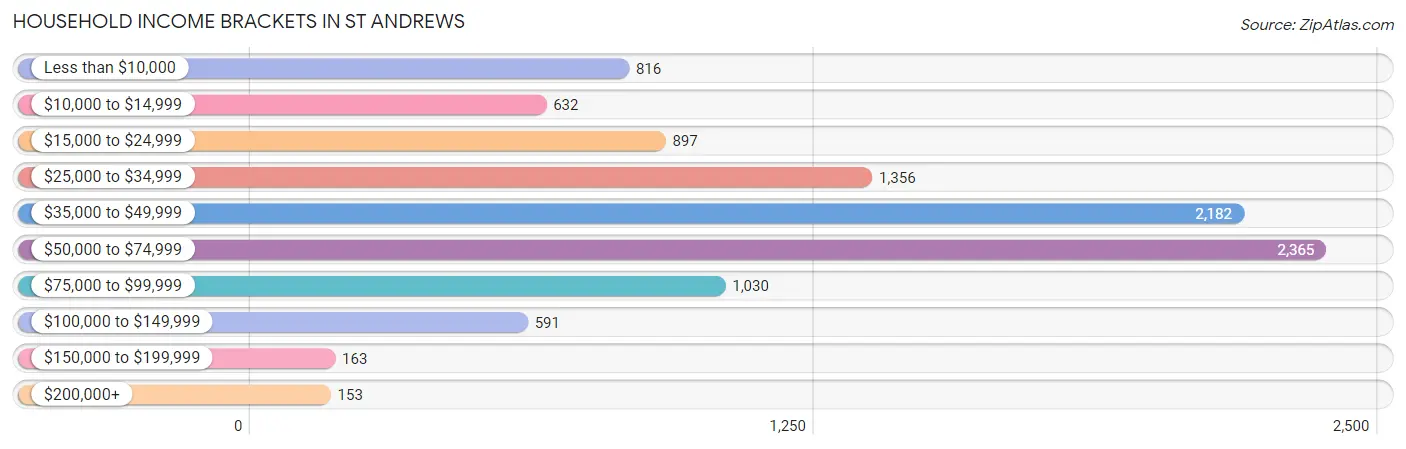
| Income Bracket | # Households | % Households |
| Less than $10,000 | 816 | 8.0% |
| $10,000 to $14,999 | 632 | 6.2% |
| $15,000 to $24,999 | 897 | 8.8% |
| $25,000 to $34,999 | 1,356 | 13.3% |
| $35,000 to $49,999 | 2,182 | 21.4% |
| $50,000 to $74,999 | 2,365 | 23.2% |
| $75,000 to $99,999 | 1,030 | 10.1% |
| $100,000 to $149,999 | 591 | 5.8% |
| $150,000 to $199,999 | 163 | 1.6% |
| $200,000+ | 153 | 1.5% |
Household Income by Householder Age in St Andrews
The median household income in St Andrews is $43,273, with the highest median household income of $48,865 found in the 65+ years age bracket for the primary householder. A total of 1,763 households (17.3%) fall into this category. Meanwhile, the 15 to 24 years age bracket for the primary householder has the lowest median household income of $32,760, with 1,235 households (12.1%) in this group.
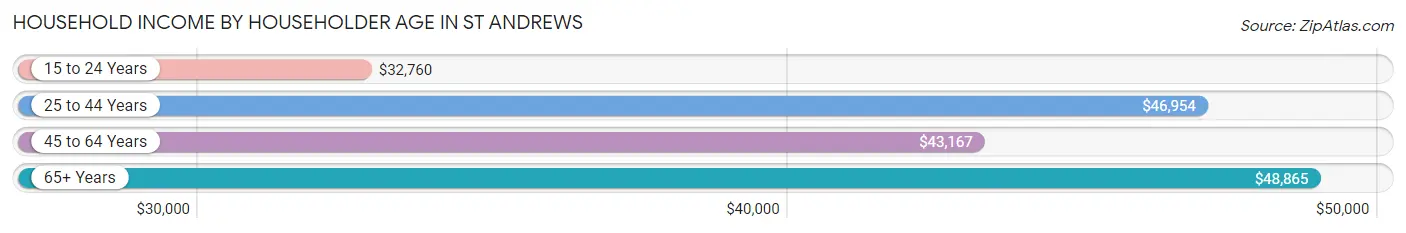
| Income Bracket | # Households | Median Income |
| 15 to 24 Years | 1,235 (12.1%) | $32,760 |
| 25 to 44 Years | 4,107 (40.3%) | $46,954 |
| 45 to 64 Years | 3,090 (30.3%) | $43,167 |
| 65+ Years | 1,763 (17.3%) | $48,865 |
| Total | 10,195 (100.0%) | $43,273 |
Poverty in St Andrews
Income Below Poverty by Sex and Age in St Andrews
With 24.8% poverty level for males and 23.8% for females among the residents of St Andrews, 15 year old males and 16 and 17 year old females are the most vulnerable to poverty, with 45 males (100.0%) and 97 females (78.2%) in their respective age groups living below the poverty level.
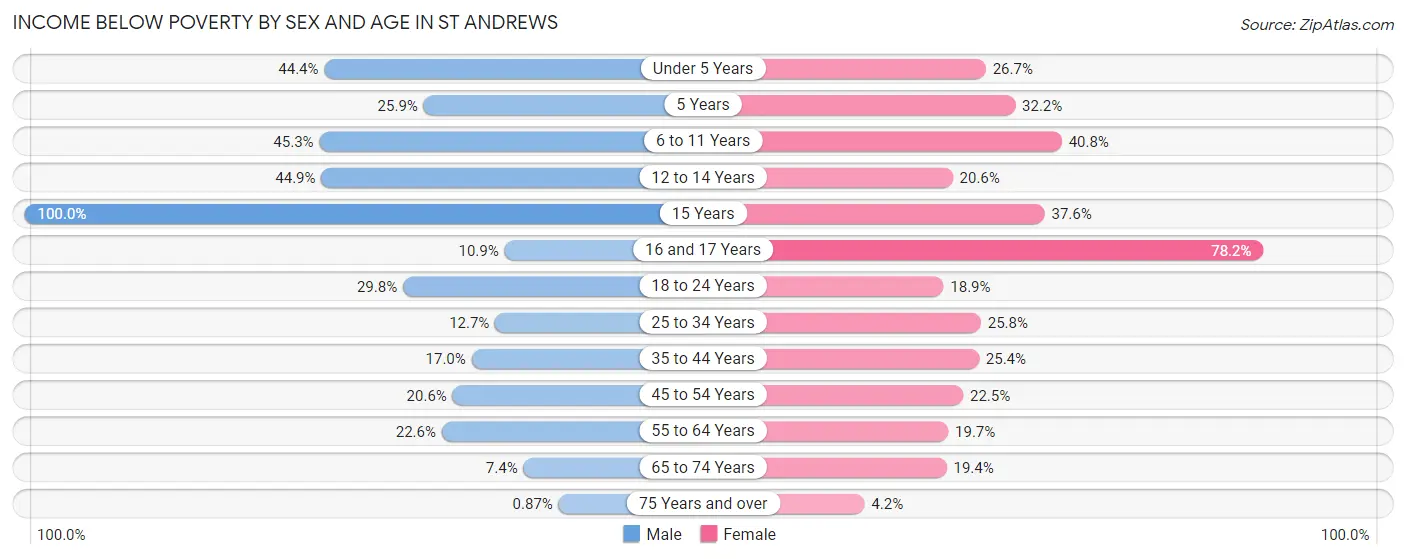
| Age Bracket | Male | Female |
| Under 5 Years | 417 (44.4%) | 210 (26.7%) |
| 5 Years | 14 (25.9%) | 46 (32.2%) |
| 6 to 11 Years | 422 (45.3%) | 240 (40.8%) |
| 12 to 14 Years | 243 (44.9%) | 43 (20.6%) |
| 15 Years | 45 (100.0%) | 70 (37.6%) |
| 16 and 17 Years | 32 (10.9%) | 97 (78.2%) |
| 18 to 24 Years | 407 (29.8%) | 259 (18.9%) |
| 25 to 34 Years | 192 (12.7%) | 659 (25.8%) |
| 35 to 44 Years | 221 (17.0%) | 417 (25.4%) |
| 45 to 54 Years | 193 (20.5%) | 251 (22.5%) |
| 55 to 64 Years | 250 (22.6%) | 288 (19.7%) |
| 65 to 74 Years | 60 (7.4%) | 194 (19.4%) |
| 75 Years and over | 2 (0.9%) | 24 (4.2%) |
| Total | 2,498 (24.8%) | 2,798 (23.8%) |
Income Above Poverty by Sex and Age in St Andrews
According to the poverty statistics in St Andrews, males aged 75 years and over and females aged 75 years and over are the age groups that are most secure financially, with 99.1% of males and 95.8% of females in these age groups living above the poverty line.
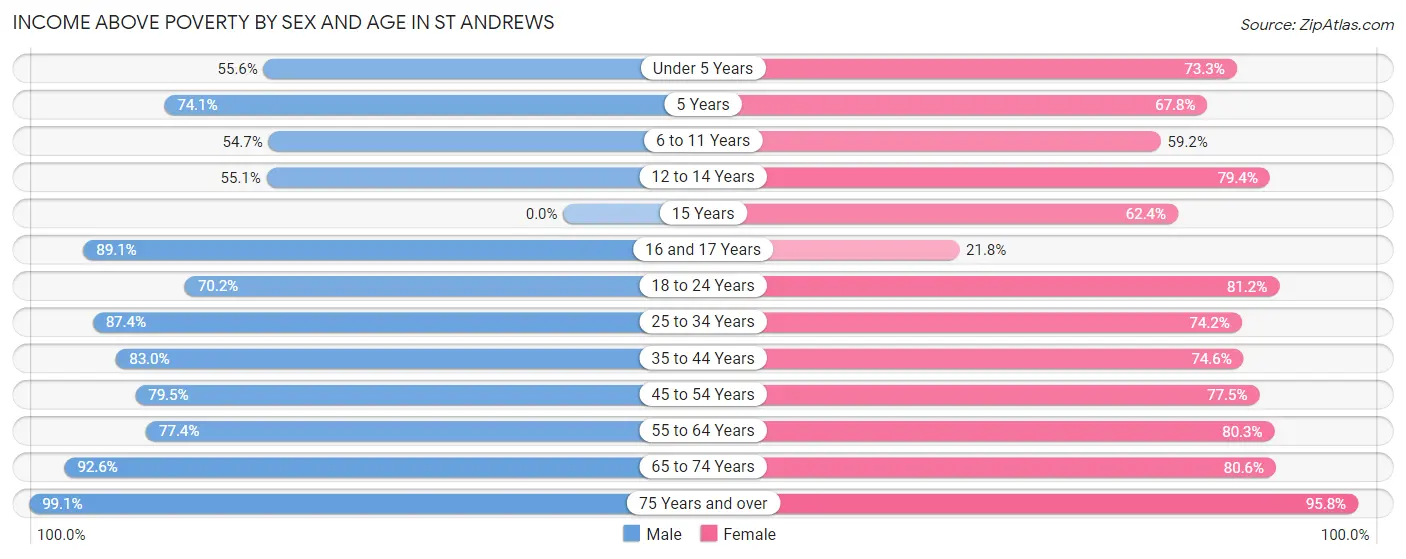
| Age Bracket | Male | Female |
| Under 5 Years | 523 (55.6%) | 576 (73.3%) |
| 5 Years | 40 (74.1%) | 97 (67.8%) |
| 6 to 11 Years | 510 (54.7%) | 348 (59.2%) |
| 12 to 14 Years | 298 (55.1%) | 166 (79.4%) |
| 15 Years | 0 (0.0%) | 116 (62.4%) |
| 16 and 17 Years | 261 (89.1%) | 27 (21.8%) |
| 18 to 24 Years | 960 (70.2%) | 1,115 (81.1%) |
| 25 to 34 Years | 1,326 (87.4%) | 1,895 (74.2%) |
| 35 to 44 Years | 1,077 (83.0%) | 1,222 (74.6%) |
| 45 to 54 Years | 746 (79.4%) | 864 (77.5%) |
| 55 to 64 Years | 858 (77.4%) | 1,172 (80.3%) |
| 65 to 74 Years | 751 (92.6%) | 804 (80.6%) |
| 75 Years and over | 229 (99.1%) | 548 (95.8%) |
| Total | 7,579 (75.2%) | 8,950 (76.2%) |
Income Below Poverty Among Married-Couple Families in St Andrews
The poverty statistics for married-couple families in St Andrews show that 9.4% or 204 of the total 2,173 families live below the poverty line. Families with 1 or 2 children have the highest poverty rate of 13.9%, comprising of 98 families. On the other hand, families with no children have the lowest poverty rate of 6.8%, which includes 87 families.
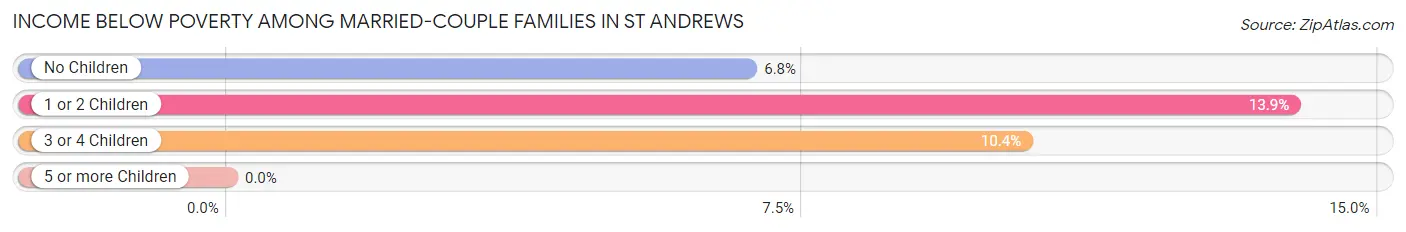
| Children | Above Poverty | Below Poverty |
| No Children | 1,197 (93.2%) | 87 (6.8%) |
| 1 or 2 Children | 608 (86.1%) | 98 (13.9%) |
| 3 or 4 Children | 164 (89.6%) | 19 (10.4%) |
| 5 or more Children | 0 (0.0%) | 0 (0.0%) |
| Total | 1,969 (90.6%) | 204 (9.4%) |
Income Below Poverty Among Single-Parent Households in St Andrews
According to the poverty data in St Andrews, 24.3% or 141 single-father households and 35.4% or 779 single-mother households are living below the poverty line. Among single-father households, those with no children have the highest poverty rate, with 101 households (34.5%) experiencing poverty. Likewise, among single-mother households, those with 5 or more children have the highest poverty rate, with 86 households (100.0%) falling below the poverty line.
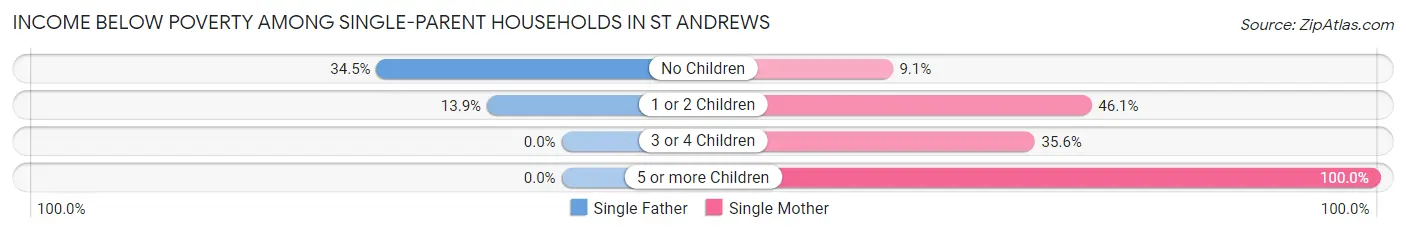
| Children | Single Father | Single Mother |
| No Children | 101 (34.5%) | 60 (9.1%) |
| 1 or 2 Children | 40 (13.9%) | 506 (46.1%) |
| 3 or 4 Children | 0 (0.0%) | 127 (35.6%) |
| 5 or more Children | 0 (0.0%) | 86 (100.0%) |
| Total | 141 (24.3%) | 779 (35.4%) |
Income Below Poverty Among Married-Couple vs Single-Parent Households in St Andrews
The poverty data for St Andrews shows that 204 of the married-couple family households (9.4%) and 920 of the single-parent households (33.1%) are living below the poverty level. Within the married-couple family households, those with 1 or 2 children have the highest poverty rate, with 98 households (13.9%) falling below the poverty line. Among the single-parent households, those with 5 or more children have the highest poverty rate, with 86 household (100.0%) living below poverty.
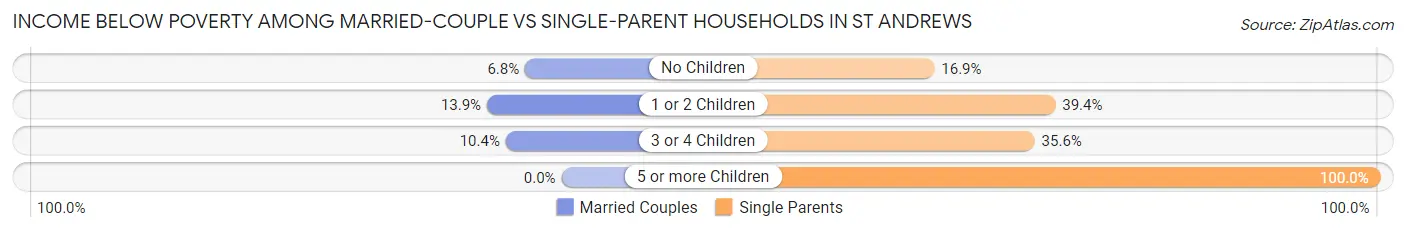
| Children | Married-Couple Families | Single-Parent Households |
| No Children | 87 (6.8%) | 161 (16.9%) |
| 1 or 2 Children | 98 (13.9%) | 546 (39.4%) |
| 3 or 4 Children | 19 (10.4%) | 127 (35.6%) |
| 5 or more Children | 0 (0.0%) | 86 (100.0%) |
| Total | 204 (9.4%) | 920 (33.1%) |
Race in St Andrews
The most populous races in St Andrews are Black / African American (14,806 | 67.6%), White / Caucasian (5,055 | 23.1%), and Two or more Races (1,217 | 5.6%).
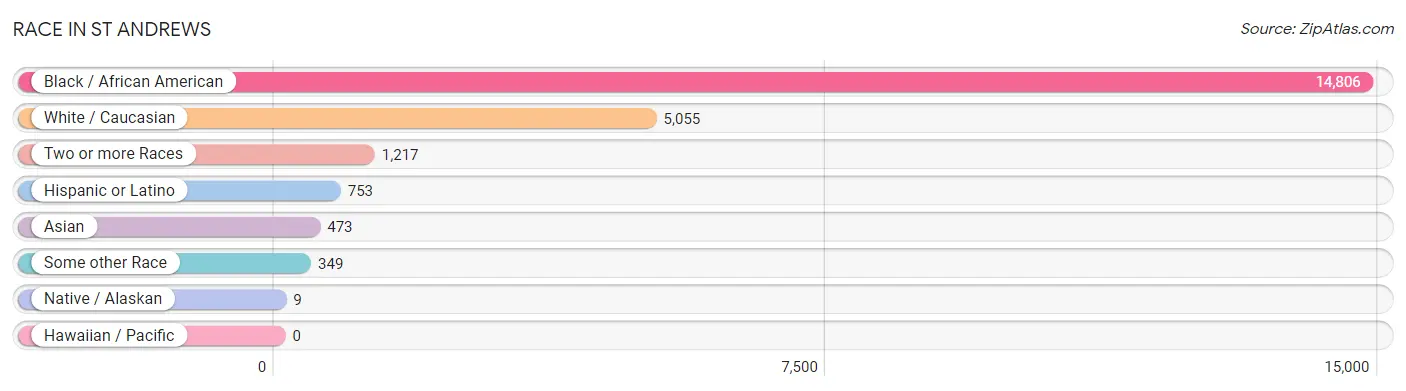
| Race | # Population | % Population |
| Asian | 473 | 2.2% |
| Black / African American | 14,806 | 67.6% |
| Hawaiian / Pacific | 0 | 0.0% |
| Hispanic or Latino | 753 | 3.4% |
| Native / Alaskan | 9 | 0.0% |
| White / Caucasian | 5,055 | 23.1% |
| Two or more Races | 1,217 | 5.6% |
| Some other Race | 349 | 1.6% |
| Total | 21,909 | 100.0% |
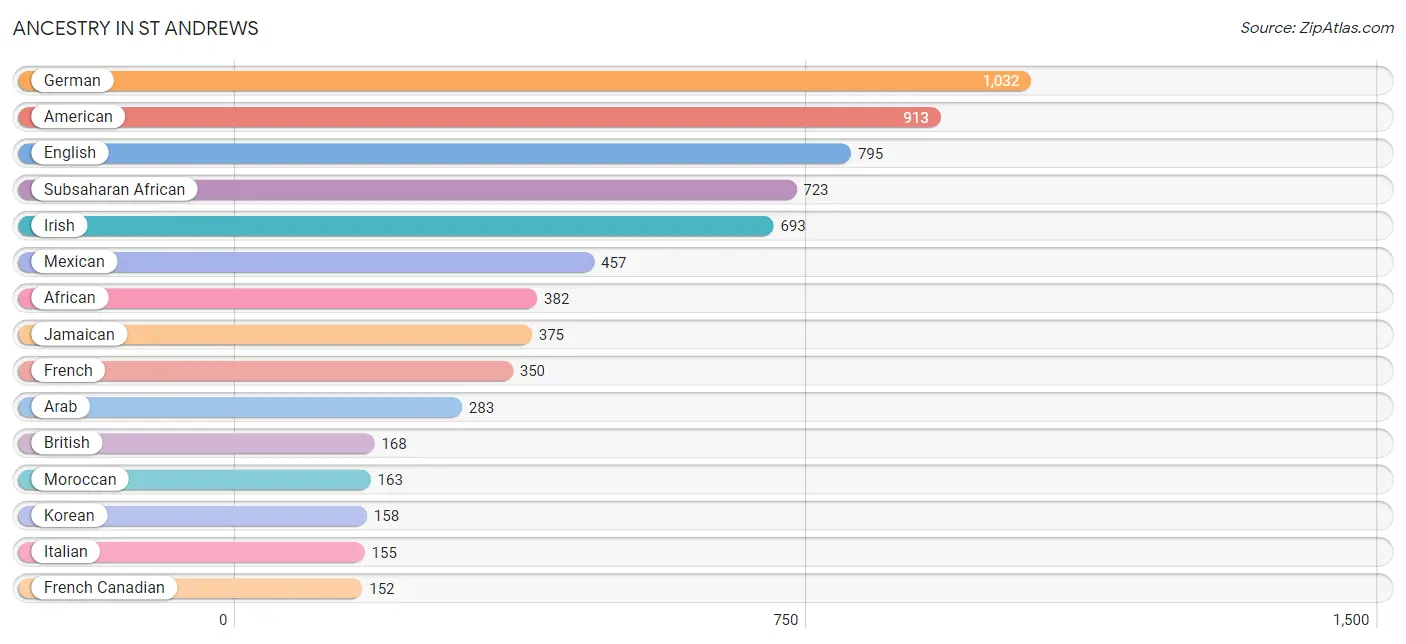
Ancestry in St Andrews
The most populous ancestries reported in St Andrews are German (1,032 | 4.7%), American (913 | 4.2%), English (795 | 3.6%), Subsaharan African (723 | 3.3%), and Irish (693 | 3.2%), together accounting for 19.0% of all St Andrews residents.
| Ancestry | # Population | % Population |
| African | 382 | 1.7% |
| American | 913 | 4.2% |
| Apache | 5 | 0.0% |
| Arab | 283 | 1.3% |
| Blackfeet | 8 | 0.0% |
| British | 168 | 0.8% |
| Burmese | 56 | 0.3% |
| Cambodian | 8 | 0.0% |
| Canadian | 46 | 0.2% |
| Central American | 94 | 0.4% |
| Cherokee | 25 | 0.1% |
| Choctaw | 15 | 0.1% |
| Costa Rican | 11 | 0.1% |
| Cuban | 16 | 0.1% |
| Czech | 7 | 0.0% |
| Dominican | 19 | 0.1% |
| Dutch | 19 | 0.1% |
| Eastern European | 79 | 0.4% |
| Ecuadorian | 7 | 0.0% |
| English | 795 | 3.6% |
| Ethiopian | 22 | 0.1% |
| European | 141 | 0.6% |
| French | 350 | 1.6% |
| French Canadian | 152 | 0.7% |
| German | 1,032 | 4.7% |
| Ghanaian | 104 | 0.5% |
| Greek | 24 | 0.1% |
| Guatemalan | 58 | 0.3% |
| Haitian | 106 | 0.5% |
| Honduran | 17 | 0.1% |
| Hungarian | 22 | 0.1% |
| Indian (Asian) | 20 | 0.1% |
| Indonesian | 76 | 0.4% |
| Iranian | 90 | 0.4% |
| Iraqi | 113 | 0.5% |
| Irish | 693 | 3.2% |
| Italian | 155 | 0.7% |
| Jamaican | 375 | 1.7% |
| Korean | 158 | 0.7% |
| Latvian | 12 | 0.1% |
| Mexican | 457 | 2.1% |
| Moroccan | 163 | 0.7% |
| Native Hawaiian | 12 | 0.1% |
| Nicaraguan | 8 | 0.0% |
| Nigerian | 18 | 0.1% |
| Northern European | 9 | 0.0% |
| Norwegian | 37 | 0.2% |
| Pennsylvania German | 20 | 0.1% |
| Polish | 74 | 0.3% |
| Puerto Rican | 110 | 0.5% |
| Russian | 70 | 0.3% |
| Scandinavian | 11 | 0.1% |
| Scotch-Irish | 114 | 0.5% |
| Scottish | 152 | 0.7% |
| Slavic | 12 | 0.1% |
| South American | 43 | 0.2% |
| Sri Lankan | 36 | 0.2% |
| Subsaharan African | 723 | 3.3% |
| Swedish | 27 | 0.1% |
| Swiss | 11 | 0.1% |
| Syrian | 7 | 0.0% |
| Thai | 40 | 0.2% |
| Trinidadian and Tobagonian | 24 | 0.1% |
| U.S. Virgin Islander | 7 | 0.0% |
| Ukrainian | 86 | 0.4% |
| Uruguayan | 17 | 0.1% |
| Venezuelan | 19 | 0.1% |
| Vietnamese | 50 | 0.2% |
| Welsh | 77 | 0.4% |
| West Indian | 9 | 0.0% | View All 70 Rows |
Immigrants in St Andrews
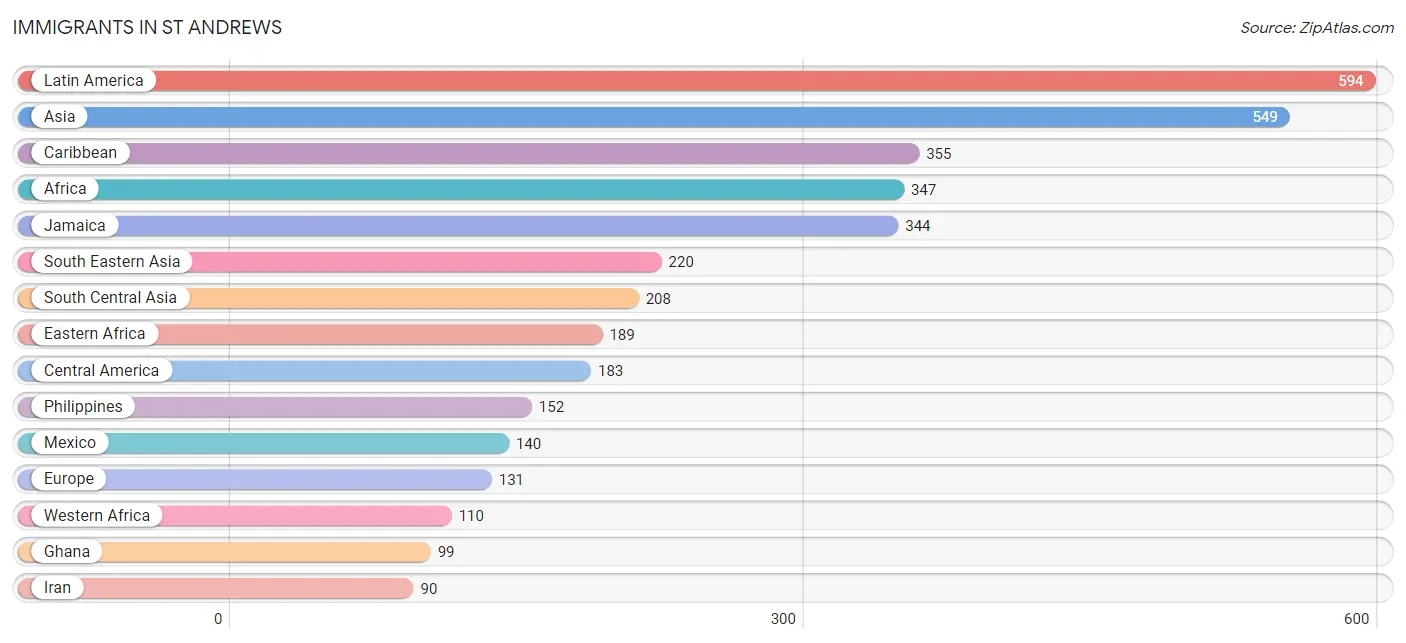
The most numerous immigrant groups reported in St Andrews came from Latin America (594 | 2.7%), Asia (549 | 2.5%), Caribbean (355 | 1.6%), Africa (347 | 1.6%), and Jamaica (344 | 1.6%), together accounting for 10.0% of all St Andrews residents.
| Immigration Origin | # Population | % Population |
| Africa | 347 | 1.6% |
| Asia | 549 | 2.5% |
| Bangladesh | 29 | 0.1% |
| Canada | 32 | 0.2% |
| Caribbean | 355 | 1.6% |
| Central America | 183 | 0.8% |
| China | 20 | 0.1% |
| Colombia | 14 | 0.1% |
| Congo | 37 | 0.2% |
| Costa Rica | 11 | 0.1% |
| Eastern Africa | 189 | 0.9% |
| Eastern Asia | 76 | 0.4% |
| Eastern Europe | 72 | 0.3% |
| England | 23 | 0.1% |
| Ethiopia | 22 | 0.1% |
| Europe | 131 | 0.6% |
| France | 25 | 0.1% |
| Germany | 11 | 0.1% |
| Ghana | 99 | 0.4% |
| Guatemala | 32 | 0.2% |
| India | 80 | 0.4% |
| Indonesia | 19 | 0.1% |
| Iran | 90 | 0.4% |
| Iraq | 45 | 0.2% |
| Jamaica | 344 | 1.6% |
| Korea | 56 | 0.3% |
| Latin America | 594 | 2.7% |
| Mexico | 140 | 0.6% |
| Middle Africa | 37 | 0.2% |
| Nepal | 9 | 0.0% |
| Nigeria | 8 | 0.0% |
| Northern Europe | 23 | 0.1% |
| Philippines | 152 | 0.7% |
| Poland | 6 | 0.0% |
| Russia | 12 | 0.1% |
| South Africa | 11 | 0.1% |
| South America | 56 | 0.3% |
| South Central Asia | 208 | 0.9% |
| South Eastern Asia | 220 | 1.0% |
| Trinidad and Tobago | 11 | 0.1% |
| Ukraine | 40 | 0.2% |
| Uruguay | 17 | 0.1% |
| Venezuela | 25 | 0.1% |
| Western Africa | 110 | 0.5% |
| Western Asia | 45 | 0.2% |
| Western Europe | 36 | 0.2% | View All 46 Rows |
Sex and Age in St Andrews
Sex and Age in St Andrews
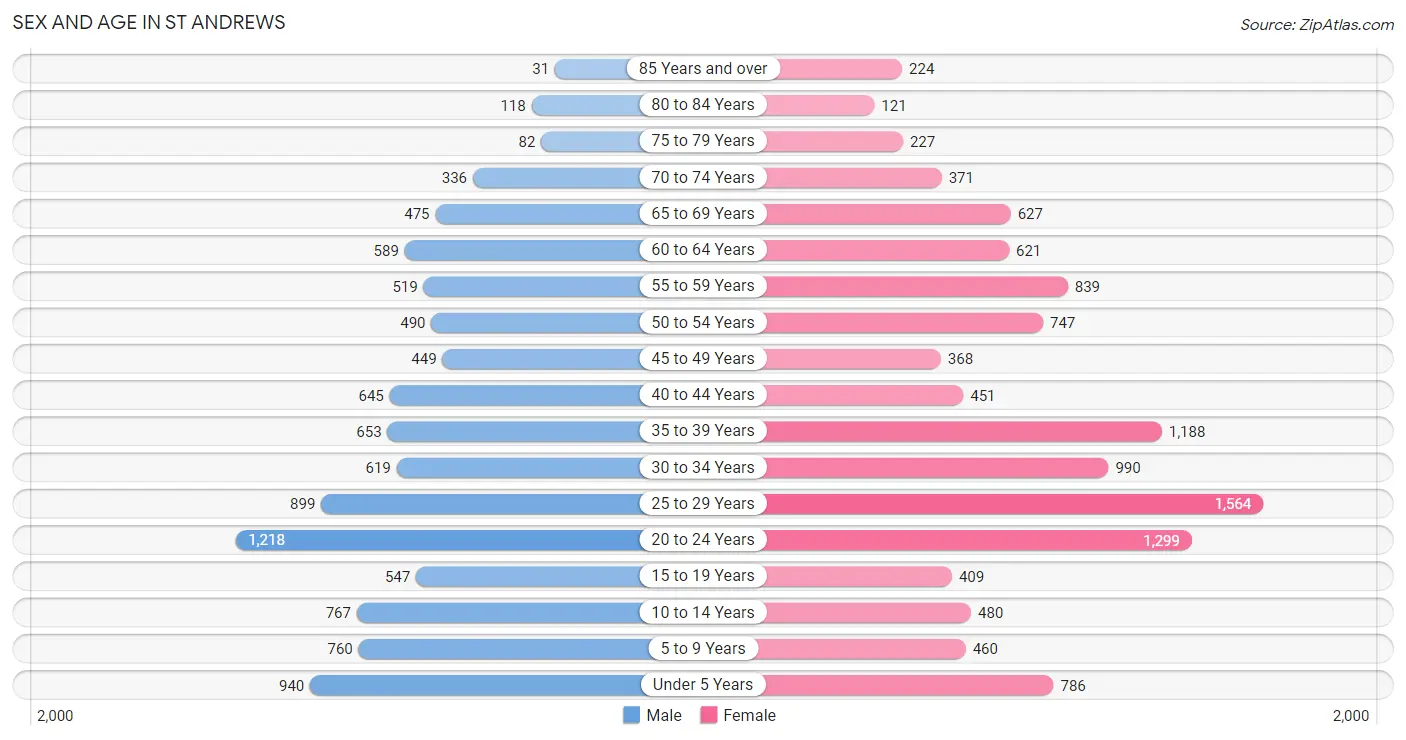
The most populous age groups in St Andrews are 20 to 24 Years (1,218 | 12.0%) for men and 25 to 29 Years (1,564 | 13.3%) for women.
| Age Bracket | Male | Female |
| Under 5 Years | 940 (9.3%) | 786 (6.7%) |
| 5 to 9 Years | 760 (7.5%) | 460 (3.9%) |
| 10 to 14 Years | 767 (7.6%) | 480 (4.1%) |
| 15 to 19 Years | 547 (5.4%) | 409 (3.5%) |
| 20 to 24 Years | 1,218 (12.0%) | 1,299 (11.0%) |
| 25 to 29 Years | 899 (8.9%) | 1,564 (13.3%) |
| 30 to 34 Years | 619 (6.1%) | 990 (8.4%) |
| 35 to 39 Years | 653 (6.4%) | 1,188 (10.1%) |
| 40 to 44 Years | 645 (6.4%) | 451 (3.8%) |
| 45 to 49 Years | 449 (4.4%) | 368 (3.1%) |
| 50 to 54 Years | 490 (4.8%) | 747 (6.4%) |
| 55 to 59 Years | 519 (5.1%) | 839 (7.1%) |
| 60 to 64 Years | 589 (5.8%) | 621 (5.3%) |
| 65 to 69 Years | 475 (4.7%) | 627 (5.3%) |
| 70 to 74 Years | 336 (3.3%) | 371 (3.2%) |
| 75 to 79 Years | 82 (0.8%) | 227 (1.9%) |
| 80 to 84 Years | 118 (1.2%) | 121 (1.0%) |
| 85 Years and over | 31 (0.3%) | 224 (1.9%) |
| Total | 10,137 (100.0%) | 11,772 (100.0%) |
Families and Households in St Andrews
Median Family Size in St Andrews
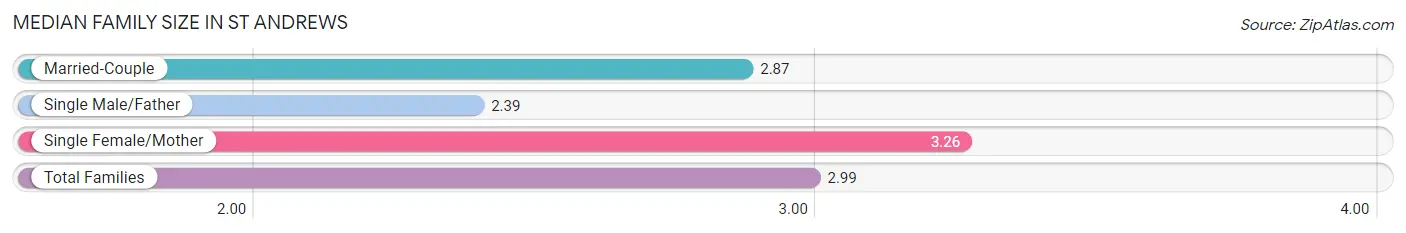
The median family size in St Andrews is 2.99 persons per family, with single female/mother families (2,200 | 44.4%) accounting for the largest median family size of 3.26 persons per family. On the other hand, single male/father families (581 | 11.7%) represent the smallest median family size with 2.39 persons per family.
| Family Type | # Families | Family Size |
| Married-Couple | 2,173 (43.9%) | 2.87 |
| Single Male/Father | 581 (11.7%) | 2.39 |
| Single Female/Mother | 2,200 (44.4%) | 3.26 |
| Total Families | 4,954 (100.0%) | 2.99 |
Median Household Size in St Andrews
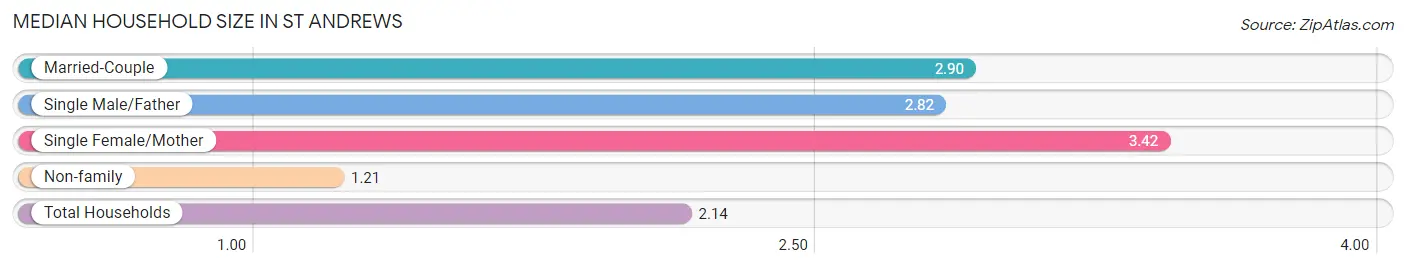
The median household size in St Andrews is 2.14 persons per household, with single female/mother households (2,200 | 21.6%) accounting for the largest median household size of 3.42 persons per household. non-family households (5,241 | 51.4%) represent the smallest median household size with 1.21 persons per household.
| Household Type | # Households | Household Size |
| Married-Couple | 2,173 (21.3%) | 2.90 |
| Single Male/Father | 581 (5.7%) | 2.82 |
| Single Female/Mother | 2,200 (21.6%) | 3.42 |
| Non-family | 5,241 (51.4%) | 1.21 |
| Total Households | 10,195 (100.0%) | 2.14 |
Household Size by Marriage Status in St Andrews
Out of a total of 10,195 households in St Andrews, 4,954 (48.6%) are family households, while 5,241 (51.4%) are nonfamily households. The most numerous type of family households are 2-person households, comprising 2,191, and the most common type of nonfamily households are 1-person households, comprising 4,249.
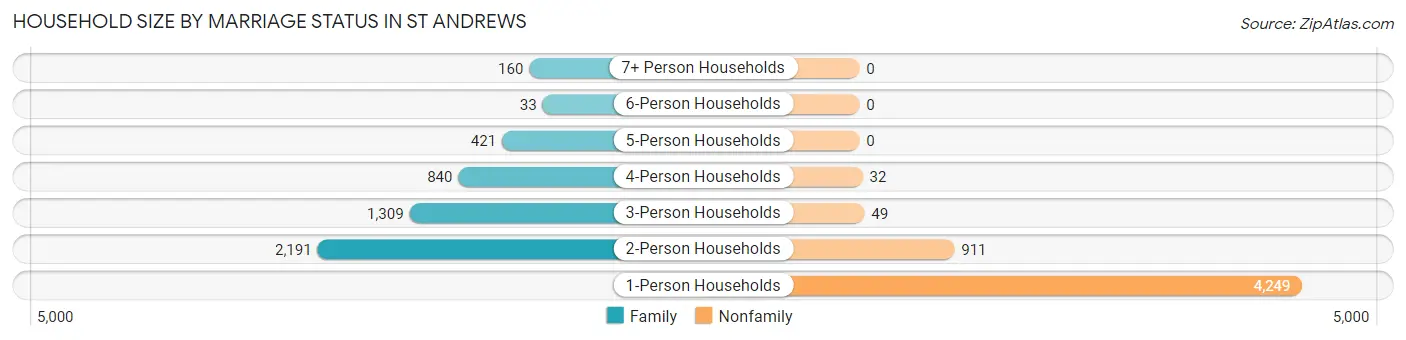
| Household Size | Family Households | Nonfamily Households |
| 1-Person Households | - | 4,249 (41.7%) |
| 2-Person Households | 2,191 (21.5%) | 911 (8.9%) |
| 3-Person Households | 1,309 (12.8%) | 49 (0.5%) |
| 4-Person Households | 840 (8.2%) | 32 (0.3%) |
| 5-Person Households | 421 (4.1%) | 0 (0.0%) |
| 6-Person Households | 33 (0.3%) | 0 (0.0%) |
| 7+ Person Households | 160 (1.6%) | 0 (0.0%) |
| Total | 4,954 (48.6%) | 5,241 (51.4%) |
Female Fertility in St Andrews
Fertility by Age in St Andrews
Average fertility rate in St Andrews is 94.0 births per 1,000 women. Women in the age bracket of 20 to 34 years have the highest fertility rate with 153.0 births per 1,000 women. Women in the age bracket of 20 to 34 years acount for 98.7% of all women with births.
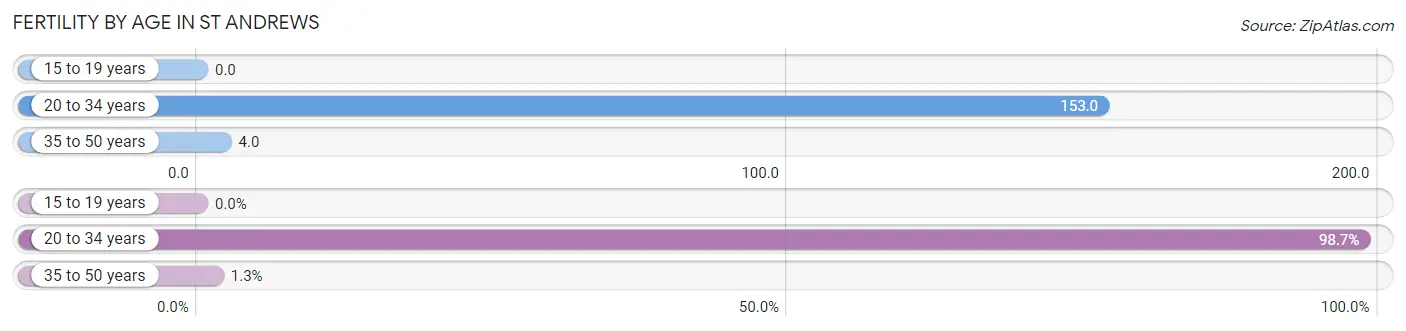
| Age Bracket | Women with Births | Births / 1,000 Women |
| 15 to 19 years | 0 (0.0%) | 0.0 |
| 20 to 34 years | 590 (98.7%) | 153.0 |
| 35 to 50 years | 8 (1.3%) | 4.0 |
| Total | 598 (100.0%) | 94.0 |
Fertility by Age by Marriage Status in St Andrews
41.1% of women with births (598) in St Andrews are married. The highest percentage of unmarried women with births falls into 35 to 50 years age bracket with 100.0% of them unmarried at the time of birth, while the lowest percentage of unmarried women with births belong to 20 to 34 years age bracket with 58.3% of them unmarried.
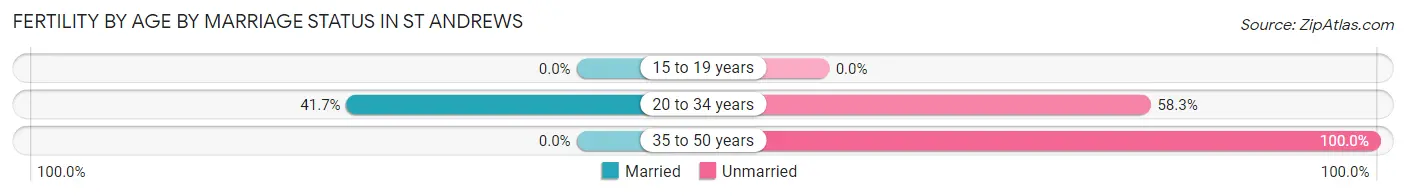
| Age Bracket | Married | Unmarried |
| 15 to 19 years | 0 (0.0%) | 0 (0.0%) |
| 20 to 34 years | 246 (41.7%) | 344 (58.3%) |
| 35 to 50 years | 0 (0.0%) | 8 (100.0%) |
| Total | 246 (41.1%) | 352 (58.9%) |
Fertility by Education in St Andrews
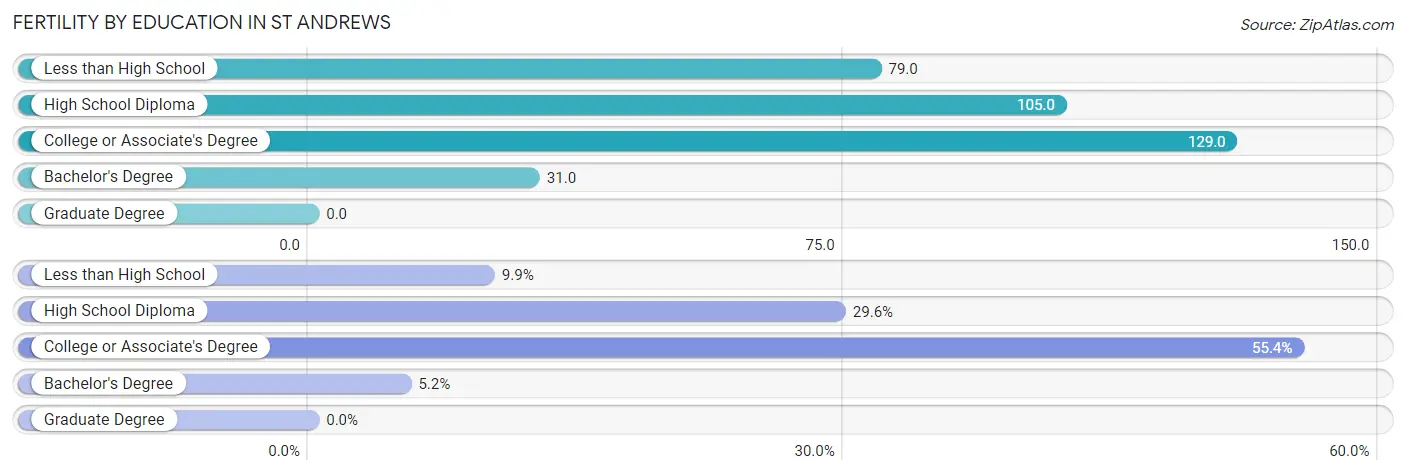
| Educational Attainment | Women with Births | Births / 1,000 Women |
| Less than High School | 59 (9.9%) | 79.0 |
| High School Diploma | 177 (29.6%) | 105.0 |
| College or Associate's Degree | 331 (55.3%) | 129.0 |
| Bachelor's Degree | 31 (5.2%) | 31.0 |
| Graduate Degree | 0 (0.0%) | 0.0 |
| Total | 598 (100.0%) | 94.0 |
Fertility by Education by Marriage Status in St Andrews
58.9% of women with births in St Andrews are unmarried. Women with the educational attainment of bachelor's degree are most likely to be married with 100.0% of them married at childbirth, while women with the educational attainment of less than high school are least likely to be married with 100.0% of them unmarried at childbirth.
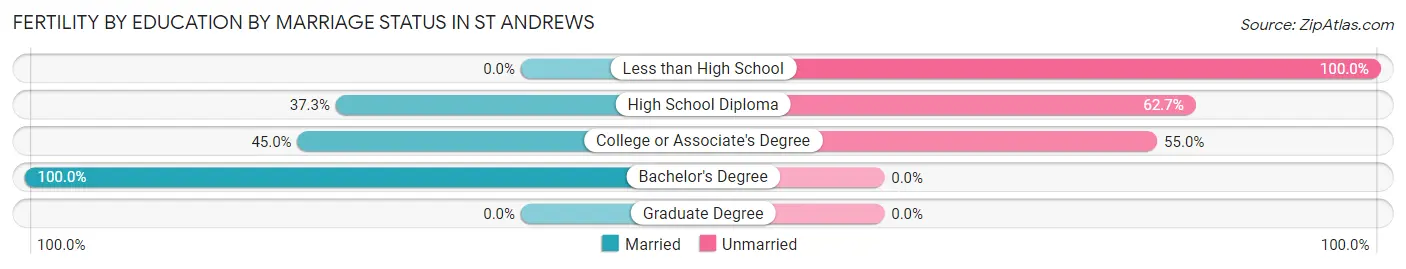
| Educational Attainment | Married | Unmarried |
| Less than High School | 0 (0.0%) | 59 (100.0%) |
| High School Diploma | 66 (37.3%) | 111 (62.7%) |
| College or Associate's Degree | 149 (45.0%) | 182 (55.0%) |
| Bachelor's Degree | 31 (100.0%) | 0 (0.0%) |
| Graduate Degree | 0 (0.0%) | 0 (0.0%) |
| Total | 246 (41.1%) | 352 (58.9%) |
Employment Characteristics in St Andrews
Employment by Class of Employer in St Andrews
Among the 10,365 employed individuals in St Andrews, private company employees (7,767 | 74.9%), state government employees (783 | 7.5%), and not-for-profit organizations (628 | 6.1%) make up the most common classes of employment.
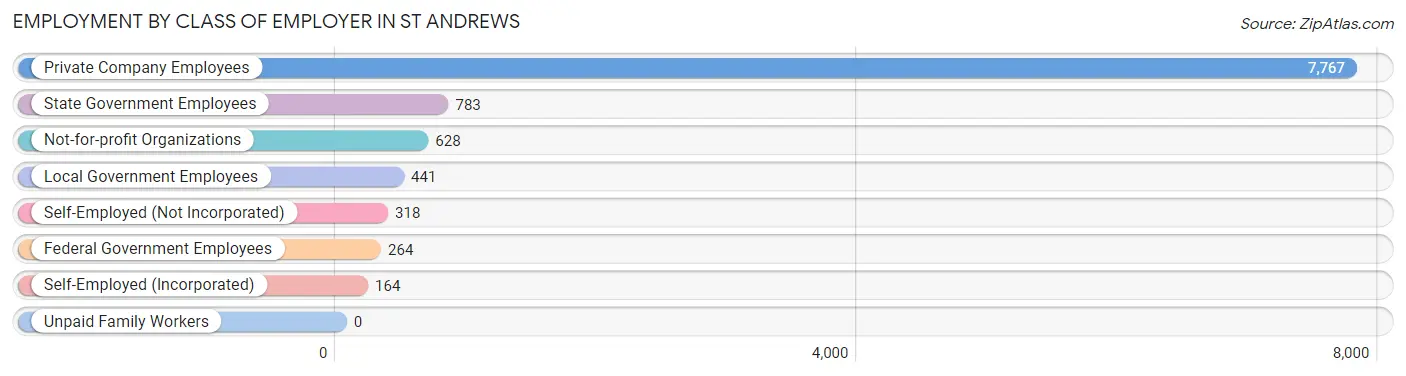
| Employer Class | # Employees | % Employees |
| Private Company Employees | 7,767 | 74.9% |
| Self-Employed (Incorporated) | 164 | 1.6% |
| Self-Employed (Not Incorporated) | 318 | 3.1% |
| Not-for-profit Organizations | 628 | 6.1% |
| Local Government Employees | 441 | 4.3% |
| State Government Employees | 783 | 7.5% |
| Federal Government Employees | 264 | 2.5% |
| Unpaid Family Workers | 0 | 0.0% |
| Total | 10,365 | 100.0% |
Employment Status by Age in St Andrews
According to the labor force statistics for St Andrews, out of the total population over 16 years of age (17,485), 68.0% or 11,890 individuals are in the labor force, with 8.7% or 1,034 of them unemployed. The age group with the highest labor force participation rate is 35 to 44 years, with 84.6% or 2,485 individuals in the labor force. Within the labor force, the 16 to 19 years age range has the highest percentage of unemployed individuals, with 25.5% or 98 of them being unemployed.
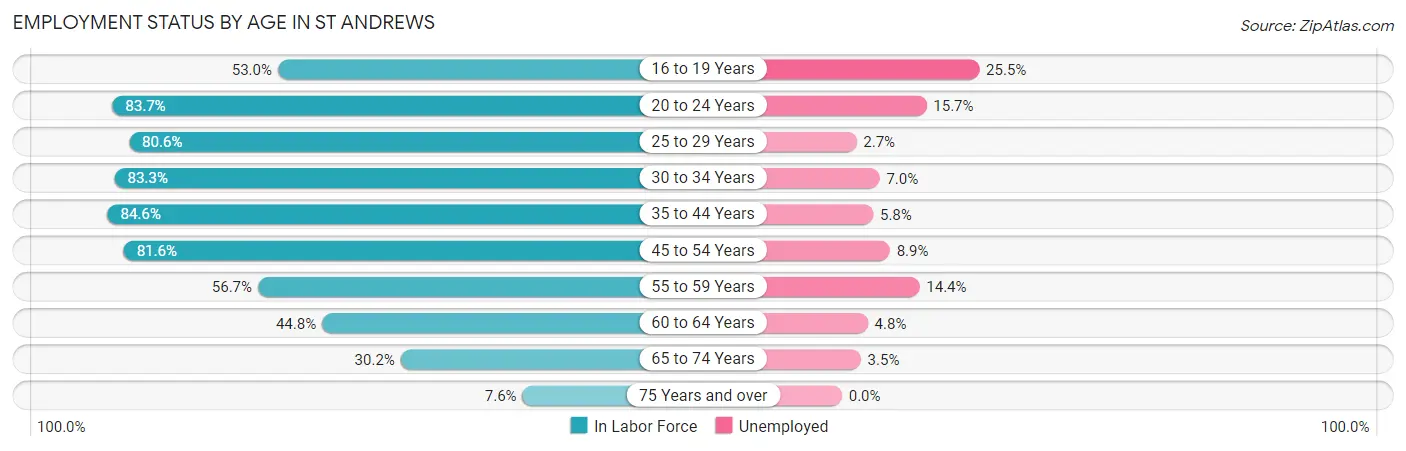
| Age Bracket | In Labor Force | Unemployed |
| 16 to 19 Years | 384 (53.0%) | 98 (25.5%) |
| 20 to 24 Years | 2,107 (83.7%) | 331 (15.7%) |
| 25 to 29 Years | 1,985 (80.6%) | 54 (2.7%) |
| 30 to 34 Years | 1,340 (83.3%) | 94 (7.0%) |
| 35 to 44 Years | 2,485 (84.6%) | 144 (5.8%) |
| 45 to 54 Years | 1,676 (81.6%) | 149 (8.9%) |
| 55 to 59 Years | 770 (56.7%) | 111 (14.4%) |
| 60 to 64 Years | 542 (44.8%) | 26 (4.8%) |
| 65 to 74 Years | 546 (30.2%) | 19 (3.5%) |
| 75 Years and over | 61 (7.6%) | 0 (0.0%) |
| Total | 11,890 (68.0%) | 1,034 (8.7%) |
Employment Status by Educational Attainment in St Andrews
According to labor force statistics for St Andrews, 75.7% of individuals (8,805) out of the total population between 25 and 64 years of age (11,631) are in the labor force, with 6.6% or 581 of them being unemployed. The group with the highest labor force participation rate are those with the educational attainment of bachelor's degree or higher, with 84.2% or 2,181 individuals in the labor force. Within the labor force, individuals with less than high school education have the highest percentage of unemployment, with 20.8% or 96 of them being unemployed.
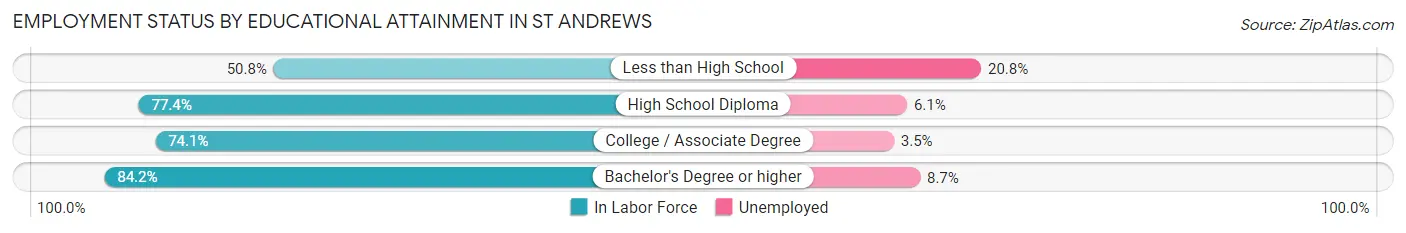
| Educational Attainment | In Labor Force | Unemployed |
| Less than High School | 462 (50.8%) | 189 (20.8%) |
| High School Diploma | 3,063 (77.4%) | 241 (6.1%) |
| College / Associate Degree | 3,092 (74.1%) | 146 (3.5%) |
| Bachelor's Degree or higher | 2,181 (84.2%) | 225 (8.7%) |
| Total | 8,805 (75.7%) | 768 (6.6%) |
Employment Occupations by Sex in St Andrews
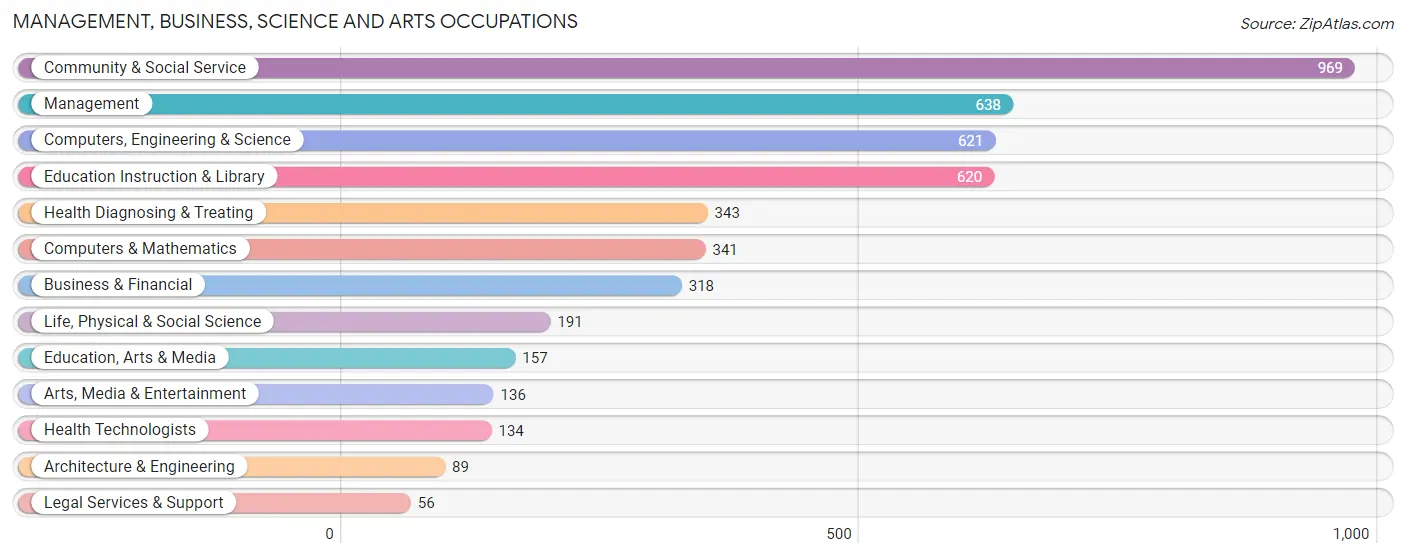
Management, Business, Science and Arts Occupations
The most common Management, Business, Science and Arts occupations in St Andrews are Community & Social Service (969 | 9.0%), Management (638 | 5.9%), Computers, Engineering & Science (621 | 5.7%), Education Instruction & Library (620 | 5.7%), and Health Diagnosing & Treating (343 | 3.2%).
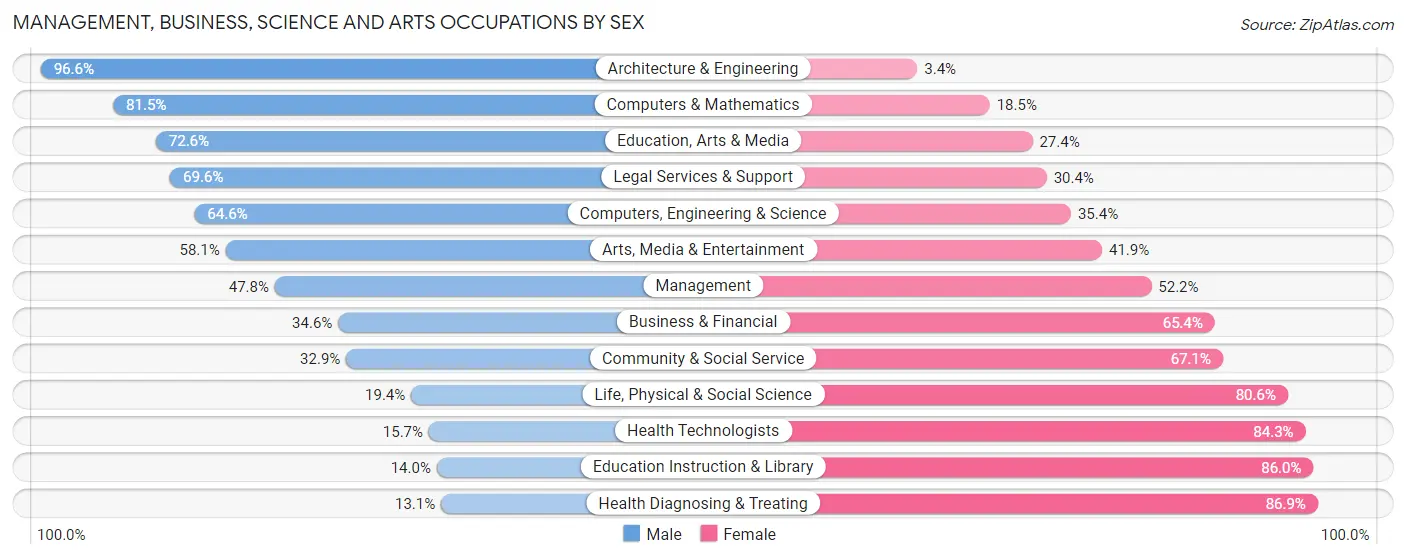
Management, Business, Science and Arts Occupations by Sex
Within the Management, Business, Science and Arts occupations in St Andrews, the most male-oriented occupations are Architecture & Engineering (96.6%), Computers & Mathematics (81.5%), and Education, Arts & Media (72.6%), while the most female-oriented occupations are Health Diagnosing & Treating (86.9%), Education Instruction & Library (86.0%), and Health Technologists (84.3%).
| Occupation | Male | Female |
| Management | 305 (47.8%) | 333 (52.2%) |
| Business & Financial | 110 (34.6%) | 208 (65.4%) |
| Computers, Engineering & Science | 401 (64.6%) | 220 (35.4%) |
| Computers & Mathematics | 278 (81.5%) | 63 (18.5%) |
| Architecture & Engineering | 86 (96.6%) | 3 (3.4%) |
| Life, Physical & Social Science | 37 (19.4%) | 154 (80.6%) |
| Community & Social Service | 319 (32.9%) | 650 (67.1%) |
| Education, Arts & Media | 114 (72.6%) | 43 (27.4%) |
| Legal Services & Support | 39 (69.6%) | 17 (30.4%) |
| Education Instruction & Library | 87 (14.0%) | 533 (86.0%) |
| Arts, Media & Entertainment | 79 (58.1%) | 57 (41.9%) |
| Health Diagnosing & Treating | 45 (13.1%) | 298 (86.9%) |
| Health Technologists | 21 (15.7%) | 113 (84.3%) |
| Total (Category) | 1,180 (40.8%) | 1,709 (59.2%) |
| Total (Overall) | 5,059 (46.8%) | 5,751 (53.2%) |
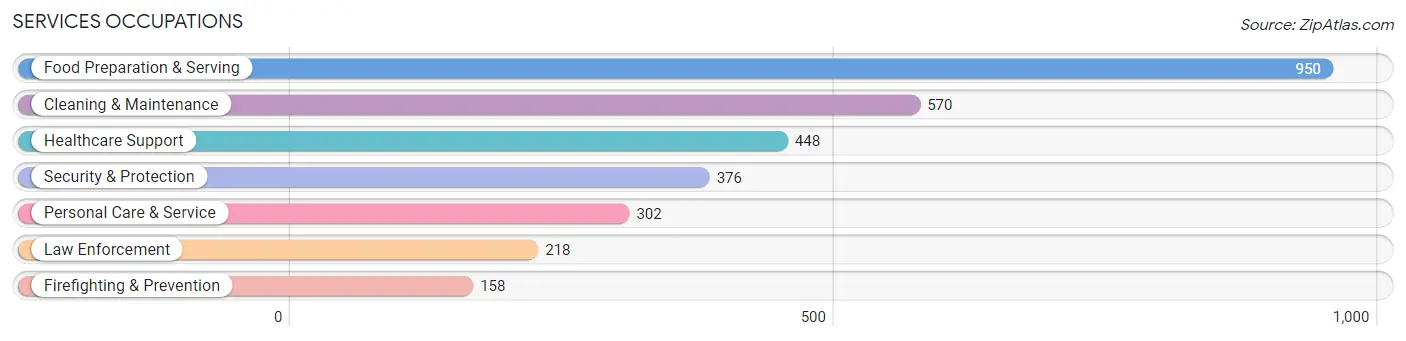
Services Occupations
The most common Services occupations in St Andrews are Food Preparation & Serving (950 | 8.8%), Cleaning & Maintenance (570 | 5.3%), Healthcare Support (448 | 4.1%), Security & Protection (376 | 3.5%), and Personal Care & Service (302 | 2.8%).
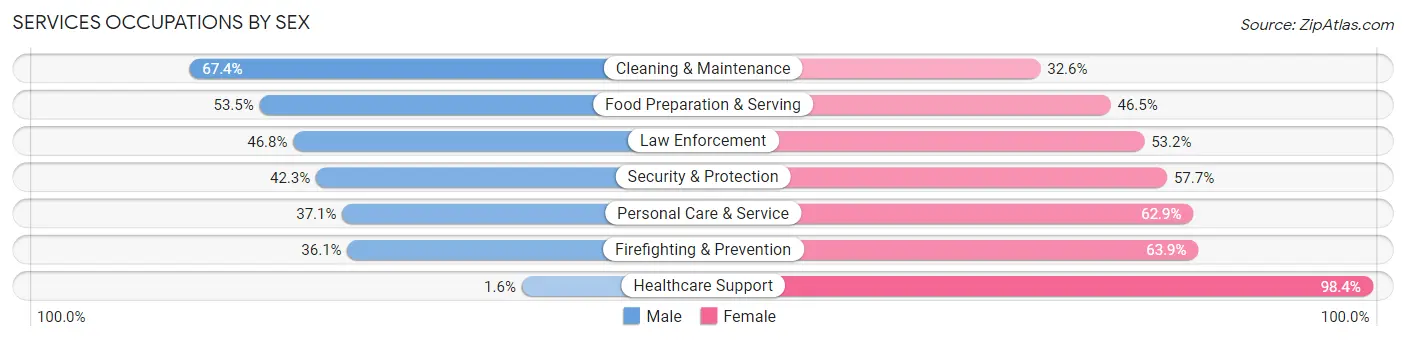
Services Occupations by Sex
Within the Services occupations in St Andrews, the most male-oriented occupations are Cleaning & Maintenance (67.4%), Food Preparation & Serving (53.5%), and Law Enforcement (46.8%), while the most female-oriented occupations are Healthcare Support (98.4%), Firefighting & Prevention (63.9%), and Personal Care & Service (62.9%).
| Occupation | Male | Female |
| Healthcare Support | 7 (1.6%) | 441 (98.4%) |
| Security & Protection | 159 (42.3%) | 217 (57.7%) |
| Firefighting & Prevention | 57 (36.1%) | 101 (63.9%) |
| Law Enforcement | 102 (46.8%) | 116 (53.2%) |
| Food Preparation & Serving | 508 (53.5%) | 442 (46.5%) |
| Cleaning & Maintenance | 384 (67.4%) | 186 (32.6%) |
| Personal Care & Service | 112 (37.1%) | 190 (62.9%) |
| Total (Category) | 1,170 (44.2%) | 1,476 (55.8%) |
| Total (Overall) | 5,059 (46.8%) | 5,751 (53.2%) |
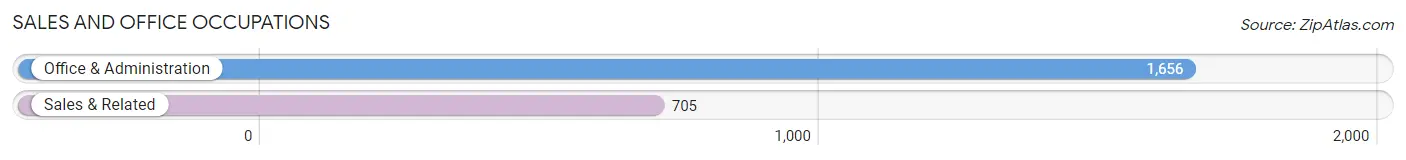
Sales and Office Occupations
The most common Sales and Office occupations in St Andrews are Office & Administration (1,656 | 15.3%), and Sales & Related (705 | 6.5%).
Sales and Office Occupations by Sex
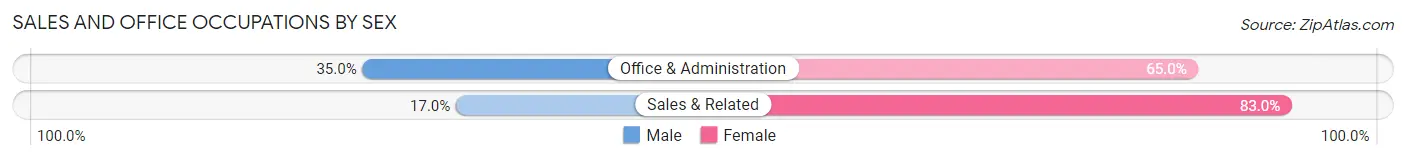
| Occupation | Male | Female |
| Sales & Related | 120 (17.0%) | 585 (83.0%) |
| Office & Administration | 580 (35.0%) | 1,076 (65.0%) |
| Total (Category) | 700 (29.6%) | 1,661 (70.4%) |
| Total (Overall) | 5,059 (46.8%) | 5,751 (53.2%) |
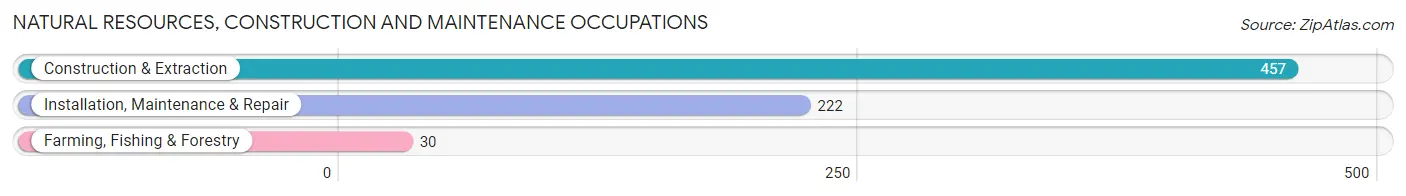
Natural Resources, Construction and Maintenance Occupations
The most common Natural Resources, Construction and Maintenance occupations in St Andrews are Construction & Extraction (457 | 4.2%), Installation, Maintenance & Repair (222 | 2.1%), and Farming, Fishing & Forestry (30 | 0.3%).
Natural Resources, Construction and Maintenance Occupations by Sex
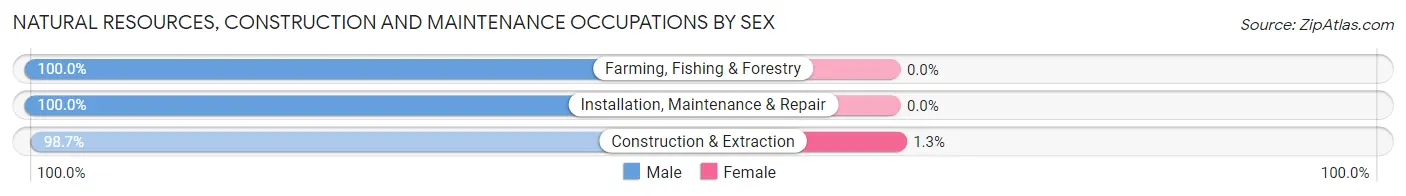
| Occupation | Male | Female |
| Farming, Fishing & Forestry | 30 (100.0%) | 0 (0.0%) |
| Construction & Extraction | 451 (98.7%) | 6 (1.3%) |
| Installation, Maintenance & Repair | 222 (100.0%) | 0 (0.0%) |
| Total (Category) | 703 (99.2%) | 6 (0.9%) |
| Total (Overall) | 5,059 (46.8%) | 5,751 (53.2%) |
Production, Transportation and Moving Occupations
The most common Production, Transportation and Moving occupations in St Andrews are Production (1,252 | 11.6%), Material Moving (628 | 5.8%), and Transportation (325 | 3.0%).
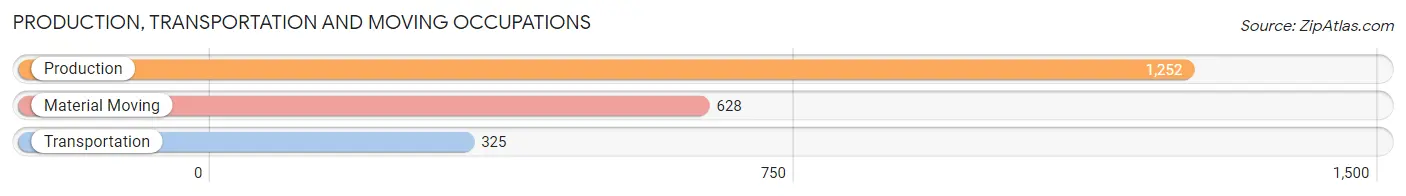
Production, Transportation and Moving Occupations by Sex
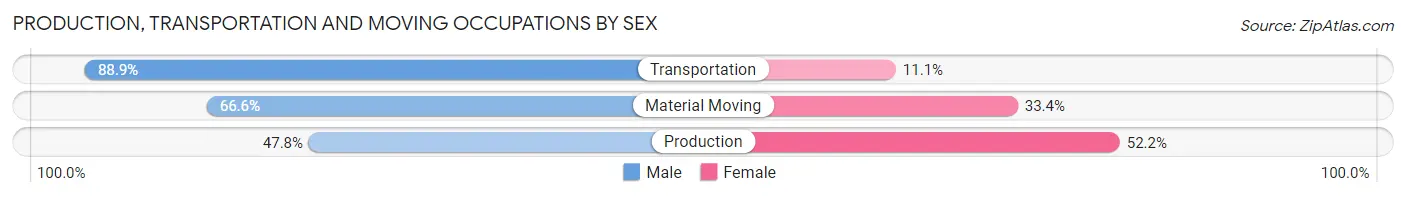
| Occupation | Male | Female |
| Production | 599 (47.8%) | 653 (52.2%) |
| Transportation | 289 (88.9%) | 36 (11.1%) |
| Material Moving | 418 (66.6%) | 210 (33.4%) |
| Total (Category) | 1,306 (59.2%) | 899 (40.8%) |
| Total (Overall) | 5,059 (46.8%) | 5,751 (53.2%) |
Employment Industries by Sex in St Andrews
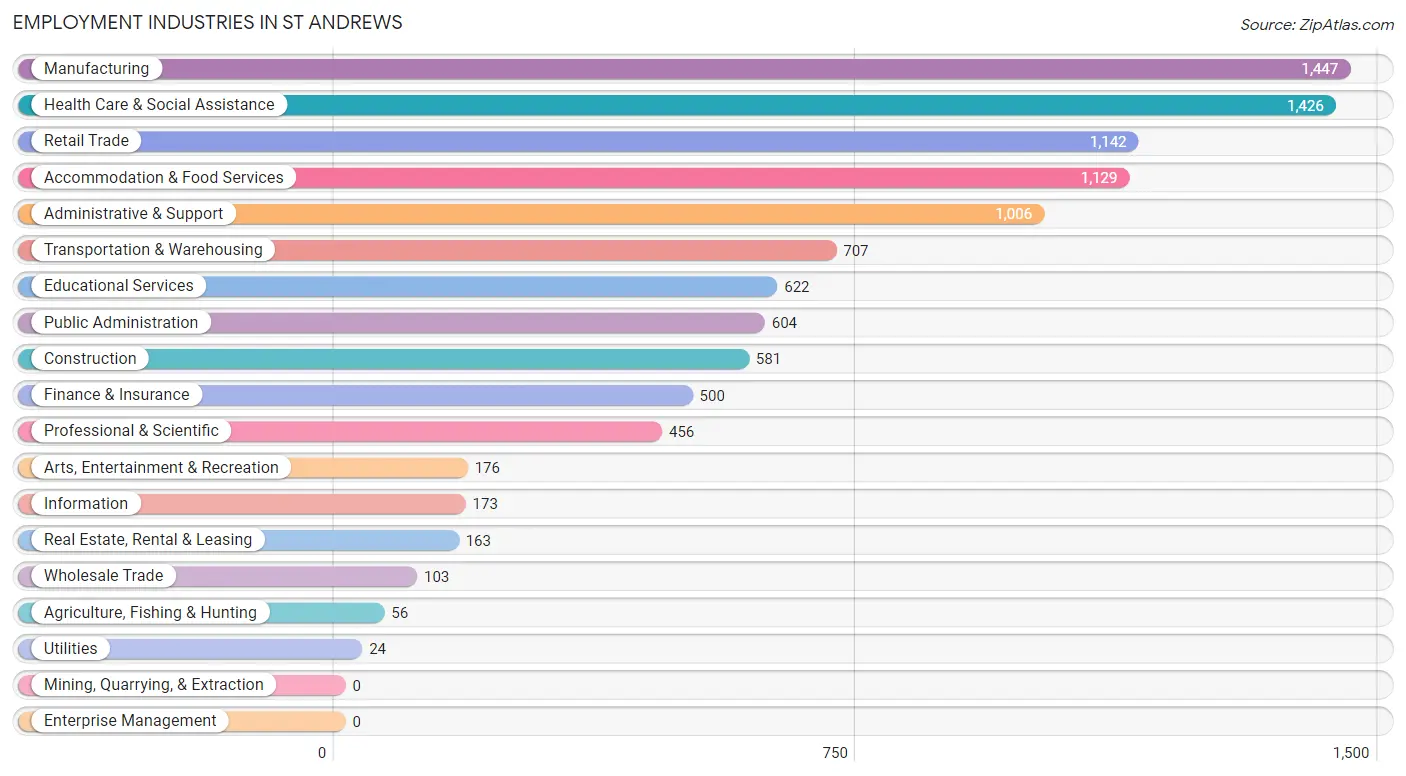
Employment Industries in St Andrews
The major employment industries in St Andrews include Manufacturing (1,447 | 13.4%), Health Care & Social Assistance (1,426 | 13.2%), Retail Trade (1,142 | 10.6%), Accommodation & Food Services (1,129 | 10.4%), and Administrative & Support (1,006 | 9.3%).
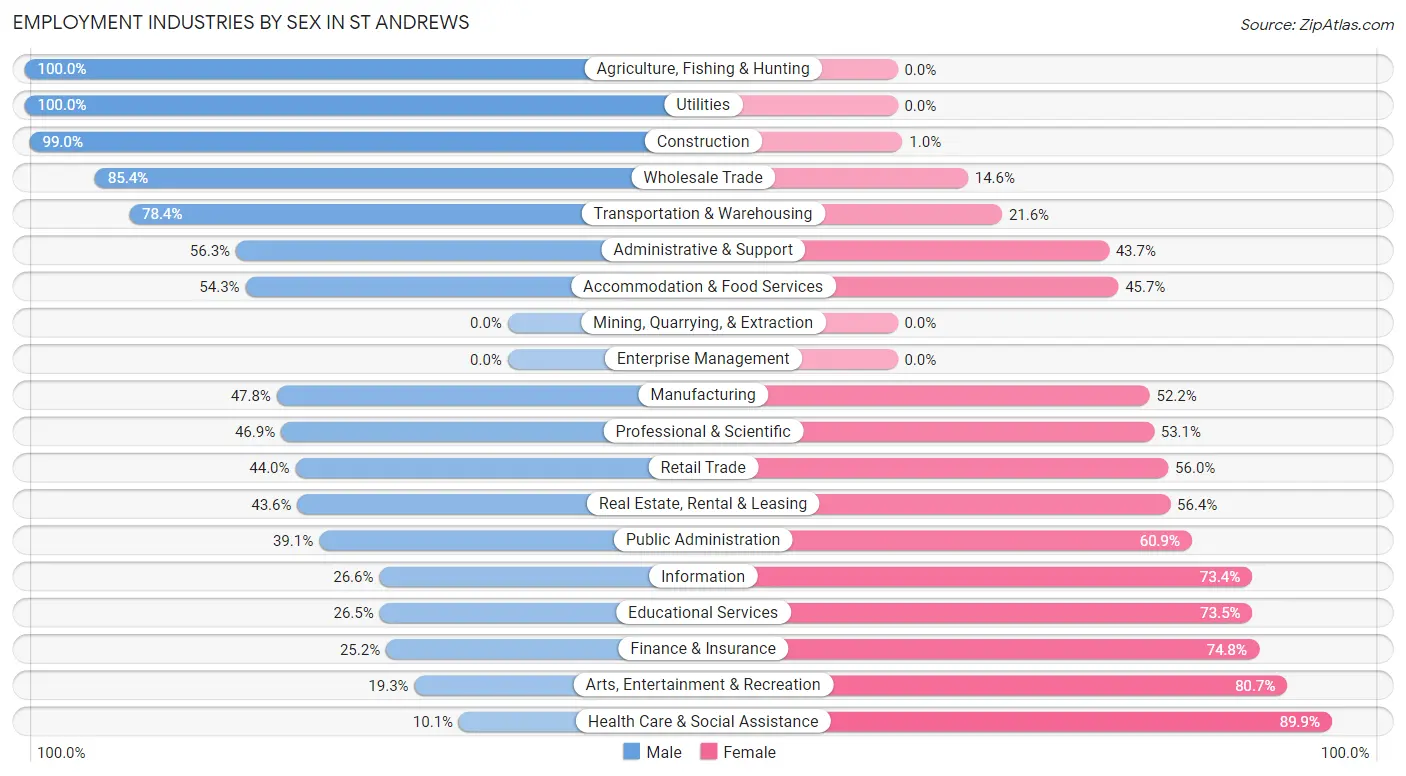
Employment Industries by Sex in St Andrews
The St Andrews industries that see more men than women are Agriculture, Fishing & Hunting (100.0%), Utilities (100.0%), and Construction (99.0%), whereas the industries that tend to have a higher number of women are Health Care & Social Assistance (89.9%), Arts, Entertainment & Recreation (80.7%), and Finance & Insurance (74.8%).
| Industry | Male | Female |
| Agriculture, Fishing & Hunting | 56 (100.0%) | 0 (0.0%) |
| Mining, Quarrying, & Extraction | 0 (0.0%) | 0 (0.0%) |
| Construction | 575 (99.0%) | 6 (1.0%) |
| Manufacturing | 692 (47.8%) | 755 (52.2%) |
| Wholesale Trade | 88 (85.4%) | 15 (14.6%) |
| Retail Trade | 502 (44.0%) | 640 (56.0%) |
| Transportation & Warehousing | 554 (78.4%) | 153 (21.6%) |
| Utilities | 24 (100.0%) | 0 (0.0%) |
| Information | 46 (26.6%) | 127 (73.4%) |
| Finance & Insurance | 126 (25.2%) | 374 (74.8%) |
| Real Estate, Rental & Leasing | 71 (43.6%) | 92 (56.4%) |
| Professional & Scientific | 214 (46.9%) | 242 (53.1%) |
| Enterprise Management | 0 (0.0%) | 0 (0.0%) |
| Administrative & Support | 566 (56.3%) | 440 (43.7%) |
| Educational Services | 165 (26.5%) | 457 (73.5%) |
| Health Care & Social Assistance | 144 (10.1%) | 1,282 (89.9%) |
| Arts, Entertainment & Recreation | 34 (19.3%) | 142 (80.7%) |
| Accommodation & Food Services | 613 (54.3%) | 516 (45.7%) |
| Public Administration | 236 (39.1%) | 368 (60.9%) |
| Total | 5,059 (46.8%) | 5,751 (53.2%) |
Education in St Andrews
School Enrollment in St Andrews
The most common levels of schooling among the 4,875 students in St Andrews are college / undergraduate (1,244 | 25.5%), elementary school (983 | 20.2%), and middle school (910 | 18.7%).
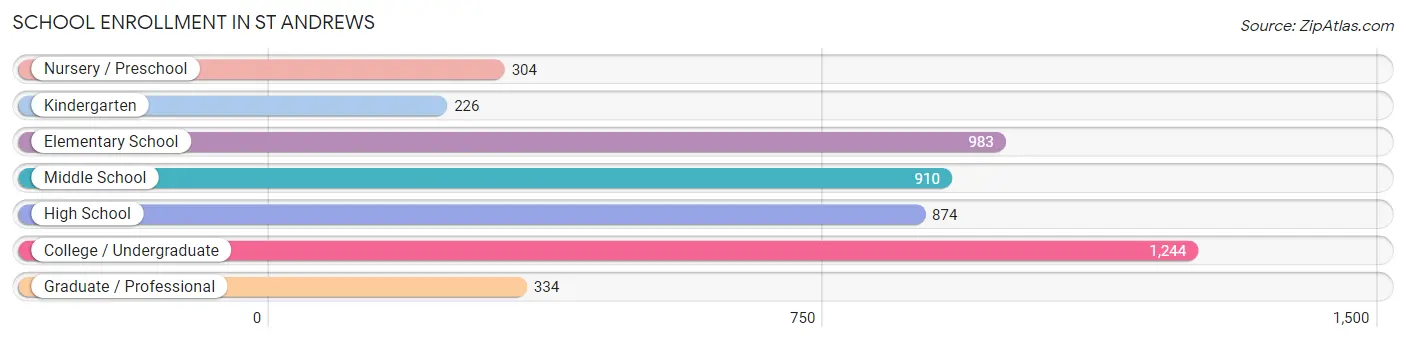
| School Level | # Students | % Students |
| Nursery / Preschool | 304 | 6.2% |
| Kindergarten | 226 | 4.6% |
| Elementary School | 983 | 20.2% |
| Middle School | 910 | 18.7% |
| High School | 874 | 17.9% |
| College / Undergraduate | 1,244 | 25.5% |
| Graduate / Professional | 334 | 6.9% |
| Total | 4,875 | 100.0% |
School Enrollment by Age by Funding Source in St Andrews
Out of a total of 4,875 students who are enrolled in schools in St Andrews, 609 (12.5%) attend a private institution, while the remaining 4,266 (87.5%) are enrolled in public schools. The age group of 18 to 19 year olds has the highest likelihood of being enrolled in private schools, with 22 (35.5% in the age bracket) enrolled. Conversely, the age group of 10 to 14 year olds has the lowest likelihood of being enrolled in a private school, with 1,229 (100.0% in the age bracket) attending a public institution.
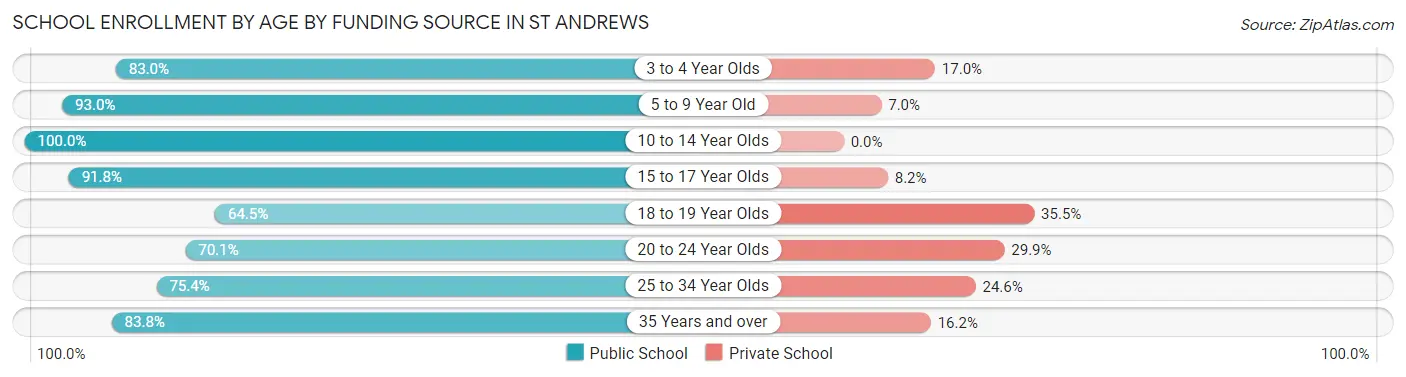
| Age Bracket | Public School | Private School |
| 3 to 4 Year Olds | 259 (83.0%) | 53 (17.0%) |
| 5 to 9 Year Old | 1,010 (93.0%) | 76 (7.0%) |
| 10 to 14 Year Olds | 1,229 (100.0%) | 0 (0.0%) |
| 15 to 17 Year Olds | 558 (91.8%) | 50 (8.2%) |
| 18 to 19 Year Olds | 40 (64.5%) | 22 (35.5%) |
| 20 to 24 Year Olds | 562 (70.1%) | 240 (29.9%) |
| 25 to 34 Year Olds | 390 (75.4%) | 127 (24.6%) |
| 35 Years and over | 217 (83.8%) | 42 (16.2%) |
| Total | 4,266 (87.5%) | 609 (12.5%) |
Educational Attainment by Field of Study in St Andrews
Business (718 | 20.8%), education (546 | 15.8%), social sciences (271 | 7.8%), science & technology (270 | 7.8%), and visual & performing arts (248 | 7.2%) are the most common fields of study among 3,456 individuals in St Andrews who have obtained a bachelor's degree or higher.
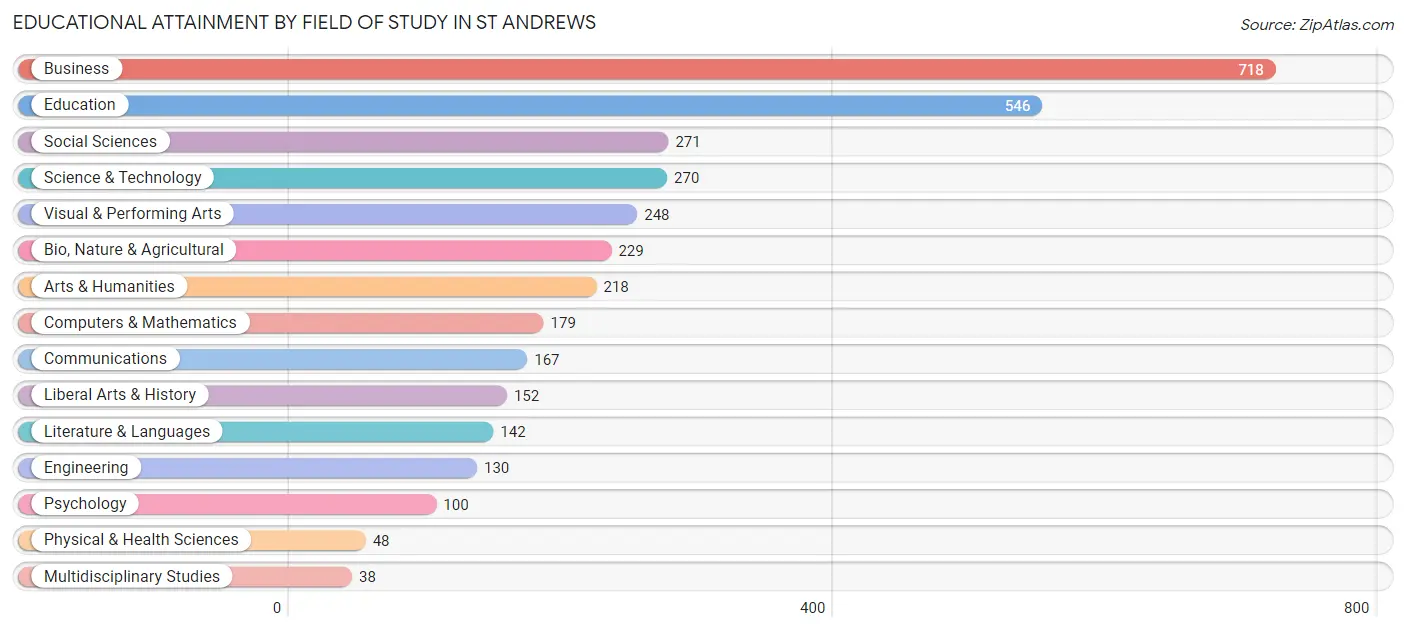
| Field of Study | # Graduates | % Graduates |
| Computers & Mathematics | 179 | 5.2% |
| Bio, Nature & Agricultural | 229 | 6.6% |
| Physical & Health Sciences | 48 | 1.4% |
| Psychology | 100 | 2.9% |
| Social Sciences | 271 | 7.8% |
| Engineering | 130 | 3.8% |
| Multidisciplinary Studies | 38 | 1.1% |
| Science & Technology | 270 | 7.8% |
| Business | 718 | 20.8% |
| Education | 546 | 15.8% |
| Literature & Languages | 142 | 4.1% |
| Liberal Arts & History | 152 | 4.4% |
| Visual & Performing Arts | 248 | 7.2% |
| Communications | 167 | 4.8% |
| Arts & Humanities | 218 | 6.3% |
| Total | 3,456 | 100.0% |
Transportation & Commute in St Andrews
Vehicle Availability by Sex in St Andrews
The most prevalent vehicle ownership categories in St Andrews are males with 2 vehicles (2,038, accounting for 41.2%) and females with 2 vehicles (1,802, making up 37.7%).
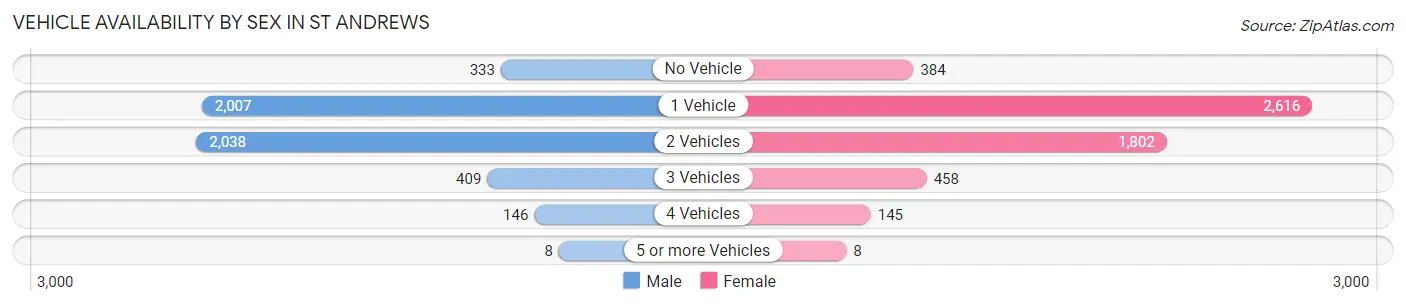
| Vehicles Available | Male | Female |
| No Vehicle | 333 (6.7%) | 384 (7.1%) |
| 1 Vehicle | 2,007 (40.6%) | 2,616 (48.3%) |
| 2 Vehicles | 2,038 (41.2%) | 1,802 (33.3%) |
| 3 Vehicles | 409 (8.3%) | 458 (8.5%) |
| 4 Vehicles | 146 (2.9%) | 145 (2.7%) |
| 5 or more Vehicles | 8 (0.2%) | 8 (0.2%) |
| Total | 4,941 (100.0%) | 5,413 (100.0%) |
Commute Time in St Andrews
The most frequently occuring commute durations in St Andrews are 15 to 19 minutes (2,518 commuters, 26.2%), 20 to 24 minutes (1,930 commuters, 20.1%), and 10 to 14 minutes (1,687 commuters, 17.5%).
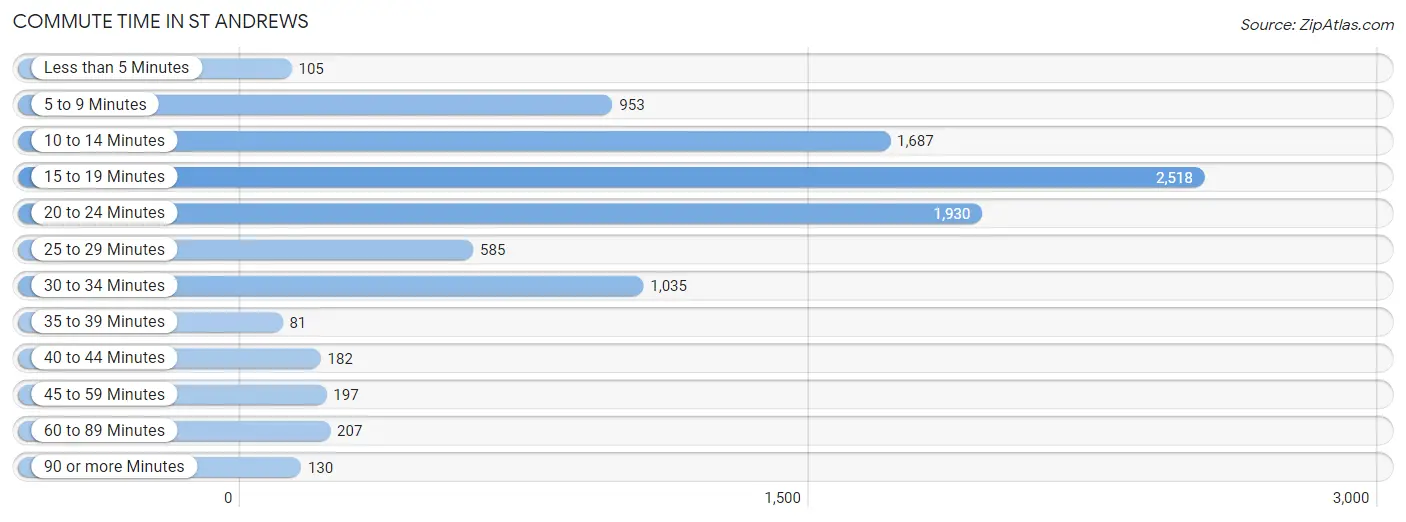
| Commute Time | # Commuters | % Commuters |
| Less than 5 Minutes | 105 | 1.1% |
| 5 to 9 Minutes | 953 | 9.9% |
| 10 to 14 Minutes | 1,687 | 17.5% |
| 15 to 19 Minutes | 2,518 | 26.2% |
| 20 to 24 Minutes | 1,930 | 20.1% |
| 25 to 29 Minutes | 585 | 6.1% |
| 30 to 34 Minutes | 1,035 | 10.8% |
| 35 to 39 Minutes | 81 | 0.8% |
| 40 to 44 Minutes | 182 | 1.9% |
| 45 to 59 Minutes | 197 | 2.1% |
| 60 to 89 Minutes | 207 | 2.1% |
| 90 or more Minutes | 130 | 1.3% |
Commute Time by Sex in St Andrews
The most common commute times in St Andrews are 15 to 19 minutes (1,192 commuters, 25.0%) for males and 15 to 19 minutes (1,326 commuters, 27.4%) for females.
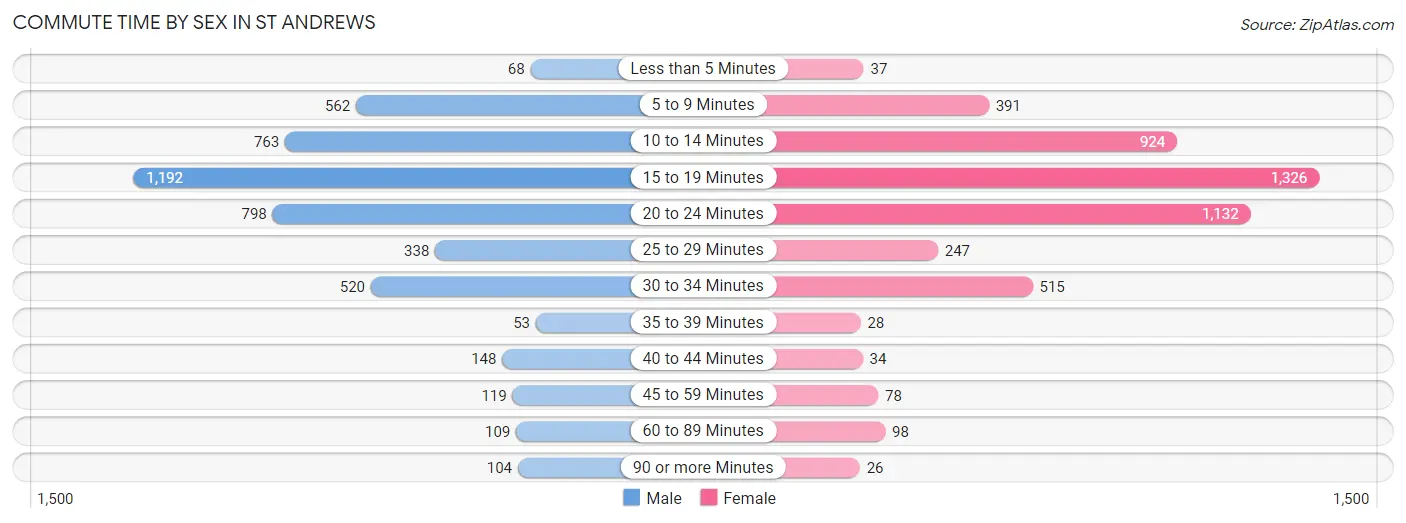
| Commute Time | Male | Female |
| Less than 5 Minutes | 68 (1.4%) | 37 (0.8%) |
| 5 to 9 Minutes | 562 (11.8%) | 391 (8.1%) |
| 10 to 14 Minutes | 763 (16.0%) | 924 (19.1%) |
| 15 to 19 Minutes | 1,192 (25.0%) | 1,326 (27.4%) |
| 20 to 24 Minutes | 798 (16.7%) | 1,132 (23.4%) |
| 25 to 29 Minutes | 338 (7.1%) | 247 (5.1%) |
| 30 to 34 Minutes | 520 (10.9%) | 515 (10.6%) |
| 35 to 39 Minutes | 53 (1.1%) | 28 (0.6%) |
| 40 to 44 Minutes | 148 (3.1%) | 34 (0.7%) |
| 45 to 59 Minutes | 119 (2.5%) | 78 (1.6%) |
| 60 to 89 Minutes | 109 (2.3%) | 98 (2.0%) |
| 90 or more Minutes | 104 (2.2%) | 26 (0.5%) |
Time of Departure to Work by Sex in St Andrews
The most frequent times of departure to work in St Andrews are 4:00 PM to 11:59 PM (690, 14.4%) for males and 8:00 AM to 8:29 AM (721, 14.9%) for females.
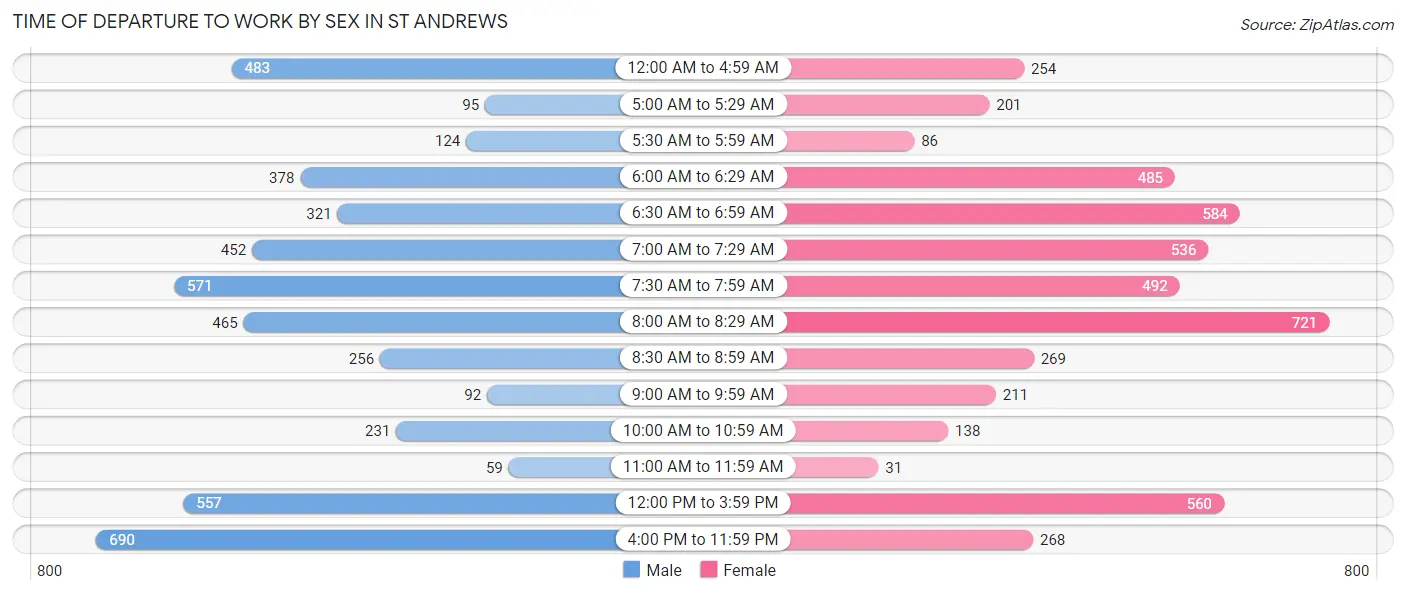
| Time of Departure | Male | Female |
| 12:00 AM to 4:59 AM | 483 (10.1%) | 254 (5.2%) |
| 5:00 AM to 5:29 AM | 95 (2.0%) | 201 (4.2%) |
| 5:30 AM to 5:59 AM | 124 (2.6%) | 86 (1.8%) |
| 6:00 AM to 6:29 AM | 378 (7.9%) | 485 (10.0%) |
| 6:30 AM to 6:59 AM | 321 (6.7%) | 584 (12.1%) |
| 7:00 AM to 7:29 AM | 452 (9.5%) | 536 (11.1%) |
| 7:30 AM to 7:59 AM | 571 (12.0%) | 492 (10.2%) |
| 8:00 AM to 8:29 AM | 465 (9.7%) | 721 (14.9%) |
| 8:30 AM to 8:59 AM | 256 (5.4%) | 269 (5.6%) |
| 9:00 AM to 9:59 AM | 92 (1.9%) | 211 (4.4%) |
| 10:00 AM to 10:59 AM | 231 (4.8%) | 138 (2.9%) |
| 11:00 AM to 11:59 AM | 59 (1.2%) | 31 (0.6%) |
| 12:00 PM to 3:59 PM | 557 (11.7%) | 560 (11.6%) |
| 4:00 PM to 11:59 PM | 690 (14.4%) | 268 (5.5%) |
| Total | 4,774 (100.0%) | 4,836 (100.0%) |
Housing Occupancy in St Andrews
Occupancy by Ownership in St Andrews
Of the total 10,195 dwellings in St Andrews, owner-occupied units account for 2,927 (28.7%), while renter-occupied units make up 7,268 (71.3%).
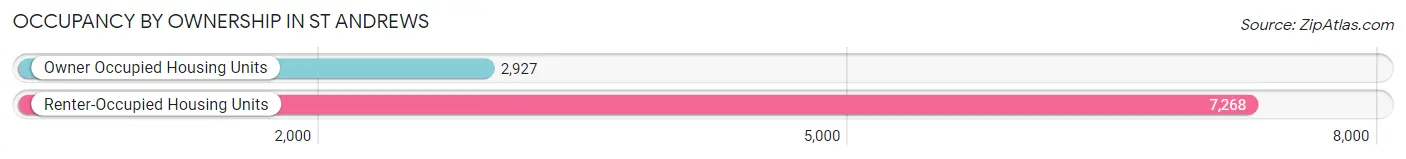
| Occupancy | # Housing Units | % Housing Units |
| Owner Occupied Housing Units | 2,927 | 28.7% |
| Renter-Occupied Housing Units | 7,268 | 71.3% |
| Total Occupied Housing Units | 10,195 | 100.0% |
Occupancy by Household Size in St Andrews
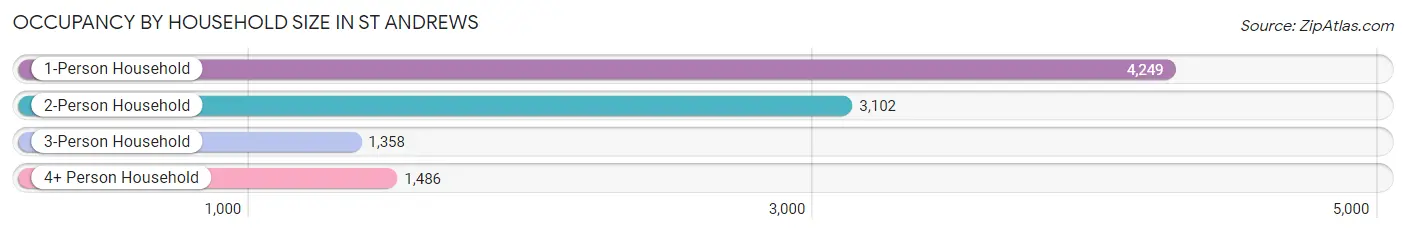
| Household Size | # Housing Units | % Housing Units |
| 1-Person Household | 4,249 | 41.7% |
| 2-Person Household | 3,102 | 30.4% |
| 3-Person Household | 1,358 | 13.3% |
| 4+ Person Household | 1,486 | 14.6% |
| Total Housing Units | 10,195 | 100.0% |
Occupancy by Ownership by Household Size in St Andrews
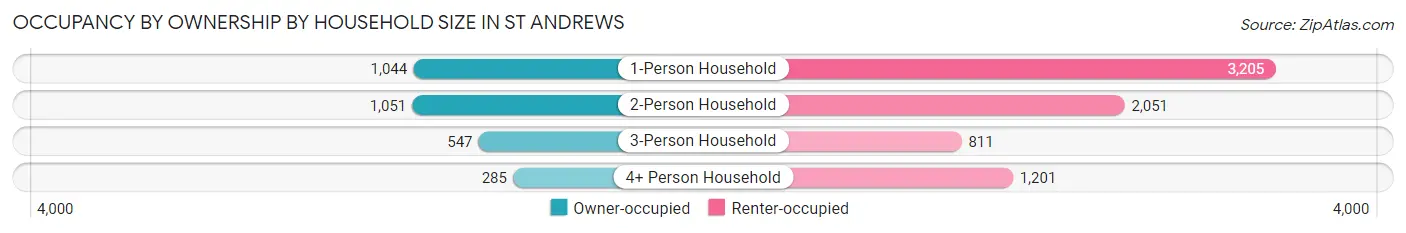
| Household Size | Owner-occupied | Renter-occupied |
| 1-Person Household | 1,044 (24.6%) | 3,205 (75.4%) |
| 2-Person Household | 1,051 (33.9%) | 2,051 (66.1%) |
| 3-Person Household | 547 (40.3%) | 811 (59.7%) |
| 4+ Person Household | 285 (19.2%) | 1,201 (80.8%) |
| Total Housing Units | 2,927 (28.7%) | 7,268 (71.3%) |
Occupancy by Educational Attainment in St Andrews
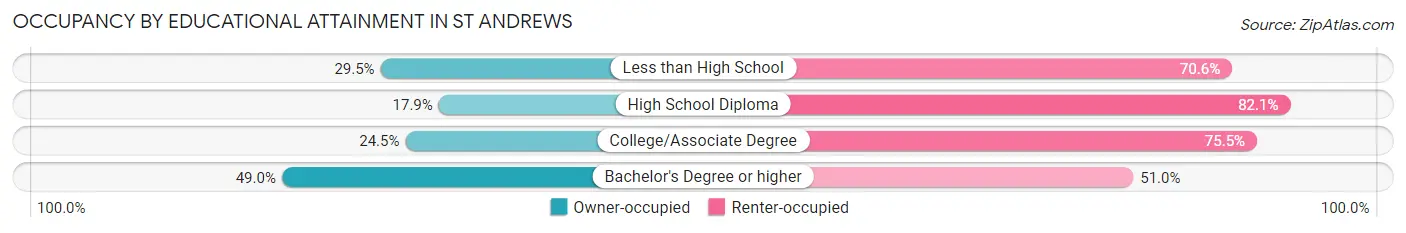
| Household Size | Owner-occupied | Renter-occupied |
| Less than High School | 202 (29.4%) | 484 (70.6%) |
| High School Diploma | 558 (17.9%) | 2,558 (82.1%) |
| College/Associate Degree | 968 (24.5%) | 2,979 (75.5%) |
| Bachelor's Degree or higher | 1,199 (49.0%) | 1,247 (51.0%) |
Occupancy by Age of Householder in St Andrews
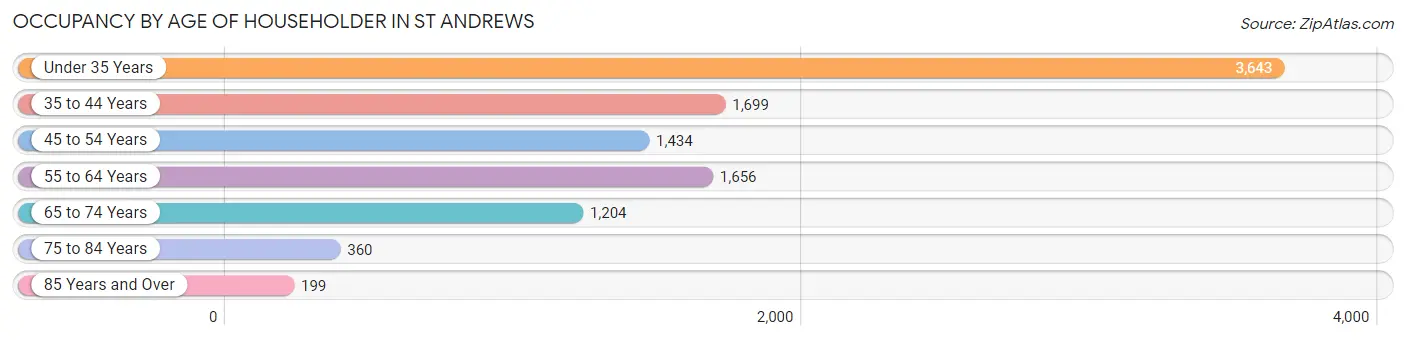
| Age Bracket | # Households | % Households |
| Under 35 Years | 3,643 | 35.7% |
| 35 to 44 Years | 1,699 | 16.7% |
| 45 to 54 Years | 1,434 | 14.1% |
| 55 to 64 Years | 1,656 | 16.2% |
| 65 to 74 Years | 1,204 | 11.8% |
| 75 to 84 Years | 360 | 3.5% |
| 85 Years and Over | 199 | 1.9% |
| Total | 10,195 | 100.0% |
Housing Finances in St Andrews
Median Income by Occupancy in St Andrews
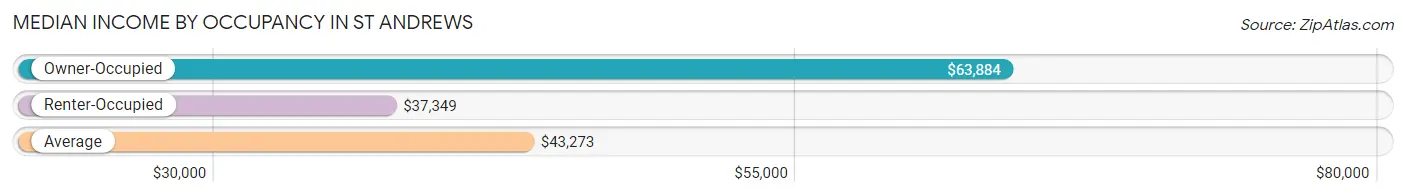
| Occupancy Type | # Households | Median Income |
| Owner-Occupied | 2,927 (28.7%) | $63,884 |
| Renter-Occupied | 7,268 (71.3%) | $37,349 |
| Average | 10,195 (100.0%) | $43,273 |
Occupancy by Householder Income Bracket in St Andrews
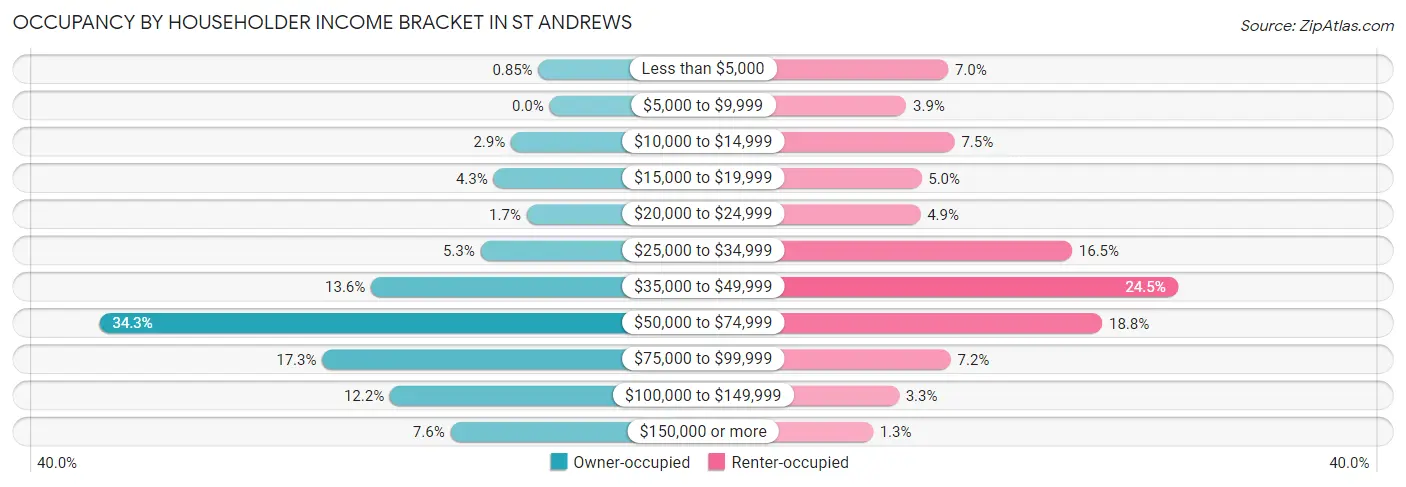
| Income Bracket | Owner-occupied | Renter-occupied |
| Less than $5,000 | 25 (0.9%) | 512 (7.0%) |
| $5,000 to $9,999 | 0 (0.0%) | 280 (3.8%) |
| $10,000 to $14,999 | 86 (2.9%) | 548 (7.5%) |
| $15,000 to $19,999 | 125 (4.3%) | 364 (5.0%) |
| $20,000 to $24,999 | 51 (1.7%) | 358 (4.9%) |
| $25,000 to $34,999 | 154 (5.3%) | 1,198 (16.5%) |
| $35,000 to $49,999 | 398 (13.6%) | 1,783 (24.5%) |
| $50,000 to $74,999 | 1,004 (34.3%) | 1,365 (18.8%) |
| $75,000 to $99,999 | 507 (17.3%) | 526 (7.2%) |
| $100,000 to $149,999 | 356 (12.2%) | 239 (3.3%) |
| $150,000 or more | 221 (7.5%) | 95 (1.3%) |
| Total | 2,927 (100.0%) | 7,268 (100.0%) |
Monthly Housing Cost Tiers in St Andrews
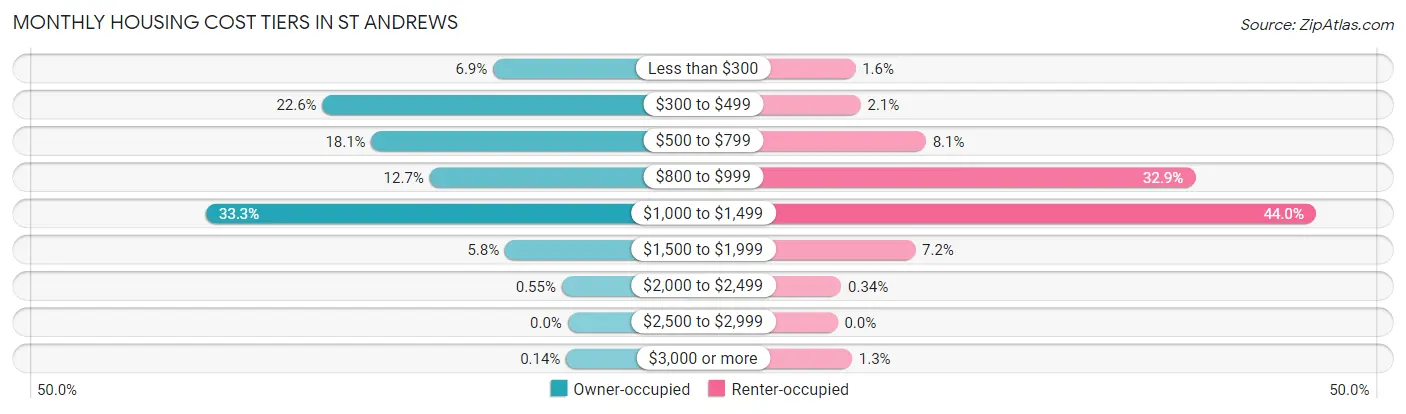
| Monthly Cost | Owner-occupied | Renter-occupied |
| Less than $300 | 201 (6.9%) | 119 (1.6%) |
| $300 to $499 | 661 (22.6%) | 155 (2.1%) |
| $500 to $799 | 529 (18.1%) | 591 (8.1%) |
| $800 to $999 | 372 (12.7%) | 2,393 (32.9%) |
| $1,000 to $1,499 | 975 (33.3%) | 3,200 (44.0%) |
| $1,500 to $1,999 | 169 (5.8%) | 520 (7.1%) |
| $2,000 to $2,499 | 16 (0.5%) | 25 (0.3%) |
| $2,500 to $2,999 | 0 (0.0%) | 0 (0.0%) |
| $3,000 or more | 4 (0.1%) | 97 (1.3%) |
| Total | 2,927 (100.0%) | 7,268 (100.0%) |
Physical Housing Characteristics in St Andrews
Housing Structures in St Andrews
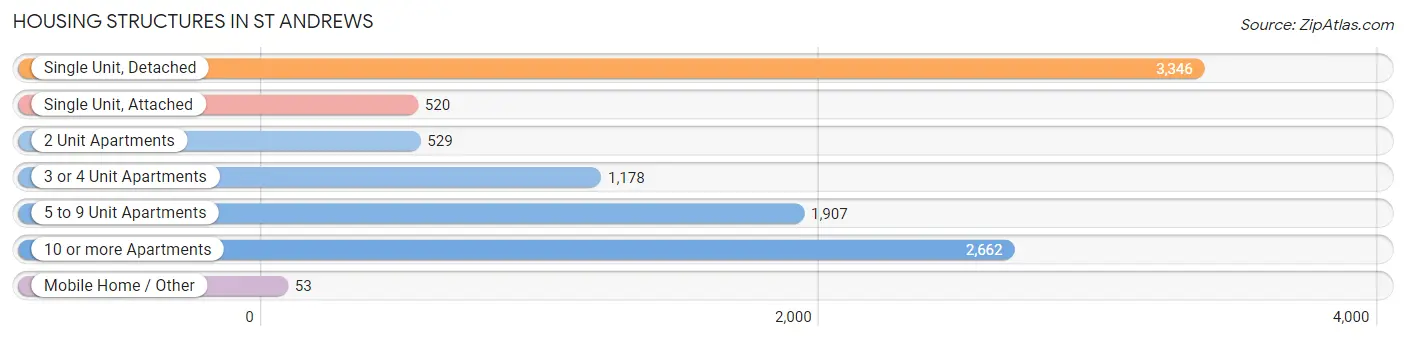
| Structure Type | # Housing Units | % Housing Units |
| Single Unit, Detached | 3,346 | 32.8% |
| Single Unit, Attached | 520 | 5.1% |
| 2 Unit Apartments | 529 | 5.2% |
| 3 or 4 Unit Apartments | 1,178 | 11.6% |
| 5 to 9 Unit Apartments | 1,907 | 18.7% |
| 10 or more Apartments | 2,662 | 26.1% |
| Mobile Home / Other | 53 | 0.5% |
| Total | 10,195 | 100.0% |
Housing Structures by Occupancy in St Andrews
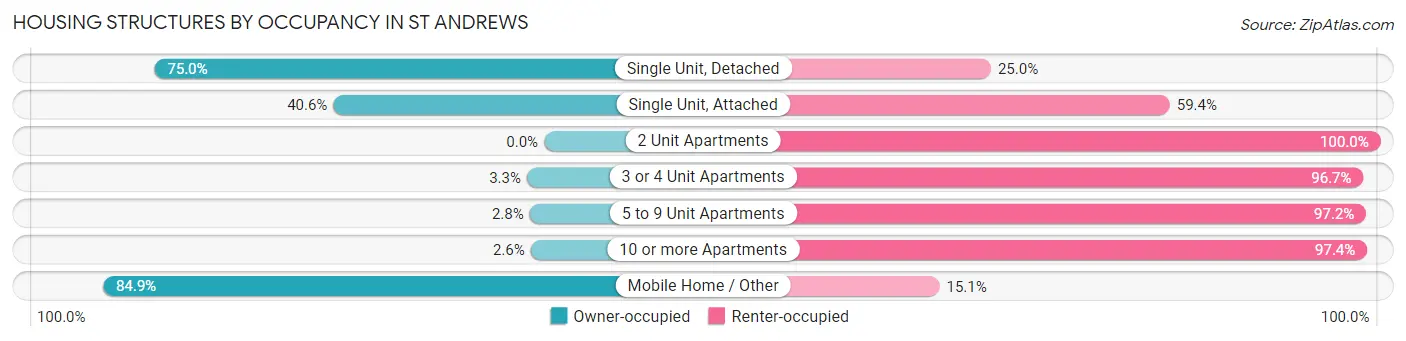
| Structure Type | Owner-occupied | Renter-occupied |
| Single Unit, Detached | 2,510 (75.0%) | 836 (25.0%) |
| Single Unit, Attached | 211 (40.6%) | 309 (59.4%) |
| 2 Unit Apartments | 0 (0.0%) | 529 (100.0%) |
| 3 or 4 Unit Apartments | 39 (3.3%) | 1,139 (96.7%) |
| 5 to 9 Unit Apartments | 53 (2.8%) | 1,854 (97.2%) |
| 10 or more Apartments | 69 (2.6%) | 2,593 (97.4%) |
| Mobile Home / Other | 45 (84.9%) | 8 (15.1%) |
| Total | 2,927 (28.7%) | 7,268 (71.3%) |
Housing Structures by Number of Rooms in St Andrews
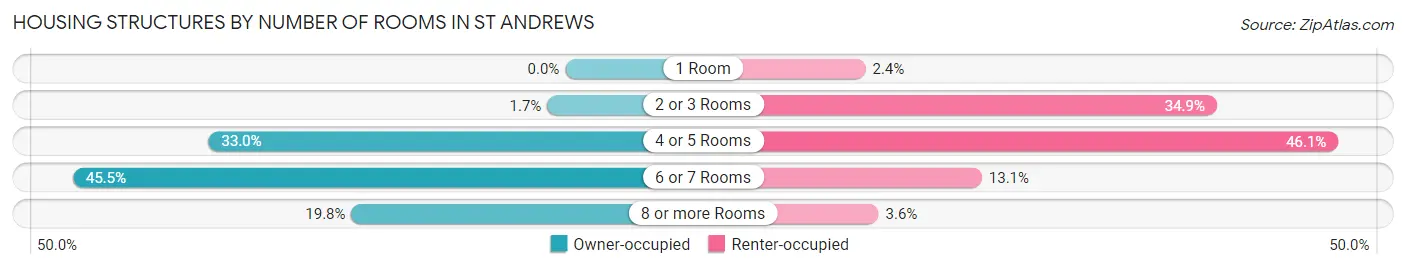
| Number of Rooms | Owner-occupied | Renter-occupied |
| 1 Room | 0 (0.0%) | 172 (2.4%) |
| 2 or 3 Rooms | 49 (1.7%) | 2,533 (34.8%) |
| 4 or 5 Rooms | 966 (33.0%) | 3,349 (46.1%) |
| 6 or 7 Rooms | 1,333 (45.5%) | 954 (13.1%) |
| 8 or more Rooms | 579 (19.8%) | 260 (3.6%) |
| Total | 2,927 (100.0%) | 7,268 (100.0%) |
Housing Structure by Heating Type in St Andrews
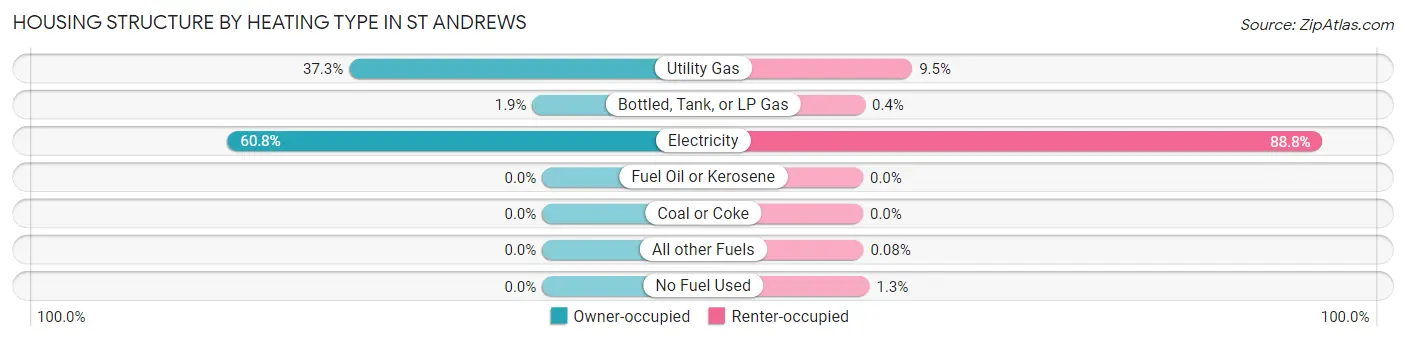
| Heating Type | Owner-occupied | Renter-occupied |
| Utility Gas | 1,092 (37.3%) | 691 (9.5%) |
| Bottled, Tank, or LP Gas | 55 (1.9%) | 29 (0.4%) |
| Electricity | 1,780 (60.8%) | 6,451 (88.8%) |
| Fuel Oil or Kerosene | 0 (0.0%) | 0 (0.0%) |
| Coal or Coke | 0 (0.0%) | 0 (0.0%) |
| All other Fuels | 0 (0.0%) | 6 (0.1%) |
| No Fuel Used | 0 (0.0%) | 91 (1.3%) |
| Total | 2,927 (100.0%) | 7,268 (100.0%) |
Household Vehicle Usage in St Andrews
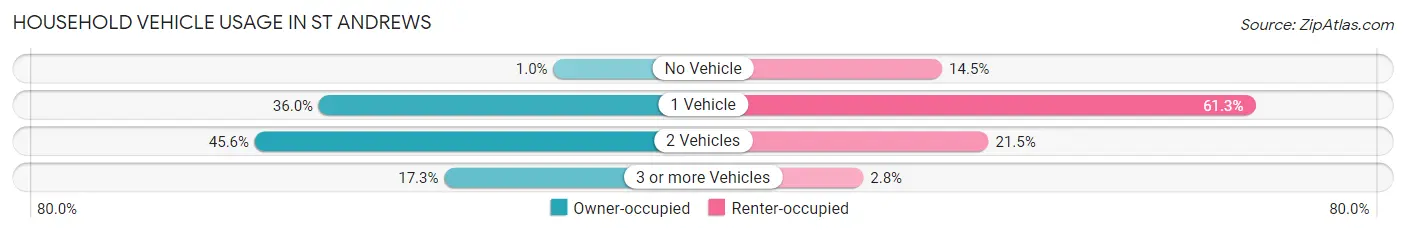
| Vehicles per Household | Owner-occupied | Renter-occupied |
| No Vehicle | 30 (1.0%) | 1,055 (14.5%) |
| 1 Vehicle | 1,055 (36.0%) | 4,454 (61.3%) |
| 2 Vehicles | 1,335 (45.6%) | 1,559 (21.4%) |
| 3 or more Vehicles | 507 (17.3%) | 200 (2.8%) |
| Total | 2,927 (100.0%) | 7,268 (100.0%) |
Real Estate & Mortgages in St Andrews
Real Estate and Mortgage Overview in St Andrews
| Characteristic | Without Mortgage | With Mortgage |
| Housing Units | 1,093 | 1,834 |
| Median Property Value | $121,700 | $136,900 |
| Median Household Income | $56,537 | $143 |
| Monthly Housing Costs | $391 | $4 |
| Real Estate Taxes | $766 | $40 |
Property Value by Mortgage Status in St Andrews
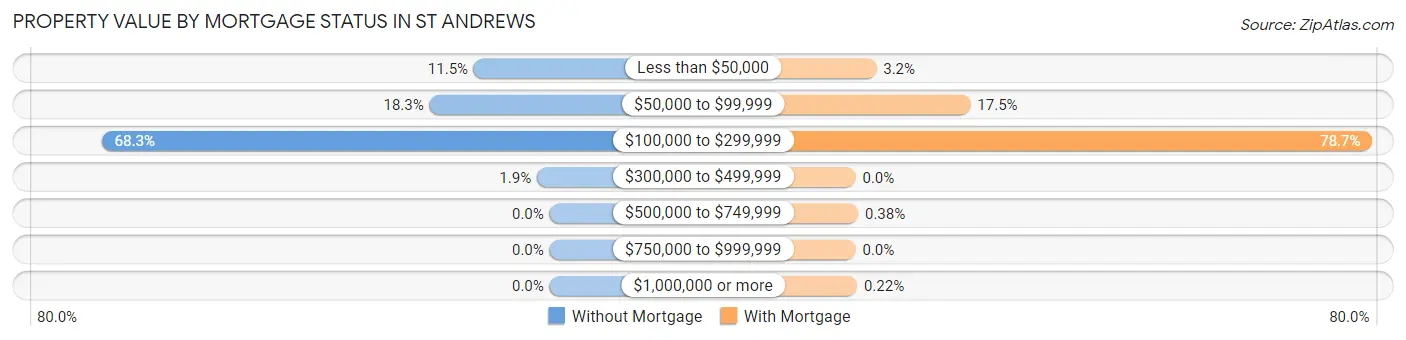
| Property Value | Without Mortgage | With Mortgage |
| Less than $50,000 | 126 (11.5%) | 58 (3.2%) |
| $50,000 to $99,999 | 200 (18.3%) | 321 (17.5%) |
| $100,000 to $299,999 | 746 (68.2%) | 1,444 (78.7%) |
| $300,000 to $499,999 | 21 (1.9%) | 0 (0.0%) |
| $500,000 to $749,999 | 0 (0.0%) | 7 (0.4%) |
| $750,000 to $999,999 | 0 (0.0%) | 0 (0.0%) |
| $1,000,000 or more | 0 (0.0%) | 4 (0.2%) |
| Total | 1,093 (100.0%) | 1,834 (100.0%) |
Household Income by Mortgage Status in St Andrews
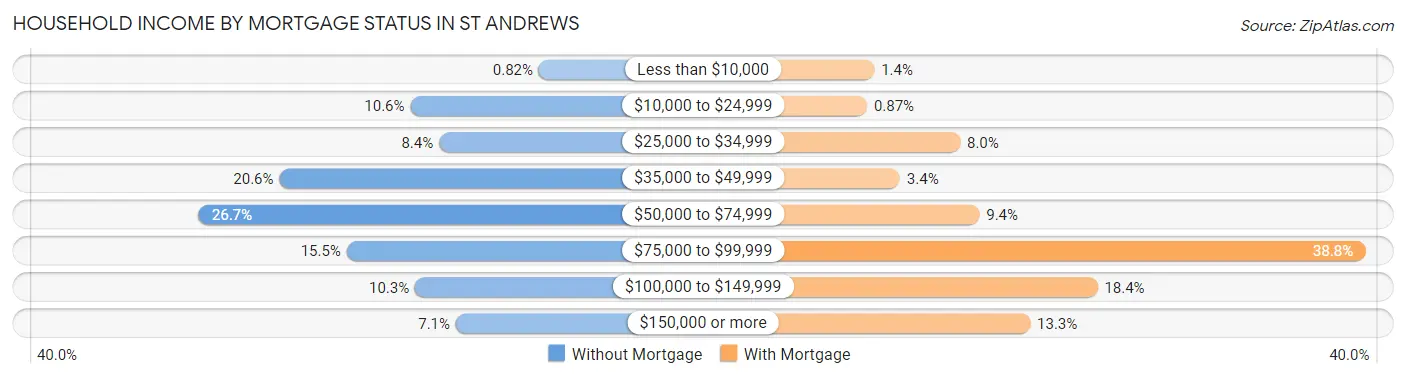
| Household Income | Without Mortgage | With Mortgage |
| Less than $10,000 | 9 (0.8%) | 26 (1.4%) |
| $10,000 to $24,999 | 116 (10.6%) | 16 (0.9%) |
| $25,000 to $34,999 | 92 (8.4%) | 146 (8.0%) |
| $35,000 to $49,999 | 225 (20.6%) | 62 (3.4%) |
| $50,000 to $74,999 | 292 (26.7%) | 173 (9.4%) |
| $75,000 to $99,999 | 169 (15.5%) | 712 (38.8%) |
| $100,000 to $149,999 | 112 (10.2%) | 338 (18.4%) |
| $150,000 or more | 78 (7.1%) | 244 (13.3%) |
| Total | 1,093 (100.0%) | 1,834 (100.0%) |
Property Value to Household Income Ratio in St Andrews
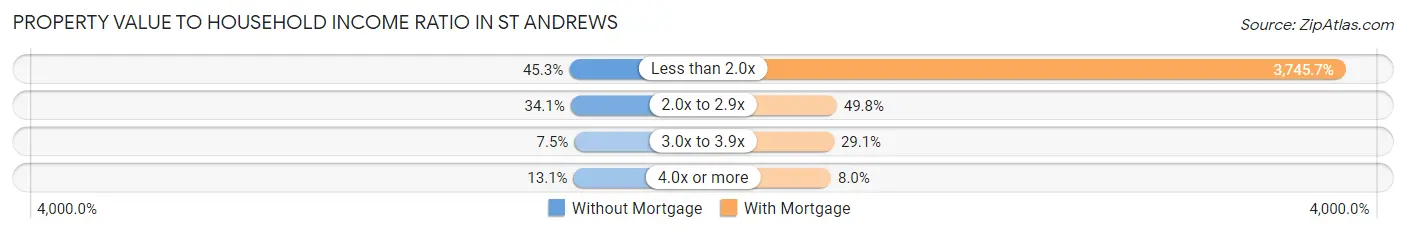
| Value-to-Income Ratio | Without Mortgage | With Mortgage |
| Less than 2.0x | 495 (45.3%) | 68,696 (3,745.7%) |
| 2.0x to 2.9x | 373 (34.1%) | 913 (49.8%) |
| 3.0x to 3.9x | 82 (7.5%) | 534 (29.1%) |
| 4.0x or more | 143 (13.1%) | 147 (8.0%) |
| Total | 1,093 (100.0%) | 1,834 (100.0%) |
Real Estate Taxes by Mortgage Status in St Andrews
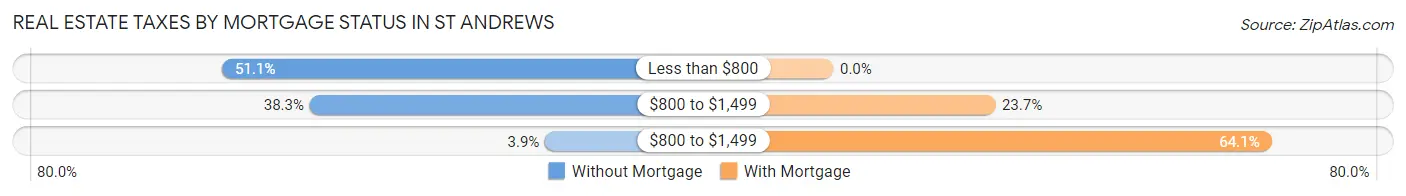
| Property Taxes | Without Mortgage | With Mortgage |
| Less than $800 | 559 (51.1%) | 0 (0.0%) |
| $800 to $1,499 | 419 (38.3%) | 434 (23.7%) |
| $800 to $1,499 | 43 (3.9%) | 1,175 (64.1%) |
| Total | 1,093 (100.0%) | 1,834 (100.0%) |
Health & Disability in St Andrews
Health Insurance Coverage by Age in St Andrews
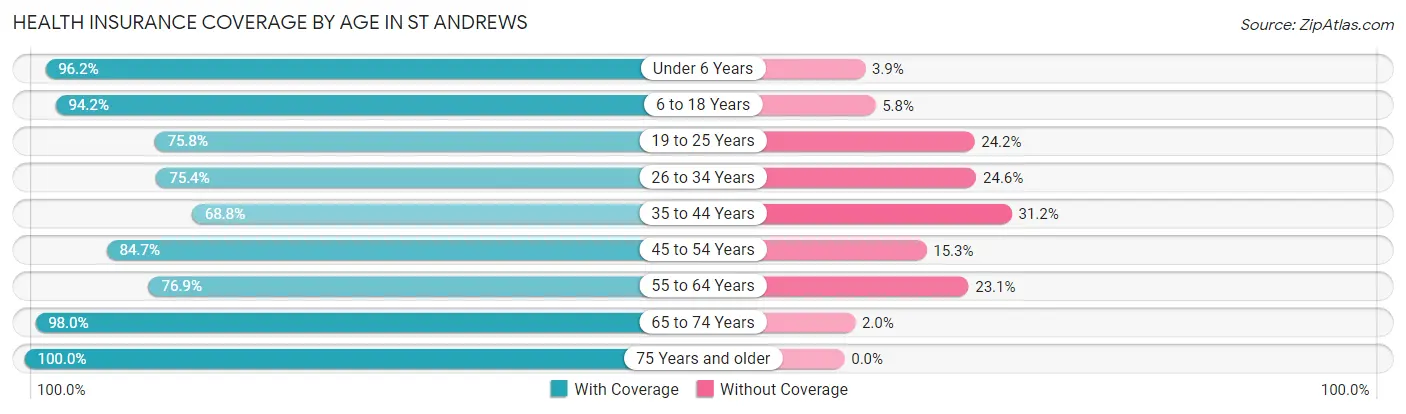
| Age Bracket | With Coverage | Without Coverage |
| Under 6 Years | 1,849 (96.2%) | 74 (3.8%) |
| 6 to 18 Years | 2,811 (94.2%) | 172 (5.8%) |
| 19 to 25 Years | 2,450 (75.8%) | 784 (24.2%) |
| 26 to 34 Years | 2,666 (75.4%) | 869 (24.6%) |
| 35 to 44 Years | 2,021 (68.8%) | 916 (31.2%) |
| 45 to 54 Years | 1,740 (84.7%) | 314 (15.3%) |
| 55 to 64 Years | 1,974 (76.9%) | 594 (23.1%) |
| 65 to 74 Years | 1,773 (98.0%) | 36 (2.0%) |
| 75 Years and older | 803 (100.0%) | 0 (0.0%) |
| Total | 18,087 (82.8%) | 3,759 (17.2%) |
Health Insurance Coverage by Citizenship Status in St Andrews
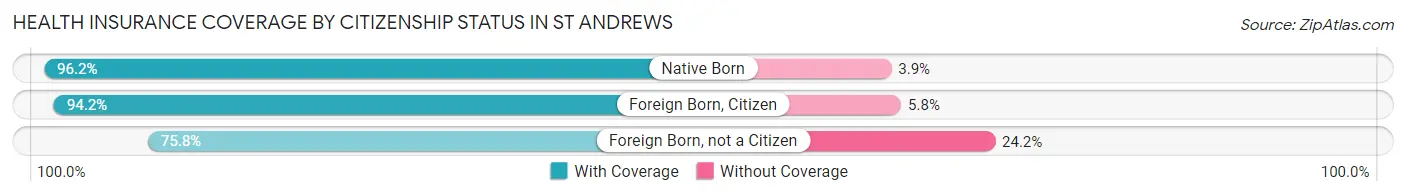
| Citizenship Status | With Coverage | Without Coverage |
| Native Born | 1,849 (96.2%) | 74 (3.8%) |
| Foreign Born, Citizen | 2,811 (94.2%) | 172 (5.8%) |
| Foreign Born, not a Citizen | 2,450 (75.8%) | 784 (24.2%) |
Health Insurance Coverage by Household Income in St Andrews
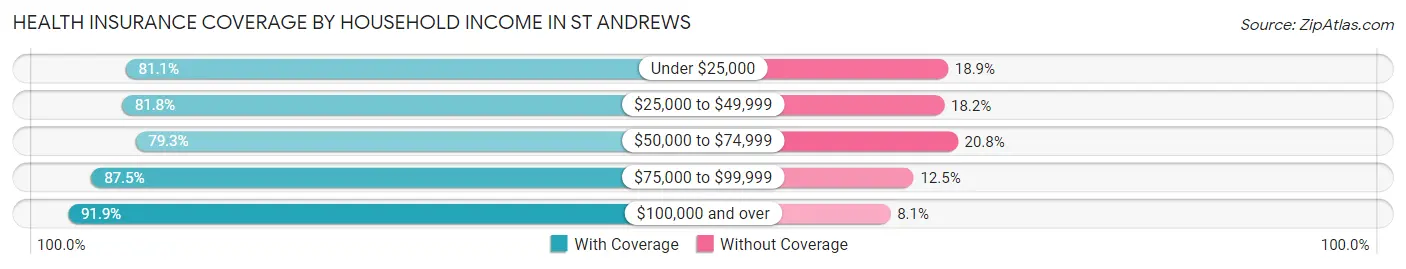
| Household Income | With Coverage | Without Coverage |
| Under $25,000 | 3,708 (81.1%) | 866 (18.9%) |
| $25,000 to $49,999 | 5,702 (81.8%) | 1,270 (18.2%) |
| $50,000 to $74,999 | 4,198 (79.2%) | 1,099 (20.7%) |
| $75,000 to $99,999 | 2,193 (87.5%) | 313 (12.5%) |
| $100,000 and over | 2,193 (91.9%) | 194 (8.1%) |
Public vs Private Health Insurance Coverage by Age in St Andrews
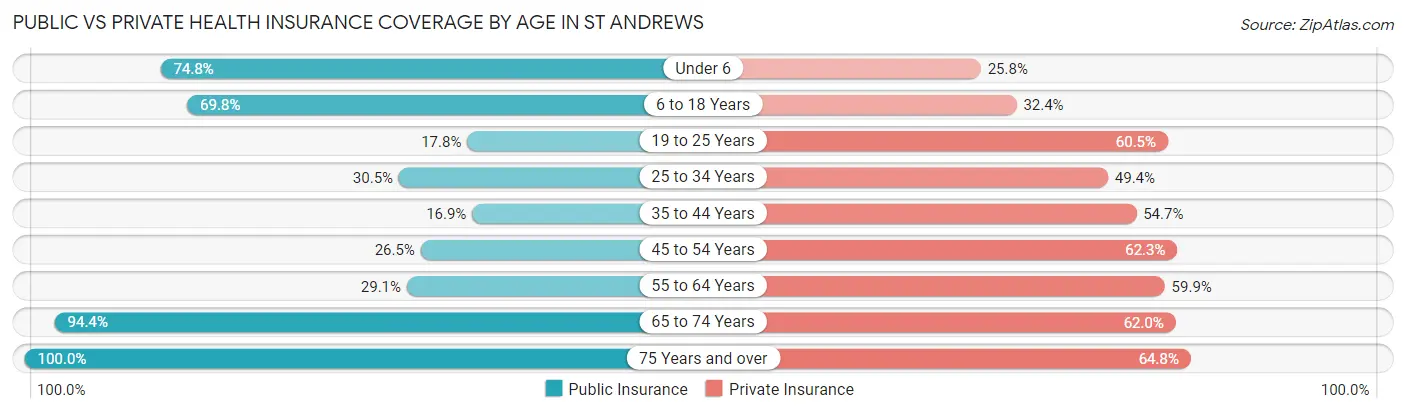
| Age Bracket | Public Insurance | Private Insurance |
| Under 6 | 1,438 (74.8%) | 496 (25.8%) |
| 6 to 18 Years | 2,083 (69.8%) | 967 (32.4%) |
| 19 to 25 Years | 577 (17.8%) | 1,957 (60.5%) |
| 25 to 34 Years | 1,079 (30.5%) | 1,746 (49.4%) |
| 35 to 44 Years | 497 (16.9%) | 1,605 (54.6%) |
| 45 to 54 Years | 544 (26.5%) | 1,279 (62.3%) |
| 55 to 64 Years | 746 (29.0%) | 1,539 (59.9%) |
| 65 to 74 Years | 1,708 (94.4%) | 1,121 (62.0%) |
| 75 Years and over | 803 (100.0%) | 520 (64.8%) |
| Total | 9,475 (43.4%) | 11,230 (51.4%) |
Disability Status by Sex by Age in St Andrews
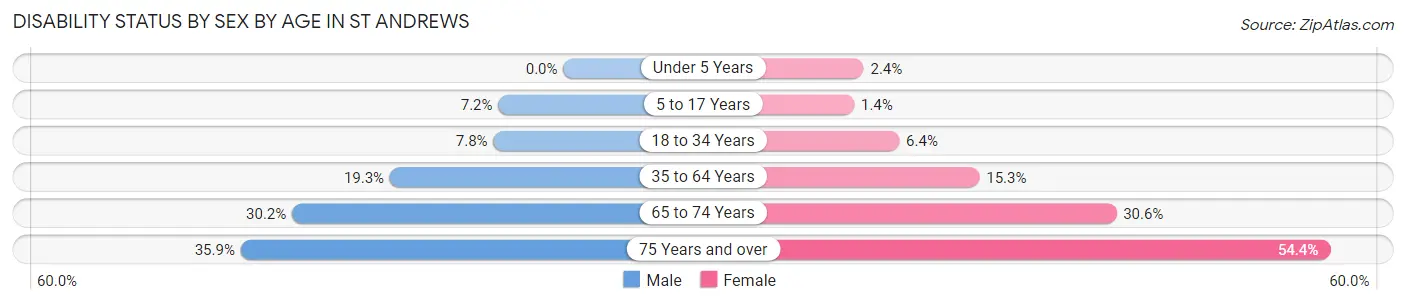
| Age Bracket | Male | Female |
| Under 5 Years | 0 (0.0%) | 19 (2.4%) |
| 5 to 17 Years | 135 (7.2%) | 17 (1.4%) |
| 18 to 34 Years | 226 (7.8%) | 251 (6.4%) |
| 35 to 64 Years | 646 (19.3%) | 645 (15.3%) |
| 65 to 74 Years | 245 (30.2%) | 305 (30.6%) |
| 75 Years and over | 83 (35.9%) | 311 (54.4%) |
Disability Class by Sex by Age in St Andrews
Disability Class: Hearing Difficulty
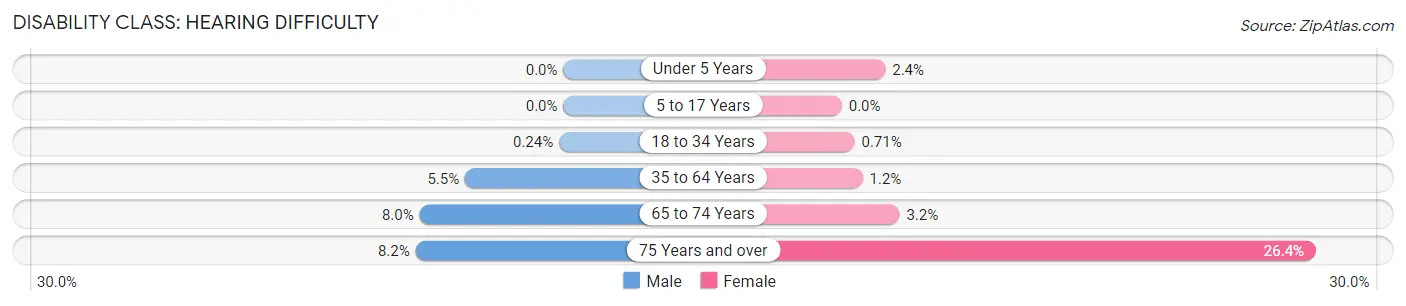
| Age Bracket | Male | Female |
| Under 5 Years | 0 (0.0%) | 19 (2.4%) |
| 5 to 17 Years | 0 (0.0%) | 0 (0.0%) |
| 18 to 34 Years | 7 (0.2%) | 28 (0.7%) |
| 35 to 64 Years | 183 (5.5%) | 49 (1.2%) |
| 65 to 74 Years | 65 (8.0%) | 32 (3.2%) |
| 75 Years and over | 19 (8.2%) | 151 (26.4%) |
Disability Class: Vision Difficulty
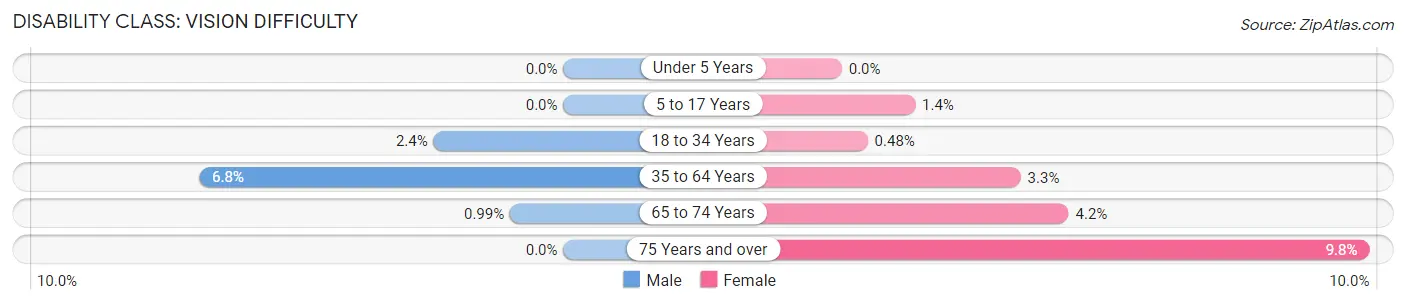
| Age Bracket | Male | Female |
| Under 5 Years | 0 (0.0%) | 0 (0.0%) |
| 5 to 17 Years | 0 (0.0%) | 17 (1.4%) |
| 18 to 34 Years | 70 (2.4%) | 19 (0.5%) |
| 35 to 64 Years | 226 (6.8%) | 140 (3.3%) |
| 65 to 74 Years | 8 (1.0%) | 42 (4.2%) |
| 75 Years and over | 0 (0.0%) | 56 (9.8%) |
Disability Class: Cognitive Difficulty
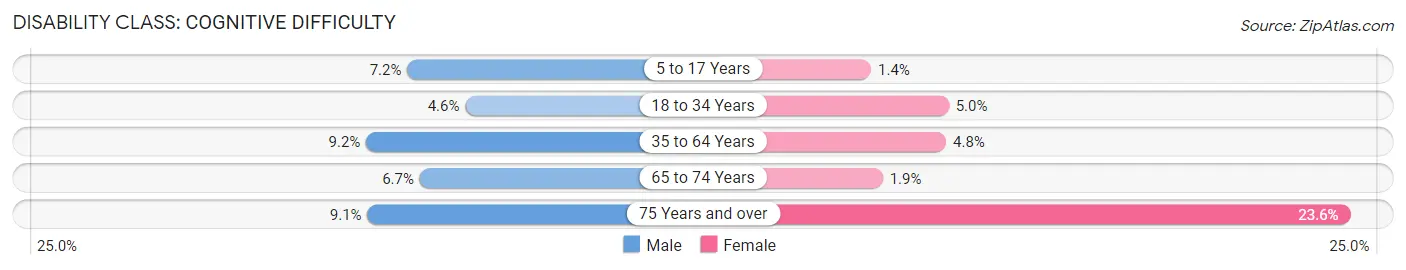
| Age Bracket | Male | Female |
| 5 to 17 Years | 135 (7.2%) | 17 (1.4%) |
| 18 to 34 Years | 132 (4.5%) | 195 (5.0%) |
| 35 to 64 Years | 306 (9.1%) | 204 (4.8%) |
| 65 to 74 Years | 54 (6.7%) | 19 (1.9%) |
| 75 Years and over | 21 (9.1%) | 135 (23.6%) |
Disability Class: Ambulatory Difficulty
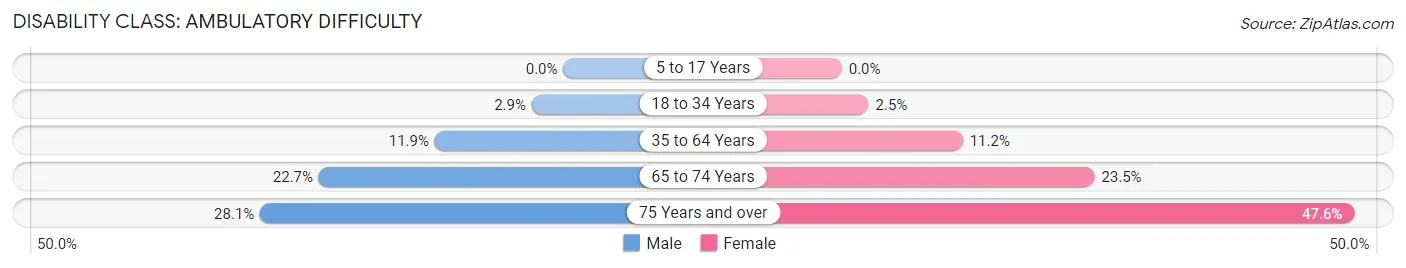
| Age Bracket | Male | Female |
| 5 to 17 Years | 0 (0.0%) | 0 (0.0%) |
| 18 to 34 Years | 85 (2.9%) | 98 (2.5%) |
| 35 to 64 Years | 399 (11.9%) | 473 (11.2%) |
| 65 to 74 Years | 184 (22.7%) | 234 (23.4%) |
| 75 Years and over | 65 (28.1%) | 272 (47.5%) |
Disability Class: Self-Care Difficulty
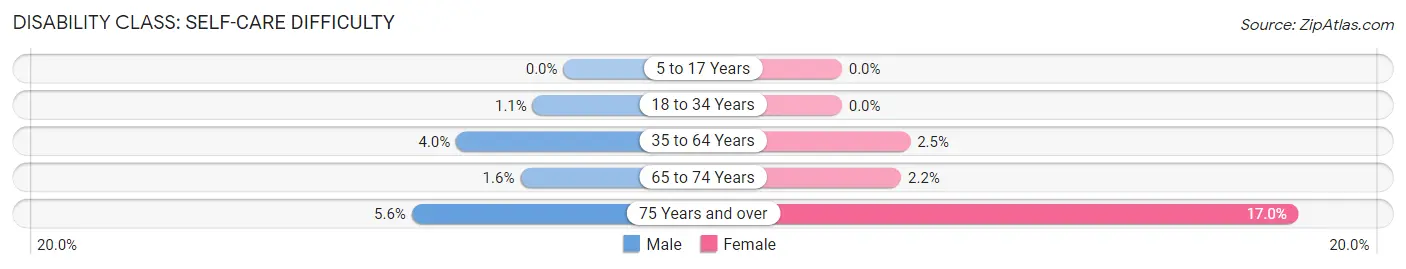
| Age Bracket | Male | Female |
| 5 to 17 Years | 0 (0.0%) | 0 (0.0%) |
| 18 to 34 Years | 33 (1.1%) | 0 (0.0%) |
| 35 to 64 Years | 133 (4.0%) | 107 (2.5%) |
| 65 to 74 Years | 13 (1.6%) | 22 (2.2%) |
| 75 Years and over | 13 (5.6%) | 97 (17.0%) |
Technology Access in St Andrews
Computing Device Access in St Andrews
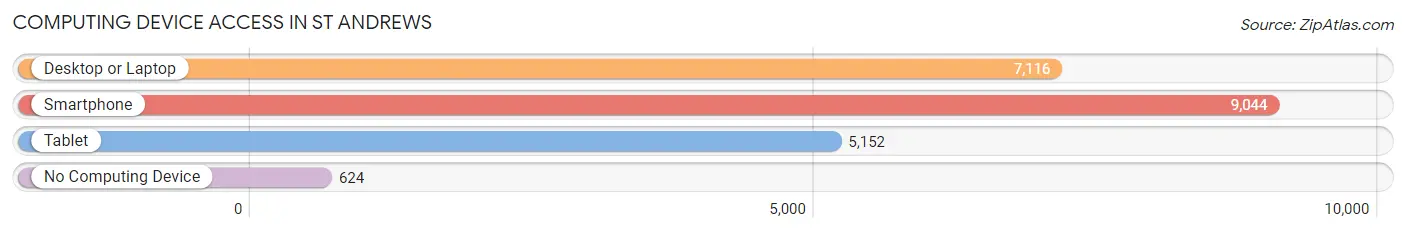
| Device Type | # Households | % Households |
| Desktop or Laptop | 7,116 | 69.8% |
| Smartphone | 9,044 | 88.7% |
| Tablet | 5,152 | 50.5% |
| No Computing Device | 624 | 6.1% |
| Total | 10,195 | 100.0% |
Internet Access in St Andrews
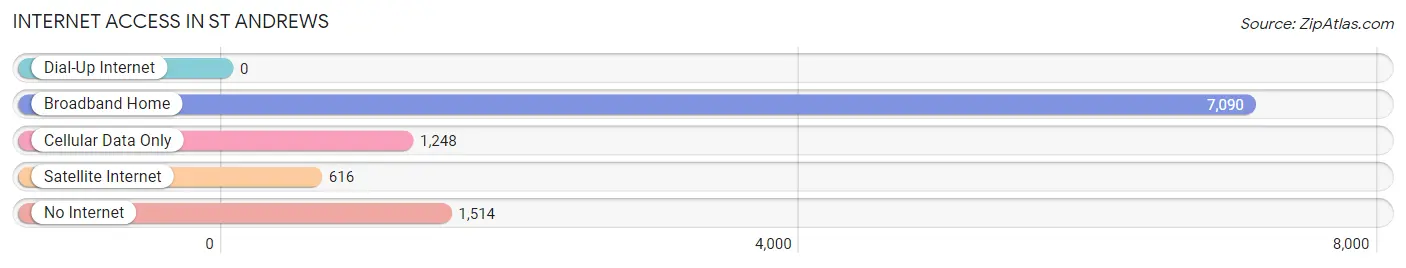
| Internet Type | # Households | % Households |
| Dial-Up Internet | 0 | 0.0% |
| Broadband Home | 7,090 | 69.5% |
| Cellular Data Only | 1,248 | 12.2% |
| Satellite Internet | 616 | 6.0% |
| No Internet | 1,514 | 14.8% |
| Total | 10,195 | 100.0% |
St Andrews Summary
St Andrews is a small town located in the state of South Carolina, United States. It is situated in the northeastern part of the state, in the county of Georgetown. The town has a population of approximately 1,500 people, and is part of the Myrtle Beach metropolitan area.
History
St Andrews was founded in 1732 by a group of settlers from Scotland. The town was named after the town of St Andrews in Scotland, and was originally part of the Prince George Parish. The town was incorporated in 1737, and was the first town in the state to be incorporated.
The town was an important port during the colonial period, and was a major trading center for the region. The town was also a major center for the production of rice, which was exported to other parts of the country.
During the American Revolution, St Andrews was a major port for the British forces. The town was also the site of a major battle between the British and American forces in 1776.
Geography
St Andrews is located in the northeastern part of South Carolina, in the county of Georgetown. The town is situated on the banks of the Waccamaw River, and is surrounded by the Francis Marion National Forest. The town is located approximately 25 miles north of Myrtle Beach, and is part of the Myrtle Beach metropolitan area.
The town has a total area of 1.2 square miles, all of which is land. The town has a humid subtropical climate, with hot, humid summers and mild winters.
Economy
The economy of St Andrews is largely based on tourism and agriculture. The town is home to several tourist attractions, including the Waccamaw River, the Francis Marion National Forest, and the historic downtown area. The town is also home to several farms, which produce a variety of crops, including corn, soybeans, and cotton.
Demographics
As of the 2010 census, St Andrews had a population of 1,500 people. The racial makeup of the town was 94.7% White, 2.7% African American, 0.3% Native American, 0.7% Asian, and 1.7% from other races. The median household income was $37,500, and the median family income was $45,000.
The town is served by the Georgetown County School District, which includes two elementary schools, one middle school, and one high school. The town is also home to several churches, including the St Andrews Presbyterian Church, the St Andrews Methodist Church, and the St Andrews Baptist Church.
Common Questions
What is Per Capita Income in St Andrews?
Per Capita income in St Andrews is $24,471.
What is the Median Family Income in St Andrews?
Median Family Income in St Andrews is $47,626.
What is the Median Household income in St Andrews?
Median Household Income in St Andrews is $43,273.
What is Income or Wage Gap in St Andrews?
Income or Wage Gap in St Andrews is 10.8%.
Women in St Andrews earn 89.2 cents for every dollar earned by a man.
What is Inequality or Gini Index in St Andrews?
Inequality or Gini Index in St Andrews is 0.39.
What is the Total Population of St Andrews?
Total Population of St Andrews is 21,909.
What is the Total Male Population of St Andrews?
Total Male Population of St Andrews is 10,137.
What is the Total Female Population of St Andrews?
Total Female Population of St Andrews is 11,772.
What is the Ratio of Males per 100 Females in St Andrews?
There are 86.11 Males per 100 Females in St Andrews.
What is the Ratio of Females per 100 Males in St Andrews?
There are 116.13 Females per 100 Males in St Andrews.
What is the Median Population Age in St Andrews?
Median Population Age in St Andrews is 32.4 Years.
What is the Average Family Size in St Andrews
Average Family Size in St Andrews is 3.0 People.
What is the Average Household Size in St Andrews
Average Household Size in St Andrews is 2.1 People.
How Large is the Labor Force in St Andrews?
There are 11,890 People in the Labor Forcein in St Andrews.
What is the Percentage of People in the Labor Force in St Andrews?
68.0% of People are in the Labor Force in St Andrews.
What is the Unemployment Rate in St Andrews?
Unemployment Rate in St Andrews is 8.7%.