Awendaw, SC Map & Demographics
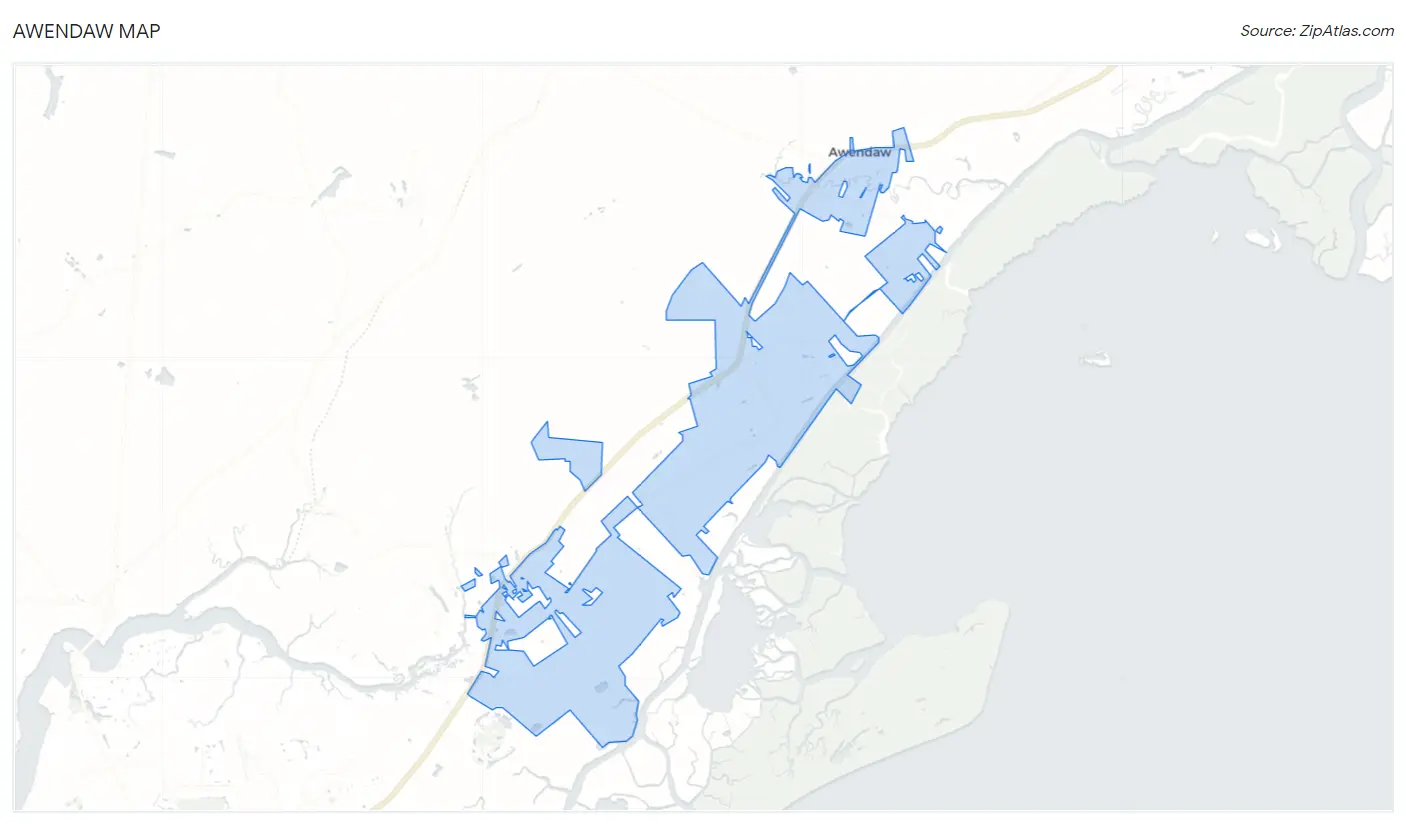
Awendaw Map
Awendaw Overview
$40,491
PER CAPITA INCOME
$72,100
AVG FAMILY INCOME
$63,533
AVG HOUSEHOLD INCOME
7.5%
WAGE / INCOME GAP [ % ]
92.5¢/ $1
WAGE / INCOME GAP [ $ ]
0.52
INEQUALITY / GINI INDEX
1,548
TOTAL POPULATION
814
MALE POPULATION
734
FEMALE POPULATION
110.90
MALES / 100 FEMALES
90.17
FEMALES / 100 MALES
57.8
MEDIAN AGE
2.7
AVG FAMILY SIZE
2.1
AVG HOUSEHOLD SIZE
749
LABOR FORCE [ PEOPLE ]
52.5%
PERCENT IN LABOR FORCE
12.6%
UNEMPLOYMENT RATE
Awendaw Zip Codes
Awendaw Area Codes
Income in Awendaw
Income Overview in Awendaw
Per Capita Income in Awendaw is $40,491, while median incomes of families and households are $72,100 and $63,533 respectively.
| Characteristic | Number | Measure |
| Per Capita Income | 1,548 | $40,491 |
| Median Family Income | 464 | $72,100 |
| Mean Family Income | 464 | $109,557 |
| Median Household Income | 721 | $63,533 |
| Mean Household Income | 721 | $84,217 |
| Income Deficit | 464 | $0 |
| Wage / Income Gap (%) | 1,548 | 7.50% |
| Wage / Income Gap ($) | 1,548 | 92.50¢ per $1 |
| Gini / Inequality Index | 1,548 | 0.52 |
Earnings by Sex in Awendaw
Average Earnings in Awendaw are $34,652, $36,607 for men and $33,861 for women, a difference of 7.5%.
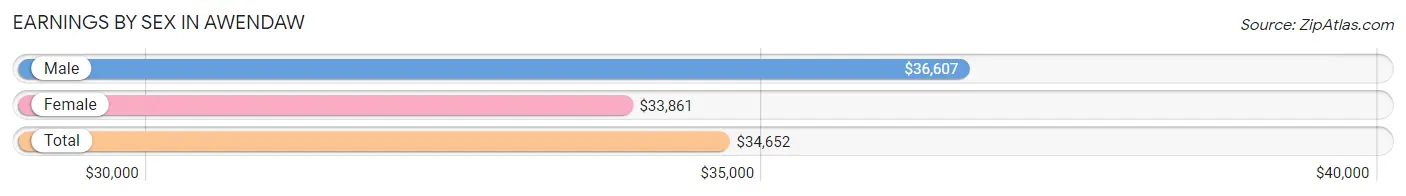
| Sex | Number | Average Earnings |
| Male | 479 (61.4%) | $36,607 |
| Female | 301 (38.6%) | $33,861 |
| Total | 780 (100.0%) | $34,652 |
Earnings by Sex by Income Bracket in Awendaw
The most common earnings brackets in Awendaw are $30,000 to $34,999 for men (97 | 20.3%) and $30,000 to $34,999 for women (65 | 21.6%).
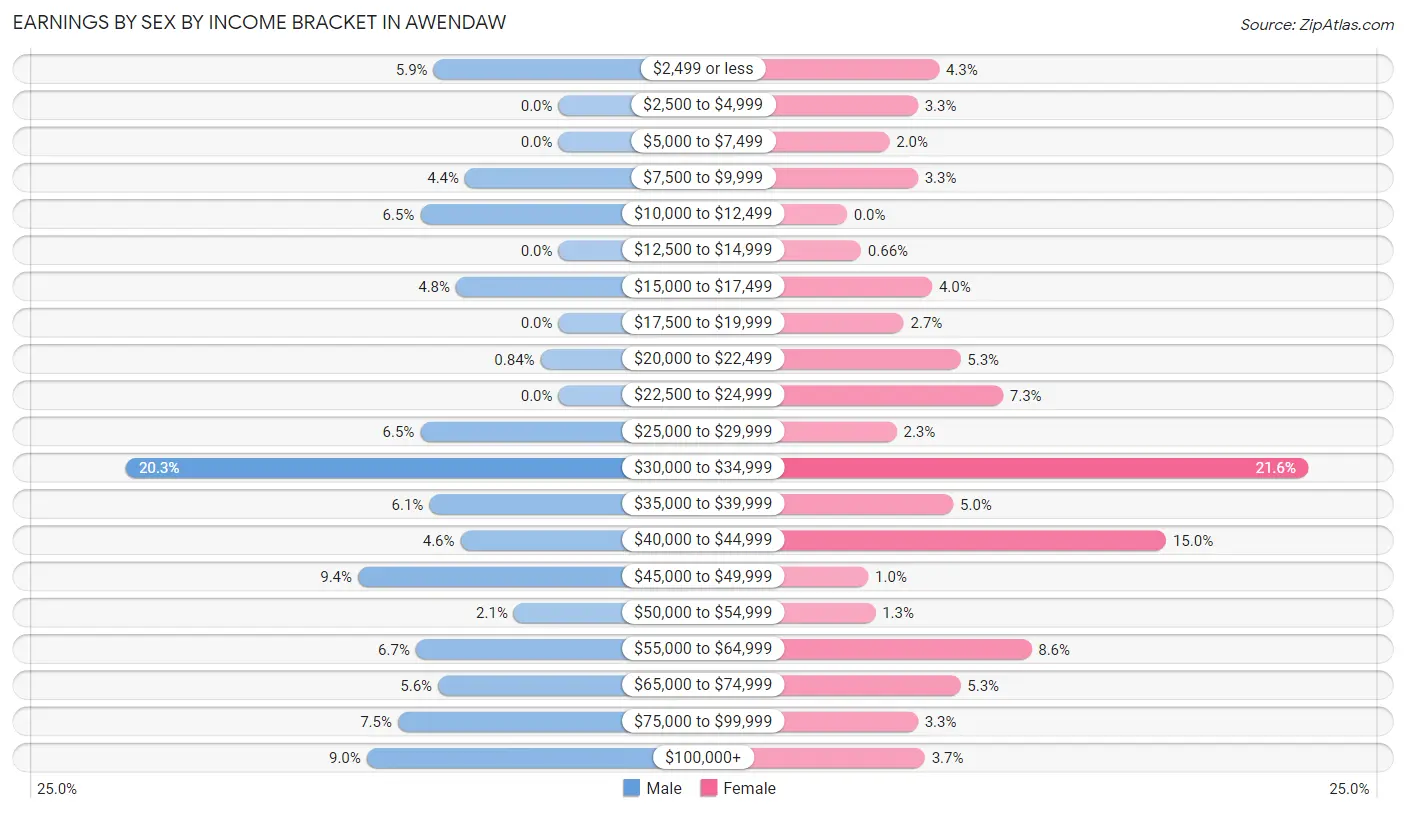
| Income | Male | Female |
| $2,499 or less | 28 (5.9%) | 13 (4.3%) |
| $2,500 to $4,999 | 0 (0.0%) | 10 (3.3%) |
| $5,000 to $7,499 | 0 (0.0%) | 6 (2.0%) |
| $7,500 to $9,999 | 21 (4.4%) | 10 (3.3%) |
| $10,000 to $12,499 | 31 (6.5%) | 0 (0.0%) |
| $12,500 to $14,999 | 0 (0.0%) | 2 (0.7%) |
| $15,000 to $17,499 | 23 (4.8%) | 12 (4.0%) |
| $17,500 to $19,999 | 0 (0.0%) | 8 (2.7%) |
| $20,000 to $22,499 | 4 (0.8%) | 16 (5.3%) |
| $22,500 to $24,999 | 0 (0.0%) | 22 (7.3%) |
| $25,000 to $29,999 | 31 (6.5%) | 7 (2.3%) |
| $30,000 to $34,999 | 97 (20.3%) | 65 (21.6%) |
| $35,000 to $39,999 | 29 (6.0%) | 15 (5.0%) |
| $40,000 to $44,999 | 22 (4.6%) | 45 (14.9%) |
| $45,000 to $49,999 | 45 (9.4%) | 3 (1.0%) |
| $50,000 to $54,999 | 10 (2.1%) | 4 (1.3%) |
| $55,000 to $64,999 | 32 (6.7%) | 26 (8.6%) |
| $65,000 to $74,999 | 27 (5.6%) | 16 (5.3%) |
| $75,000 to $99,999 | 36 (7.5%) | 10 (3.3%) |
| $100,000+ | 43 (9.0%) | 11 (3.6%) |
| Total | 479 (100.0%) | 301 (100.0%) |
Earnings by Sex by Educational Attainment in Awendaw
Average earnings in Awendaw are $40,398 for men and $33,750 for women, a difference of 16.5%. Men with an educational attainment of high school diploma enjoy the highest average annual earnings of $47,059, while those with college or associate's degree education earn the least with $29,904. Women with an educational attainment of bachelor's degree earn the most with the average annual earnings of $43,438, while those with high school diploma education have the smallest earnings of $21,705.
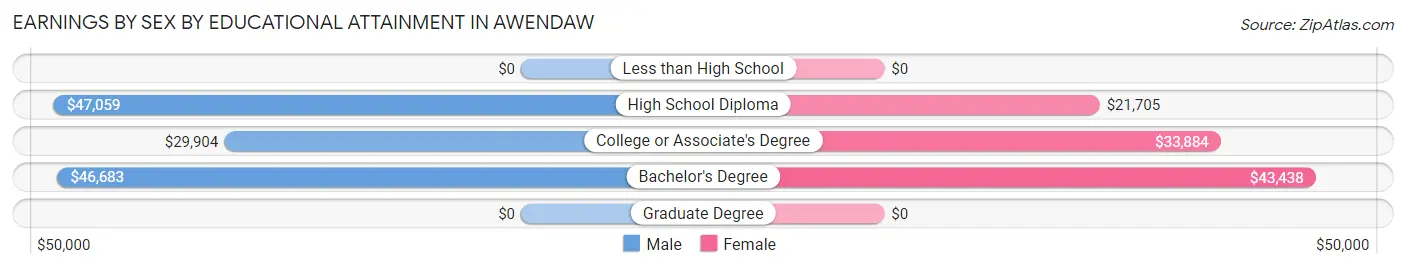
| Educational Attainment | Male Income | Female Income |
| Less than High School | - | - |
| High School Diploma | $47,059 | $21,705 |
| College or Associate's Degree | $29,904 | $33,884 |
| Bachelor's Degree | $46,683 | $43,438 |
| Graduate Degree | - | - |
| Total | $40,398 | $33,750 |
Family Income in Awendaw
Family Income Brackets in Awendaw
According to the Awendaw family income data, there are 143 families falling into the $50,000 to $74,999 income range, which is the most common income bracket and makes up 30.8% of all families. Conversely, the less than $10,000 income bracket is the least frequent group with only 3 families (0.6%) belonging to this category.
| Income Bracket | # Families | % Families |
| Less than $10,000 | 3 | 0.6% |
| $10,000 to $14,999 | 61 | 13.1% |
| $15,000 to $24,999 | 16 | 3.4% |
| $25,000 to $34,999 | 13 | 2.8% |
| $35,000 to $49,999 | 12 | 2.6% |
| $50,000 to $74,999 | 143 | 30.8% |
| $75,000 to $99,999 | 32 | 6.9% |
| $100,000 to $149,999 | 110 | 23.7% |
| $150,000 to $199,999 | 25 | 5.4% |
| $200,000+ | 49 | 10.6% |
Family Income by Famaliy Size in Awendaw
5-person families (23 | 5.0%) account for the highest median family income in Awendaw with $119,191 per family, while 2-person families (327 | 70.5%) have the highest median income of $35,810 per family member.
| Income Bracket | # Families | Median Income |
| 2-Person Families | 327 (70.5%) | $71,621 |
| 3-Person Families | 84 (18.1%) | $70,455 |
| 4-Person Families | 30 (6.5%) | $118,750 |
| 5-Person Families | 23 (5.0%) | $119,191 |
| 6-Person Families | 0 (0.0%) | $0 |
| 7+ Person Families | 0 (0.0%) | $0 |
| Total | 464 (100.0%) | $72,100 |
Family Income by Number of Earners in Awendaw
| Number of Earners | # Families | Median Income |
| No Earners | 127 (27.4%) | $0 |
| 1 Earner | 169 (36.4%) | $71,794 |
| 2 Earners | 121 (26.1%) | $111,563 |
| 3+ Earners | 47 (10.1%) | $119,650 |
| Total | 464 (100.0%) | $72,100 |
Household Income in Awendaw
Household Income Brackets in Awendaw
With 166 households falling in the category, the $50,000 to $74,999 income range is the most frequent in Awendaw, accounting for 23.0% of all households. In contrast, only 25 households (3.5%) fall into the less than $10,000 income bracket, making it the least populous group.
| Income Bracket | # Households | % Households |
| Less than $10,000 | 25 | 3.5% |
| $10,000 to $14,999 | 119 | 16.5% |
| $15,000 to $24,999 | 80 | 11.1% |
| $25,000 to $34,999 | 52 | 7.2% |
| $35,000 to $49,999 | 26 | 3.6% |
| $50,000 to $74,999 | 166 | 23.0% |
| $75,000 to $99,999 | 48 | 6.7% |
| $100,000 to $149,999 | 127 | 17.6% |
| $150,000 to $199,999 | 25 | 3.5% |
| $200,000+ | 53 | 7.4% |
Household Income by Householder Age in Awendaw
The median household income in Awendaw is $63,533, with the highest median household income of $117,969 found in the 25 to 44 years age bracket for the primary householder. A total of 73 households (10.1%) fall into this category. Meanwhile, the 15 to 24 years age bracket for the primary householder has the lowest median household income of $0, with 11 households (1.5%) in this group.
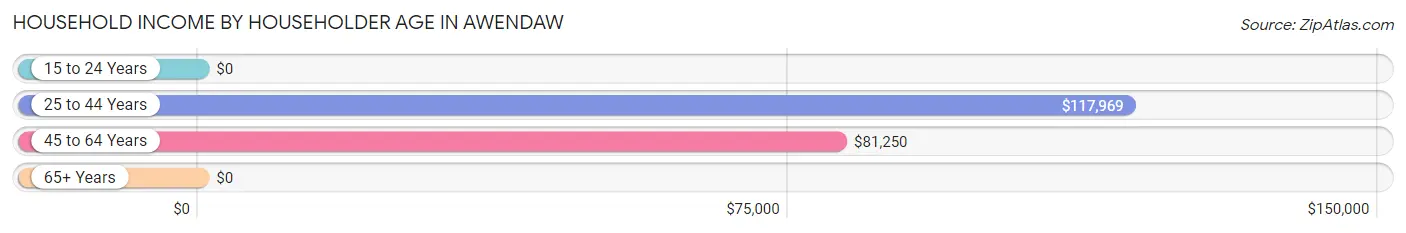
| Income Bracket | # Households | Median Income |
| 15 to 24 Years | 11 (1.5%) | $0 |
| 25 to 44 Years | 73 (10.1%) | $117,969 |
| 45 to 64 Years | 288 (39.9%) | $81,250 |
| 65+ Years | 349 (48.4%) | $0 |
| Total | 721 (100.0%) | $63,533 |
Poverty in Awendaw
Income Below Poverty by Sex and Age in Awendaw
With 15.0% poverty level for males and 16.9% for females among the residents of Awendaw, 65 to 74 year old males and 75 year old and over females are the most vulnerable to poverty, with 71 males (53.4%) and 39 females (35.8%) in their respective age groups living below the poverty level.
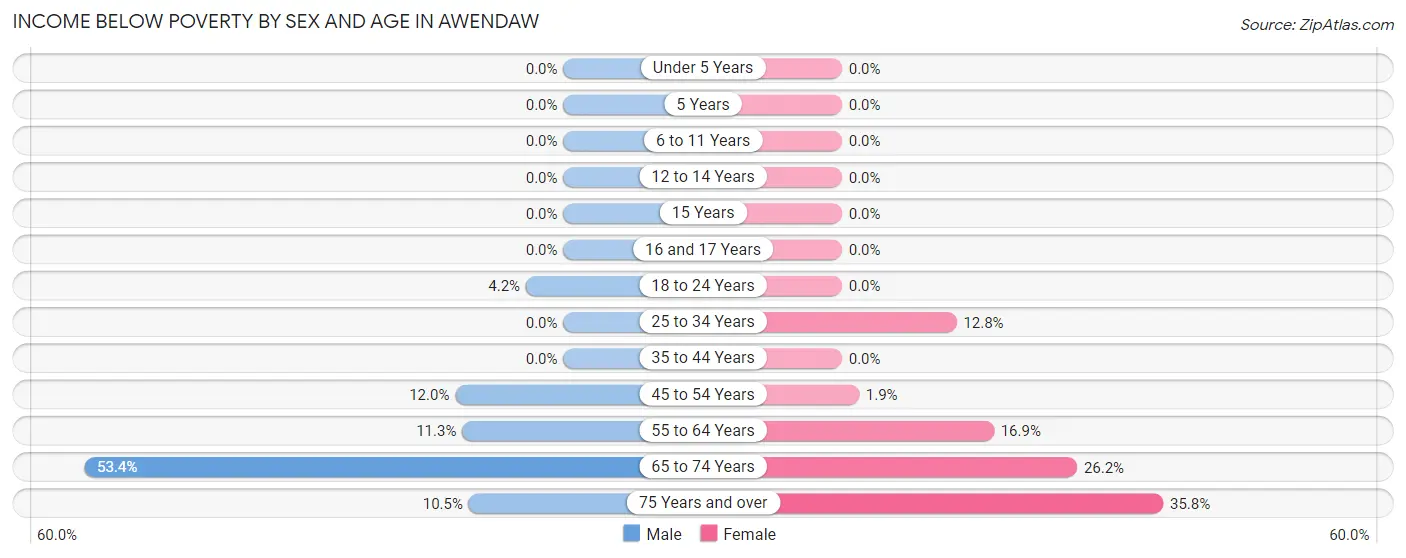
| Age Bracket | Male | Female |
| Under 5 Years | 0 (0.0%) | 0 (0.0%) |
| 5 Years | 0 (0.0%) | 0 (0.0%) |
| 6 to 11 Years | 0 (0.0%) | 0 (0.0%) |
| 12 to 14 Years | 0 (0.0%) | 0 (0.0%) |
| 15 Years | 0 (0.0%) | 0 (0.0%) |
| 16 and 17 Years | 0 (0.0%) | 0 (0.0%) |
| 18 to 24 Years | 3 (4.2%) | 0 (0.0%) |
| 25 to 34 Years | 0 (0.0%) | 6 (12.8%) |
| 35 to 44 Years | 0 (0.0%) | 0 (0.0%) |
| 45 to 54 Years | 23 (12.0%) | 2 (1.9%) |
| 55 to 64 Years | 17 (11.3%) | 22 (16.9%) |
| 65 to 74 Years | 71 (53.4%) | 55 (26.2%) |
| 75 Years and over | 8 (10.5%) | 39 (35.8%) |
| Total | 122 (15.0%) | 124 (16.9%) |
Income Above Poverty by Sex and Age in Awendaw
According to the poverty statistics in Awendaw, males aged under 5 years and females aged under 5 years are the age groups that are most secure financially, with 100.0% of males and 100.0% of females in these age groups living above the poverty line.
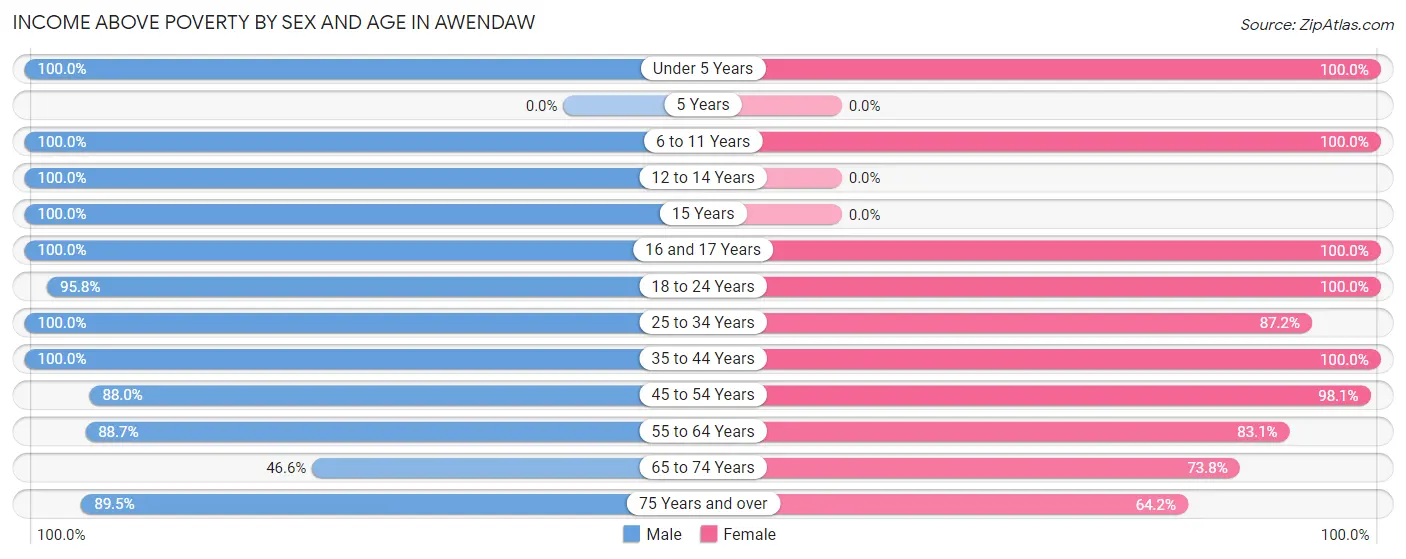
| Age Bracket | Male | Female |
| Under 5 Years | 14 (100.0%) | 30 (100.0%) |
| 5 Years | 0 (0.0%) | 0 (0.0%) |
| 6 to 11 Years | 39 (100.0%) | 13 (100.0%) |
| 12 to 14 Years | 14 (100.0%) | 0 (0.0%) |
| 15 Years | 12 (100.0%) | 0 (0.0%) |
| 16 and 17 Years | 17 (100.0%) | 7 (100.0%) |
| 18 to 24 Years | 69 (95.8%) | 41 (100.0%) |
| 25 to 34 Years | 56 (100.0%) | 41 (87.2%) |
| 35 to 44 Years | 39 (100.0%) | 42 (100.0%) |
| 45 to 54 Years | 168 (88.0%) | 103 (98.1%) |
| 55 to 64 Years | 134 (88.7%) | 108 (83.1%) |
| 65 to 74 Years | 62 (46.6%) | 155 (73.8%) |
| 75 Years and over | 68 (89.5%) | 70 (64.2%) |
| Total | 692 (85.0%) | 610 (83.1%) |
Income Below Poverty Among Married-Couple Families in Awendaw
The poverty statistics for married-couple families in Awendaw show that 18.2% or 61 of the total 335 families live below the poverty line. Families with no children have the highest poverty rate of 22.9%, comprising of 61 families. On the other hand, families with 1 or 2 children have the lowest poverty rate of 0.0%, which includes 0 families.
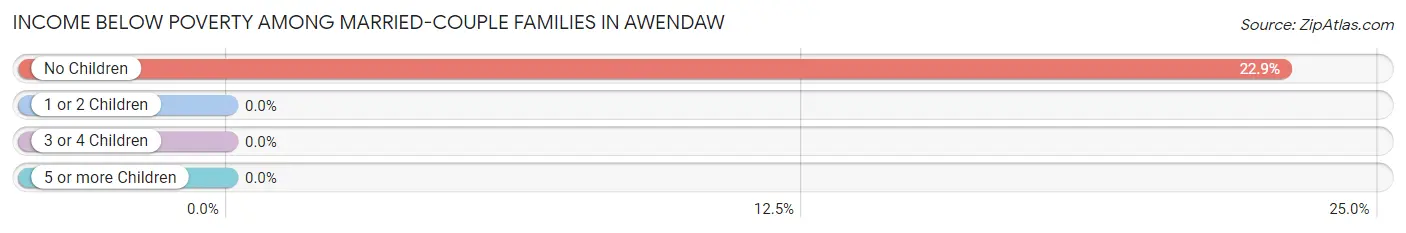
| Children | Above Poverty | Below Poverty |
| No Children | 205 (77.1%) | 61 (22.9%) |
| 1 or 2 Children | 66 (100.0%) | 0 (0.0%) |
| 3 or 4 Children | 3 (100.0%) | 0 (0.0%) |
| 5 or more Children | 0 (0.0%) | 0 (0.0%) |
| Total | 274 (81.8%) | 61 (18.2%) |
Income Below Poverty Among Single-Parent Households in Awendaw
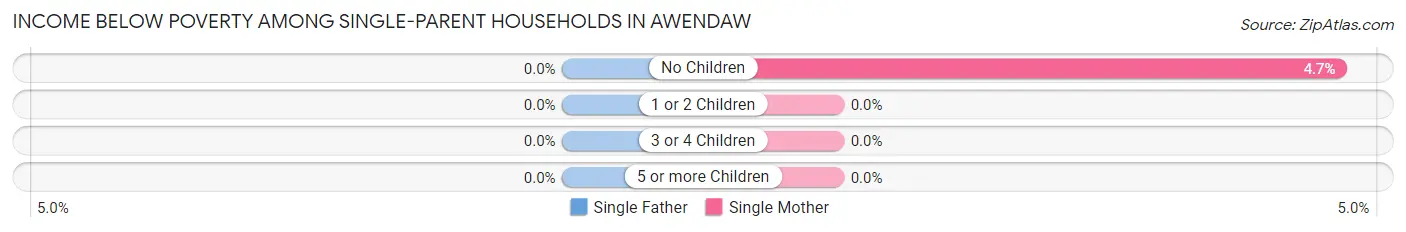
| Children | Single Father | Single Mother |
| No Children | 0 (0.0%) | 3 (4.7%) |
| 1 or 2 Children | 0 (0.0%) | 0 (0.0%) |
| 3 or 4 Children | 0 (0.0%) | 0 (0.0%) |
| 5 or more Children | 0 (0.0%) | 0 (0.0%) |
| Total | 0 (0.0%) | 3 (3.7%) |
Income Below Poverty Among Married-Couple vs Single-Parent Households in Awendaw
The poverty data for Awendaw shows that 61 of the married-couple family households (18.2%) and 3 of the single-parent households (2.3%) are living below the poverty level. Within the married-couple family households, those with no children have the highest poverty rate, with 61 households (22.9%) falling below the poverty line. Among the single-parent households, those with no children have the highest poverty rate, with 3 household (3.2%) living below poverty.
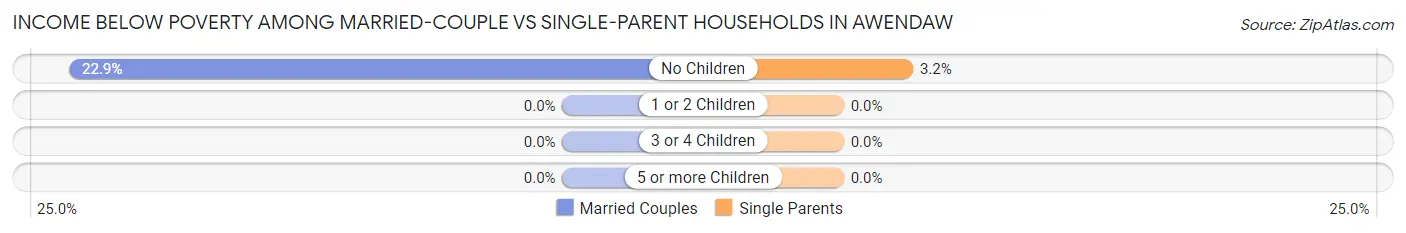
| Children | Married-Couple Families | Single-Parent Households |
| No Children | 61 (22.9%) | 3 (3.2%) |
| 1 or 2 Children | 0 (0.0%) | 0 (0.0%) |
| 3 or 4 Children | 0 (0.0%) | 0 (0.0%) |
| 5 or more Children | 0 (0.0%) | 0 (0.0%) |
| Total | 61 (18.2%) | 3 (2.3%) |
Race in Awendaw
The most populous races in Awendaw are Black / African American (830 | 53.6%), and White / Caucasian (718 | 46.4%).
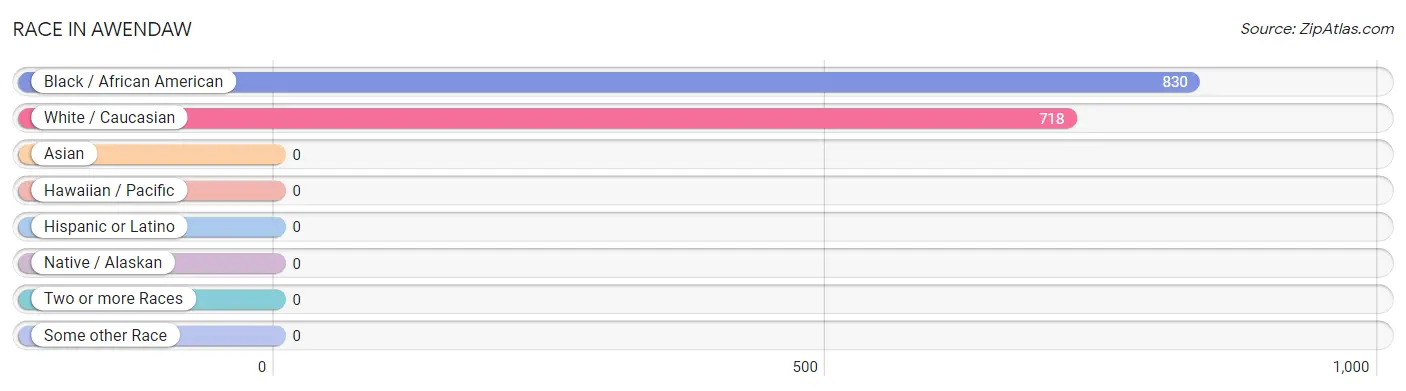
| Race | # Population | % Population |
| Asian | 0 | 0.0% |
| Black / African American | 830 | 53.6% |
| Hawaiian / Pacific | 0 | 0.0% |
| Hispanic or Latino | 0 | 0.0% |
| Native / Alaskan | 0 | 0.0% |
| White / Caucasian | 718 | 46.4% |
| Two or more Races | 0 | 0.0% |
| Some other Race | 0 | 0.0% |
| Total | 1,548 | 100.0% |
Ancestry in Awendaw
The most populous ancestries reported in Awendaw are American (181 | 11.7%), German (102 | 6.6%), Irish (98 | 6.3%), English (78 | 5.0%), and European (35 | 2.3%), together accounting for 31.9% of all Awendaw residents.
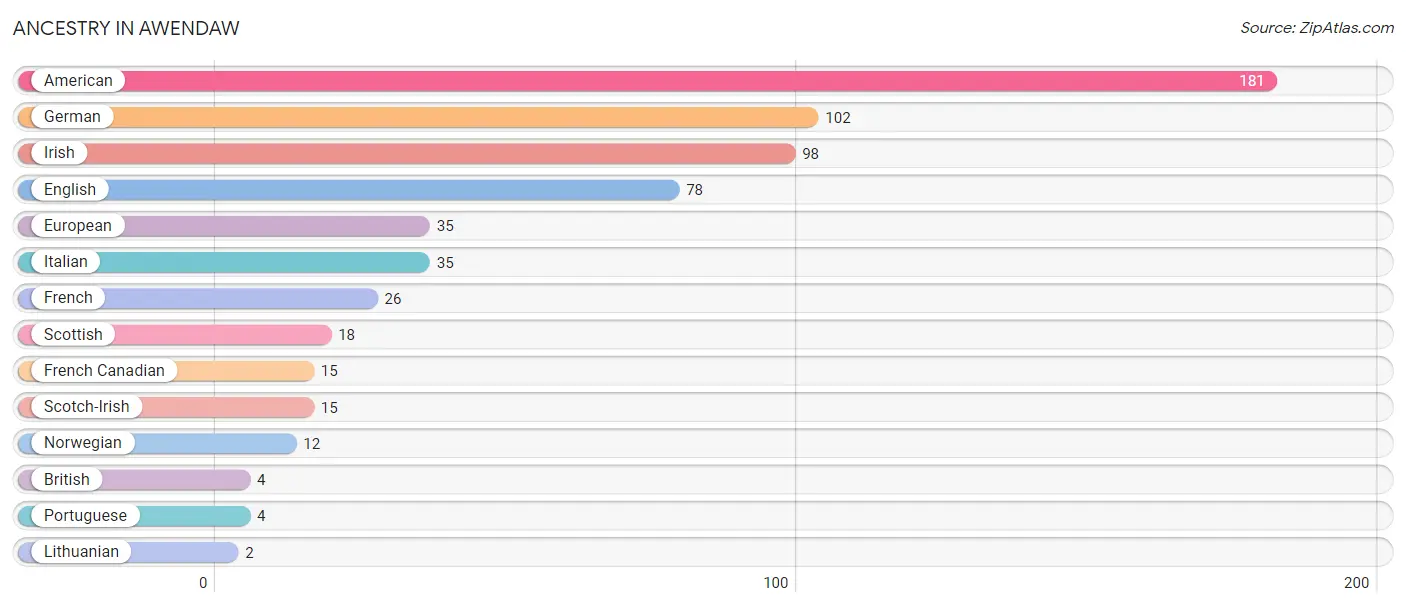
| Ancestry | # Population | % Population |
| American | 181 | 11.7% |
| British | 4 | 0.3% |
| English | 78 | 5.0% |
| European | 35 | 2.3% |
| French | 26 | 1.7% |
| French Canadian | 15 | 1.0% |
| German | 102 | 6.6% |
| Irish | 98 | 6.3% |
| Italian | 35 | 2.3% |
| Lithuanian | 2 | 0.1% |
| Norwegian | 12 | 0.8% |
| Portuguese | 4 | 0.3% |
| Scotch-Irish | 15 | 1.0% |
| Scottish | 18 | 1.2% | View All 14 Rows |
Immigrants in Awendaw
The most numerous immigrant groups reported in Awendaw came from Europe (11 | 0.7%), Germany (6 | 0.4%), Western Europe (6 | 0.4%), England (5 | 0.3%), and Northern Europe (5 | 0.3%), together accounting for 2.1% of all Awendaw residents.
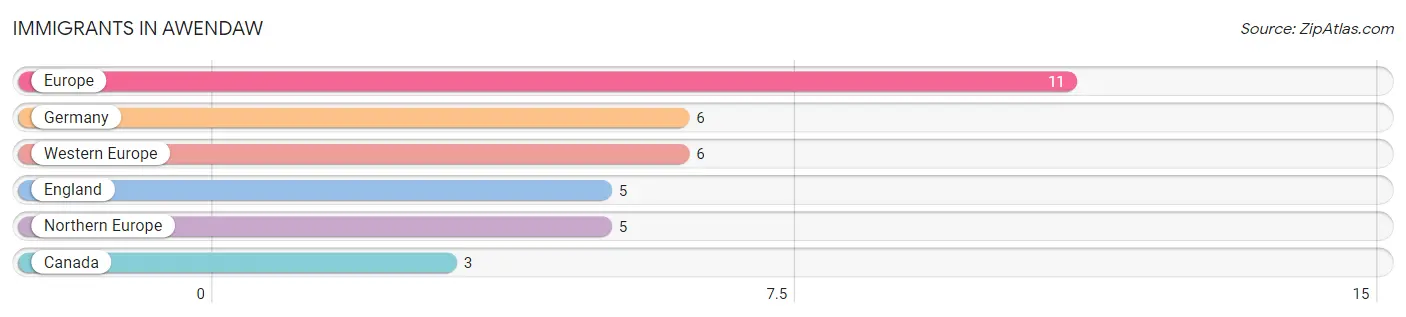
| Immigration Origin | # Population | % Population |
| Canada | 3 | 0.2% |
| England | 5 | 0.3% |
| Europe | 11 | 0.7% |
| Germany | 6 | 0.4% |
| Northern Europe | 5 | 0.3% |
| Western Europe | 6 | 0.4% | View All 6 Rows |
Sex and Age in Awendaw
Sex and Age in Awendaw
The most populous age groups in Awendaw are 50 to 54 Years (140 | 17.2%) for men and 70 to 74 Years (145 | 19.8%) for women.
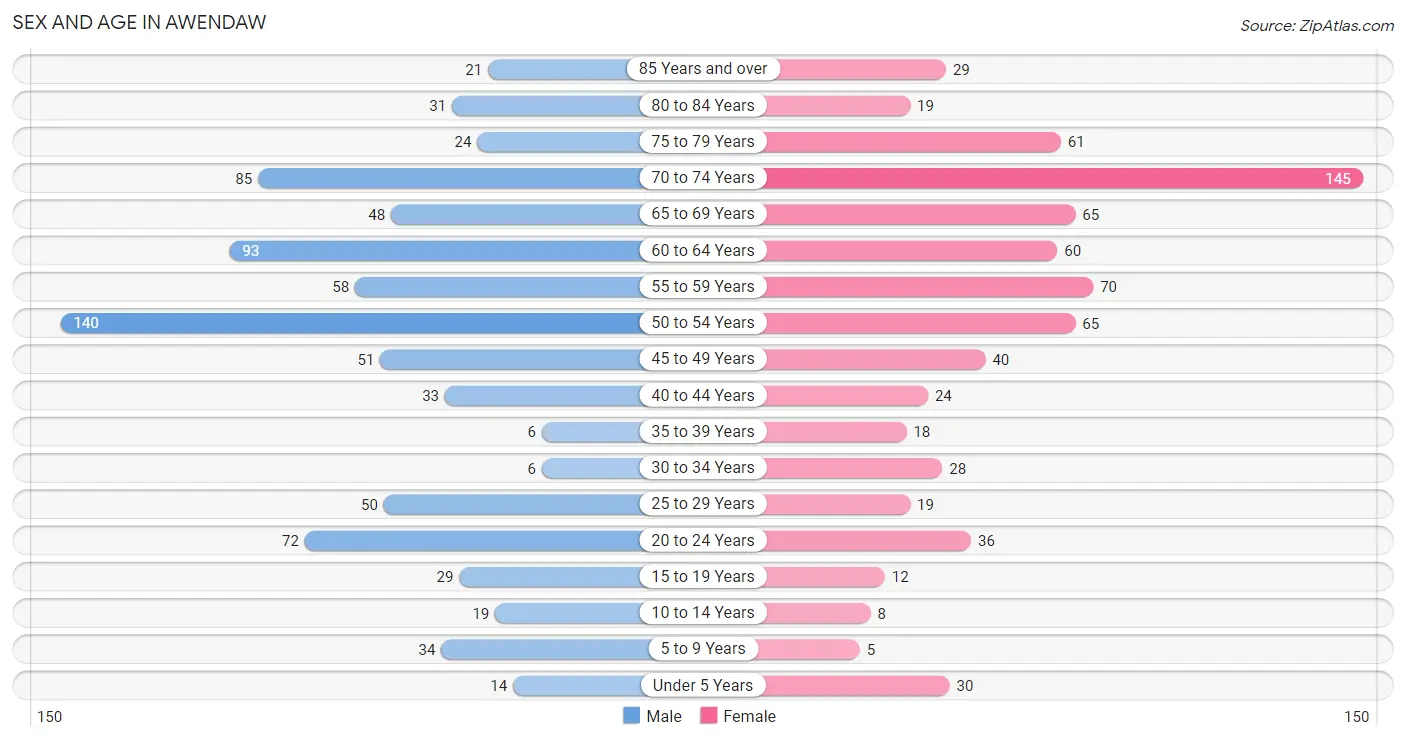
| Age Bracket | Male | Female |
| Under 5 Years | 14 (1.7%) | 30 (4.1%) |
| 5 to 9 Years | 34 (4.2%) | 5 (0.7%) |
| 10 to 14 Years | 19 (2.3%) | 8 (1.1%) |
| 15 to 19 Years | 29 (3.6%) | 12 (1.6%) |
| 20 to 24 Years | 72 (8.8%) | 36 (4.9%) |
| 25 to 29 Years | 50 (6.1%) | 19 (2.6%) |
| 30 to 34 Years | 6 (0.7%) | 28 (3.8%) |
| 35 to 39 Years | 6 (0.7%) | 18 (2.5%) |
| 40 to 44 Years | 33 (4.1%) | 24 (3.3%) |
| 45 to 49 Years | 51 (6.3%) | 40 (5.4%) |
| 50 to 54 Years | 140 (17.2%) | 65 (8.9%) |
| 55 to 59 Years | 58 (7.1%) | 70 (9.5%) |
| 60 to 64 Years | 93 (11.4%) | 60 (8.2%) |
| 65 to 69 Years | 48 (5.9%) | 65 (8.9%) |
| 70 to 74 Years | 85 (10.4%) | 145 (19.8%) |
| 75 to 79 Years | 24 (2.9%) | 61 (8.3%) |
| 80 to 84 Years | 31 (3.8%) | 19 (2.6%) |
| 85 Years and over | 21 (2.6%) | 29 (4.0%) |
| Total | 814 (100.0%) | 734 (100.0%) |
Families and Households in Awendaw
Median Family Size in Awendaw
The median family size in Awendaw is 2.69 persons per family, with single male/father families (47 | 10.1%) accounting for the largest median family size of 3.23 persons per family. On the other hand, single female/mother families (82 | 17.7%) represent the smallest median family size with 2.49 persons per family.
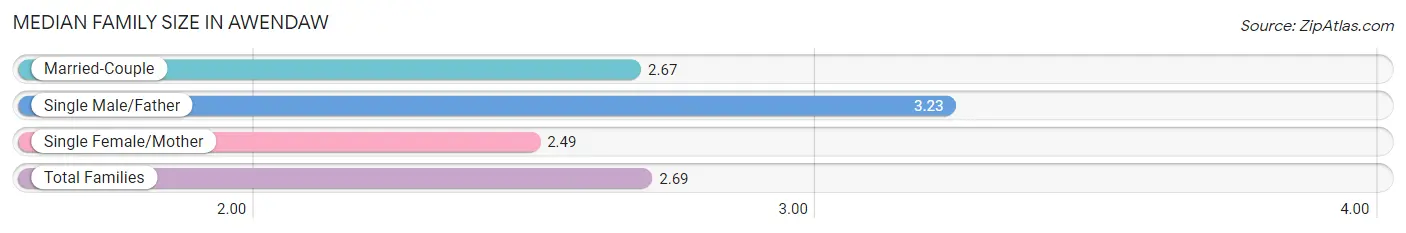
| Family Type | # Families | Family Size |
| Married-Couple | 335 (72.2%) | 2.67 |
| Single Male/Father | 47 (10.1%) | 3.23 |
| Single Female/Mother | 82 (17.7%) | 2.49 |
| Total Families | 464 (100.0%) | 2.69 |
Median Household Size in Awendaw
The median household size in Awendaw is 2.15 persons per household, with single male/father households (47 | 6.5%) accounting for the largest median household size of 3.55 persons per household. non-family households (257 | 35.6%) represent the smallest median household size with 1.11 persons per household.
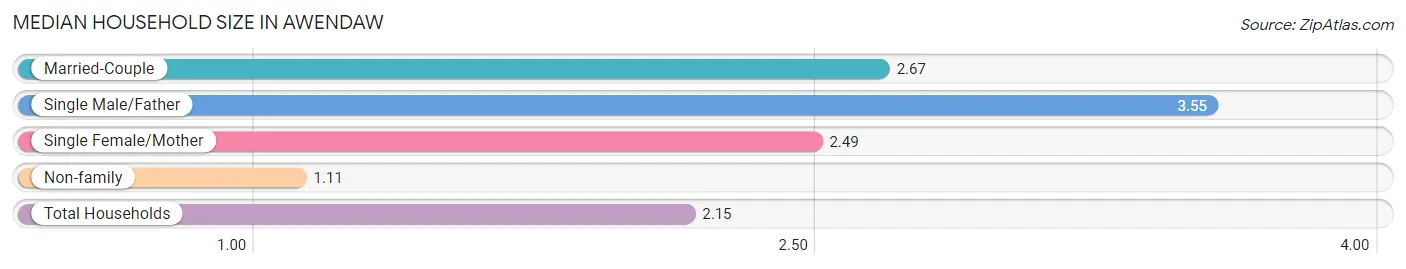
| Household Type | # Households | Household Size |
| Married-Couple | 335 (46.5%) | 2.67 |
| Single Male/Father | 47 (6.5%) | 3.55 |
| Single Female/Mother | 82 (11.4%) | 2.49 |
| Non-family | 257 (35.6%) | 1.11 |
| Total Households | 721 (100.0%) | 2.15 |
Household Size by Marriage Status in Awendaw
Out of a total of 721 households in Awendaw, 464 (64.4%) are family households, while 257 (35.6%) are nonfamily households. The most numerous type of family households are 2-person households, comprising 314, and the most common type of nonfamily households are 1-person households, comprising 228.
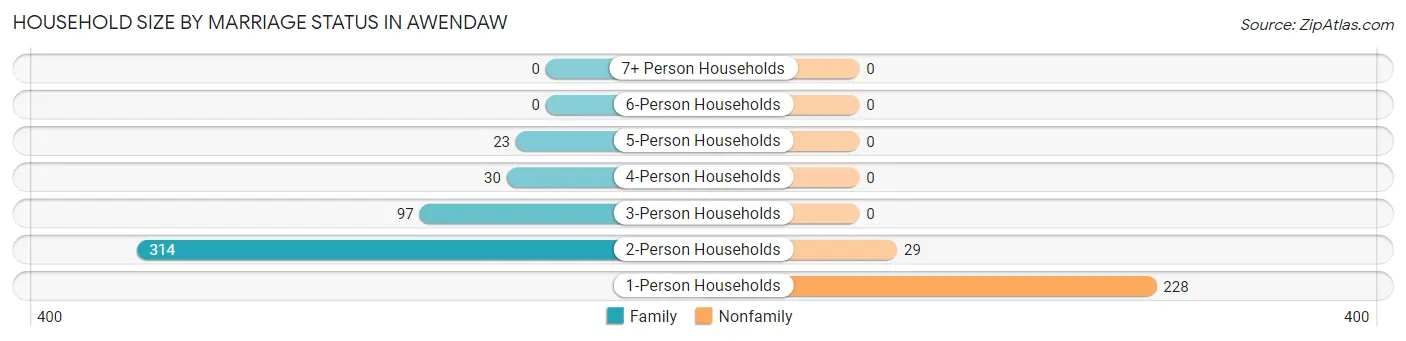
| Household Size | Family Households | Nonfamily Households |
| 1-Person Households | - | 228 (31.6%) |
| 2-Person Households | 314 (43.5%) | 29 (4.0%) |
| 3-Person Households | 97 (13.5%) | 0 (0.0%) |
| 4-Person Households | 30 (4.2%) | 0 (0.0%) |
| 5-Person Households | 23 (3.2%) | 0 (0.0%) |
| 6-Person Households | 0 (0.0%) | 0 (0.0%) |
| 7+ Person Households | 0 (0.0%) | 0 (0.0%) |
| Total | 464 (64.4%) | 257 (35.6%) |
Female Fertility in Awendaw
Fertility by Age in Awendaw
| Age Bracket | Women with Births | Births / 1,000 Women |
| 15 to 19 years | 0 (0.0%) | 0.0 |
| 20 to 34 years | 0 (0.0%) | 0.0 |
| 35 to 50 years | 0 (0.0%) | 0.0 |
| Total | 0 (0.0%) | 0.0 |
Fertility by Age by Marriage Status in Awendaw
| Age Bracket | Married | Unmarried |
| 15 to 19 years | 0 (0.0%) | 0 (0.0%) |
| 20 to 34 years | 0 (0.0%) | 0 (0.0%) |
| 35 to 50 years | 0 (0.0%) | 0 (0.0%) |
| Total | 0 (0.0%) | 0 (0.0%) |
Fertility by Education in Awendaw
| Educational Attainment | Women with Births | Births / 1,000 Women |
| Less than High School | 0 (0.0%) | 0.0 |
| High School Diploma | 0 (0.0%) | 0.0 |
| College or Associate's Degree | 0 (0.0%) | 0.0 |
| Bachelor's Degree | 0 (0.0%) | 0.0 |
| Graduate Degree | 0 (0.0%) | 0.0 |
| Total | 0 (0.0%) | 0.0 |
Fertility by Education by Marriage Status in Awendaw
| Educational Attainment | Married | Unmarried |
| Less than High School | 0 (0.0%) | 0 (0.0%) |
| High School Diploma | 0 (0.0%) | 0 (0.0%) |
| College or Associate's Degree | 0 (0.0%) | 0 (0.0%) |
| Bachelor's Degree | 0 (0.0%) | 0 (0.0%) |
| Graduate Degree | 0 (0.0%) | 0 (0.0%) |
| Total | 0 (0.0%) | 0 (0.0%) |
Employment Characteristics in Awendaw
Employment by Class of Employer in Awendaw
Among the 637 employed individuals in Awendaw, private company employees (399 | 62.6%), self-employed (not incorporated) (78 | 12.2%), and local government employees (59 | 9.3%) make up the most common classes of employment.
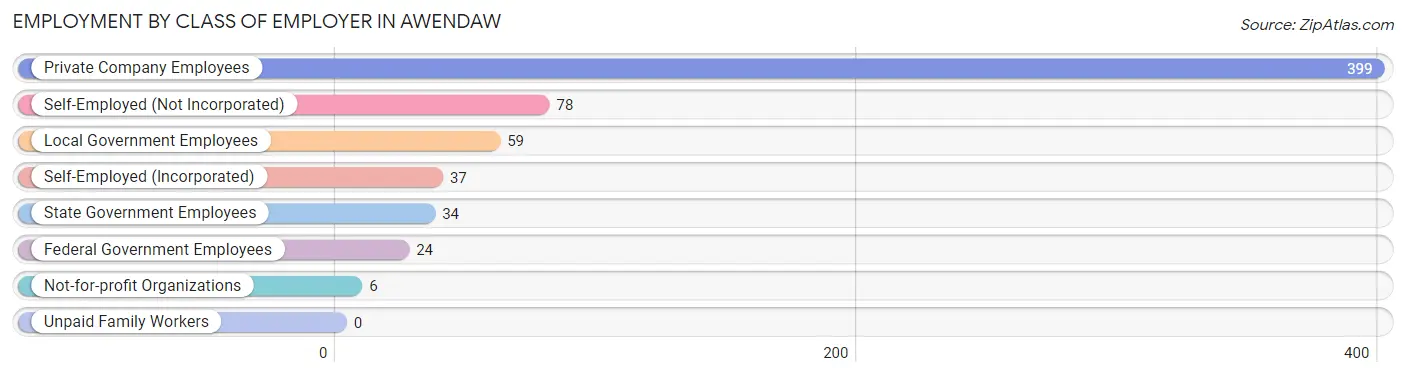
| Employer Class | # Employees | % Employees |
| Private Company Employees | 399 | 62.6% |
| Self-Employed (Incorporated) | 37 | 5.8% |
| Self-Employed (Not Incorporated) | 78 | 12.2% |
| Not-for-profit Organizations | 6 | 0.9% |
| Local Government Employees | 59 | 9.3% |
| State Government Employees | 34 | 5.3% |
| Federal Government Employees | 24 | 3.8% |
| Unpaid Family Workers | 0 | 0.0% |
| Total | 637 | 100.0% |
Employment Status by Age in Awendaw
According to the labor force statistics for Awendaw, out of the total population over 16 years of age (1,426), 52.5% or 749 individuals are in the labor force, with 12.6% or 94 of them unemployed. The age group with the highest labor force participation rate is 20 to 24 years, with 100.0% or 108 individuals in the labor force. Within the labor force, the 25 to 29 years age range has the highest percentage of unemployed individuals, with 30.0% or 18 of them being unemployed.
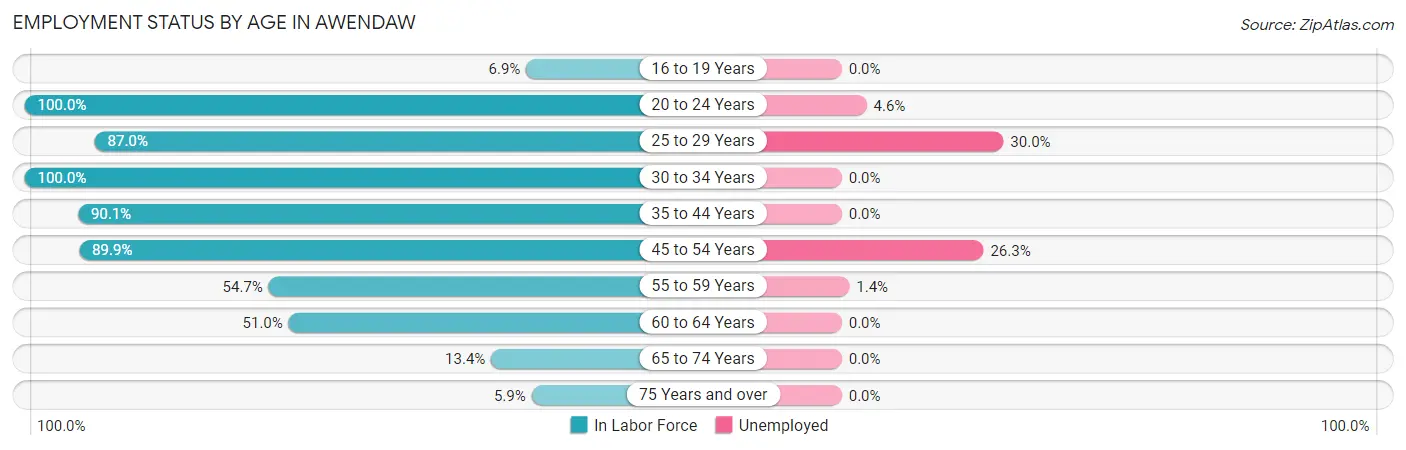
| Age Bracket | In Labor Force | Unemployed |
| 16 to 19 Years | 2 (6.9%) | 0 (0.0%) |
| 20 to 24 Years | 108 (100.0%) | 5 (4.6%) |
| 25 to 29 Years | 60 (87.0%) | 18 (30.0%) |
| 30 to 34 Years | 34 (100.0%) | 0 (0.0%) |
| 35 to 44 Years | 73 (90.1%) | 0 (0.0%) |
| 45 to 54 Years | 266 (89.9%) | 70 (26.3%) |
| 55 to 59 Years | 70 (54.7%) | 1 (1.4%) |
| 60 to 64 Years | 78 (51.0%) | 0 (0.0%) |
| 65 to 74 Years | 46 (13.4%) | 0 (0.0%) |
| 75 Years and over | 11 (5.9%) | 0 (0.0%) |
| Total | 749 (52.5%) | 94 (12.6%) |
Employment Status by Educational Attainment in Awendaw
According to labor force statistics for Awendaw, 76.3% of individuals (581) out of the total population between 25 and 64 years of age (761) are in the labor force, with 15.3% or 89 of them being unemployed. The group with the highest labor force participation rate are those with the educational attainment of less than high school, with 83.5% or 76 individuals in the labor force. Within the labor force, individuals with less than high school education have the highest percentage of unemployment, with 92.1% or 70 of them being unemployed.
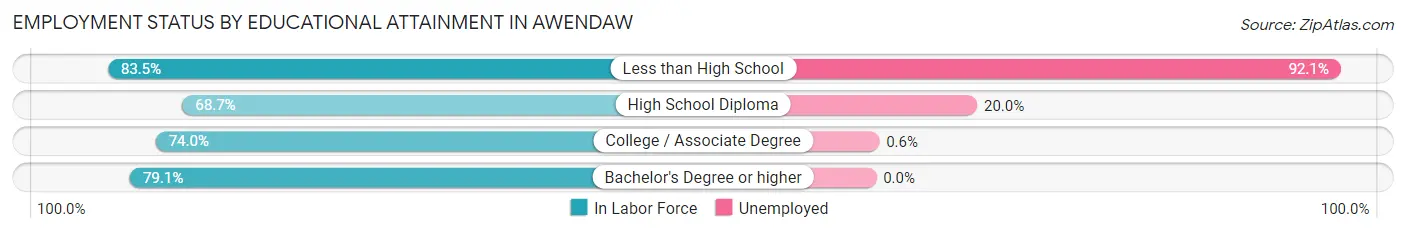
| Educational Attainment | In Labor Force | Unemployed |
| Less than High School | 76 (83.5%) | 84 (92.1%) |
| High School Diploma | 90 (68.7%) | 26 (20.0%) |
| College / Associate Degree | 165 (74.0%) | 1 (0.6%) |
| Bachelor's Degree or higher | 250 (79.1%) | 0 (0.0%) |
| Total | 581 (76.3%) | 116 (15.3%) |
Employment Occupations by Sex in Awendaw
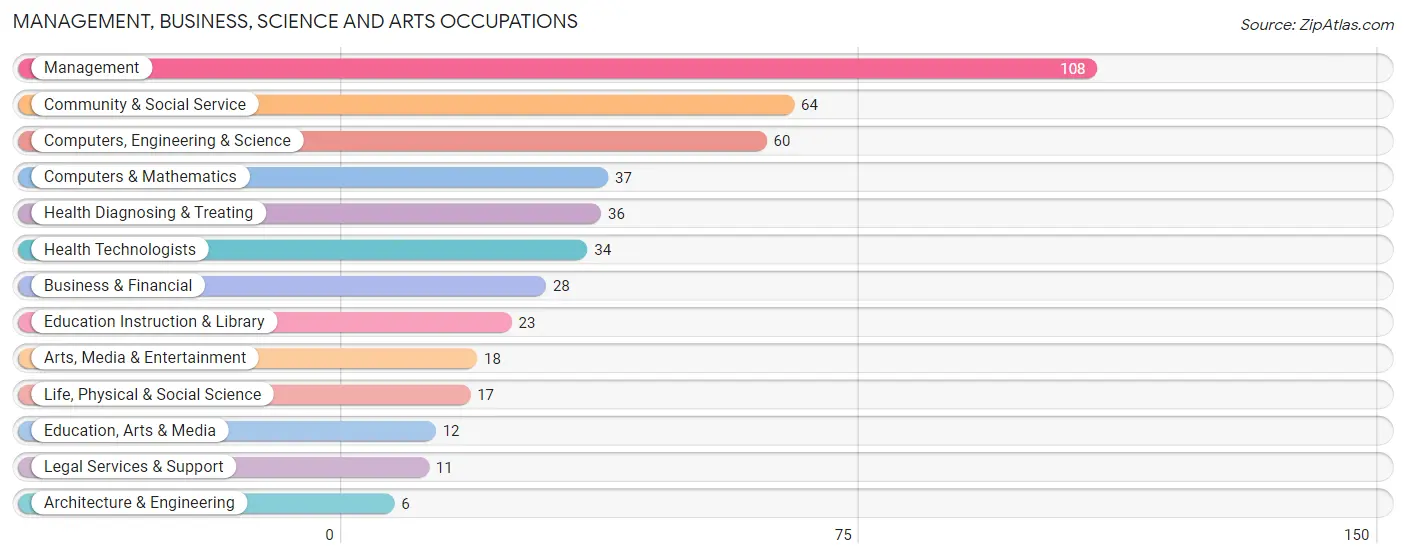
Management, Business, Science and Arts Occupations
The most common Management, Business, Science and Arts occupations in Awendaw are Management (108 | 16.5%), Community & Social Service (64 | 9.8%), Computers, Engineering & Science (60 | 9.2%), Computers & Mathematics (37 | 5.7%), and Health Diagnosing & Treating (36 | 5.5%).
Management, Business, Science and Arts Occupations by Sex
Within the Management, Business, Science and Arts occupations in Awendaw, the most male-oriented occupations are Computers, Engineering & Science (100.0%), Computers & Mathematics (100.0%), and Architecture & Engineering (100.0%), while the most female-oriented occupations are Education Instruction & Library (100.0%), Education, Arts & Media (83.3%), and Community & Social Service (82.8%).
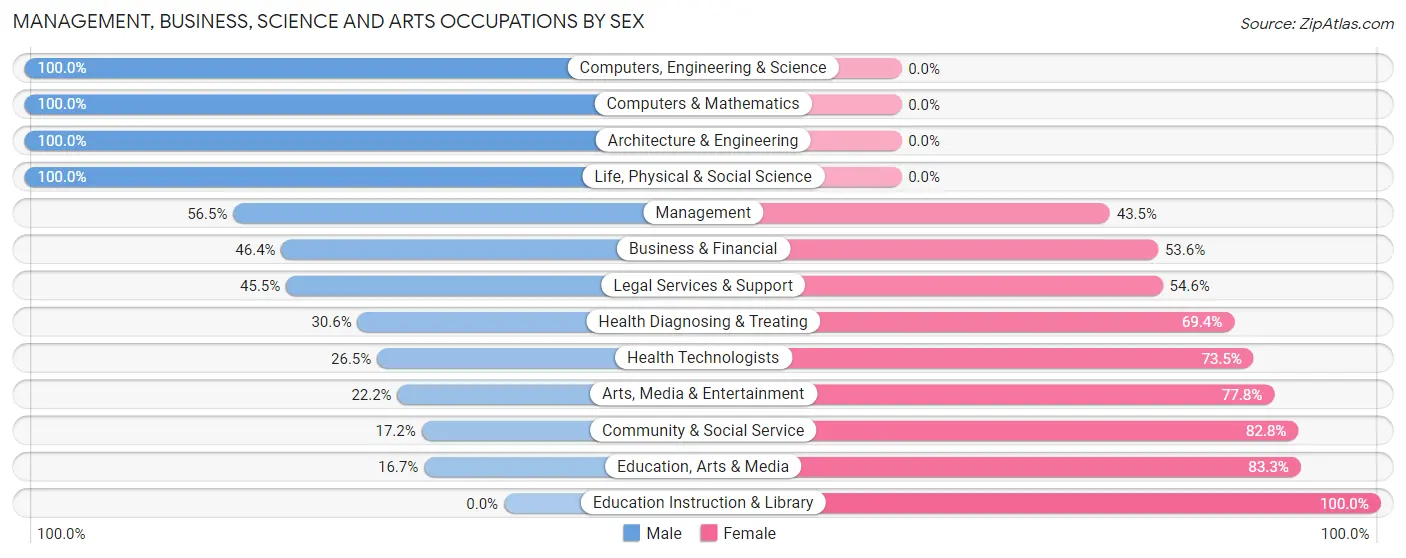
| Occupation | Male | Female |
| Management | 61 (56.5%) | 47 (43.5%) |
| Business & Financial | 13 (46.4%) | 15 (53.6%) |
| Computers, Engineering & Science | 60 (100.0%) | 0 (0.0%) |
| Computers & Mathematics | 37 (100.0%) | 0 (0.0%) |
| Architecture & Engineering | 6 (100.0%) | 0 (0.0%) |
| Life, Physical & Social Science | 17 (100.0%) | 0 (0.0%) |
| Community & Social Service | 11 (17.2%) | 53 (82.8%) |
| Education, Arts & Media | 2 (16.7%) | 10 (83.3%) |
| Legal Services & Support | 5 (45.5%) | 6 (54.5%) |
| Education Instruction & Library | 0 (0.0%) | 23 (100.0%) |
| Arts, Media & Entertainment | 4 (22.2%) | 14 (77.8%) |
| Health Diagnosing & Treating | 11 (30.6%) | 25 (69.4%) |
| Health Technologists | 9 (26.5%) | 25 (73.5%) |
| Total (Category) | 156 (52.7%) | 140 (47.3%) |
| Total (Overall) | 368 (56.3%) | 286 (43.7%) |
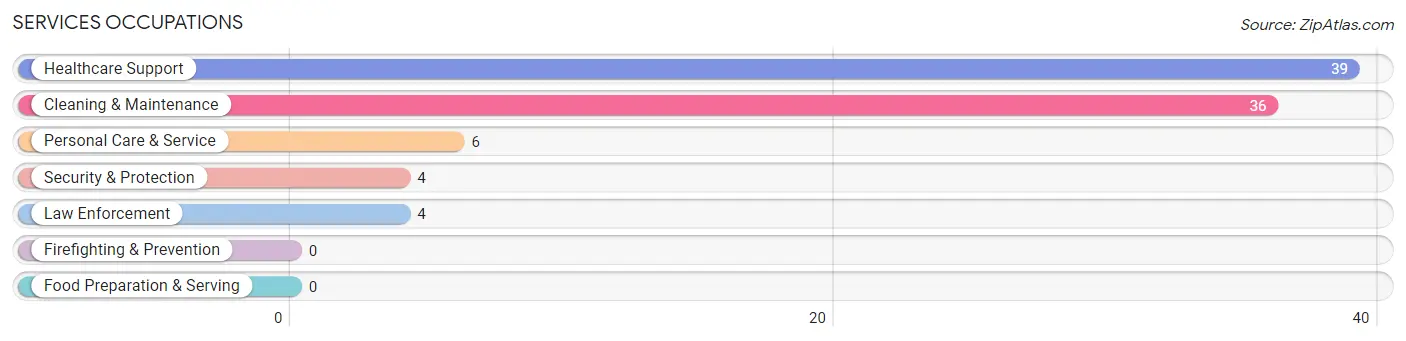
Services Occupations
The most common Services occupations in Awendaw are Healthcare Support (39 | 6.0%), Cleaning & Maintenance (36 | 5.5%), Personal Care & Service (6 | 0.9%), Security & Protection (4 | 0.6%), and Law Enforcement (4 | 0.6%).
Services Occupations by Sex
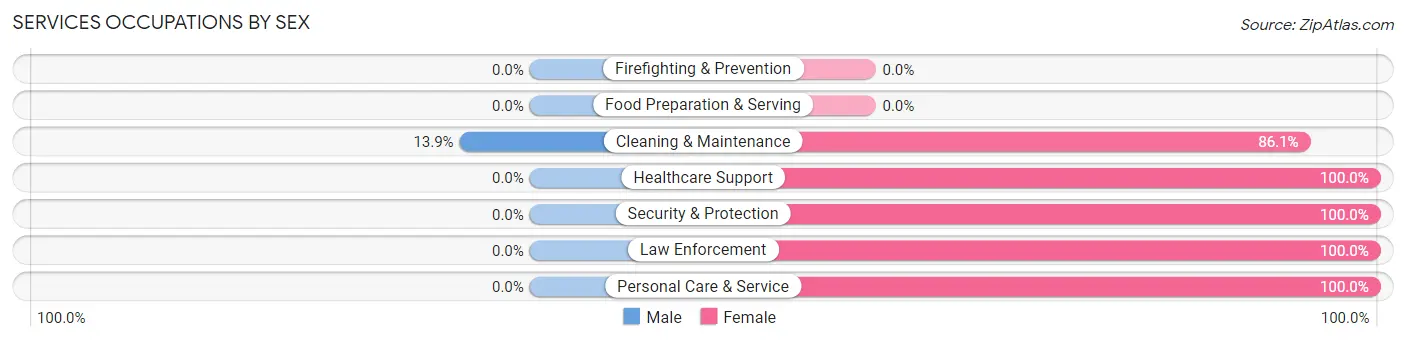
| Occupation | Male | Female |
| Healthcare Support | 0 (0.0%) | 39 (100.0%) |
| Security & Protection | 0 (0.0%) | 4 (100.0%) |
| Firefighting & Prevention | 0 (0.0%) | 0 (0.0%) |
| Law Enforcement | 0 (0.0%) | 4 (100.0%) |
| Food Preparation & Serving | 0 (0.0%) | 0 (0.0%) |
| Cleaning & Maintenance | 5 (13.9%) | 31 (86.1%) |
| Personal Care & Service | 0 (0.0%) | 6 (100.0%) |
| Total (Category) | 5 (5.9%) | 80 (94.1%) |
| Total (Overall) | 368 (56.3%) | 286 (43.7%) |
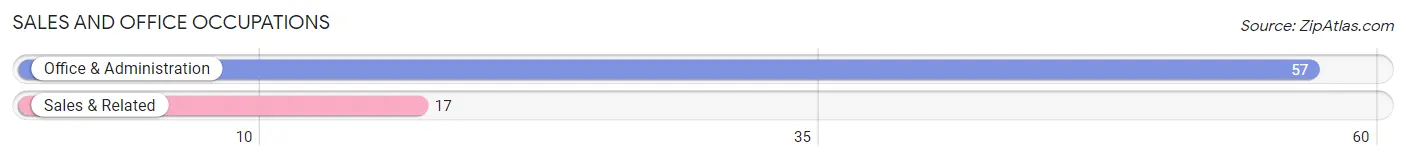
Sales and Office Occupations
The most common Sales and Office occupations in Awendaw are Office & Administration (57 | 8.7%), and Sales & Related (17 | 2.6%).
Sales and Office Occupations by Sex
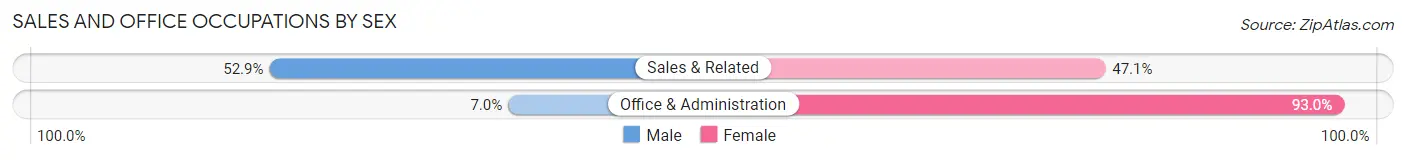
| Occupation | Male | Female |
| Sales & Related | 9 (52.9%) | 8 (47.1%) |
| Office & Administration | 4 (7.0%) | 53 (93.0%) |
| Total (Category) | 13 (17.6%) | 61 (82.4%) |
| Total (Overall) | 368 (56.3%) | 286 (43.7%) |
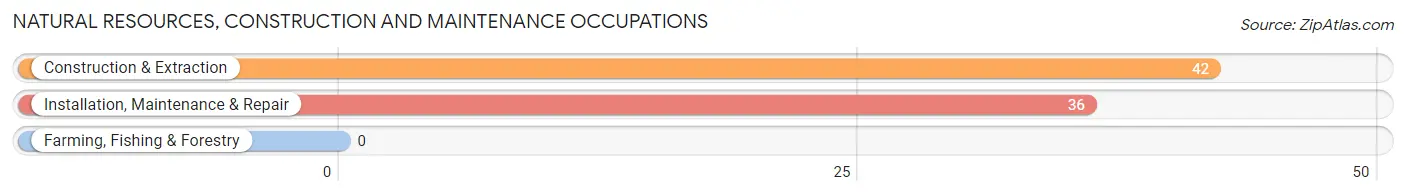
Natural Resources, Construction and Maintenance Occupations
The most common Natural Resources, Construction and Maintenance occupations in Awendaw are Construction & Extraction (42 | 6.4%), and Installation, Maintenance & Repair (36 | 5.5%).
Natural Resources, Construction and Maintenance Occupations by Sex
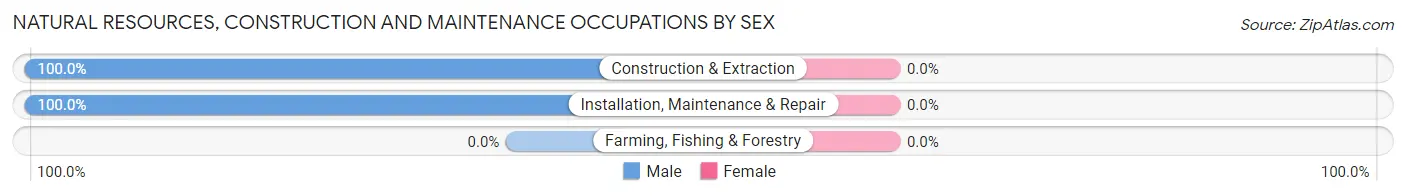
| Occupation | Male | Female |
| Farming, Fishing & Forestry | 0 (0.0%) | 0 (0.0%) |
| Construction & Extraction | 42 (100.0%) | 0 (0.0%) |
| Installation, Maintenance & Repair | 36 (100.0%) | 0 (0.0%) |
| Total (Category) | 78 (100.0%) | 0 (0.0%) |
| Total (Overall) | 368 (56.3%) | 286 (43.7%) |
Production, Transportation and Moving Occupations
The most common Production, Transportation and Moving occupations in Awendaw are Production (48 | 7.3%), Material Moving (47 | 7.2%), and Transportation (26 | 4.0%).
Production, Transportation and Moving Occupations by Sex
| Occupation | Male | Female |
| Production | 43 (89.6%) | 5 (10.4%) |
| Transportation | 26 (100.0%) | 0 (0.0%) |
| Material Moving | 47 (100.0%) | 0 (0.0%) |
| Total (Category) | 116 (95.9%) | 5 (4.1%) |
| Total (Overall) | 368 (56.3%) | 286 (43.7%) |
Employment Industries by Sex in Awendaw
Employment Industries in Awendaw
The major employment industries in Awendaw include Health Care & Social Assistance (134 | 20.5%), Public Administration (82 | 12.5%), Professional & Scientific (70 | 10.7%), Retail Trade (59 | 9.0%), and Manufacturing (50 | 7.6%).
Employment Industries by Sex in Awendaw
The Awendaw industries that see more men than women are Agriculture, Fishing & Hunting (100.0%), Transportation & Warehousing (100.0%), and Utilities (100.0%), whereas the industries that tend to have a higher number of women are Accommodation & Food Services (100.0%), Health Care & Social Assistance (88.1%), and Educational Services (58.3%).
| Industry | Male | Female |
| Agriculture, Fishing & Hunting | 10 (100.0%) | 0 (0.0%) |
| Mining, Quarrying, & Extraction | 0 (0.0%) | 0 (0.0%) |
| Construction | 17 (85.0%) | 3 (15.0%) |
| Manufacturing | 37 (74.0%) | 13 (26.0%) |
| Wholesale Trade | 0 (0.0%) | 0 (0.0%) |
| Retail Trade | 37 (62.7%) | 22 (37.3%) |
| Transportation & Warehousing | 27 (100.0%) | 0 (0.0%) |
| Utilities | 4 (100.0%) | 0 (0.0%) |
| Information | 2 (50.0%) | 2 (50.0%) |
| Finance & Insurance | 12 (60.0%) | 8 (40.0%) |
| Real Estate, Rental & Leasing | 0 (0.0%) | 0 (0.0%) |
| Professional & Scientific | 52 (74.3%) | 18 (25.7%) |
| Enterprise Management | 0 (0.0%) | 0 (0.0%) |
| Administrative & Support | 26 (72.2%) | 10 (27.8%) |
| Educational Services | 10 (41.7%) | 14 (58.3%) |
| Health Care & Social Assistance | 16 (11.9%) | 118 (88.1%) |
| Arts, Entertainment & Recreation | 6 (54.5%) | 5 (45.5%) |
| Accommodation & Food Services | 0 (0.0%) | 18 (100.0%) |
| Public Administration | 36 (43.9%) | 46 (56.1%) |
| Total | 368 (56.3%) | 286 (43.7%) |
Education in Awendaw
School Enrollment in Awendaw
The most common levels of schooling among the 236 students in Awendaw are college / undergraduate (74 | 31.4%), elementary school (43 | 18.2%), and graduate / professional (43 | 18.2%).
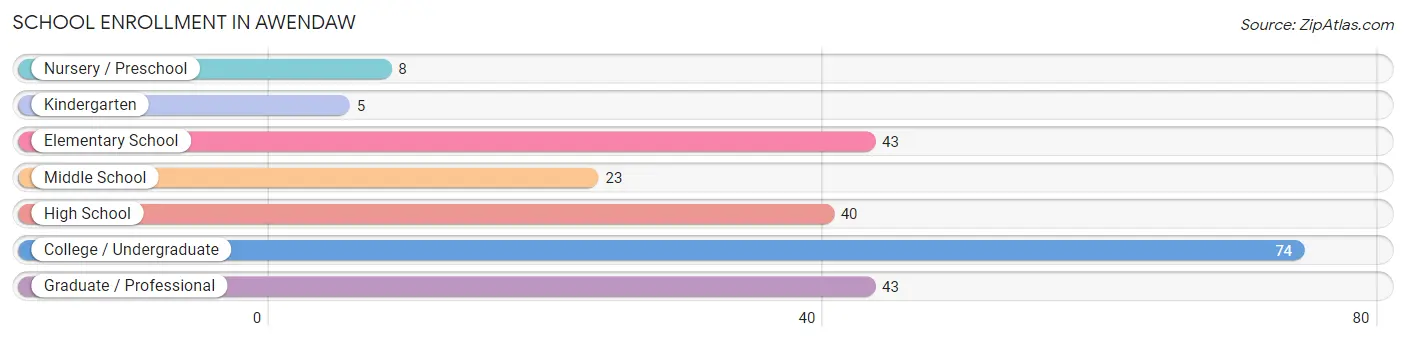
| School Level | # Students | % Students |
| Nursery / Preschool | 8 | 3.4% |
| Kindergarten | 5 | 2.1% |
| Elementary School | 43 | 18.2% |
| Middle School | 23 | 9.8% |
| High School | 40 | 17.0% |
| College / Undergraduate | 74 | 31.4% |
| Graduate / Professional | 43 | 18.2% |
| Total | 236 | 100.0% |
School Enrollment by Age by Funding Source in Awendaw
Out of a total of 236 students who are enrolled in schools in Awendaw, 30 (12.7%) attend a private institution, while the remaining 206 (87.3%) are enrolled in public schools. The age group of 3 to 4 year olds has the highest likelihood of being enrolled in private schools, with 8 (61.5% in the age bracket) enrolled. Conversely, the age group of 5 to 9 year old has the lowest likelihood of being enrolled in a private school, with 39 (100.0% in the age bracket) attending a public institution.
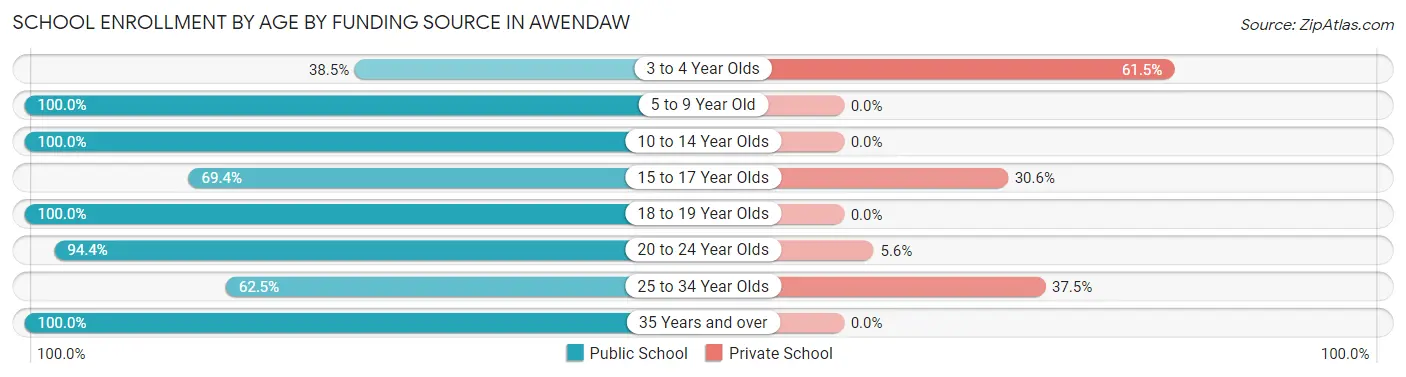
| Age Bracket | Public School | Private School |
| 3 to 4 Year Olds | 5 (38.5%) | 8 (61.5%) |
| 5 to 9 Year Old | 39 (100.0%) | 0 (0.0%) |
| 10 to 14 Year Olds | 27 (100.0%) | 0 (0.0%) |
| 15 to 17 Year Olds | 25 (69.4%) | 11 (30.6%) |
| 18 to 19 Year Olds | 5 (100.0%) | 0 (0.0%) |
| 20 to 24 Year Olds | 34 (94.4%) | 2 (5.6%) |
| 25 to 34 Year Olds | 15 (62.5%) | 9 (37.5%) |
| 35 Years and over | 56 (100.0%) | 0 (0.0%) |
| Total | 206 (87.3%) | 30 (12.7%) |
Educational Attainment by Field of Study in Awendaw
Education (90 | 20.1%), business (69 | 15.4%), bio, nature & agricultural (55 | 12.3%), computers & mathematics (28 | 6.2%), and science & technology (28 | 6.2%) are the most common fields of study among 448 individuals in Awendaw who have obtained a bachelor's degree or higher.
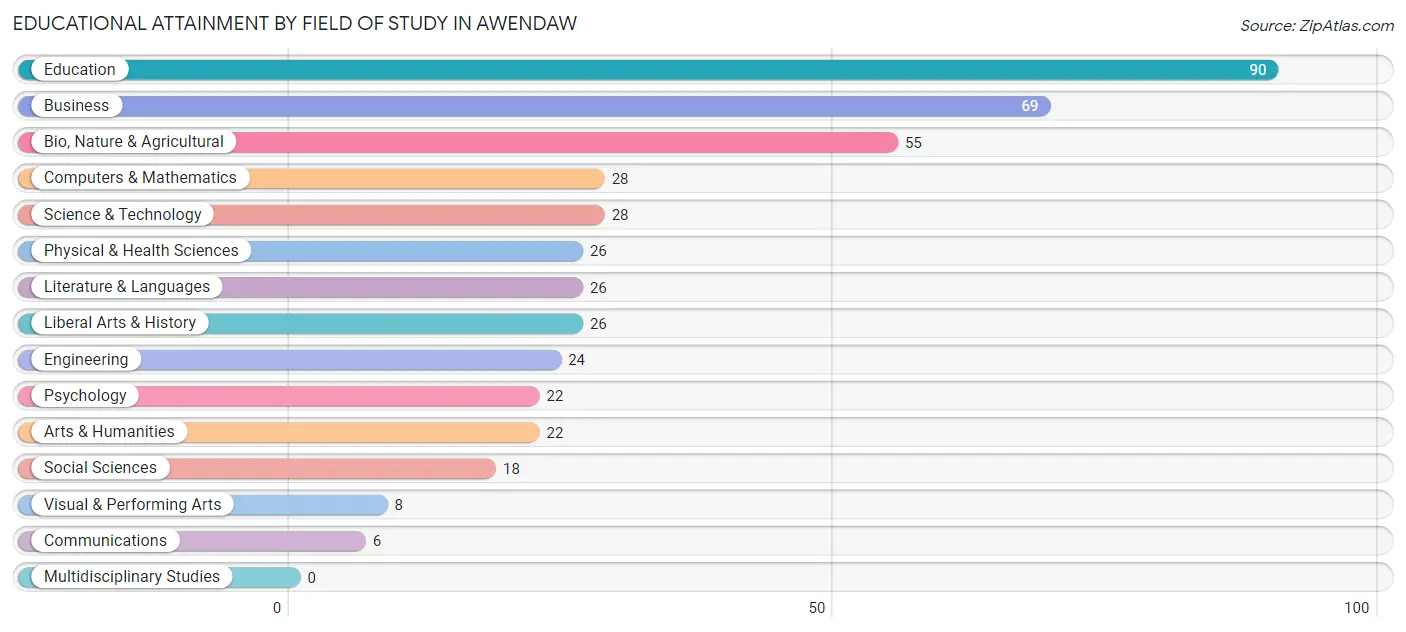
| Field of Study | # Graduates | % Graduates |
| Computers & Mathematics | 28 | 6.2% |
| Bio, Nature & Agricultural | 55 | 12.3% |
| Physical & Health Sciences | 26 | 5.8% |
| Psychology | 22 | 4.9% |
| Social Sciences | 18 | 4.0% |
| Engineering | 24 | 5.4% |
| Multidisciplinary Studies | 0 | 0.0% |
| Science & Technology | 28 | 6.2% |
| Business | 69 | 15.4% |
| Education | 90 | 20.1% |
| Literature & Languages | 26 | 5.8% |
| Liberal Arts & History | 26 | 5.8% |
| Visual & Performing Arts | 8 | 1.8% |
| Communications | 6 | 1.3% |
| Arts & Humanities | 22 | 4.9% |
| Total | 448 | 100.0% |
Transportation & Commute in Awendaw
Vehicle Availability by Sex in Awendaw
The most prevalent vehicle ownership categories in Awendaw are males with 3 vehicles (124, accounting for 33.7%) and females with 3 vehicles (52, making up 46.1%).
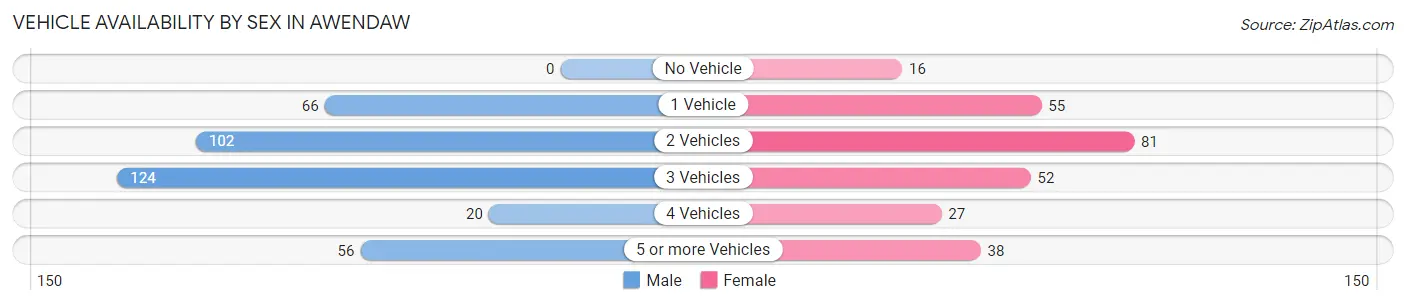
| Vehicles Available | Male | Female |
| No Vehicle | 0 (0.0%) | 16 (5.9%) |
| 1 Vehicle | 66 (17.9%) | 55 (20.4%) |
| 2 Vehicles | 102 (27.7%) | 81 (30.1%) |
| 3 Vehicles | 124 (33.7%) | 52 (19.3%) |
| 4 Vehicles | 20 (5.4%) | 27 (10.0%) |
| 5 or more Vehicles | 56 (15.2%) | 38 (14.1%) |
| Total | 368 (100.0%) | 269 (100.0%) |
Commute Time in Awendaw
The most frequently occuring commute durations in Awendaw are 20 to 24 minutes (170 commuters, 29.7%), 30 to 34 minutes (131 commuters, 22.9%), and 35 to 39 minutes (75 commuters, 13.1%).
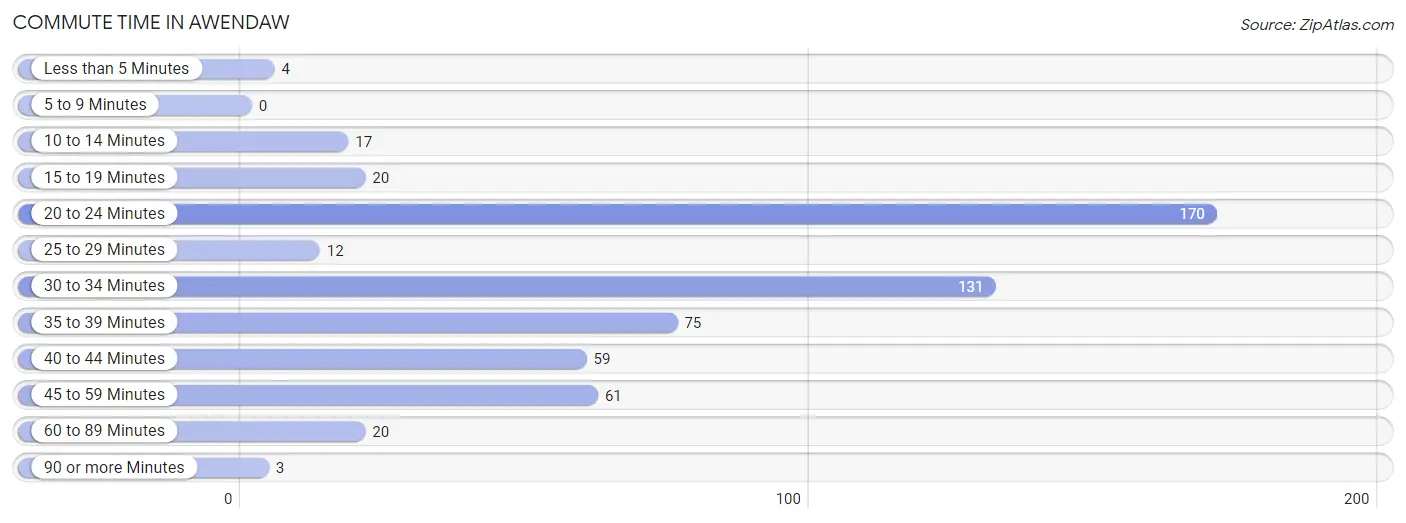
| Commute Time | # Commuters | % Commuters |
| Less than 5 Minutes | 4 | 0.7% |
| 5 to 9 Minutes | 0 | 0.0% |
| 10 to 14 Minutes | 17 | 3.0% |
| 15 to 19 Minutes | 20 | 3.5% |
| 20 to 24 Minutes | 170 | 29.7% |
| 25 to 29 Minutes | 12 | 2.1% |
| 30 to 34 Minutes | 131 | 22.9% |
| 35 to 39 Minutes | 75 | 13.1% |
| 40 to 44 Minutes | 59 | 10.3% |
| 45 to 59 Minutes | 61 | 10.7% |
| 60 to 89 Minutes | 20 | 3.5% |
| 90 or more Minutes | 3 | 0.5% |
Commute Time by Sex in Awendaw
The most common commute times in Awendaw are 20 to 24 minutes (117 commuters, 35.7%) for males and 30 to 34 minutes (82 commuters, 33.6%) for females.
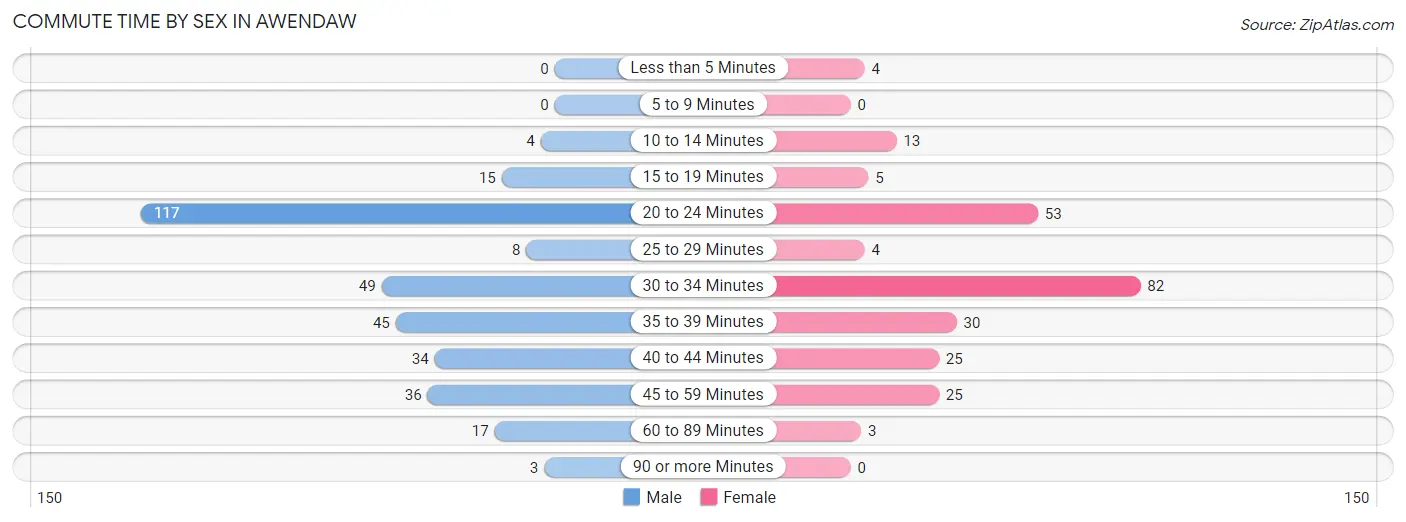
| Commute Time | Male | Female |
| Less than 5 Minutes | 0 (0.0%) | 4 (1.6%) |
| 5 to 9 Minutes | 0 (0.0%) | 0 (0.0%) |
| 10 to 14 Minutes | 4 (1.2%) | 13 (5.3%) |
| 15 to 19 Minutes | 15 (4.6%) | 5 (2.1%) |
| 20 to 24 Minutes | 117 (35.7%) | 53 (21.7%) |
| 25 to 29 Minutes | 8 (2.4%) | 4 (1.6%) |
| 30 to 34 Minutes | 49 (14.9%) | 82 (33.6%) |
| 35 to 39 Minutes | 45 (13.7%) | 30 (12.3%) |
| 40 to 44 Minutes | 34 (10.4%) | 25 (10.2%) |
| 45 to 59 Minutes | 36 (11.0%) | 25 (10.2%) |
| 60 to 89 Minutes | 17 (5.2%) | 3 (1.2%) |
| 90 or more Minutes | 3 (0.9%) | 0 (0.0%) |
Time of Departure to Work by Sex in Awendaw
The most frequent times of departure to work in Awendaw are 6:30 AM to 6:59 AM (75, 22.9%) for males and 7:00 AM to 7:29 AM (68, 27.9%) for females.
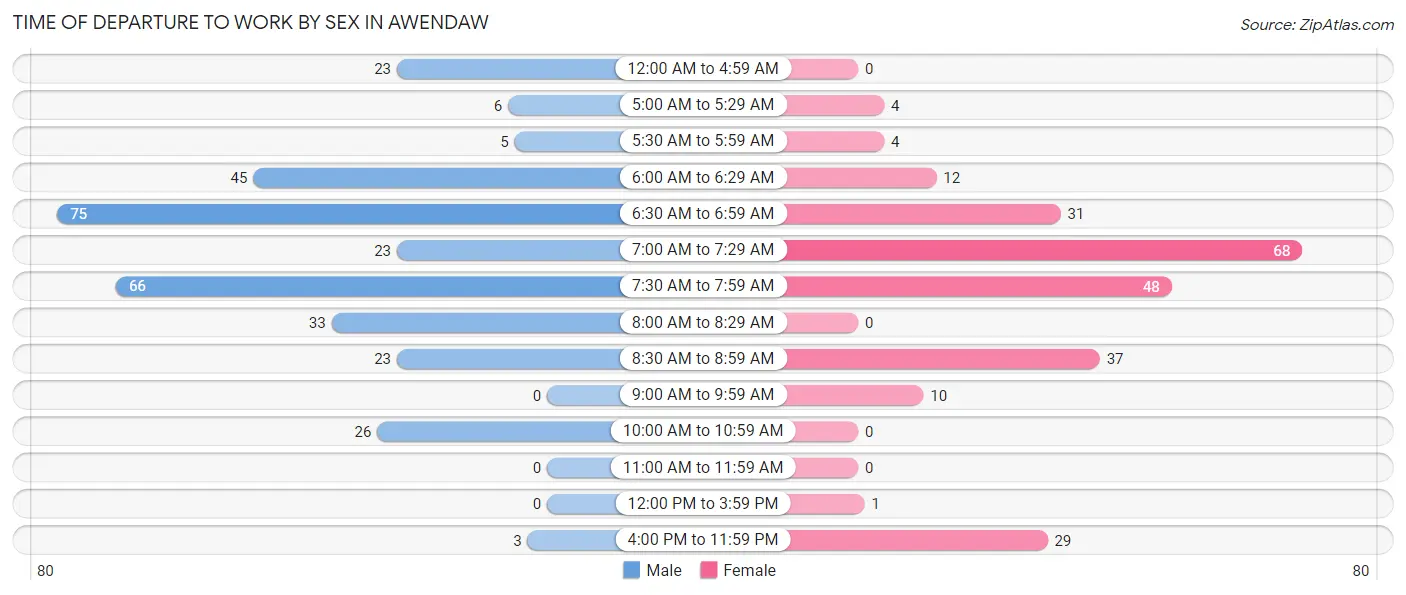
| Time of Departure | Male | Female |
| 12:00 AM to 4:59 AM | 23 (7.0%) | 0 (0.0%) |
| 5:00 AM to 5:29 AM | 6 (1.8%) | 4 (1.6%) |
| 5:30 AM to 5:59 AM | 5 (1.5%) | 4 (1.6%) |
| 6:00 AM to 6:29 AM | 45 (13.7%) | 12 (4.9%) |
| 6:30 AM to 6:59 AM | 75 (22.9%) | 31 (12.7%) |
| 7:00 AM to 7:29 AM | 23 (7.0%) | 68 (27.9%) |
| 7:30 AM to 7:59 AM | 66 (20.1%) | 48 (19.7%) |
| 8:00 AM to 8:29 AM | 33 (10.1%) | 0 (0.0%) |
| 8:30 AM to 8:59 AM | 23 (7.0%) | 37 (15.2%) |
| 9:00 AM to 9:59 AM | 0 (0.0%) | 10 (4.1%) |
| 10:00 AM to 10:59 AM | 26 (7.9%) | 0 (0.0%) |
| 11:00 AM to 11:59 AM | 0 (0.0%) | 0 (0.0%) |
| 12:00 PM to 3:59 PM | 0 (0.0%) | 1 (0.4%) |
| 4:00 PM to 11:59 PM | 3 (0.9%) | 29 (11.9%) |
| Total | 328 (100.0%) | 244 (100.0%) |
Housing Occupancy in Awendaw
Occupancy by Ownership in Awendaw
Of the total 721 dwellings in Awendaw, owner-occupied units account for 660 (91.5%), while renter-occupied units make up 61 (8.5%).
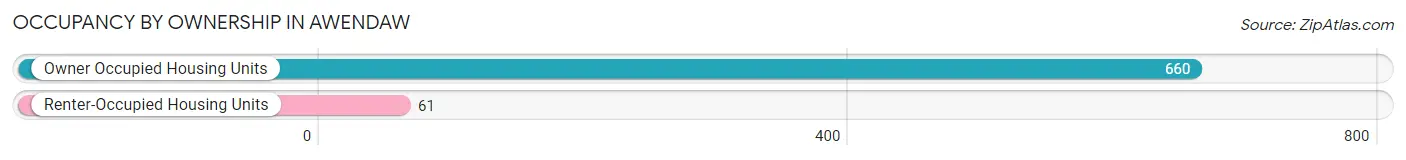
| Occupancy | # Housing Units | % Housing Units |
| Owner Occupied Housing Units | 660 | 91.5% |
| Renter-Occupied Housing Units | 61 | 8.5% |
| Total Occupied Housing Units | 721 | 100.0% |
Occupancy by Household Size in Awendaw
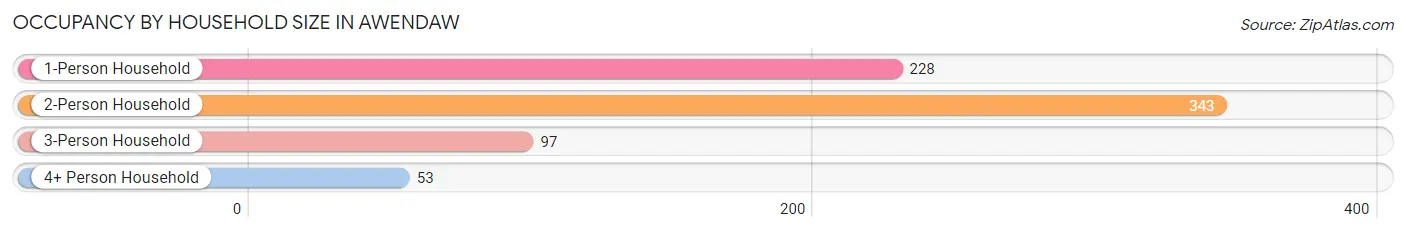
| Household Size | # Housing Units | % Housing Units |
| 1-Person Household | 228 | 31.6% |
| 2-Person Household | 343 | 47.6% |
| 3-Person Household | 97 | 13.5% |
| 4+ Person Household | 53 | 7.3% |
| Total Housing Units | 721 | 100.0% |
Occupancy by Ownership by Household Size in Awendaw
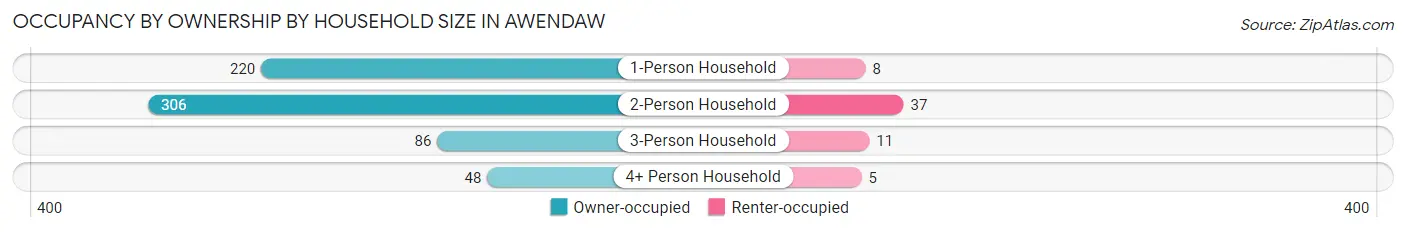
| Household Size | Owner-occupied | Renter-occupied |
| 1-Person Household | 220 (96.5%) | 8 (3.5%) |
| 2-Person Household | 306 (89.2%) | 37 (10.8%) |
| 3-Person Household | 86 (88.7%) | 11 (11.3%) |
| 4+ Person Household | 48 (90.6%) | 5 (9.4%) |
| Total Housing Units | 660 (91.5%) | 61 (8.5%) |
Occupancy by Educational Attainment in Awendaw
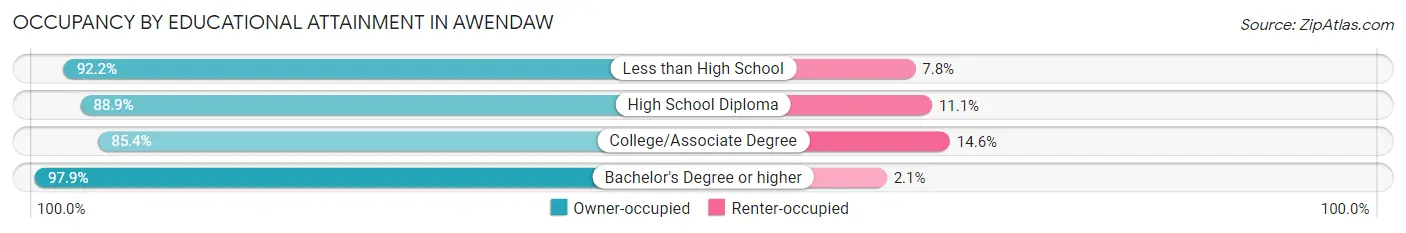
| Household Size | Owner-occupied | Renter-occupied |
| Less than High School | 95 (92.2%) | 8 (7.8%) |
| High School Diploma | 185 (88.9%) | 23 (11.1%) |
| College/Associate Degree | 146 (85.4%) | 25 (14.6%) |
| Bachelor's Degree or higher | 234 (97.9%) | 5 (2.1%) |
Occupancy by Age of Householder in Awendaw
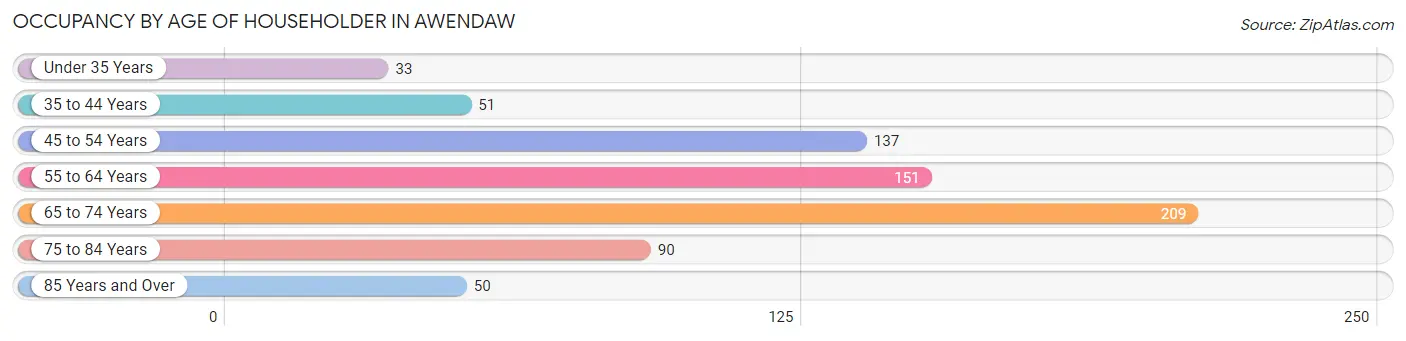
| Age Bracket | # Households | % Households |
| Under 35 Years | 33 | 4.6% |
| 35 to 44 Years | 51 | 7.1% |
| 45 to 54 Years | 137 | 19.0% |
| 55 to 64 Years | 151 | 20.9% |
| 65 to 74 Years | 209 | 29.0% |
| 75 to 84 Years | 90 | 12.5% |
| 85 Years and Over | 50 | 6.9% |
| Total | 721 | 100.0% |
Housing Finances in Awendaw
Median Income by Occupancy in Awendaw
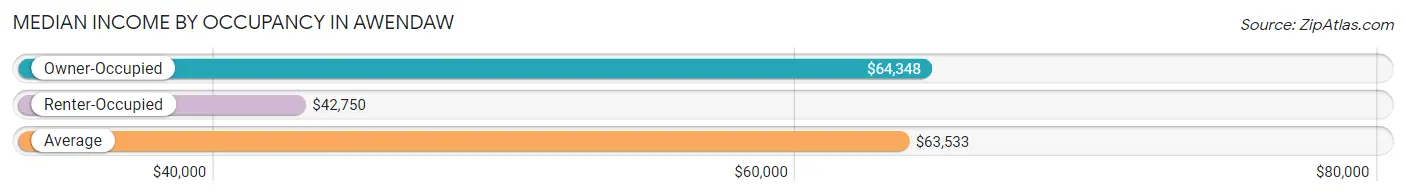
| Occupancy Type | # Households | Median Income |
| Owner-Occupied | 660 (91.5%) | $64,348 |
| Renter-Occupied | 61 (8.5%) | $42,750 |
| Average | 721 (100.0%) | $63,533 |
Occupancy by Householder Income Bracket in Awendaw
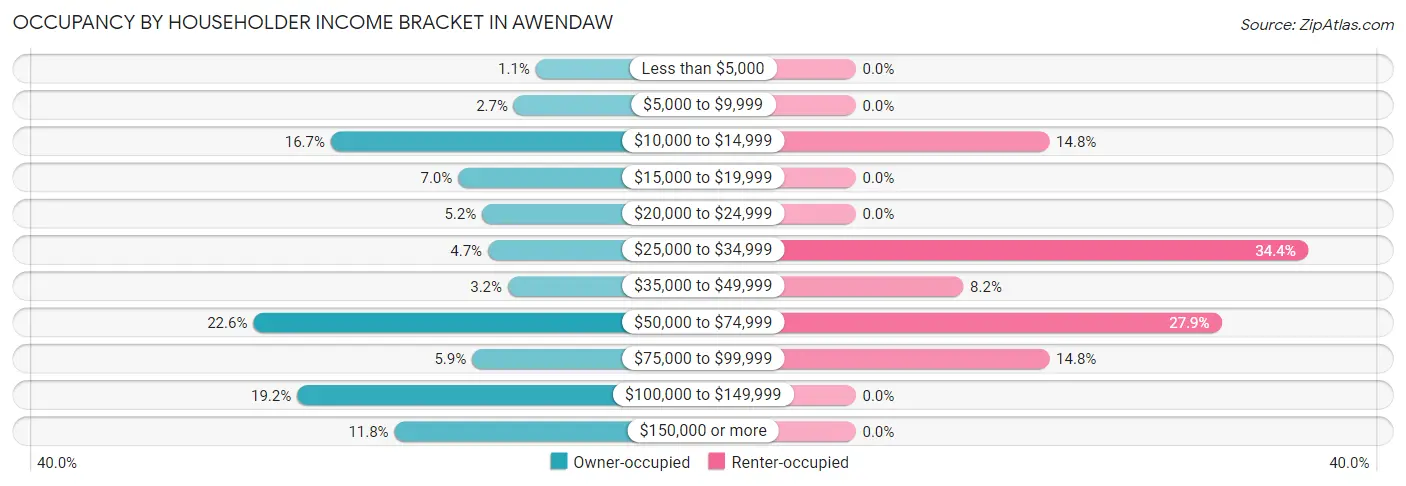
| Income Bracket | Owner-occupied | Renter-occupied |
| Less than $5,000 | 7 (1.1%) | 0 (0.0%) |
| $5,000 to $9,999 | 18 (2.7%) | 0 (0.0%) |
| $10,000 to $14,999 | 110 (16.7%) | 9 (14.7%) |
| $15,000 to $19,999 | 46 (7.0%) | 0 (0.0%) |
| $20,000 to $24,999 | 34 (5.1%) | 0 (0.0%) |
| $25,000 to $34,999 | 31 (4.7%) | 21 (34.4%) |
| $35,000 to $49,999 | 21 (3.2%) | 5 (8.2%) |
| $50,000 to $74,999 | 149 (22.6%) | 17 (27.9%) |
| $75,000 to $99,999 | 39 (5.9%) | 9 (14.7%) |
| $100,000 to $149,999 | 127 (19.2%) | 0 (0.0%) |
| $150,000 or more | 78 (11.8%) | 0 (0.0%) |
| Total | 660 (100.0%) | 61 (100.0%) |
Monthly Housing Cost Tiers in Awendaw
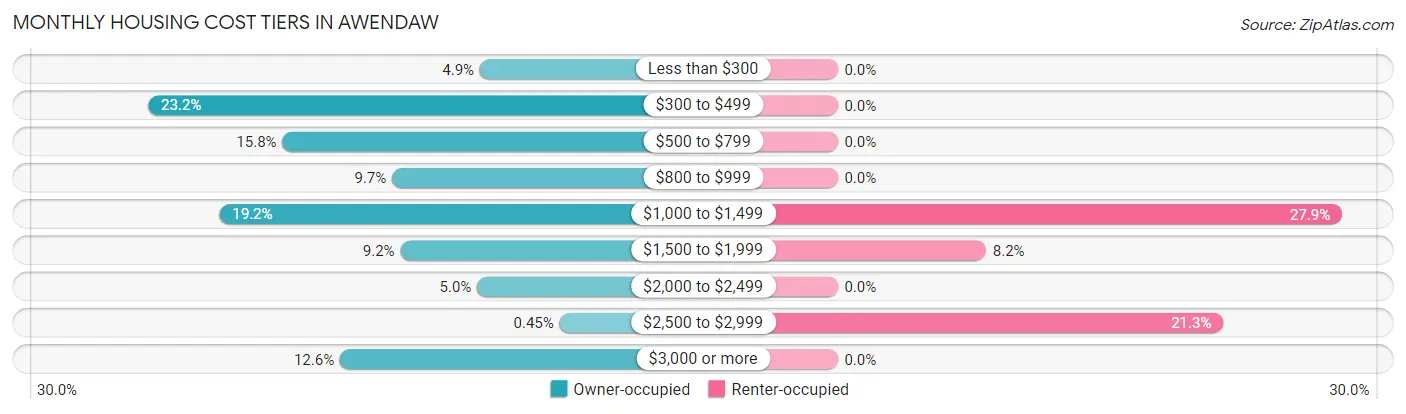
| Monthly Cost | Owner-occupied | Renter-occupied |
| Less than $300 | 32 (4.9%) | 0 (0.0%) |
| $300 to $499 | 153 (23.2%) | 0 (0.0%) |
| $500 to $799 | 104 (15.8%) | 0 (0.0%) |
| $800 to $999 | 64 (9.7%) | 0 (0.0%) |
| $1,000 to $1,499 | 127 (19.2%) | 17 (27.9%) |
| $1,500 to $1,999 | 61 (9.2%) | 5 (8.2%) |
| $2,000 to $2,499 | 33 (5.0%) | 0 (0.0%) |
| $2,500 to $2,999 | 3 (0.4%) | 13 (21.3%) |
| $3,000 or more | 83 (12.6%) | 0 (0.0%) |
| Total | 660 (100.0%) | 61 (100.0%) |
Physical Housing Characteristics in Awendaw
Housing Structures in Awendaw
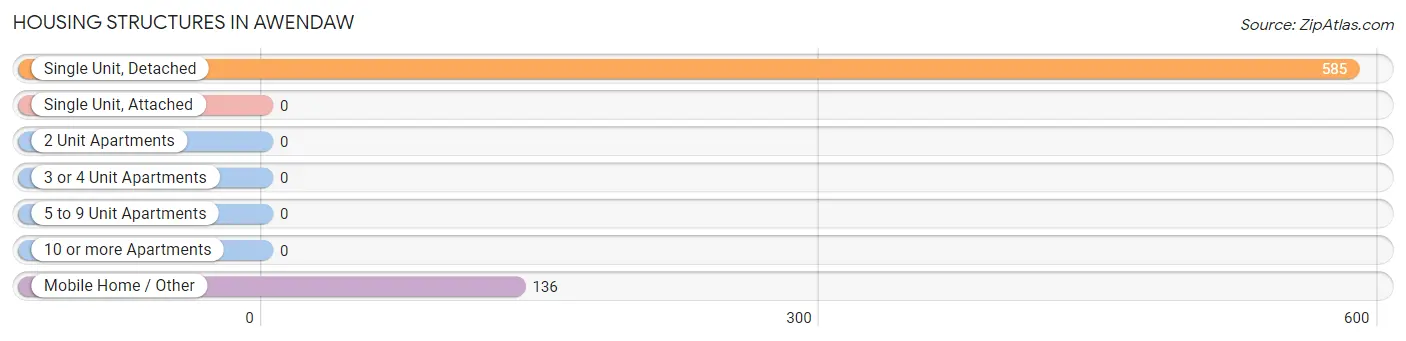
| Structure Type | # Housing Units | % Housing Units |
| Single Unit, Detached | 585 | 81.1% |
| Single Unit, Attached | 0 | 0.0% |
| 2 Unit Apartments | 0 | 0.0% |
| 3 or 4 Unit Apartments | 0 | 0.0% |
| 5 to 9 Unit Apartments | 0 | 0.0% |
| 10 or more Apartments | 0 | 0.0% |
| Mobile Home / Other | 136 | 18.9% |
| Total | 721 | 100.0% |
Housing Structures by Occupancy in Awendaw
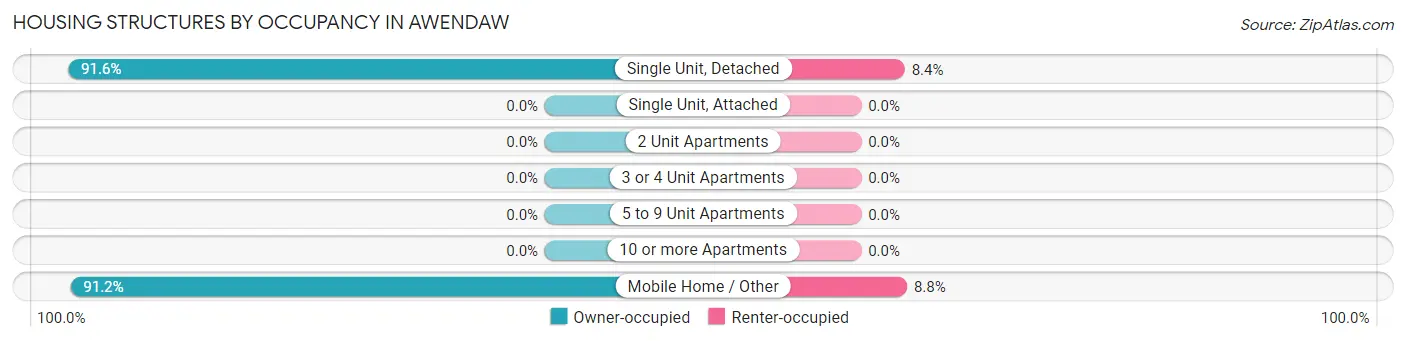
| Structure Type | Owner-occupied | Renter-occupied |
| Single Unit, Detached | 536 (91.6%) | 49 (8.4%) |
| Single Unit, Attached | 0 (0.0%) | 0 (0.0%) |
| 2 Unit Apartments | 0 (0.0%) | 0 (0.0%) |
| 3 or 4 Unit Apartments | 0 (0.0%) | 0 (0.0%) |
| 5 to 9 Unit Apartments | 0 (0.0%) | 0 (0.0%) |
| 10 or more Apartments | 0 (0.0%) | 0 (0.0%) |
| Mobile Home / Other | 124 (91.2%) | 12 (8.8%) |
| Total | 660 (91.5%) | 61 (8.5%) |
Housing Structures by Number of Rooms in Awendaw
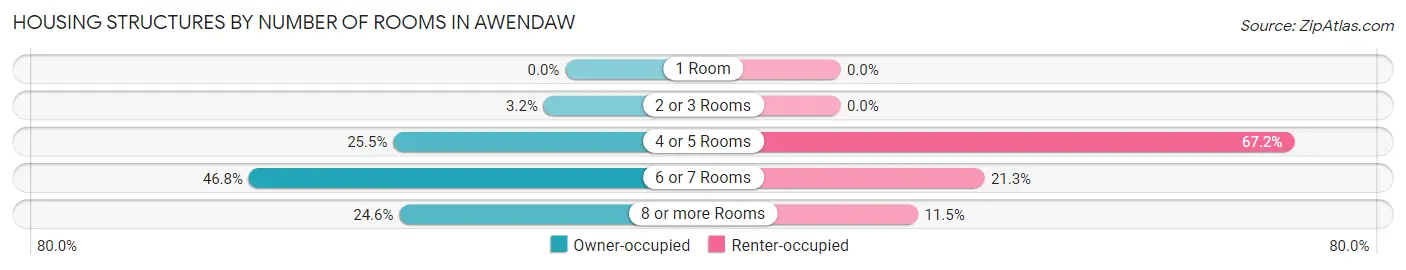
| Number of Rooms | Owner-occupied | Renter-occupied |
| 1 Room | 0 (0.0%) | 0 (0.0%) |
| 2 or 3 Rooms | 21 (3.2%) | 0 (0.0%) |
| 4 or 5 Rooms | 168 (25.5%) | 41 (67.2%) |
| 6 or 7 Rooms | 309 (46.8%) | 13 (21.3%) |
| 8 or more Rooms | 162 (24.5%) | 7 (11.5%) |
| Total | 660 (100.0%) | 61 (100.0%) |
Housing Structure by Heating Type in Awendaw
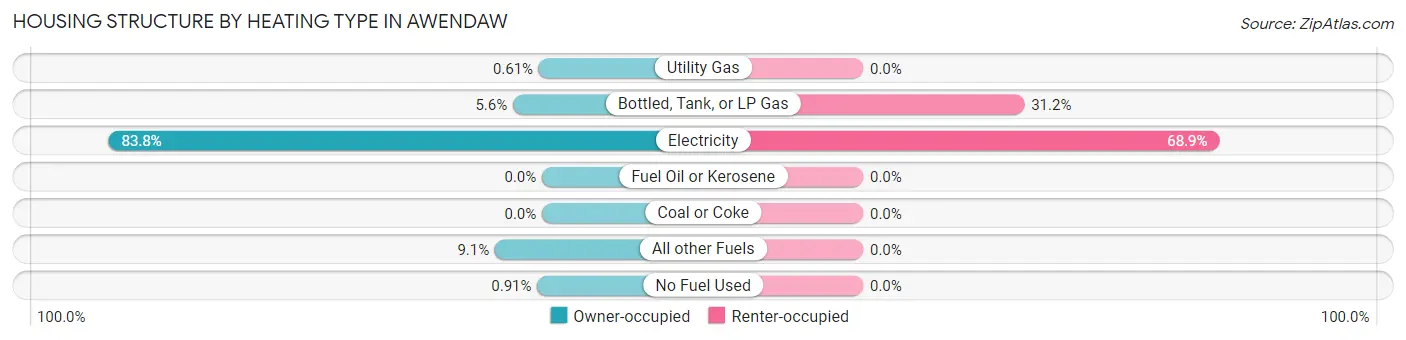
| Heating Type | Owner-occupied | Renter-occupied |
| Utility Gas | 4 (0.6%) | 0 (0.0%) |
| Bottled, Tank, or LP Gas | 37 (5.6%) | 19 (31.1%) |
| Electricity | 553 (83.8%) | 42 (68.9%) |
| Fuel Oil or Kerosene | 0 (0.0%) | 0 (0.0%) |
| Coal or Coke | 0 (0.0%) | 0 (0.0%) |
| All other Fuels | 60 (9.1%) | 0 (0.0%) |
| No Fuel Used | 6 (0.9%) | 0 (0.0%) |
| Total | 660 (100.0%) | 61 (100.0%) |
Household Vehicle Usage in Awendaw
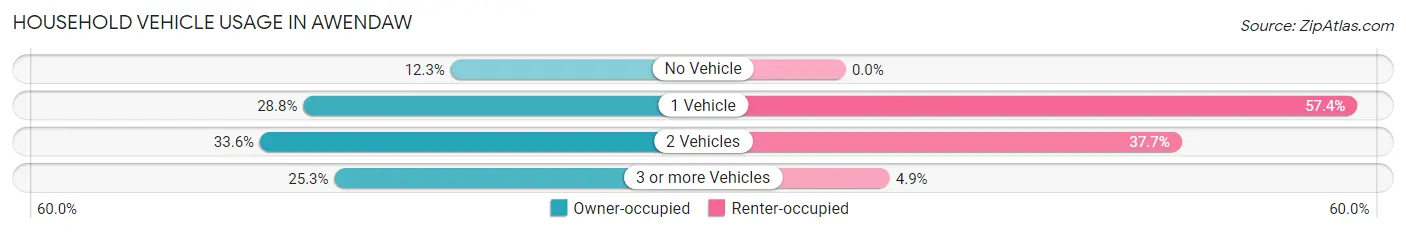
| Vehicles per Household | Owner-occupied | Renter-occupied |
| No Vehicle | 81 (12.3%) | 0 (0.0%) |
| 1 Vehicle | 190 (28.8%) | 35 (57.4%) |
| 2 Vehicles | 222 (33.6%) | 23 (37.7%) |
| 3 or more Vehicles | 167 (25.3%) | 3 (4.9%) |
| Total | 660 (100.0%) | 61 (100.0%) |
Real Estate & Mortgages in Awendaw
Real Estate and Mortgage Overview in Awendaw
| Characteristic | Without Mortgage | With Mortgage |
| Housing Units | 355 | 305 |
| Median Property Value | $325,500 | $325,000 |
| Median Household Income | $70,172 | $43 |
| Monthly Housing Costs | $493 | $83 |
| Real Estate Taxes | $1,005 | $18 |
Property Value by Mortgage Status in Awendaw
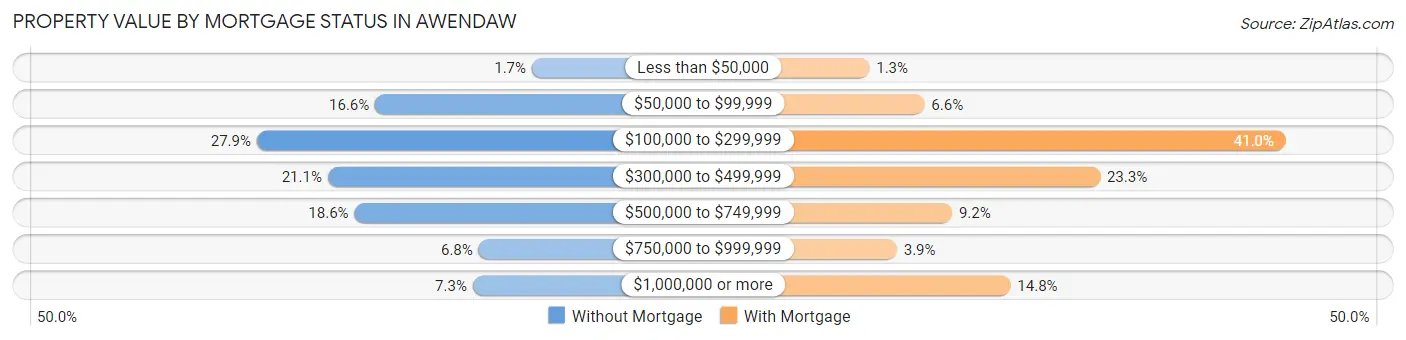
| Property Value | Without Mortgage | With Mortgage |
| Less than $50,000 | 6 (1.7%) | 4 (1.3%) |
| $50,000 to $99,999 | 59 (16.6%) | 20 (6.6%) |
| $100,000 to $299,999 | 99 (27.9%) | 125 (41.0%) |
| $300,000 to $499,999 | 75 (21.1%) | 71 (23.3%) |
| $500,000 to $749,999 | 66 (18.6%) | 28 (9.2%) |
| $750,000 to $999,999 | 24 (6.8%) | 12 (3.9%) |
| $1,000,000 or more | 26 (7.3%) | 45 (14.7%) |
| Total | 355 (100.0%) | 305 (100.0%) |
Household Income by Mortgage Status in Awendaw
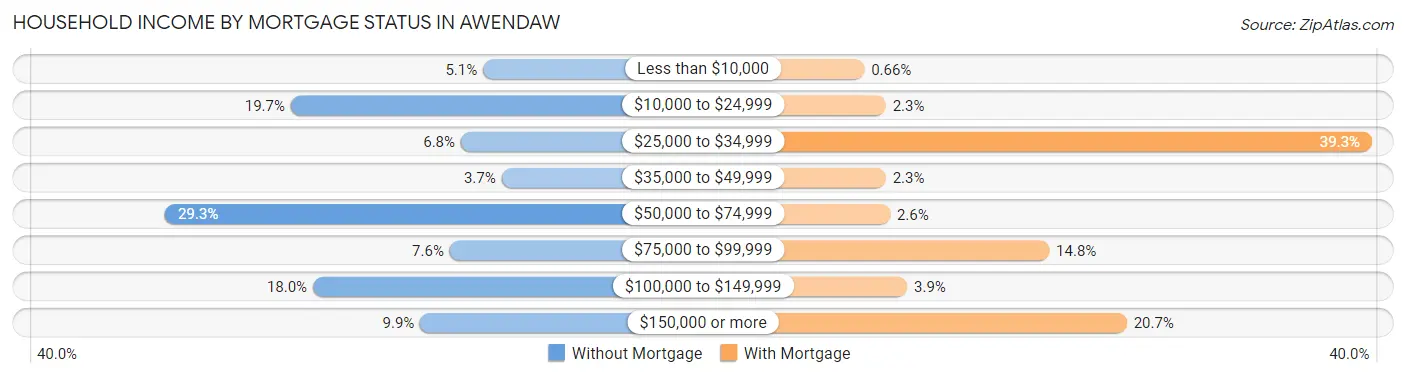
| Household Income | Without Mortgage | With Mortgage |
| Less than $10,000 | 18 (5.1%) | 2 (0.7%) |
| $10,000 to $24,999 | 70 (19.7%) | 7 (2.3%) |
| $25,000 to $34,999 | 24 (6.8%) | 120 (39.3%) |
| $35,000 to $49,999 | 13 (3.7%) | 7 (2.3%) |
| $50,000 to $74,999 | 104 (29.3%) | 8 (2.6%) |
| $75,000 to $99,999 | 27 (7.6%) | 45 (14.7%) |
| $100,000 to $149,999 | 64 (18.0%) | 12 (3.9%) |
| $150,000 or more | 35 (9.9%) | 63 (20.7%) |
| Total | 355 (100.0%) | 305 (100.0%) |
Property Value to Household Income Ratio in Awendaw
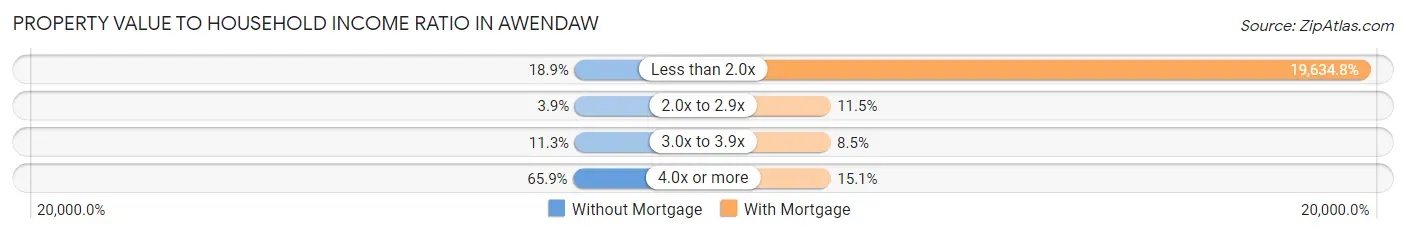
| Value-to-Income Ratio | Without Mortgage | With Mortgage |
| Less than 2.0x | 67 (18.9%) | 59,886 (19,634.7%) |
| 2.0x to 2.9x | 14 (3.9%) | 35 (11.5%) |
| 3.0x to 3.9x | 40 (11.3%) | 26 (8.5%) |
| 4.0x or more | 234 (65.9%) | 46 (15.1%) |
| Total | 355 (100.0%) | 305 (100.0%) |
Real Estate Taxes by Mortgage Status in Awendaw
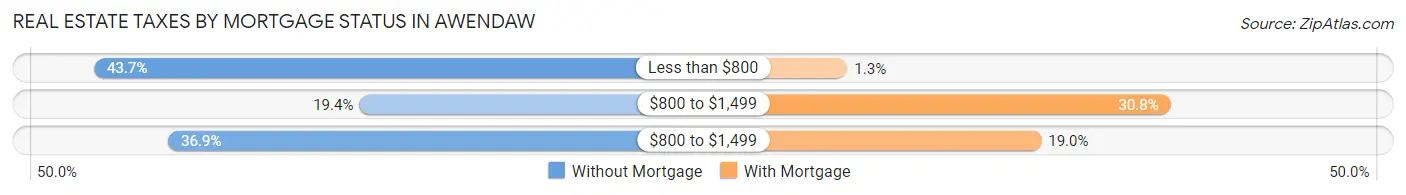
| Property Taxes | Without Mortgage | With Mortgage |
| Less than $800 | 155 (43.7%) | 4 (1.3%) |
| $800 to $1,499 | 69 (19.4%) | 94 (30.8%) |
| $800 to $1,499 | 131 (36.9%) | 58 (19.0%) |
| Total | 355 (100.0%) | 305 (100.0%) |
Health & Disability in Awendaw
Health Insurance Coverage by Age in Awendaw
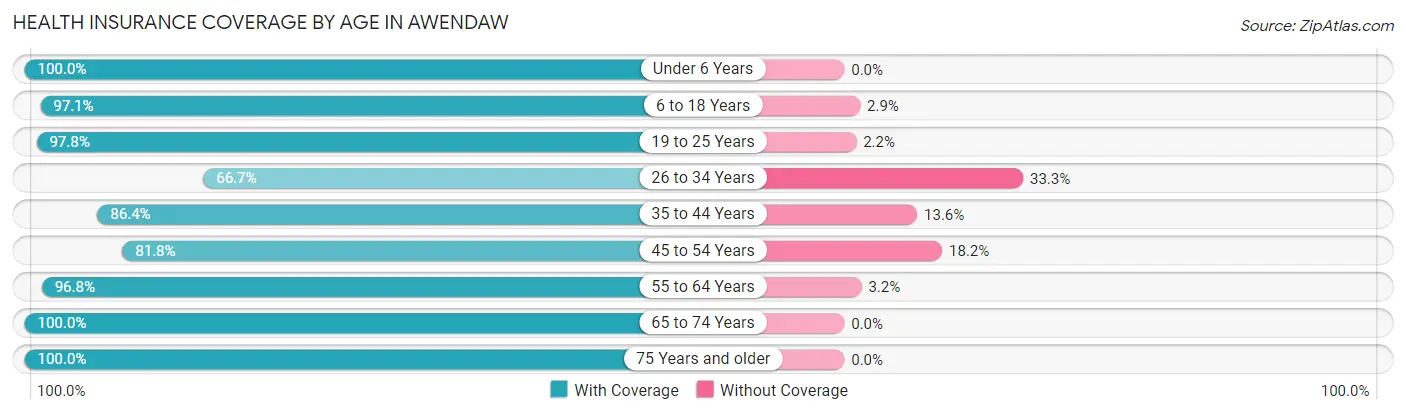
| Age Bracket | With Coverage | Without Coverage |
| Under 6 Years | 44 (100.0%) | 0 (0.0%) |
| 6 to 18 Years | 99 (97.1%) | 3 (2.9%) |
| 19 to 25 Years | 132 (97.8%) | 3 (2.2%) |
| 26 to 34 Years | 54 (66.7%) | 27 (33.3%) |
| 35 to 44 Years | 70 (86.4%) | 11 (13.6%) |
| 45 to 54 Years | 242 (81.8%) | 54 (18.2%) |
| 55 to 64 Years | 272 (96.8%) | 9 (3.2%) |
| 65 to 74 Years | 343 (100.0%) | 0 (0.0%) |
| 75 Years and older | 185 (100.0%) | 0 (0.0%) |
| Total | 1,441 (93.1%) | 107 (6.9%) |
Health Insurance Coverage by Citizenship Status in Awendaw
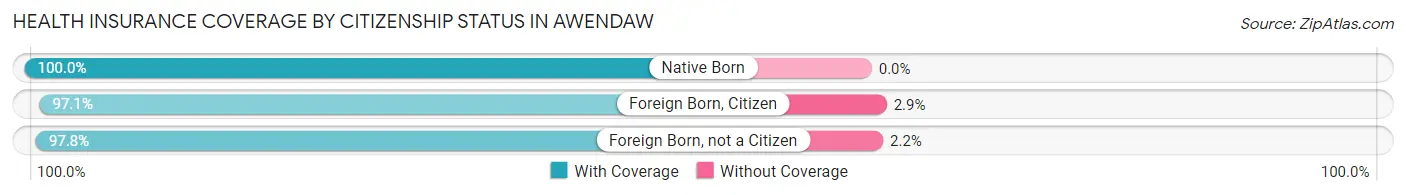
| Citizenship Status | With Coverage | Without Coverage |
| Native Born | 44 (100.0%) | 0 (0.0%) |
| Foreign Born, Citizen | 99 (97.1%) | 3 (2.9%) |
| Foreign Born, not a Citizen | 132 (97.8%) | 3 (2.2%) |
Health Insurance Coverage by Household Income in Awendaw
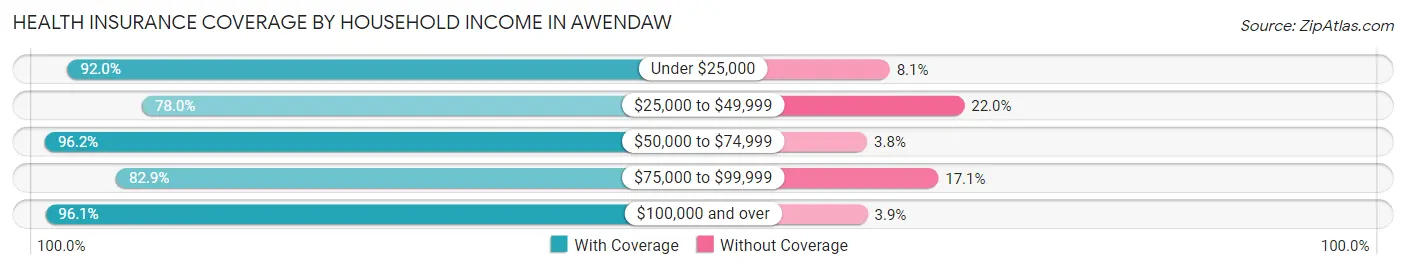
| Household Income | With Coverage | Without Coverage |
| Under $25,000 | 297 (91.9%) | 26 (8.1%) |
| $25,000 to $49,999 | 85 (78.0%) | 24 (22.0%) |
| $50,000 to $74,999 | 403 (96.2%) | 16 (3.8%) |
| $75,000 to $99,999 | 87 (82.9%) | 18 (17.1%) |
| $100,000 and over | 569 (96.1%) | 23 (3.9%) |
Public vs Private Health Insurance Coverage by Age in Awendaw
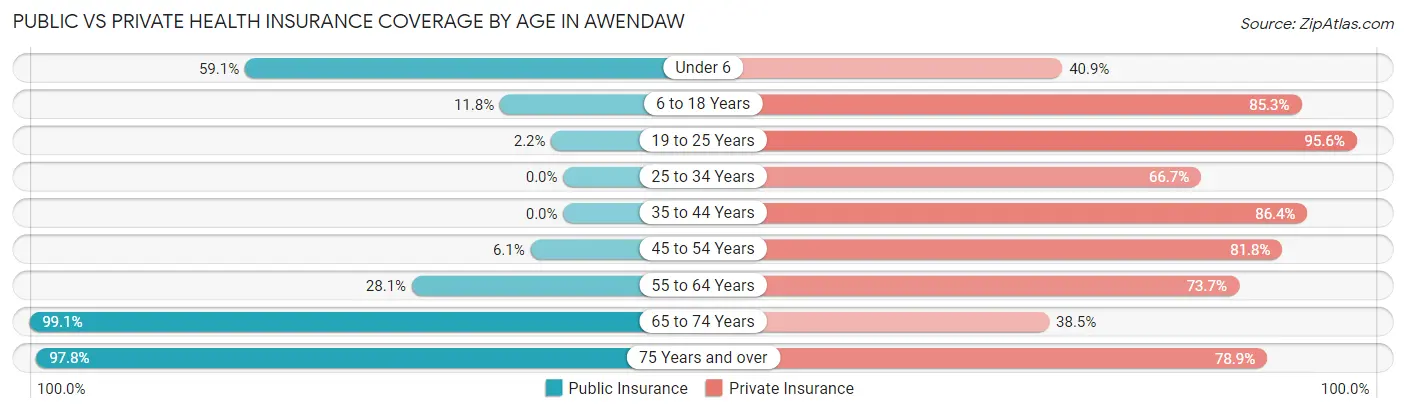
| Age Bracket | Public Insurance | Private Insurance |
| Under 6 | 26 (59.1%) | 18 (40.9%) |
| 6 to 18 Years | 12 (11.8%) | 87 (85.3%) |
| 19 to 25 Years | 3 (2.2%) | 129 (95.6%) |
| 25 to 34 Years | 0 (0.0%) | 54 (66.7%) |
| 35 to 44 Years | 0 (0.0%) | 70 (86.4%) |
| 45 to 54 Years | 18 (6.1%) | 242 (81.8%) |
| 55 to 64 Years | 79 (28.1%) | 207 (73.7%) |
| 65 to 74 Years | 340 (99.1%) | 132 (38.5%) |
| 75 Years and over | 181 (97.8%) | 146 (78.9%) |
| Total | 659 (42.6%) | 1,085 (70.1%) |
Disability Status by Sex by Age in Awendaw
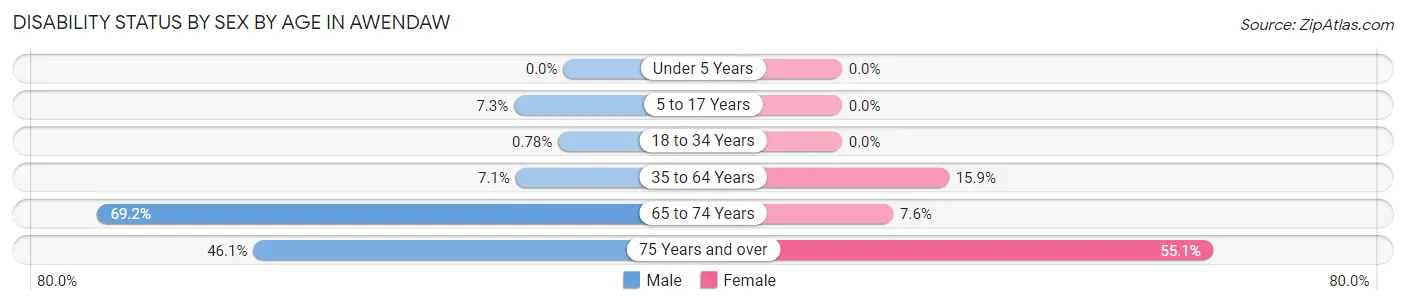
| Age Bracket | Male | Female |
| Under 5 Years | 0 (0.0%) | 0 (0.0%) |
| 5 to 17 Years | 6 (7.3%) | 0 (0.0%) |
| 18 to 34 Years | 1 (0.8%) | 0 (0.0%) |
| 35 to 64 Years | 27 (7.1%) | 44 (15.9%) |
| 65 to 74 Years | 92 (69.2%) | 16 (7.6%) |
| 75 Years and over | 35 (46.1%) | 60 (55.0%) |
Disability Class by Sex by Age in Awendaw
Disability Class: Hearing Difficulty
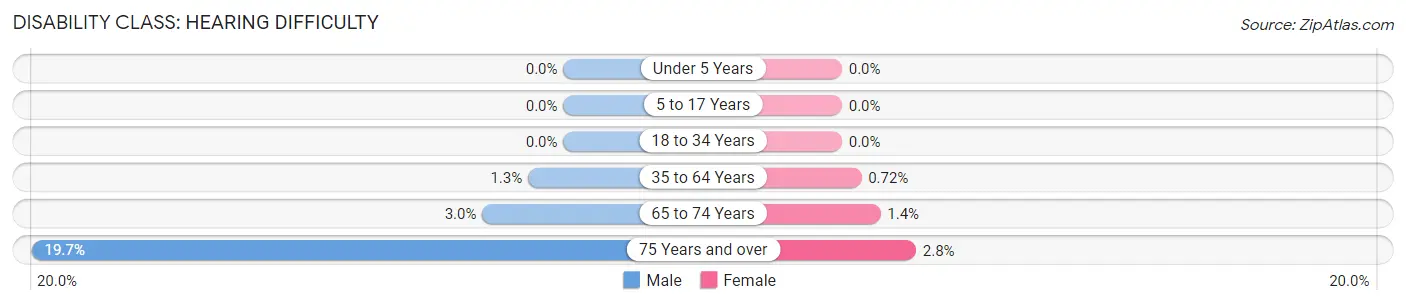
| Age Bracket | Male | Female |
| Under 5 Years | 0 (0.0%) | 0 (0.0%) |
| 5 to 17 Years | 0 (0.0%) | 0 (0.0%) |
| 18 to 34 Years | 0 (0.0%) | 0 (0.0%) |
| 35 to 64 Years | 5 (1.3%) | 2 (0.7%) |
| 65 to 74 Years | 4 (3.0%) | 3 (1.4%) |
| 75 Years and over | 15 (19.7%) | 3 (2.8%) |
Disability Class: Vision Difficulty
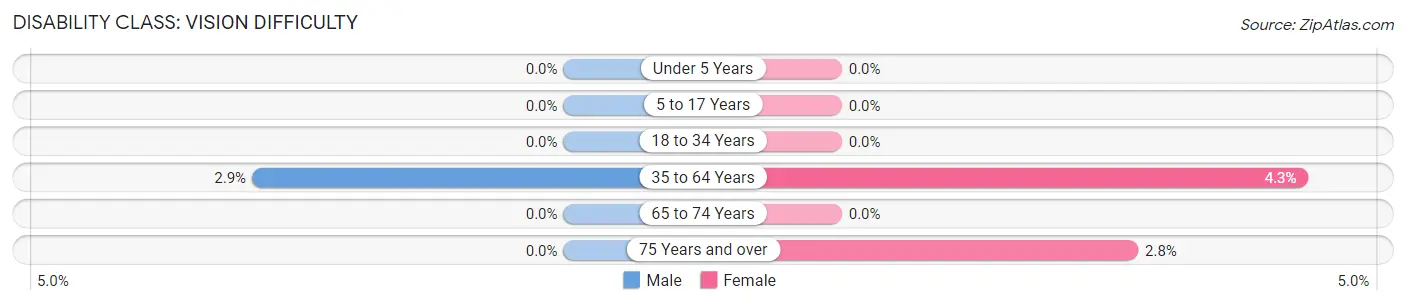
| Age Bracket | Male | Female |
| Under 5 Years | 0 (0.0%) | 0 (0.0%) |
| 5 to 17 Years | 0 (0.0%) | 0 (0.0%) |
| 18 to 34 Years | 0 (0.0%) | 0 (0.0%) |
| 35 to 64 Years | 11 (2.9%) | 12 (4.3%) |
| 65 to 74 Years | 0 (0.0%) | 0 (0.0%) |
| 75 Years and over | 0 (0.0%) | 3 (2.8%) |
Disability Class: Cognitive Difficulty
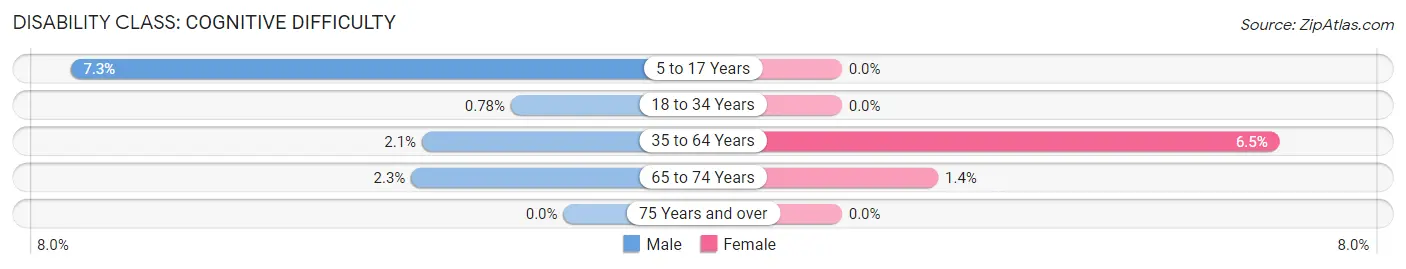
| Age Bracket | Male | Female |
| 5 to 17 Years | 6 (7.3%) | 0 (0.0%) |
| 18 to 34 Years | 1 (0.8%) | 0 (0.0%) |
| 35 to 64 Years | 8 (2.1%) | 18 (6.5%) |
| 65 to 74 Years | 3 (2.3%) | 3 (1.4%) |
| 75 Years and over | 0 (0.0%) | 0 (0.0%) |
Disability Class: Ambulatory Difficulty
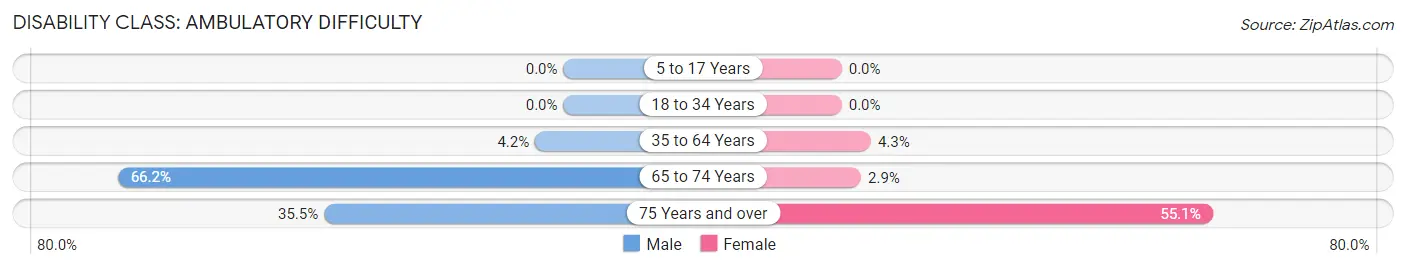
| Age Bracket | Male | Female |
| 5 to 17 Years | 0 (0.0%) | 0 (0.0%) |
| 18 to 34 Years | 0 (0.0%) | 0 (0.0%) |
| 35 to 64 Years | 16 (4.2%) | 12 (4.3%) |
| 65 to 74 Years | 88 (66.2%) | 6 (2.9%) |
| 75 Years and over | 27 (35.5%) | 60 (55.0%) |
Disability Class: Self-Care Difficulty
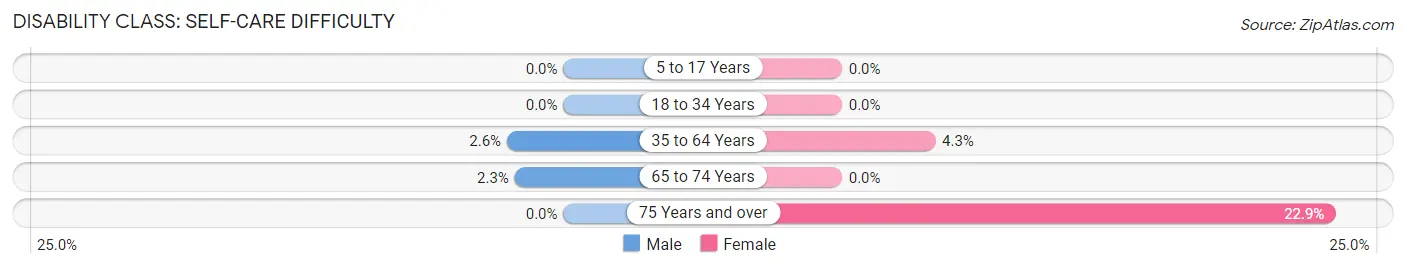
| Age Bracket | Male | Female |
| 5 to 17 Years | 0 (0.0%) | 0 (0.0%) |
| 18 to 34 Years | 0 (0.0%) | 0 (0.0%) |
| 35 to 64 Years | 10 (2.6%) | 12 (4.3%) |
| 65 to 74 Years | 3 (2.3%) | 0 (0.0%) |
| 75 Years and over | 0 (0.0%) | 25 (22.9%) |
Technology Access in Awendaw
Computing Device Access in Awendaw
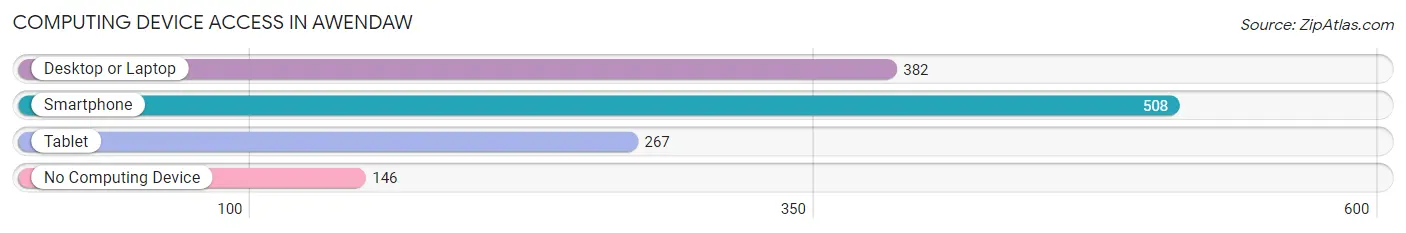
| Device Type | # Households | % Households |
| Desktop or Laptop | 382 | 53.0% |
| Smartphone | 508 | 70.5% |
| Tablet | 267 | 37.0% |
| No Computing Device | 146 | 20.3% |
| Total | 721 | 100.0% |
Internet Access in Awendaw
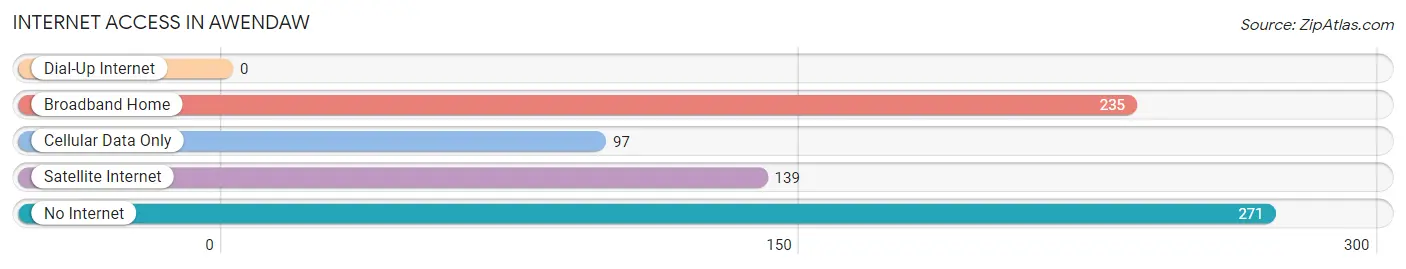
| Internet Type | # Households | % Households |
| Dial-Up Internet | 0 | 0.0% |
| Broadband Home | 235 | 32.6% |
| Cellular Data Only | 97 | 13.5% |
| Satellite Internet | 139 | 19.3% |
| No Internet | 271 | 37.6% |
| Total | 721 | 100.0% |
Awendaw Summary
Awendaw is a small town located in Charleston County, South Carolina. It is situated along the Intracoastal Waterway, approximately 25 miles north of Charleston. The town has a population of approximately 1,000 people and is part of the Charleston-North Charleston-Summerville Metropolitan Statistical Area.
Geography
Awendaw is located in the Lowcountry region of South Carolina, which is characterized by its flat terrain and coastal marshes. The town is situated along the Intracoastal Waterway, which is a navigable waterway that runs along the Atlantic Coast from Maine to Florida. The town is also located near the Francis Marion National Forest, which is a large protected area of forested wetlands and swamps.
The town is located in the Francis Marion National Forest, which is a large protected area of forested wetlands and swamps. The town is also located near the Francis Marion National Forest, which is a large protected area of forested wetlands and swamps. The town is also located near the Francis Marion National Forest, which is a large protected area of forested wetlands and swamps.
The town is located in the Francis Marion National Forest, which is a large protected area of forested wetlands and swamps. The town is also located near the Francis Marion National Forest, which is a large protected area of forested wetlands and swamps. The town is also located near the Francis Marion National Forest, which is a large protected area of forested wetlands and swamps.
The town is located in the Francis Marion National Forest, which is a large protected area of forested wetlands and swamps. The town is also located near the Francis Marion National Forest, which is a large protected area of forested wetlands and swamps. The town is also located near the Francis Marion National Forest, which is a large protected area of forested wetlands and swamps.
The town is located in the Francis Marion National Forest, which is a large protected area of forested wetlands and swamps. The town is also located near the Francis Marion National Forest, which is a large protected area of forested wetlands and swamps. The town is also located near the Francis Marion National Forest, which is a large protected area of forested wetlands and swamps.
History
The town of Awendaw was founded in 1735 by a group of settlers from England. The town was originally known as “Awen”, which is derived from the Welsh word for “river”. The town was later renamed “Awendaw” in 1820.
The town was originally a small fishing village, but it grew in size and importance during the 19th century. The town was a major port for the export of cotton and other goods. The town was also a popular destination for tourists, who came to enjoy the area’s natural beauty and wildlife.
The town was also home to a number of prominent families, including the Middletons, the Pinckneys, and the Draytons. These families were influential in the development of the town and the surrounding area.
Economy
The economy of Awendaw is largely based on tourism and fishing. The town is home to a number of popular tourist attractions, including the Francis Marion National Forest, the Awendaw Creek Nature Preserve, and the Awendaw-McClellanville Historic District.
The town is also home to a number of seafood restaurants, which serve fresh seafood caught in the nearby waters. The town is also home to a number of marinas, which provide access to the Intracoastal Waterway.
Demographics
As of the 2010 census, the population of Awendaw was 1,000 people. The town is predominantly white, with a small African American population. The median household income in the town is $45,000, and the median home value is $150,000.
Conclusion
Awendaw is a small town located in Charleston County, South Carolina. It is situated along the Intracoastal Waterway, approximately 25 miles north of Charleston. The town has a population of approximately 1,000 people and is part of the Charleston-North Charleston-Summerville Metropolitan Statistical Area. The town’s economy is largely based on tourism and fishing, and the town is home to a number of popular tourist attractions. The town is predominantly white, with a small African American population.
Common Questions
What is Per Capita Income in Awendaw?
Per Capita income in Awendaw is $40,491.
What is the Median Family Income in Awendaw?
Median Family Income in Awendaw is $72,100.
What is the Median Household income in Awendaw?
Median Household Income in Awendaw is $63,533.
What is Income or Wage Gap in Awendaw?
Income or Wage Gap in Awendaw is 7.5%.
Women in Awendaw earn 92.5 cents for every dollar earned by a man.
What is Inequality or Gini Index in Awendaw?
Inequality or Gini Index in Awendaw is 0.52.
What is the Total Population of Awendaw?
Total Population of Awendaw is 1,548.
What is the Total Male Population of Awendaw?
Total Male Population of Awendaw is 814.
What is the Total Female Population of Awendaw?
Total Female Population of Awendaw is 734.
What is the Ratio of Males per 100 Females in Awendaw?
There are 110.90 Males per 100 Females in Awendaw.
What is the Ratio of Females per 100 Males in Awendaw?
There are 90.17 Females per 100 Males in Awendaw.
What is the Median Population Age in Awendaw?
Median Population Age in Awendaw is 57.8 Years.
What is the Average Family Size in Awendaw
Average Family Size in Awendaw is 2.7 People.
What is the Average Household Size in Awendaw
Average Household Size in Awendaw is 2.1 People.
How Large is the Labor Force in Awendaw?
There are 749 People in the Labor Forcein in Awendaw.
What is the Percentage of People in the Labor Force in Awendaw?
52.5% of People are in the Labor Force in Awendaw.
What is the Unemployment Rate in Awendaw?
Unemployment Rate in Awendaw is 12.6%.