Easley, SC Map & Demographics
Easley Map
Easley Overview
$44,672
PER CAPITA INCOME
$79,151
AVG FAMILY INCOME
$62,551
AVG HOUSEHOLD INCOME
33.1%
WAGE / INCOME GAP [ % ]
66.9¢/ $1
WAGE / INCOME GAP [ $ ]
$10,473
FAMILY INCOME DEFICIT
0.56
INEQUALITY / GINI INDEX
23,135
TOTAL POPULATION
10,902
MALE POPULATION
12,233
FEMALE POPULATION
89.12
MALES / 100 FEMALES
112.21
FEMALES / 100 MALES
42.8
MEDIAN AGE
2.8
AVG FAMILY SIZE
2.2
AVG HOUSEHOLD SIZE
11,646
LABOR FORCE [ PEOPLE ]
60.3%
PERCENT IN LABOR FORCE
3.8%
UNEMPLOYMENT RATE
Easley Area Codes
Income in Easley
Income Overview in Easley
Per Capita Income in Easley is $44,672, while median incomes of families and households are $79,151 and $62,551 respectively.
| Characteristic | Number | Measure |
| Per Capita Income | 23,135 | $44,672 |
| Median Family Income | 6,329 | $79,151 |
| Mean Family Income | 6,329 | $133,131 |
| Median Household Income | 10,252 | $62,551 |
| Mean Household Income | 10,252 | $98,750 |
| Income Deficit | 6,329 | $10,473 |
| Wage / Income Gap (%) | 23,135 | 33.14% |
| Wage / Income Gap ($) | 23,135 | 66.86¢ per $1 |
| Gini / Inequality Index | 23,135 | 0.56 |
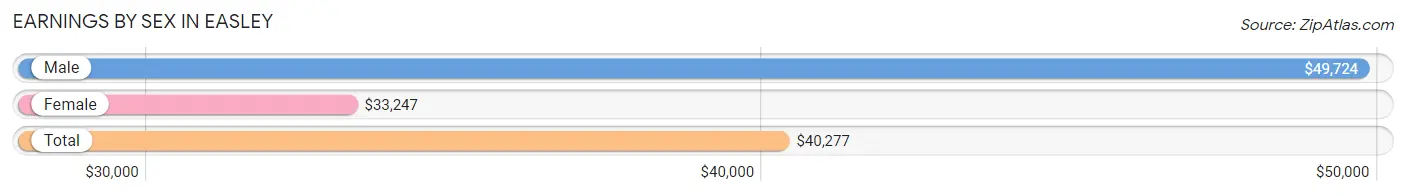
Earnings by Sex in Easley
Average Earnings in Easley are $40,277, $49,724 for men and $33,247 for women, a difference of 33.1%.
| Sex | Number | Average Earnings |
| Male | 6,575 (51.9%) | $49,724 |
| Female | 6,089 (48.1%) | $33,247 |
| Total | 12,664 (100.0%) | $40,277 |
Earnings by Sex by Income Bracket in Easley
The most common earnings brackets in Easley are $100,000+ for men (1,271 | 19.3%) and $25,000 to $29,999 for women (518 | 8.5%).
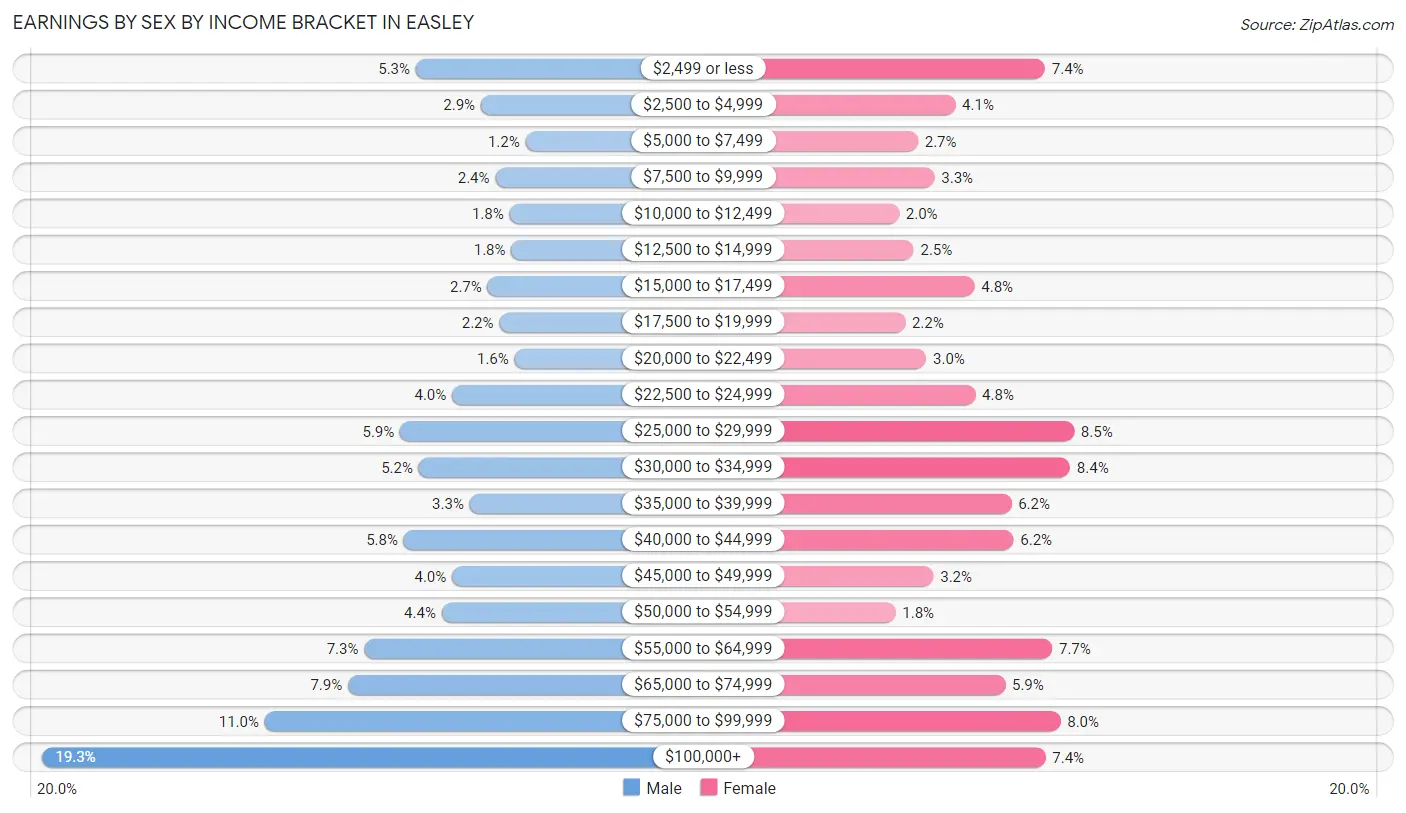
| Income | Male | Female |
| $2,499 or less | 351 (5.3%) | 452 (7.4%) |
| $2,500 to $4,999 | 191 (2.9%) | 247 (4.1%) |
| $5,000 to $7,499 | 81 (1.2%) | 162 (2.7%) |
| $7,500 to $9,999 | 155 (2.4%) | 200 (3.3%) |
| $10,000 to $12,499 | 120 (1.8%) | 119 (1.9%) |
| $12,500 to $14,999 | 116 (1.8%) | 152 (2.5%) |
| $15,000 to $17,499 | 174 (2.6%) | 291 (4.8%) |
| $17,500 to $19,999 | 145 (2.2%) | 133 (2.2%) |
| $20,000 to $22,499 | 108 (1.6%) | 181 (3.0%) |
| $22,500 to $24,999 | 262 (4.0%) | 293 (4.8%) |
| $25,000 to $29,999 | 390 (5.9%) | 518 (8.5%) |
| $30,000 to $34,999 | 344 (5.2%) | 509 (8.4%) |
| $35,000 to $39,999 | 218 (3.3%) | 375 (6.2%) |
| $40,000 to $44,999 | 381 (5.8%) | 380 (6.2%) |
| $45,000 to $49,999 | 262 (4.0%) | 197 (3.2%) |
| $50,000 to $54,999 | 287 (4.4%) | 111 (1.8%) |
| $55,000 to $64,999 | 478 (7.3%) | 468 (7.7%) |
| $65,000 to $74,999 | 518 (7.9%) | 361 (5.9%) |
| $75,000 to $99,999 | 723 (11.0%) | 487 (8.0%) |
| $100,000+ | 1,271 (19.3%) | 453 (7.4%) |
| Total | 6,575 (100.0%) | 6,089 (100.0%) |
Earnings by Sex by Educational Attainment in Easley
Average earnings in Easley are $59,306 for men and $35,339 for women, a difference of 40.4%. Men with an educational attainment of graduate degree enjoy the highest average annual earnings of $104,511, while those with less than high school education earn the least with $21,688. Women with an educational attainment of graduate degree earn the most with the average annual earnings of $68,247, while those with less than high school education have the smallest earnings of $23,148.
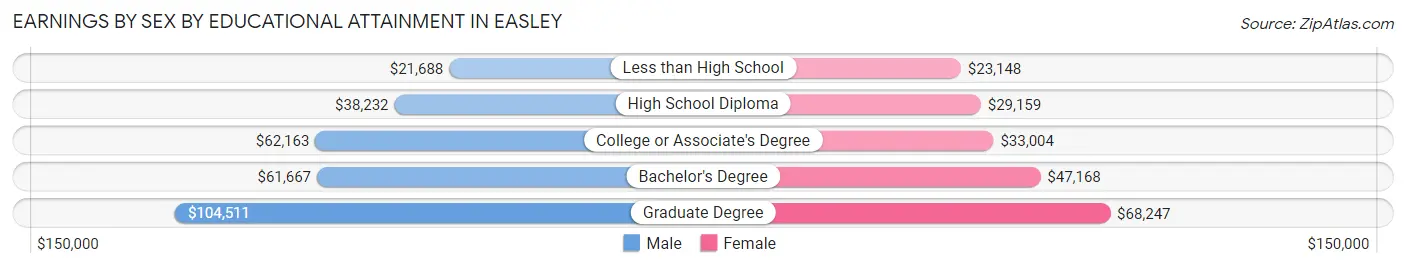
| Educational Attainment | Male Income | Female Income |
| Less than High School | $21,688 | $23,148 |
| High School Diploma | $38,232 | $29,159 |
| College or Associate's Degree | $62,163 | $33,004 |
| Bachelor's Degree | $61,667 | $47,168 |
| Graduate Degree | $104,511 | $68,247 |
| Total | $59,306 | $35,339 |
Family Income in Easley
Family Income Brackets in Easley
According to the Easley family income data, there are 1,411 families falling into the $100,000 to $149,999 income range, which is the most common income bracket and makes up 22.3% of all families. Conversely, the $10,000 to $14,999 income bracket is the least frequent group with only 51 families (0.8%) belonging to this category.
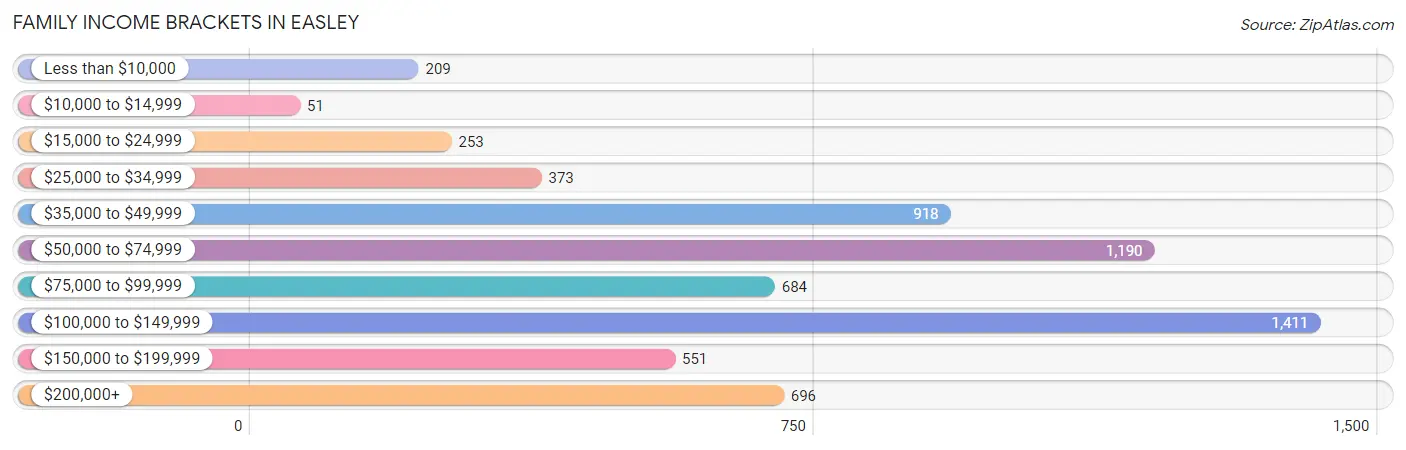
| Income Bracket | # Families | % Families |
| Less than $10,000 | 209 | 3.3% |
| $10,000 to $14,999 | 51 | 0.8% |
| $15,000 to $24,999 | 253 | 4.0% |
| $25,000 to $34,999 | 373 | 5.9% |
| $35,000 to $49,999 | 918 | 14.5% |
| $50,000 to $74,999 | 1,190 | 18.8% |
| $75,000 to $99,999 | 684 | 10.8% |
| $100,000 to $149,999 | 1,411 | 22.3% |
| $150,000 to $199,999 | 551 | 8.7% |
| $200,000+ | 696 | 11.0% |
Family Income by Famaliy Size in Easley
6-person families (80 | 1.3%) account for the highest median family income in Easley with $200,071 per family, while 6-person families (80 | 1.3%) have the highest median income of $33,345 per family member.
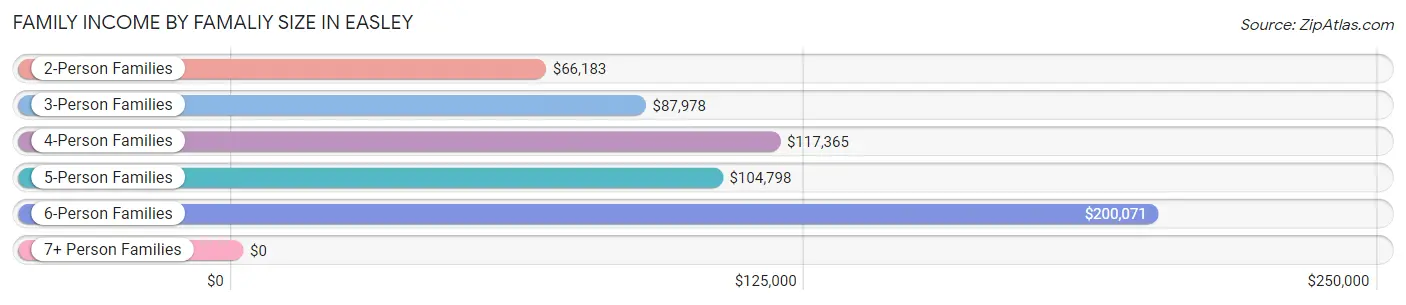
| Income Bracket | # Families | Median Income |
| 2-Person Families | 2,979 (47.1%) | $66,183 |
| 3-Person Families | 2,019 (31.9%) | $87,978 |
| 4-Person Families | 831 (13.1%) | $117,365 |
| 5-Person Families | 403 (6.4%) | $104,798 |
| 6-Person Families | 80 (1.3%) | $200,071 |
| 7+ Person Families | 17 (0.3%) | $0 |
| Total | 6,329 (100.0%) | $79,151 |
Family Income by Number of Earners in Easley
The median family income in Easley is $79,151, with families comprising 3+ earners (847) having the highest median family income of $164,396, while families with no earners (934) have the lowest median family income of $42,100, accounting for 13.4% and 14.8% of families, respectively.
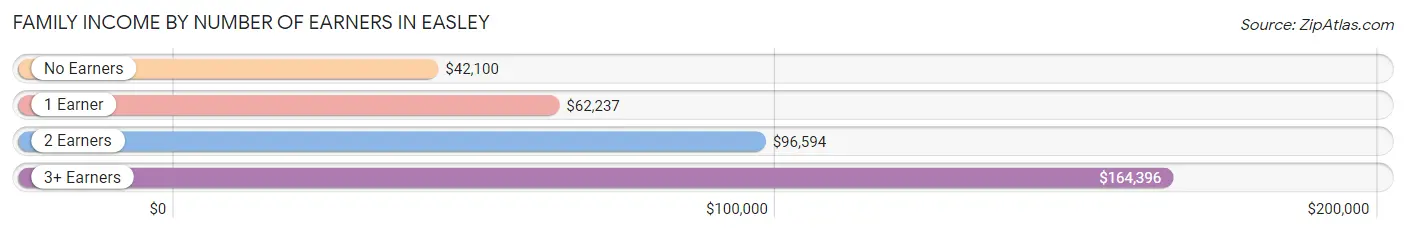
| Number of Earners | # Families | Median Income |
| No Earners | 934 (14.8%) | $42,100 |
| 1 Earner | 1,854 (29.3%) | $62,237 |
| 2 Earners | 2,694 (42.6%) | $96,594 |
| 3+ Earners | 847 (13.4%) | $164,396 |
| Total | 6,329 (100.0%) | $79,151 |
Household Income in Easley
Household Income Brackets in Easley
With 1,804 households falling in the category, the $50,000 to $74,999 income range is the most frequent in Easley, accounting for 17.6% of all households. In contrast, only 472 households (4.6%) fall into the $10,000 to $14,999 income bracket, making it the least populous group.
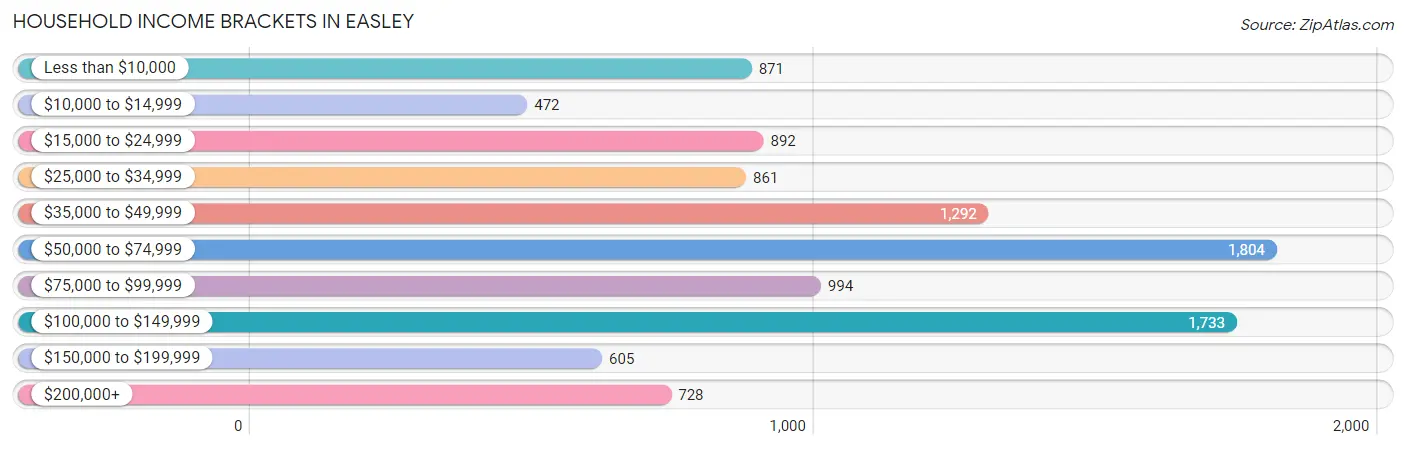
| Income Bracket | # Households | % Households |
| Less than $10,000 | 871 | 8.5% |
| $10,000 to $14,999 | 472 | 4.6% |
| $15,000 to $24,999 | 892 | 8.7% |
| $25,000 to $34,999 | 861 | 8.4% |
| $35,000 to $49,999 | 1,292 | 12.6% |
| $50,000 to $74,999 | 1,804 | 17.6% |
| $75,000 to $99,999 | 994 | 9.7% |
| $100,000 to $149,999 | 1,733 | 16.9% |
| $150,000 to $199,999 | 605 | 5.9% |
| $200,000+ | 728 | 7.1% |
Household Income by Householder Age in Easley
The median household income in Easley is $62,551, with the highest median household income of $88,224 found in the 45 to 64 years age bracket for the primary householder. A total of 3,311 households (32.3%) fall into this category. Meanwhile, the 65+ years age bracket for the primary householder has the lowest median household income of $41,268, with 3,259 households (31.8%) in this group.
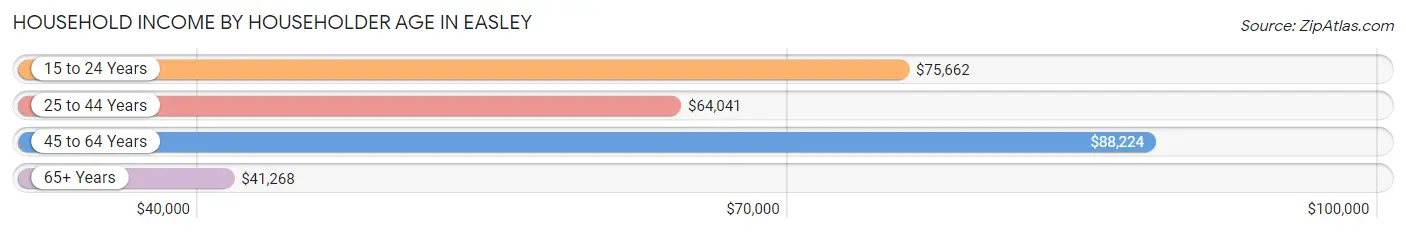
| Income Bracket | # Households | Median Income |
| 15 to 24 Years | 173 (1.7%) | $75,662 |
| 25 to 44 Years | 3,509 (34.2%) | $64,041 |
| 45 to 64 Years | 3,311 (32.3%) | $88,224 |
| 65+ Years | 3,259 (31.8%) | $41,268 |
| Total | 10,252 (100.0%) | $62,551 |
Poverty in Easley
Income Below Poverty by Sex and Age in Easley
With 10.4% poverty level for males and 14.6% for females among the residents of Easley, 15 year old males and 35 to 44 year old females are the most vulnerable to poverty, with 19 males (54.3%) and 592 females (36.2%) in their respective age groups living below the poverty level.
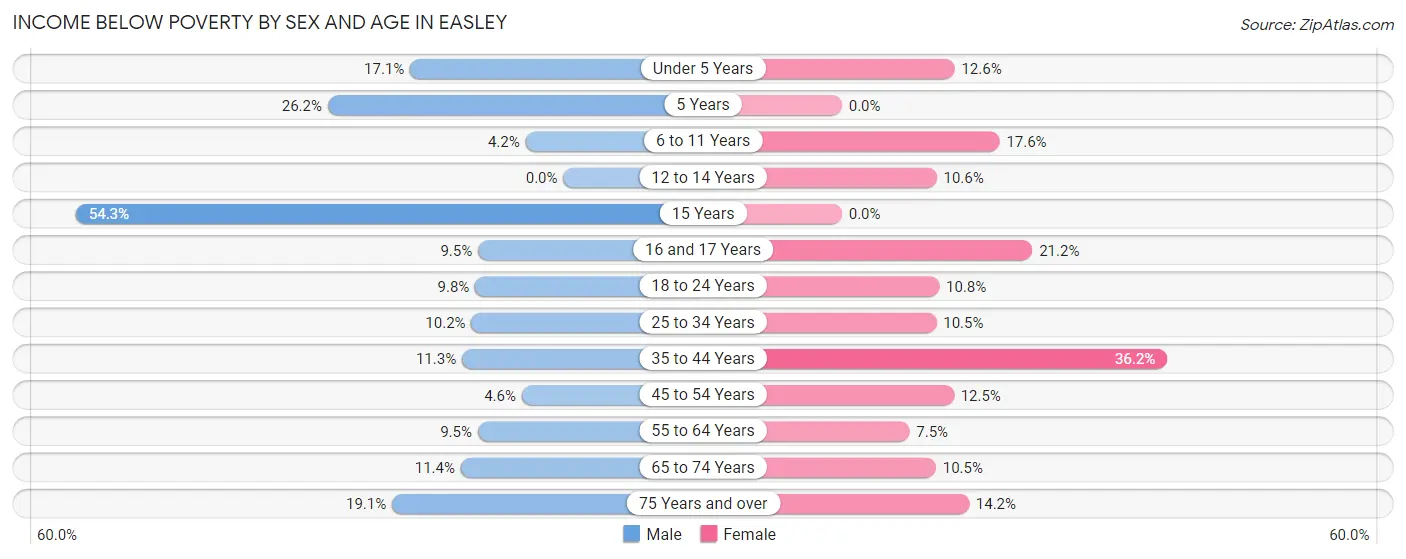
| Age Bracket | Male | Female |
| Under 5 Years | 139 (17.1%) | 68 (12.6%) |
| 5 Years | 16 (26.2%) | 0 (0.0%) |
| 6 to 11 Years | 28 (4.2%) | 125 (17.6%) |
| 12 to 14 Years | 0 (0.0%) | 40 (10.5%) |
| 15 Years | 19 (54.3%) | 0 (0.0%) |
| 16 and 17 Years | 40 (9.5%) | 42 (21.2%) |
| 18 to 24 Years | 78 (9.8%) | 66 (10.8%) |
| 25 to 34 Years | 165 (10.2%) | 189 (10.5%) |
| 35 to 44 Years | 142 (11.3%) | 592 (36.2%) |
| 45 to 54 Years | 53 (4.6%) | 185 (12.5%) |
| 55 to 64 Years | 183 (9.5%) | 121 (7.5%) |
| 65 to 74 Years | 136 (11.4%) | 164 (10.5%) |
| 75 Years and over | 128 (19.1%) | 166 (14.1%) |
| Total | 1,127 (10.4%) | 1,758 (14.6%) |
Income Above Poverty by Sex and Age in Easley
According to the poverty statistics in Easley, males aged 12 to 14 years and females aged 5 years are the age groups that are most secure financially, with 100.0% of males and 100.0% of females in these age groups living above the poverty line.
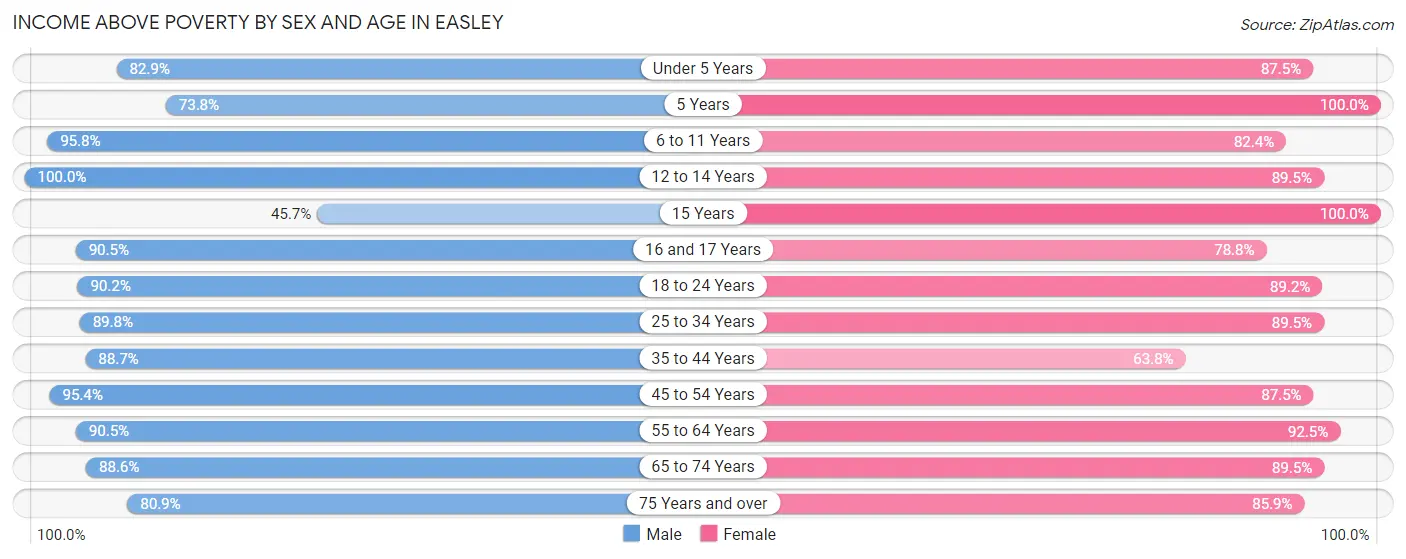
| Age Bracket | Male | Female |
| Under 5 Years | 676 (82.9%) | 474 (87.5%) |
| 5 Years | 45 (73.8%) | 120 (100.0%) |
| 6 to 11 Years | 637 (95.8%) | 587 (82.4%) |
| 12 to 14 Years | 206 (100.0%) | 339 (89.4%) |
| 15 Years | 16 (45.7%) | 175 (100.0%) |
| 16 and 17 Years | 381 (90.5%) | 156 (78.8%) |
| 18 to 24 Years | 716 (90.2%) | 543 (89.2%) |
| 25 to 34 Years | 1,447 (89.8%) | 1,607 (89.5%) |
| 35 to 44 Years | 1,116 (88.7%) | 1,042 (63.8%) |
| 45 to 54 Years | 1,092 (95.4%) | 1,300 (87.5%) |
| 55 to 64 Years | 1,738 (90.5%) | 1,488 (92.5%) |
| 65 to 74 Years | 1,055 (88.6%) | 1,402 (89.5%) |
| 75 Years and over | 543 (80.9%) | 1,007 (85.9%) |
| Total | 9,668 (89.6%) | 10,240 (85.4%) |
Income Below Poverty Among Married-Couple Families in Easley
The poverty statistics for married-couple families in Easley show that 4.0% or 199 of the total 4,949 families live below the poverty line. Families with 1 or 2 children have the highest poverty rate of 4.4%, comprising of 62 families. On the other hand, families with 3 or 4 children have the lowest poverty rate of 0.0%, which includes 0 families.
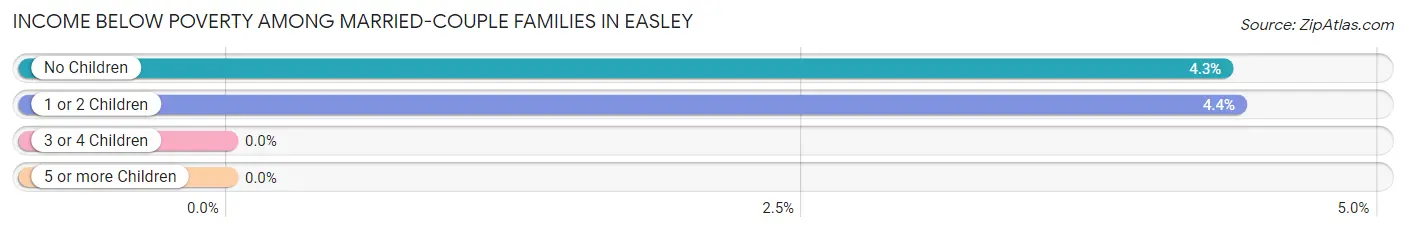
| Children | Above Poverty | Below Poverty |
| No Children | 3,026 (95.7%) | 137 (4.3%) |
| 1 or 2 Children | 1,349 (95.6%) | 62 (4.4%) |
| 3 or 4 Children | 375 (100.0%) | 0 (0.0%) |
| 5 or more Children | 0 (0.0%) | 0 (0.0%) |
| Total | 4,750 (96.0%) | 199 (4.0%) |
Income Below Poverty Among Single-Parent Households in Easley
According to the poverty data in Easley, 35.2% or 114 single-father households and 14.6% or 154 single-mother households are living below the poverty line. Among single-father households, those with 3 or 4 children have the highest poverty rate, with 41 households (100.0%) experiencing poverty. Likewise, among single-mother households, those with 1 or 2 children have the highest poverty rate, with 133 households (24.3%) falling below the poverty line.
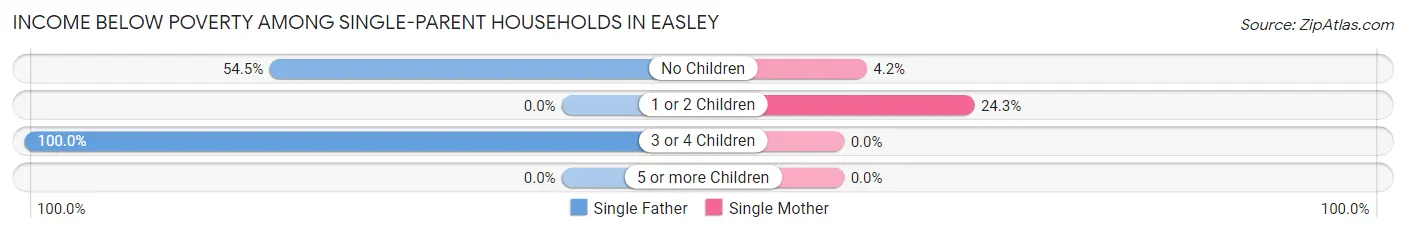
| Children | Single Father | Single Mother |
| No Children | 73 (54.5%) | 21 (4.2%) |
| 1 or 2 Children | 0 (0.0%) | 133 (24.3%) |
| 3 or 4 Children | 41 (100.0%) | 0 (0.0%) |
| 5 or more Children | 0 (0.0%) | 0 (0.0%) |
| Total | 114 (35.2%) | 154 (14.6%) |
Income Below Poverty Among Married-Couple vs Single-Parent Households in Easley
The poverty data for Easley shows that 199 of the married-couple family households (4.0%) and 268 of the single-parent households (19.4%) are living below the poverty level. Within the married-couple family households, those with 1 or 2 children have the highest poverty rate, with 62 households (4.4%) falling below the poverty line. Among the single-parent households, those with 3 or 4 children have the highest poverty rate, with 41 household (80.4%) living below poverty.
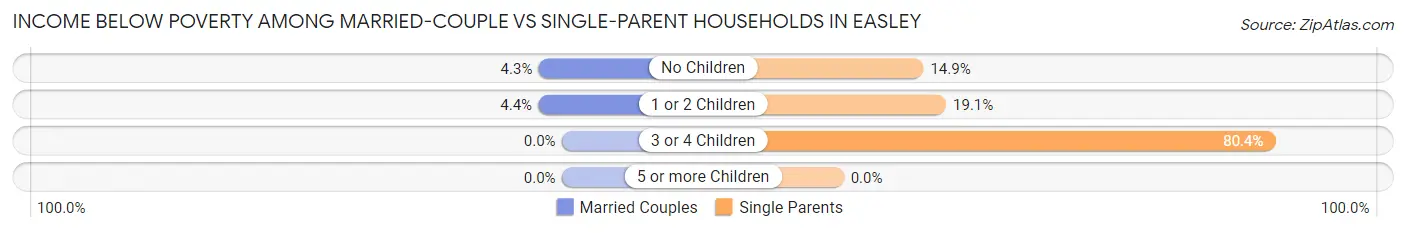
| Children | Married-Couple Families | Single-Parent Households |
| No Children | 137 (4.3%) | 94 (14.9%) |
| 1 or 2 Children | 62 (4.4%) | 133 (19.1%) |
| 3 or 4 Children | 0 (0.0%) | 41 (80.4%) |
| 5 or more Children | 0 (0.0%) | 0 (0.0%) |
| Total | 199 (4.0%) | 268 (19.4%) |
Race in Easley
The most populous races in Easley are White / Caucasian (19,175 | 82.9%), Black / African American (2,328 | 10.1%), and Hispanic or Latino (1,306 | 5.7%).
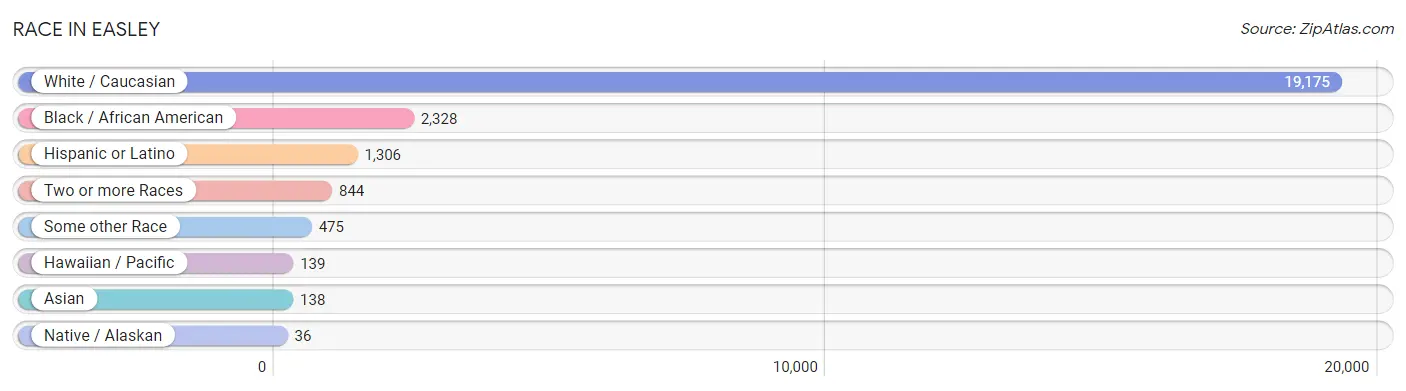
| Race | # Population | % Population |
| Asian | 138 | 0.6% |
| Black / African American | 2,328 | 10.1% |
| Hawaiian / Pacific | 139 | 0.6% |
| Hispanic or Latino | 1,306 | 5.7% |
| Native / Alaskan | 36 | 0.2% |
| White / Caucasian | 19,175 | 82.9% |
| Two or more Races | 844 | 3.6% |
| Some other Race | 475 | 2.1% |
| Total | 23,135 | 100.0% |
Ancestry in Easley
The most populous ancestries reported in Easley are English (3,141 | 13.6%), German (2,957 | 12.8%), American (2,657 | 11.5%), Irish (2,594 | 11.2%), and Mexican (724 | 3.1%), together accounting for 52.2% of all Easley residents.
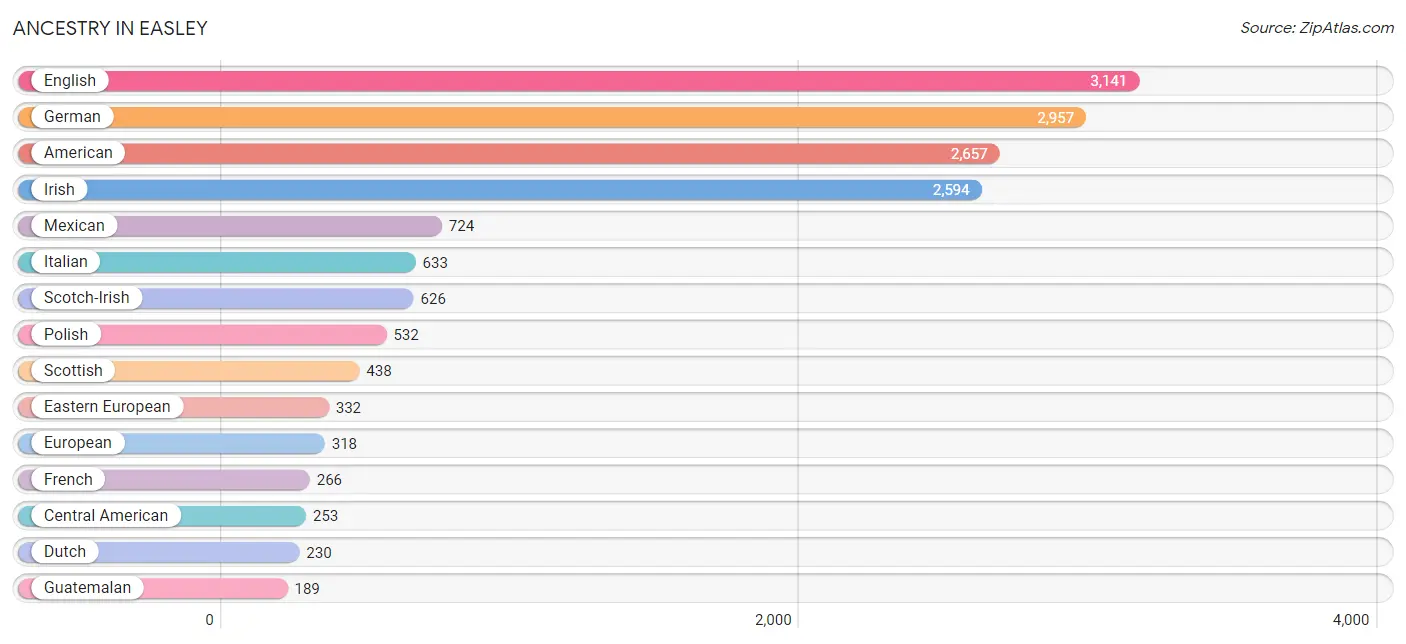
| Ancestry | # Population | % Population |
| African | 13 | 0.1% |
| Aleut | 6 | 0.0% |
| American | 2,657 | 11.5% |
| Arab | 34 | 0.2% |
| Argentinean | 31 | 0.1% |
| Austrian | 40 | 0.2% |
| Belgian | 26 | 0.1% |
| Bhutanese | 10 | 0.0% |
| British | 176 | 0.8% |
| Burmese | 33 | 0.1% |
| Canadian | 31 | 0.1% |
| Celtic | 7 | 0.0% |
| Central American | 253 | 1.1% |
| Central American Indian | 11 | 0.1% |
| Cherokee | 61 | 0.3% |
| Colombian | 29 | 0.1% |
| Creek | 6 | 0.0% |
| Cuban | 53 | 0.2% |
| Czechoslovakian | 29 | 0.1% |
| Danish | 23 | 0.1% |
| Dutch | 230 | 1.0% |
| Eastern European | 332 | 1.4% |
| English | 3,141 | 13.6% |
| European | 318 | 1.4% |
| Finnish | 27 | 0.1% |
| French | 266 | 1.1% |
| French Canadian | 21 | 0.1% |
| German | 2,957 | 12.8% |
| Greek | 109 | 0.5% |
| Guatemalan | 189 | 0.8% |
| Honduran | 40 | 0.2% |
| Hungarian | 36 | 0.2% |
| Indian (Asian) | 4 | 0.0% |
| Irish | 2,594 | 11.2% |
| Italian | 633 | 2.7% |
| Jamaican | 10 | 0.0% |
| Korean | 63 | 0.3% |
| Latvian | 11 | 0.1% |
| Lebanese | 20 | 0.1% |
| Lithuanian | 60 | 0.3% |
| Lumbee | 16 | 0.1% |
| Mexican | 724 | 3.1% |
| Mexican American Indian | 25 | 0.1% |
| Mongolian | 7 | 0.0% |
| Native Hawaiian | 44 | 0.2% |
| Northern European | 27 | 0.1% |
| Norwegian | 183 | 0.8% |
| Pakistani | 19 | 0.1% |
| Peruvian | 14 | 0.1% |
| Polish | 532 | 2.3% |
| Portuguese | 23 | 0.1% |
| Romanian | 11 | 0.1% |
| Russian | 158 | 0.7% |
| Salvadoran | 24 | 0.1% |
| Samoan | 118 | 0.5% |
| Scandinavian | 13 | 0.1% |
| Scotch-Irish | 626 | 2.7% |
| Scottish | 438 | 1.9% |
| South African | 30 | 0.1% |
| South American | 91 | 0.4% |
| Spanish | 47 | 0.2% |
| Subsaharan African | 43 | 0.2% |
| Swedish | 50 | 0.2% |
| Swiss | 16 | 0.1% |
| Syrian | 14 | 0.1% |
| Thai | 57 | 0.3% |
| Turkish | 17 | 0.1% |
| Venezuelan | 17 | 0.1% |
| Welsh | 131 | 0.6% |
| West Indian | 43 | 0.2% | View All 70 Rows |
Immigrants in Easley
The most numerous immigrant groups reported in Easley came from Latin America (603 | 2.6%), Central America (468 | 2.0%), Mexico (257 | 1.1%), Europe (218 | 0.9%), and Guatemala (142 | 0.6%), together accounting for 7.3% of all Easley residents.
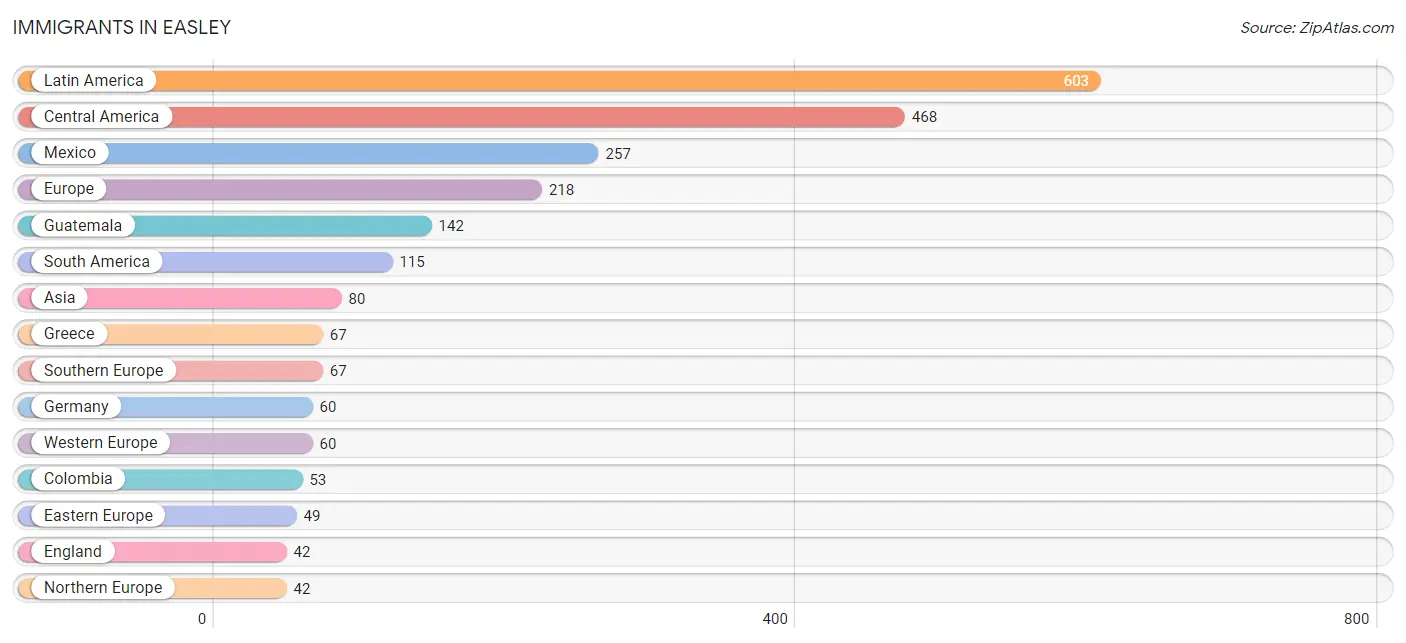
| Immigration Origin | # Population | % Population |
| Africa | 30 | 0.1% |
| Argentina | 31 | 0.1% |
| Asia | 80 | 0.4% |
| Bulgaria | 17 | 0.1% |
| Canada | 41 | 0.2% |
| Caribbean | 20 | 0.1% |
| Central America | 468 | 2.0% |
| China | 4 | 0.0% |
| Colombia | 53 | 0.2% |
| Cuba | 8 | 0.0% |
| Eastern Asia | 14 | 0.1% |
| Eastern Europe | 49 | 0.2% |
| England | 42 | 0.2% |
| Europe | 218 | 0.9% |
| Germany | 60 | 0.3% |
| Greece | 67 | 0.3% |
| Guatemala | 142 | 0.6% |
| Honduras | 40 | 0.2% |
| India | 30 | 0.1% |
| Japan | 10 | 0.0% |
| Latin America | 603 | 2.6% |
| Malaysia | 7 | 0.0% |
| Mexico | 257 | 1.1% |
| Micronesia | 21 | 0.1% |
| Northern Europe | 42 | 0.2% |
| Oceania | 21 | 0.1% |
| Panama | 29 | 0.1% |
| Peru | 14 | 0.1% |
| Philippines | 15 | 0.1% |
| Poland | 32 | 0.1% |
| South Africa | 30 | 0.1% |
| South America | 115 | 0.5% |
| South Central Asia | 30 | 0.1% |
| South Eastern Asia | 22 | 0.1% |
| Southern Europe | 67 | 0.3% |
| Syria | 14 | 0.1% |
| Venezuela | 17 | 0.1% |
| Western Asia | 14 | 0.1% |
| Western Europe | 60 | 0.3% | View All 39 Rows |
Sex and Age in Easley
Sex and Age in Easley
The most populous age groups in Easley are 55 to 59 Years (974 | 8.9%) for men and 60 to 64 Years (1,078 | 8.8%) for women.
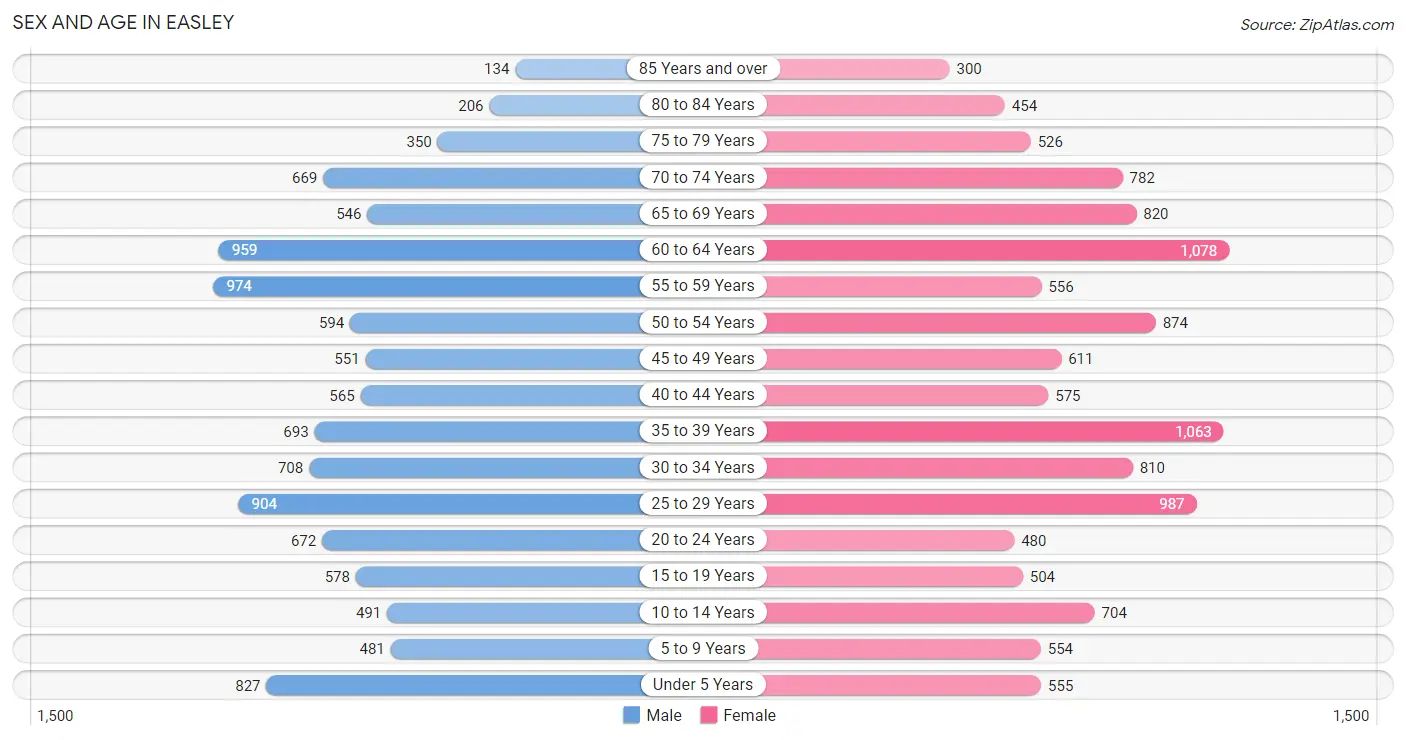
| Age Bracket | Male | Female |
| Under 5 Years | 827 (7.6%) | 555 (4.5%) |
| 5 to 9 Years | 481 (4.4%) | 554 (4.5%) |
| 10 to 14 Years | 491 (4.5%) | 704 (5.8%) |
| 15 to 19 Years | 578 (5.3%) | 504 (4.1%) |
| 20 to 24 Years | 672 (6.2%) | 480 (3.9%) |
| 25 to 29 Years | 904 (8.3%) | 987 (8.1%) |
| 30 to 34 Years | 708 (6.5%) | 810 (6.6%) |
| 35 to 39 Years | 693 (6.4%) | 1,063 (8.7%) |
| 40 to 44 Years | 565 (5.2%) | 575 (4.7%) |
| 45 to 49 Years | 551 (5.1%) | 611 (5.0%) |
| 50 to 54 Years | 594 (5.4%) | 874 (7.1%) |
| 55 to 59 Years | 974 (8.9%) | 556 (4.5%) |
| 60 to 64 Years | 959 (8.8%) | 1,078 (8.8%) |
| 65 to 69 Years | 546 (5.0%) | 820 (6.7%) |
| 70 to 74 Years | 669 (6.1%) | 782 (6.4%) |
| 75 to 79 Years | 350 (3.2%) | 526 (4.3%) |
| 80 to 84 Years | 206 (1.9%) | 454 (3.7%) |
| 85 Years and over | 134 (1.2%) | 300 (2.5%) |
| Total | 10,902 (100.0%) | 12,233 (100.0%) |
Families and Households in Easley
Median Family Size in Easley
The median family size in Easley is 2.81 persons per family, with single male/father families (324 | 5.1%) accounting for the largest median family size of 2.86 persons per family. On the other hand, single female/mother families (1,056 | 16.7%) represent the smallest median family size with 2.79 persons per family.
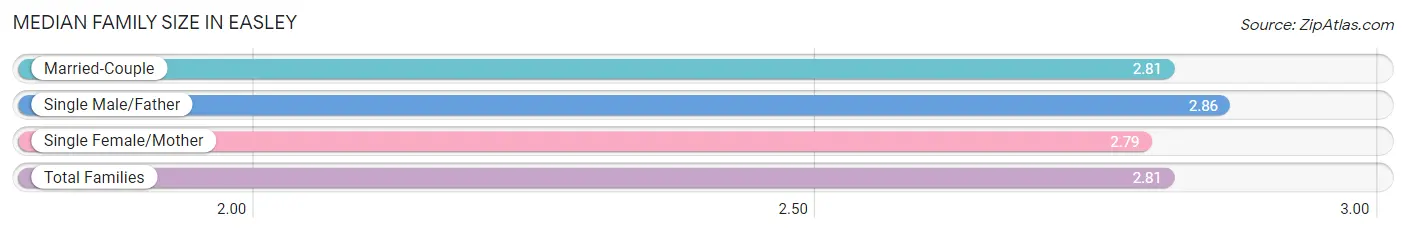
| Family Type | # Families | Family Size |
| Married-Couple | 4,949 (78.2%) | 2.81 |
| Single Male/Father | 324 (5.1%) | 2.86 |
| Single Female/Mother | 1,056 (16.7%) | 2.79 |
| Total Families | 6,329 (100.0%) | 2.81 |
Median Household Size in Easley
The median household size in Easley is 2.23 persons per household, with single male/father households (324 | 3.2%) accounting for the largest median household size of 3.52 persons per household. non-family households (3,923 | 38.3%) represent the smallest median household size with 1.18 persons per household.
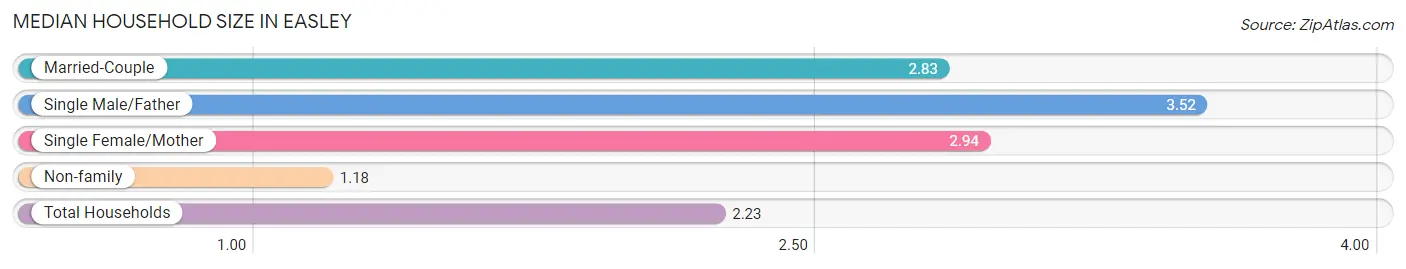
| Household Type | # Households | Household Size |
| Married-Couple | 4,949 (48.3%) | 2.83 |
| Single Male/Father | 324 (3.2%) | 3.52 |
| Single Female/Mother | 1,056 (10.3%) | 2.94 |
| Non-family | 3,923 (38.3%) | 1.18 |
| Total Households | 10,252 (100.0%) | 2.23 |
Household Size by Marriage Status in Easley
Out of a total of 10,252 households in Easley, 6,329 (61.7%) are family households, while 3,923 (38.3%) are nonfamily households. The most numerous type of family households are 2-person households, comprising 2,877, and the most common type of nonfamily households are 1-person households, comprising 3,386.
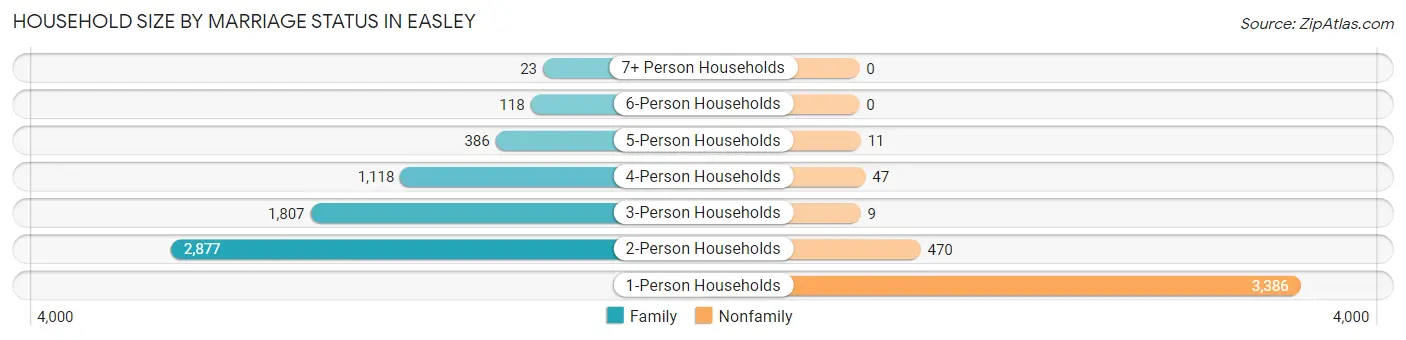
| Household Size | Family Households | Nonfamily Households |
| 1-Person Households | - | 3,386 (33.0%) |
| 2-Person Households | 2,877 (28.1%) | 470 (4.6%) |
| 3-Person Households | 1,807 (17.6%) | 9 (0.1%) |
| 4-Person Households | 1,118 (10.9%) | 47 (0.5%) |
| 5-Person Households | 386 (3.8%) | 11 (0.1%) |
| 6-Person Households | 118 (1.1%) | 0 (0.0%) |
| 7+ Person Households | 23 (0.2%) | 0 (0.0%) |
| Total | 6,329 (61.7%) | 3,923 (38.3%) |
Female Fertility in Easley
Fertility by Age in Easley
Average fertility rate in Easley is 79.0 births per 1,000 women. Women in the age bracket of 20 to 34 years have the highest fertility rate with 150.0 births per 1,000 women. Women in the age bracket of 20 to 34 years acount for 83.8% of all women with births.
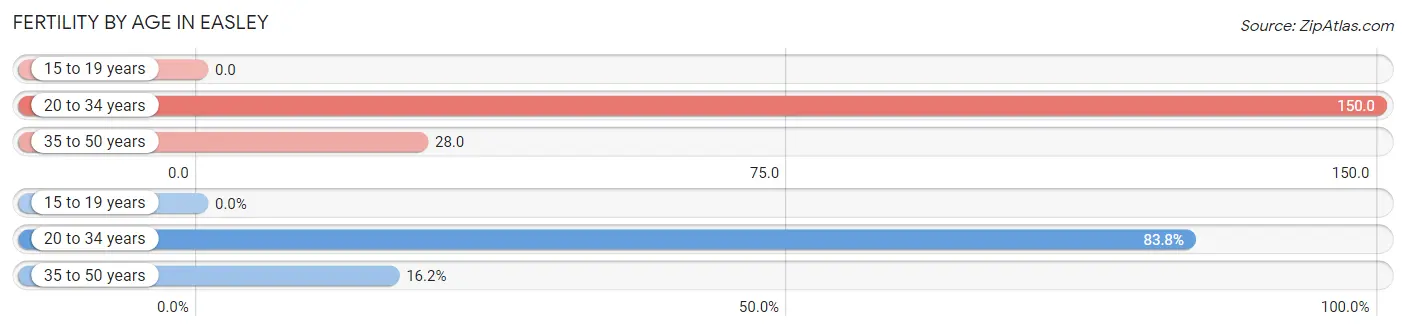
| Age Bracket | Women with Births | Births / 1,000 Women |
| 15 to 19 years | 0 (0.0%) | 0.0 |
| 20 to 34 years | 341 (83.8%) | 150.0 |
| 35 to 50 years | 66 (16.2%) | 28.0 |
| Total | 407 (100.0%) | 79.0 |
Fertility by Age by Marriage Status in Easley
70.0% of women with births (407) in Easley are married. The highest percentage of unmarried women with births falls into 35 to 50 years age bracket with 80.3% of them unmarried at the time of birth, while the lowest percentage of unmarried women with births belong to 20 to 34 years age bracket with 20.2% of them unmarried.
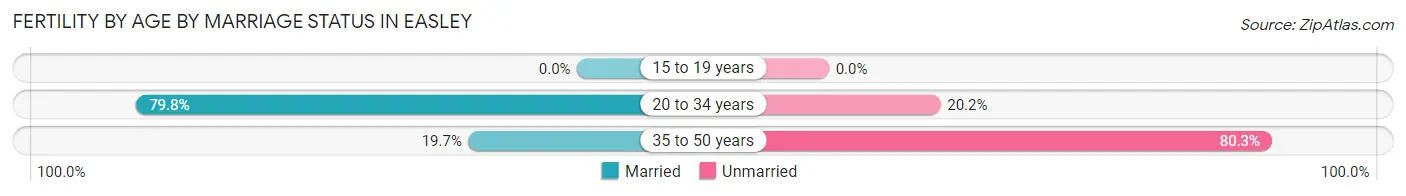
| Age Bracket | Married | Unmarried |
| 15 to 19 years | 0 (0.0%) | 0 (0.0%) |
| 20 to 34 years | 272 (79.8%) | 69 (20.2%) |
| 35 to 50 years | 13 (19.7%) | 53 (80.3%) |
| Total | 285 (70.0%) | 122 (30.0%) |
Fertility by Education in Easley
Average fertility rate in Easley is 79.0 births per 1,000 women. Women with the education attainment of high school diploma have the highest fertility rate of 122.0 births per 1,000 women, while women with the education attainment of bachelor's degree have the lowest fertility at 24.0 births per 1,000 women. Women with the education attainment of college or associate's degree represent 34.4% of all women with births.
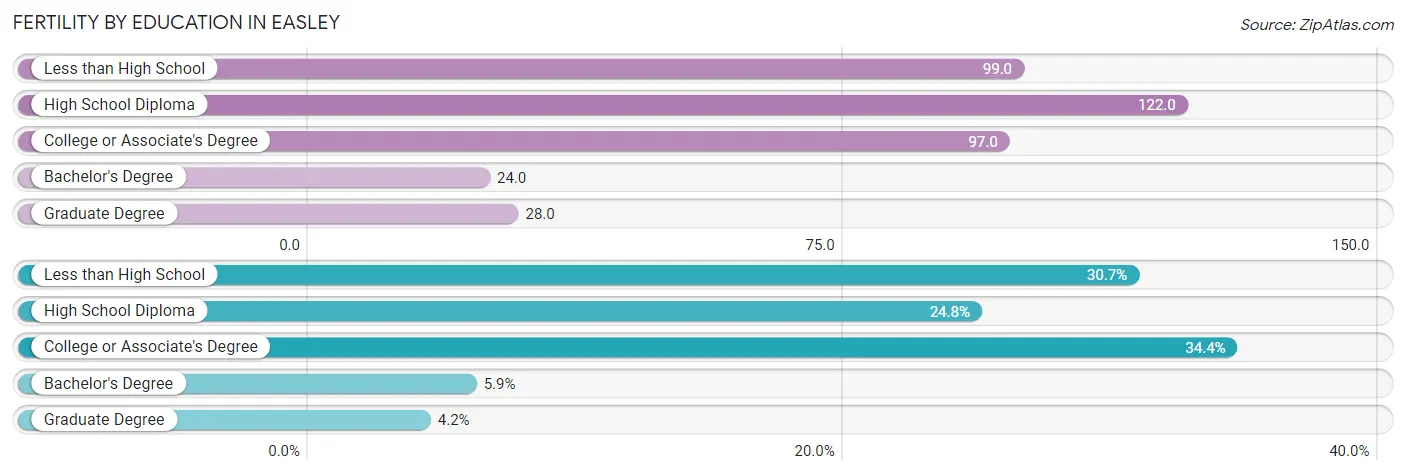
| Educational Attainment | Women with Births | Births / 1,000 Women |
| Less than High School | 125 (30.7%) | 99.0 |
| High School Diploma | 101 (24.8%) | 122.0 |
| College or Associate's Degree | 140 (34.4%) | 97.0 |
| Bachelor's Degree | 24 (5.9%) | 24.0 |
| Graduate Degree | 17 (4.2%) | 28.0 |
| Total | 407 (100.0%) | 79.0 |
Fertility by Education by Marriage Status in Easley
30.0% of women with births in Easley are unmarried. Women with the educational attainment of college or associate's degree are most likely to be married with 100.0% of them married at childbirth, while women with the educational attainment of less than high school are least likely to be married with 55.2% of them unmarried at childbirth.
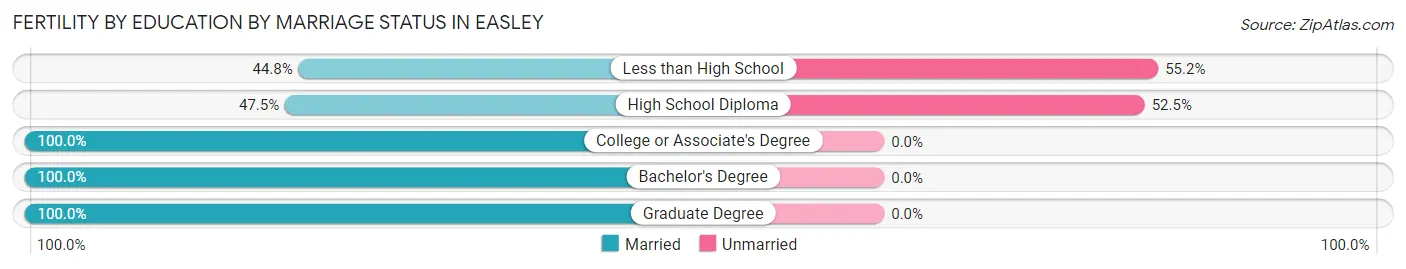
| Educational Attainment | Married | Unmarried |
| Less than High School | 56 (44.8%) | 69 (55.2%) |
| High School Diploma | 48 (47.5%) | 53 (52.5%) |
| College or Associate's Degree | 140 (100.0%) | 0 (0.0%) |
| Bachelor's Degree | 24 (100.0%) | 0 (0.0%) |
| Graduate Degree | 17 (100.0%) | 0 (0.0%) |
| Total | 285 (70.0%) | 122 (30.0%) |
Employment Characteristics in Easley
Employment by Class of Employer in Easley
Among the 10,990 employed individuals in Easley, private company employees (7,899 | 71.9%), not-for-profit organizations (897 | 8.2%), and local government employees (622 | 5.7%) make up the most common classes of employment.
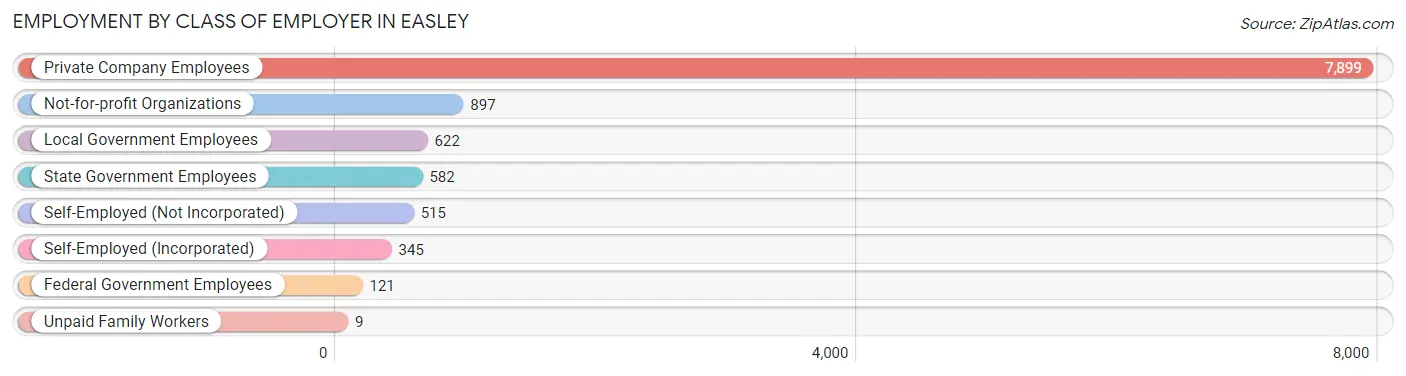
| Employer Class | # Employees | % Employees |
| Private Company Employees | 7,899 | 71.9% |
| Self-Employed (Incorporated) | 345 | 3.1% |
| Self-Employed (Not Incorporated) | 515 | 4.7% |
| Not-for-profit Organizations | 897 | 8.2% |
| Local Government Employees | 622 | 5.7% |
| State Government Employees | 582 | 5.3% |
| Federal Government Employees | 121 | 1.1% |
| Unpaid Family Workers | 9 | 0.1% |
| Total | 10,990 | 100.0% |
Employment Status by Age in Easley
According to the labor force statistics for Easley, out of the total population over 16 years of age (19,313), 60.3% or 11,646 individuals are in the labor force, with 3.8% or 443 of them unemployed. The age group with the highest labor force participation rate is 25 to 29 years, with 88.4% or 1,672 individuals in the labor force. Within the labor force, the 20 to 24 years age range has the highest percentage of unemployed individuals, with 7.1% or 65 of them being unemployed.
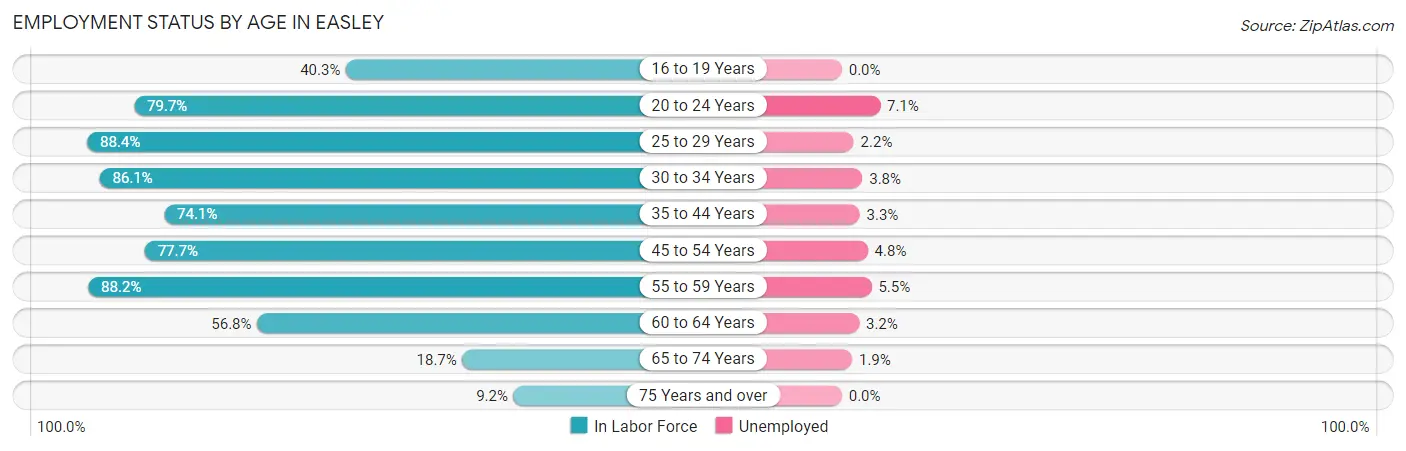
| Age Bracket | In Labor Force | Unemployed |
| 16 to 19 Years | 351 (40.3%) | 0 (0.0%) |
| 20 to 24 Years | 918 (79.7%) | 65 (7.1%) |
| 25 to 29 Years | 1,672 (88.4%) | 37 (2.2%) |
| 30 to 34 Years | 1,307 (86.1%) | 50 (3.8%) |
| 35 to 44 Years | 2,146 (74.1%) | 71 (3.3%) |
| 45 to 54 Years | 2,044 (77.7%) | 98 (4.8%) |
| 55 to 59 Years | 1,349 (88.2%) | 74 (5.5%) |
| 60 to 64 Years | 1,157 (56.8%) | 37 (3.2%) |
| 65 to 74 Years | 527 (18.7%) | 10 (1.9%) |
| 75 Years and over | 181 (9.2%) | 0 (0.0%) |
| Total | 11,646 (60.3%) | 443 (3.8%) |
Employment Status by Educational Attainment in Easley
According to labor force statistics for Easley, 77.4% of individuals (9,677) out of the total population between 25 and 64 years of age (12,502) are in the labor force, with 3.8% or 368 of them being unemployed. The group with the highest labor force participation rate are those with the educational attainment of high school diploma, with 82.3% or 2,404 individuals in the labor force. Within the labor force, individuals with less than high school education have the highest percentage of unemployment, with 21.9% or 144 of them being unemployed.
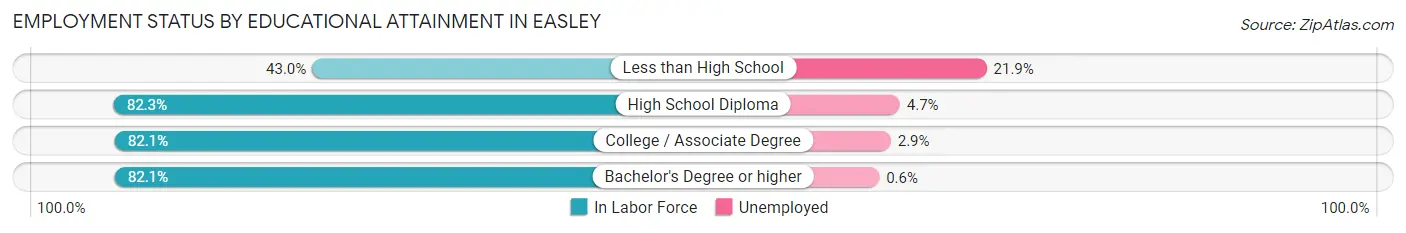
| Educational Attainment | In Labor Force | Unemployed |
| Less than High School | 658 (43.0%) | 335 (21.9%) |
| High School Diploma | 2,404 (82.3%) | 137 (4.7%) |
| College / Associate Degree | 2,938 (82.1%) | 104 (2.9%) |
| Bachelor's Degree or higher | 3,672 (82.1%) | 27 (0.6%) |
| Total | 9,677 (77.4%) | 475 (3.8%) |
Employment Occupations by Sex in Easley
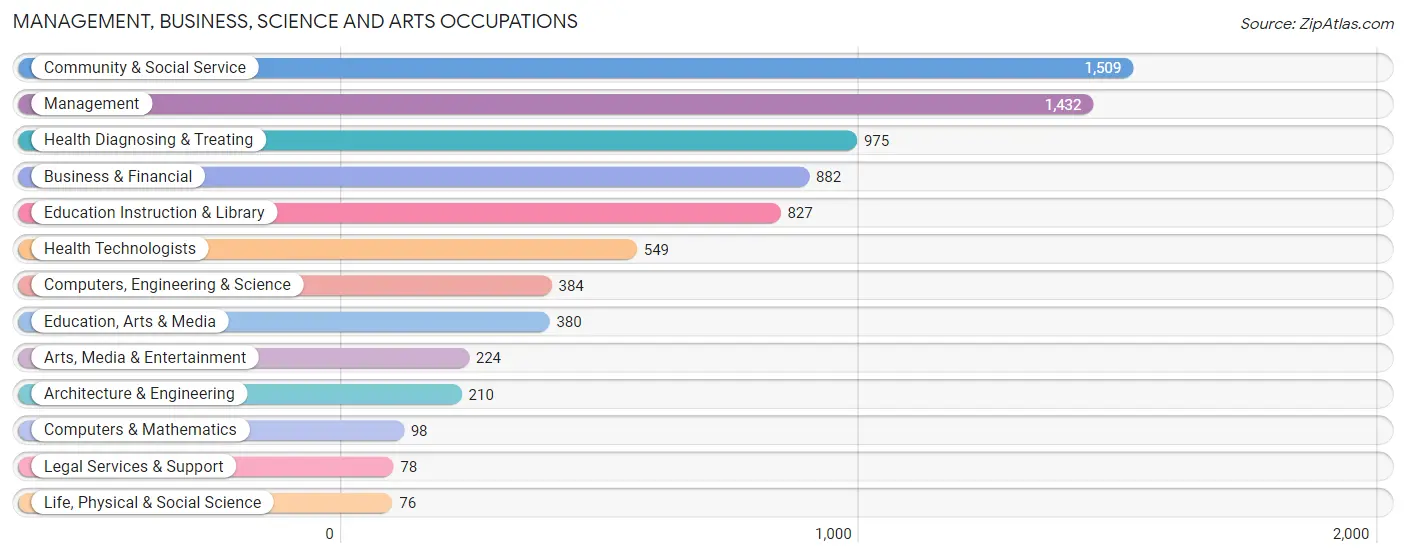
Management, Business, Science and Arts Occupations
The most common Management, Business, Science and Arts occupations in Easley are Community & Social Service (1,509 | 13.5%), Management (1,432 | 12.8%), Health Diagnosing & Treating (975 | 8.7%), Business & Financial (882 | 7.9%), and Education Instruction & Library (827 | 7.4%).
Management, Business, Science and Arts Occupations by Sex
Within the Management, Business, Science and Arts occupations in Easley, the most male-oriented occupations are Computers, Engineering & Science (100.0%), Computers & Mathematics (100.0%), and Architecture & Engineering (100.0%), while the most female-oriented occupations are Legal Services & Support (100.0%), Health Technologists (89.4%), and Health Diagnosing & Treating (85.6%).
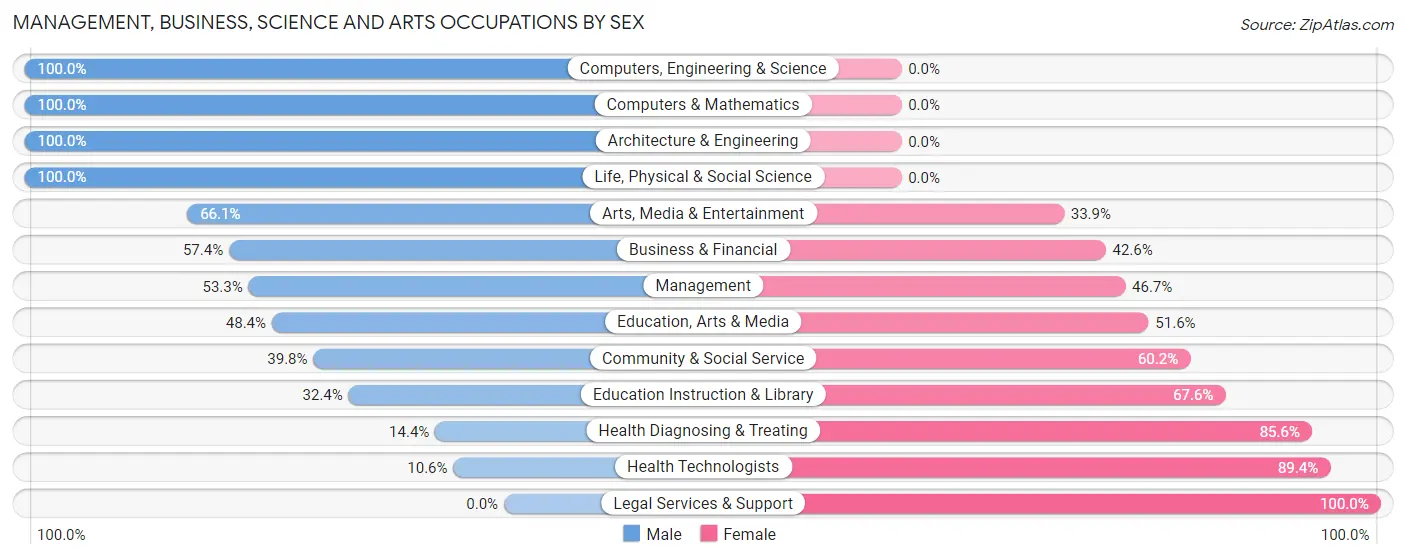
| Occupation | Male | Female |
| Management | 763 (53.3%) | 669 (46.7%) |
| Business & Financial | 506 (57.4%) | 376 (42.6%) |
| Computers, Engineering & Science | 384 (100.0%) | 0 (0.0%) |
| Computers & Mathematics | 98 (100.0%) | 0 (0.0%) |
| Architecture & Engineering | 210 (100.0%) | 0 (0.0%) |
| Life, Physical & Social Science | 76 (100.0%) | 0 (0.0%) |
| Community & Social Service | 600 (39.8%) | 909 (60.2%) |
| Education, Arts & Media | 184 (48.4%) | 196 (51.6%) |
| Legal Services & Support | 0 (0.0%) | 78 (100.0%) |
| Education Instruction & Library | 268 (32.4%) | 559 (67.6%) |
| Arts, Media & Entertainment | 148 (66.1%) | 76 (33.9%) |
| Health Diagnosing & Treating | 140 (14.4%) | 835 (85.6%) |
| Health Technologists | 58 (10.6%) | 491 (89.4%) |
| Total (Category) | 2,393 (46.2%) | 2,789 (53.8%) |
| Total (Overall) | 5,787 (51.7%) | 5,406 (48.3%) |
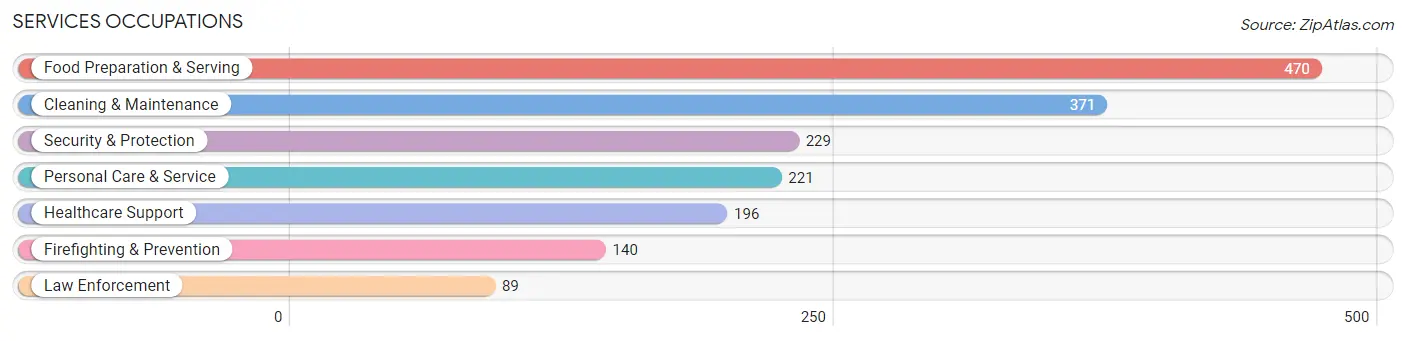
Services Occupations
The most common Services occupations in Easley are Food Preparation & Serving (470 | 4.2%), Cleaning & Maintenance (371 | 3.3%), Security & Protection (229 | 2.1%), Personal Care & Service (221 | 2.0%), and Healthcare Support (196 | 1.8%).
Services Occupations by Sex
Within the Services occupations in Easley, the most male-oriented occupations are Law Enforcement (100.0%), Security & Protection (84.7%), and Firefighting & Prevention (75.0%), while the most female-oriented occupations are Personal Care & Service (83.3%), Healthcare Support (71.4%), and Food Preparation & Serving (64.0%).
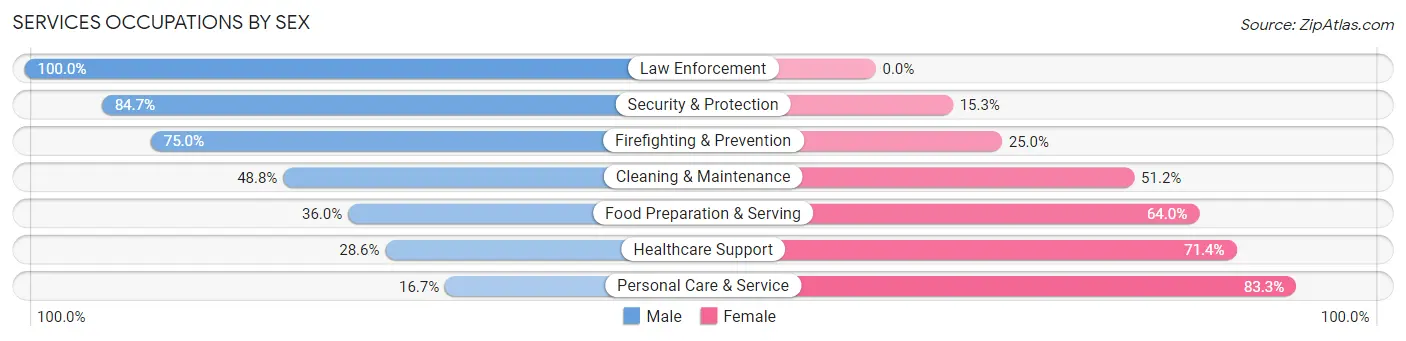
| Occupation | Male | Female |
| Healthcare Support | 56 (28.6%) | 140 (71.4%) |
| Security & Protection | 194 (84.7%) | 35 (15.3%) |
| Firefighting & Prevention | 105 (75.0%) | 35 (25.0%) |
| Law Enforcement | 89 (100.0%) | 0 (0.0%) |
| Food Preparation & Serving | 169 (36.0%) | 301 (64.0%) |
| Cleaning & Maintenance | 181 (48.8%) | 190 (51.2%) |
| Personal Care & Service | 37 (16.7%) | 184 (83.3%) |
| Total (Category) | 637 (42.8%) | 850 (57.2%) |
| Total (Overall) | 5,787 (51.7%) | 5,406 (48.3%) |
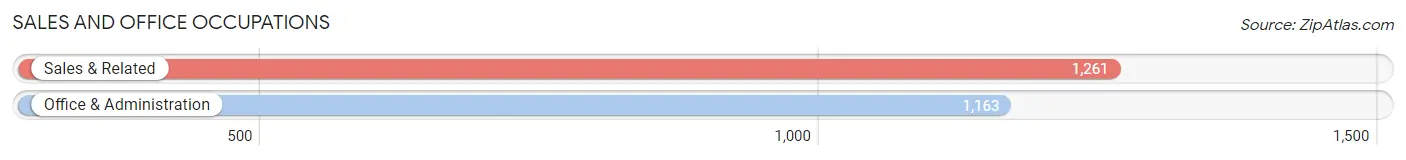
Sales and Office Occupations
The most common Sales and Office occupations in Easley are Sales & Related (1,261 | 11.3%), and Office & Administration (1,163 | 10.4%).
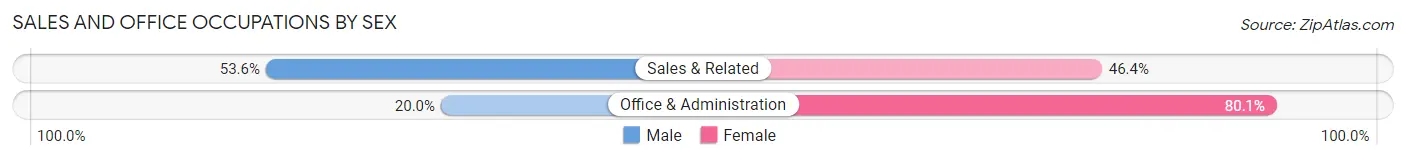
Sales and Office Occupations by Sex
| Occupation | Male | Female |
| Sales & Related | 676 (53.6%) | 585 (46.4%) |
| Office & Administration | 232 (20.0%) | 931 (80.0%) |
| Total (Category) | 908 (37.5%) | 1,516 (62.5%) |
| Total (Overall) | 5,787 (51.7%) | 5,406 (48.3%) |
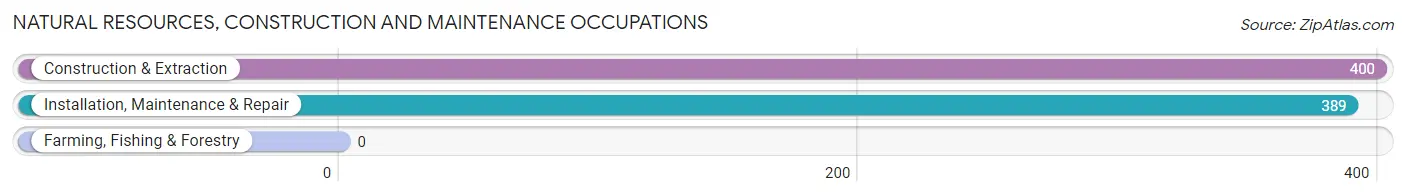
Natural Resources, Construction and Maintenance Occupations
The most common Natural Resources, Construction and Maintenance occupations in Easley are Construction & Extraction (400 | 3.6%), and Installation, Maintenance & Repair (389 | 3.5%).
Natural Resources, Construction and Maintenance Occupations by Sex
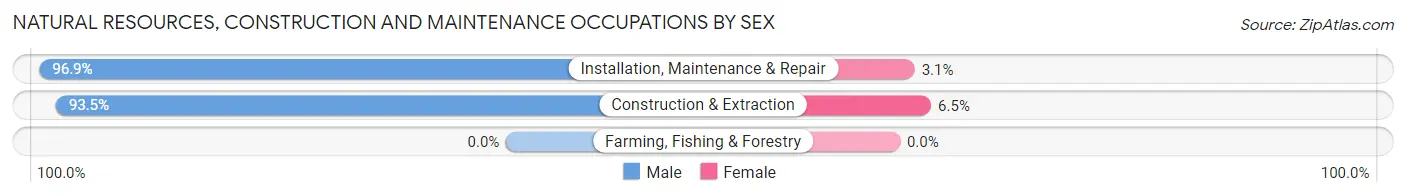
| Occupation | Male | Female |
| Farming, Fishing & Forestry | 0 (0.0%) | 0 (0.0%) |
| Construction & Extraction | 374 (93.5%) | 26 (6.5%) |
| Installation, Maintenance & Repair | 377 (96.9%) | 12 (3.1%) |
| Total (Category) | 751 (95.2%) | 38 (4.8%) |
| Total (Overall) | 5,787 (51.7%) | 5,406 (48.3%) |
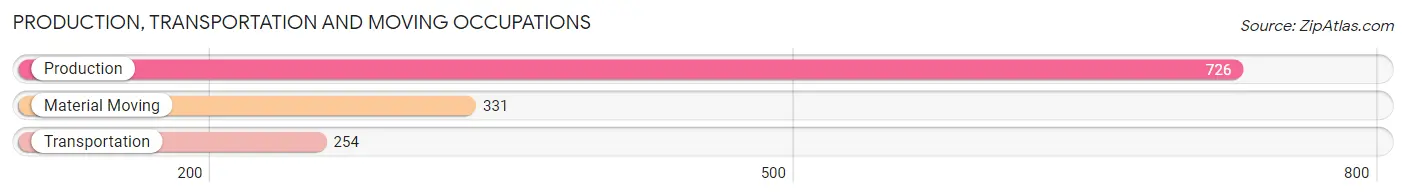
Production, Transportation and Moving Occupations
The most common Production, Transportation and Moving occupations in Easley are Production (726 | 6.5%), Material Moving (331 | 3.0%), and Transportation (254 | 2.3%).
Production, Transportation and Moving Occupations by Sex
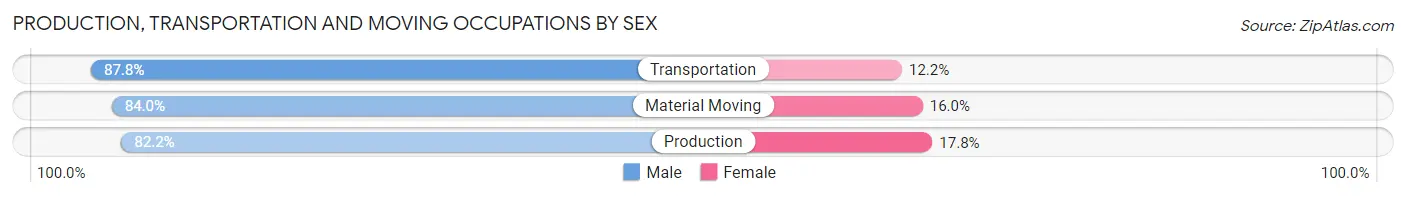
| Occupation | Male | Female |
| Production | 597 (82.2%) | 129 (17.8%) |
| Transportation | 223 (87.8%) | 31 (12.2%) |
| Material Moving | 278 (84.0%) | 53 (16.0%) |
| Total (Category) | 1,098 (83.8%) | 213 (16.3%) |
| Total (Overall) | 5,787 (51.7%) | 5,406 (48.3%) |
Employment Industries by Sex in Easley
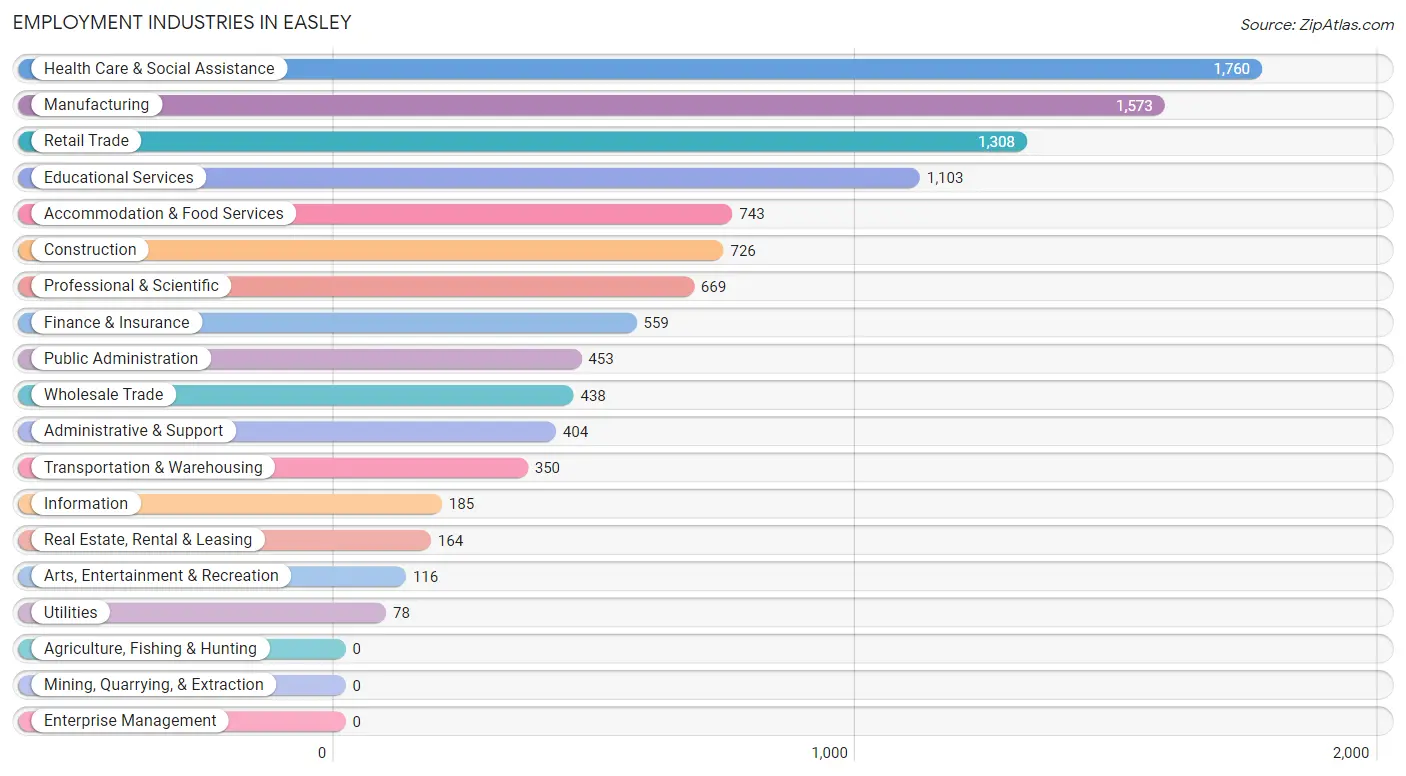
Employment Industries in Easley
The major employment industries in Easley include Health Care & Social Assistance (1,760 | 15.7%), Manufacturing (1,573 | 14.1%), Retail Trade (1,308 | 11.7%), Educational Services (1,103 | 9.9%), and Accommodation & Food Services (743 | 6.6%).
Employment Industries by Sex in Easley
The Easley industries that see more men than women are Information (89.2%), Construction (87.6%), and Utilities (84.6%), whereas the industries that tend to have a higher number of women are Health Care & Social Assistance (89.5%), Finance & Insurance (76.4%), and Educational Services (68.4%).
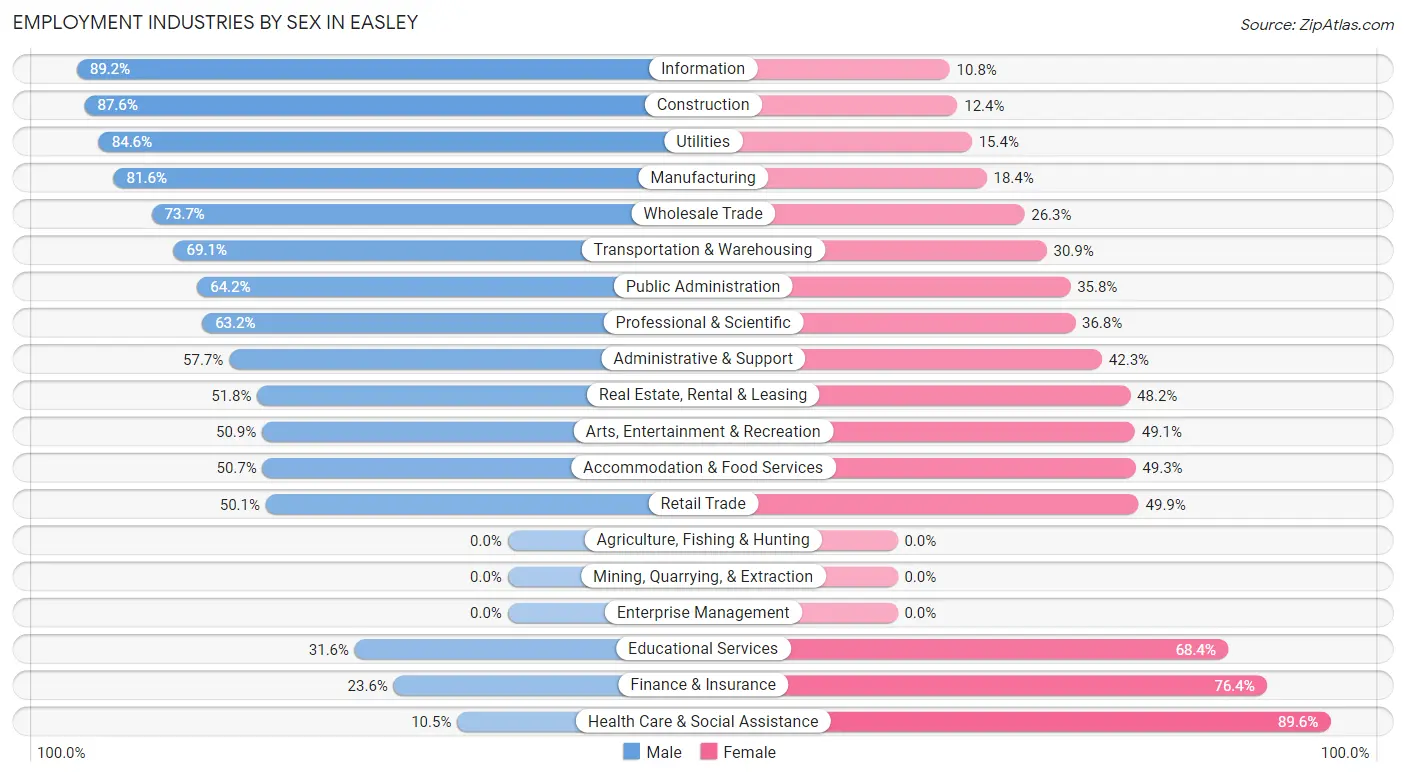
| Industry | Male | Female |
| Agriculture, Fishing & Hunting | 0 (0.0%) | 0 (0.0%) |
| Mining, Quarrying, & Extraction | 0 (0.0%) | 0 (0.0%) |
| Construction | 636 (87.6%) | 90 (12.4%) |
| Manufacturing | 1,283 (81.6%) | 290 (18.4%) |
| Wholesale Trade | 323 (73.7%) | 115 (26.3%) |
| Retail Trade | 655 (50.1%) | 653 (49.9%) |
| Transportation & Warehousing | 242 (69.1%) | 108 (30.9%) |
| Utilities | 66 (84.6%) | 12 (15.4%) |
| Information | 165 (89.2%) | 20 (10.8%) |
| Finance & Insurance | 132 (23.6%) | 427 (76.4%) |
| Real Estate, Rental & Leasing | 85 (51.8%) | 79 (48.2%) |
| Professional & Scientific | 423 (63.2%) | 246 (36.8%) |
| Enterprise Management | 0 (0.0%) | 0 (0.0%) |
| Administrative & Support | 233 (57.7%) | 171 (42.3%) |
| Educational Services | 349 (31.6%) | 754 (68.4%) |
| Health Care & Social Assistance | 184 (10.4%) | 1,576 (89.5%) |
| Arts, Entertainment & Recreation | 59 (50.9%) | 57 (49.1%) |
| Accommodation & Food Services | 377 (50.7%) | 366 (49.3%) |
| Public Administration | 291 (64.2%) | 162 (35.8%) |
| Total | 5,787 (51.7%) | 5,406 (48.3%) |
Education in Easley
School Enrollment in Easley
The most common levels of schooling among the 4,185 students in Easley are high school (1,041 | 24.9%), middle school (970 | 23.2%), and elementary school (745 | 17.8%).
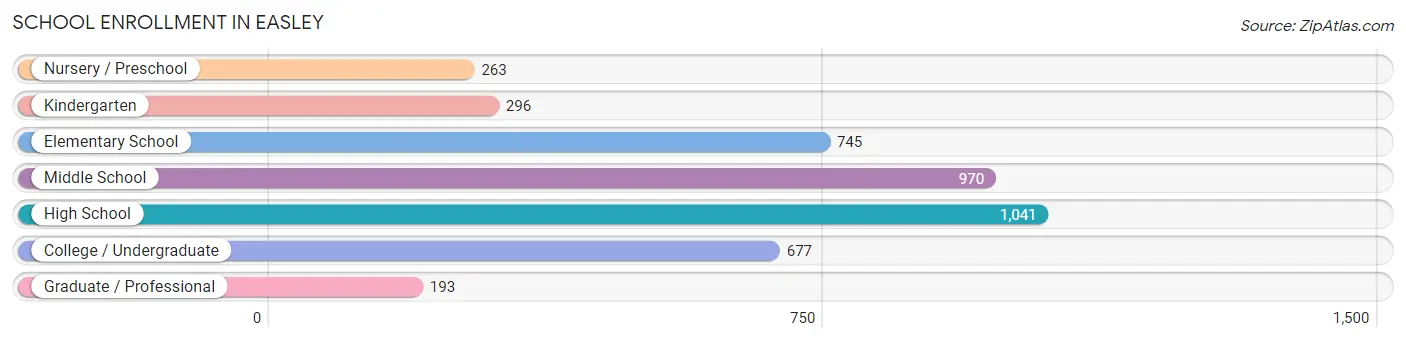
| School Level | # Students | % Students |
| Nursery / Preschool | 263 | 6.3% |
| Kindergarten | 296 | 7.1% |
| Elementary School | 745 | 17.8% |
| Middle School | 970 | 23.2% |
| High School | 1,041 | 24.9% |
| College / Undergraduate | 677 | 16.2% |
| Graduate / Professional | 193 | 4.6% |
| Total | 4,185 | 100.0% |
School Enrollment by Age by Funding Source in Easley
Out of a total of 4,185 students who are enrolled in schools in Easley, 586 (14.0%) attend a private institution, while the remaining 3,599 (86.0%) are enrolled in public schools. The age group of 3 to 4 year olds has the highest likelihood of being enrolled in private schools, with 83 (32.3% in the age bracket) enrolled. Conversely, the age group of 18 to 19 year olds has the lowest likelihood of being enrolled in a private school, with 195 (100.0% in the age bracket) attending a public institution.
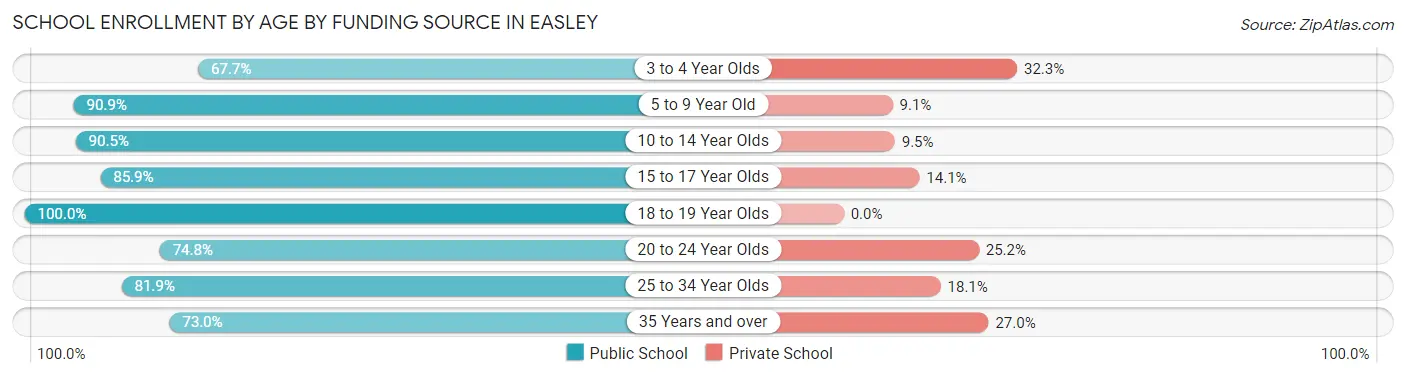
| Age Bracket | Public School | Private School |
| 3 to 4 Year Olds | 174 (67.7%) | 83 (32.3%) |
| 5 to 9 Year Old | 867 (90.9%) | 87 (9.1%) |
| 10 to 14 Year Olds | 1,055 (90.5%) | 111 (9.5%) |
| 15 to 17 Year Olds | 712 (85.9%) | 117 (14.1%) |
| 18 to 19 Year Olds | 195 (100.0%) | 0 (0.0%) |
| 20 to 24 Year Olds | 217 (74.8%) | 73 (25.2%) |
| 25 to 34 Year Olds | 186 (81.9%) | 41 (18.1%) |
| 35 Years and over | 195 (73.0%) | 72 (27.0%) |
| Total | 3,599 (86.0%) | 586 (14.0%) |
Educational Attainment by Field of Study in Easley
Business (1,066 | 18.2%), education (742 | 12.7%), science & technology (682 | 11.6%), bio, nature & agricultural (490 | 8.4%), and physical & health sciences (438 | 7.5%) are the most common fields of study among 5,863 individuals in Easley who have obtained a bachelor's degree or higher.
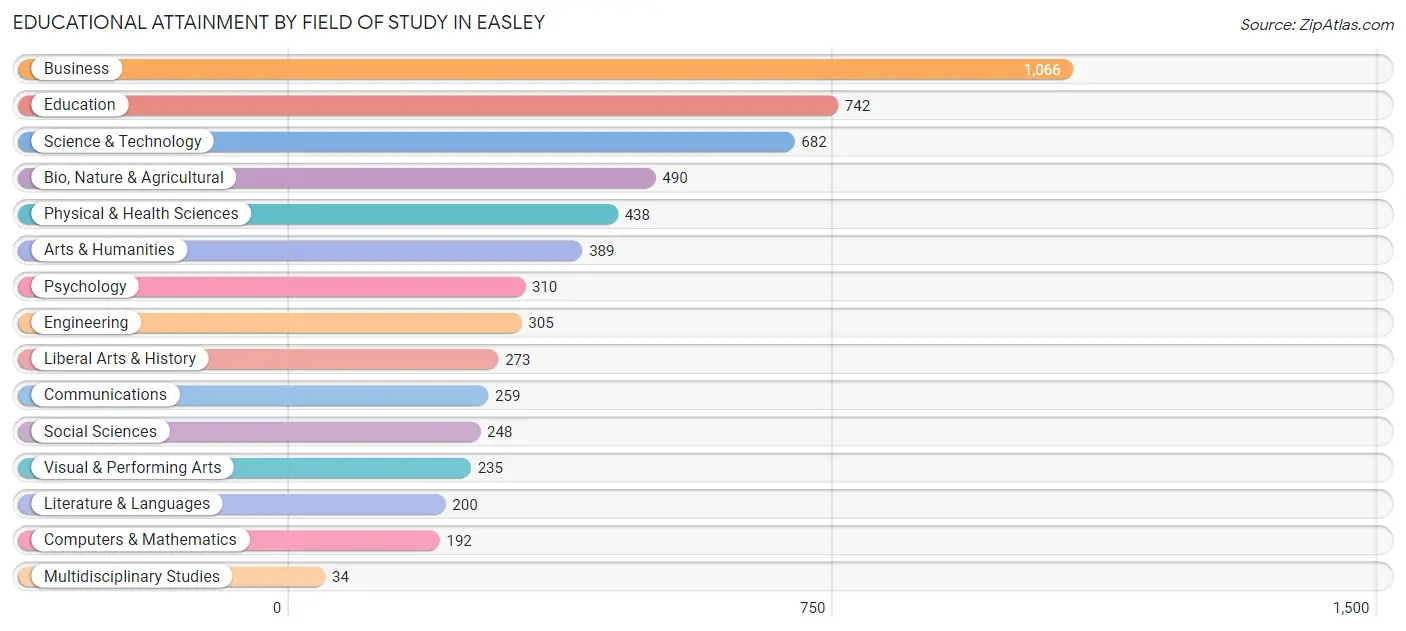
| Field of Study | # Graduates | % Graduates |
| Computers & Mathematics | 192 | 3.3% |
| Bio, Nature & Agricultural | 490 | 8.4% |
| Physical & Health Sciences | 438 | 7.5% |
| Psychology | 310 | 5.3% |
| Social Sciences | 248 | 4.2% |
| Engineering | 305 | 5.2% |
| Multidisciplinary Studies | 34 | 0.6% |
| Science & Technology | 682 | 11.6% |
| Business | 1,066 | 18.2% |
| Education | 742 | 12.7% |
| Literature & Languages | 200 | 3.4% |
| Liberal Arts & History | 273 | 4.7% |
| Visual & Performing Arts | 235 | 4.0% |
| Communications | 259 | 4.4% |
| Arts & Humanities | 389 | 6.6% |
| Total | 5,863 | 100.0% |
Transportation & Commute in Easley
Vehicle Availability by Sex in Easley
The most prevalent vehicle ownership categories in Easley are males with 2 vehicles (2,642, accounting for 46.3%) and females with 2 vehicles (2,225, making up 50.0%).
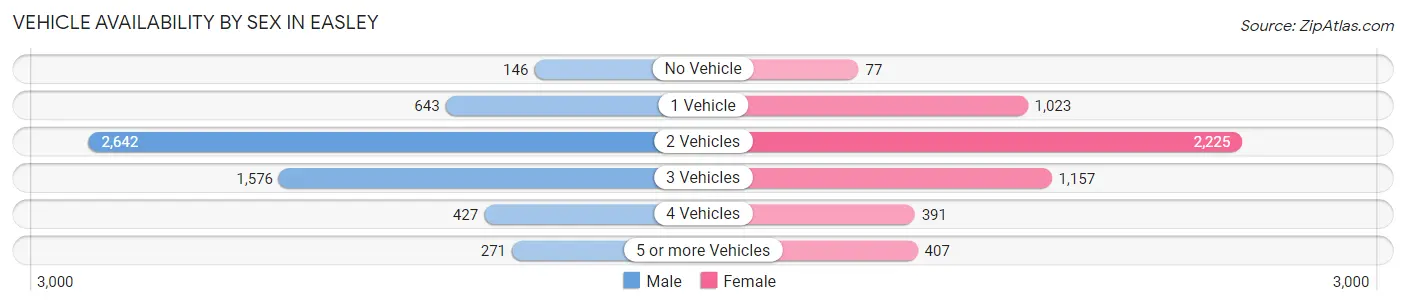
| Vehicles Available | Male | Female |
| No Vehicle | 146 (2.6%) | 77 (1.5%) |
| 1 Vehicle | 643 (11.3%) | 1,023 (19.4%) |
| 2 Vehicles | 2,642 (46.3%) | 2,225 (42.1%) |
| 3 Vehicles | 1,576 (27.6%) | 1,157 (21.9%) |
| 4 Vehicles | 427 (7.5%) | 391 (7.4%) |
| 5 or more Vehicles | 271 (4.8%) | 407 (7.7%) |
| Total | 5,705 (100.0%) | 5,280 (100.0%) |
Commute Time in Easley
The most frequently occuring commute durations in Easley are 30 to 34 minutes (1,932 commuters, 19.3%), 25 to 29 minutes (1,533 commuters, 15.3%), and 10 to 14 minutes (1,245 commuters, 12.4%).
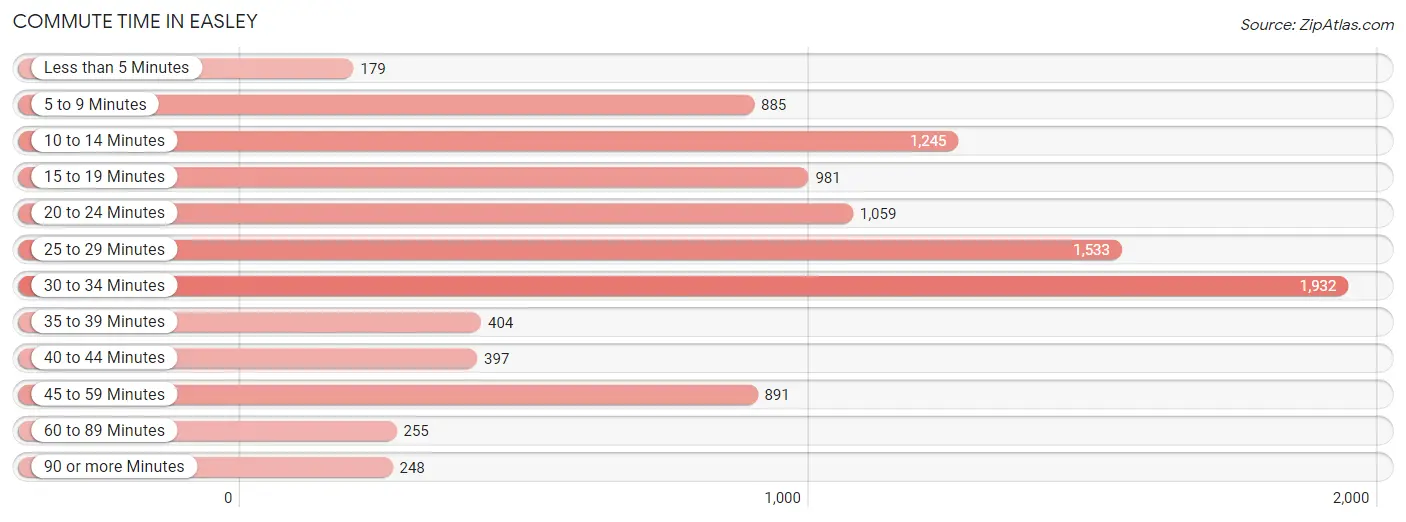
| Commute Time | # Commuters | % Commuters |
| Less than 5 Minutes | 179 | 1.8% |
| 5 to 9 Minutes | 885 | 8.8% |
| 10 to 14 Minutes | 1,245 | 12.4% |
| 15 to 19 Minutes | 981 | 9.8% |
| 20 to 24 Minutes | 1,059 | 10.6% |
| 25 to 29 Minutes | 1,533 | 15.3% |
| 30 to 34 Minutes | 1,932 | 19.3% |
| 35 to 39 Minutes | 404 | 4.0% |
| 40 to 44 Minutes | 397 | 4.0% |
| 45 to 59 Minutes | 891 | 8.9% |
| 60 to 89 Minutes | 255 | 2.5% |
| 90 or more Minutes | 248 | 2.5% |
Commute Time by Sex in Easley
The most common commute times in Easley are 30 to 34 minutes (957 commuters, 18.1%) for males and 30 to 34 minutes (975 commuters, 20.7%) for females.
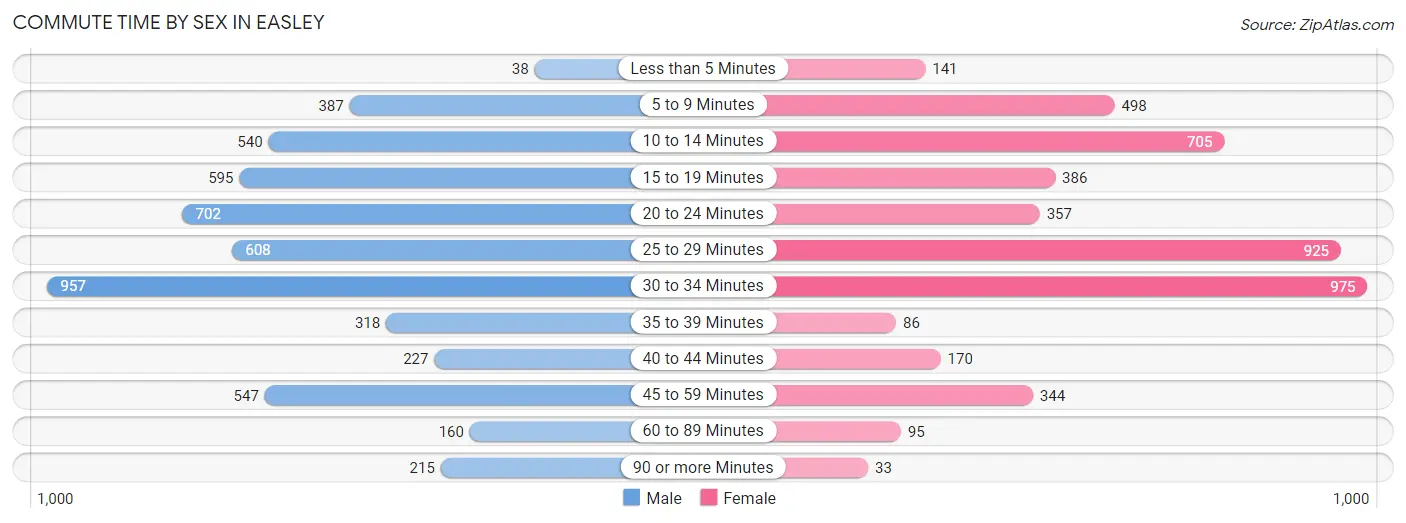
| Commute Time | Male | Female |
| Less than 5 Minutes | 38 (0.7%) | 141 (3.0%) |
| 5 to 9 Minutes | 387 (7.3%) | 498 (10.6%) |
| 10 to 14 Minutes | 540 (10.2%) | 705 (14.9%) |
| 15 to 19 Minutes | 595 (11.2%) | 386 (8.2%) |
| 20 to 24 Minutes | 702 (13.3%) | 357 (7.6%) |
| 25 to 29 Minutes | 608 (11.5%) | 925 (19.6%) |
| 30 to 34 Minutes | 957 (18.1%) | 975 (20.7%) |
| 35 to 39 Minutes | 318 (6.0%) | 86 (1.8%) |
| 40 to 44 Minutes | 227 (4.3%) | 170 (3.6%) |
| 45 to 59 Minutes | 547 (10.3%) | 344 (7.3%) |
| 60 to 89 Minutes | 160 (3.0%) | 95 (2.0%) |
| 90 or more Minutes | 215 (4.1%) | 33 (0.7%) |
Time of Departure to Work by Sex in Easley
The most frequent times of departure to work in Easley are 7:00 AM to 7:29 AM (1,028, 19.4%) for males and 7:00 AM to 7:29 AM (941, 20.0%) for females.
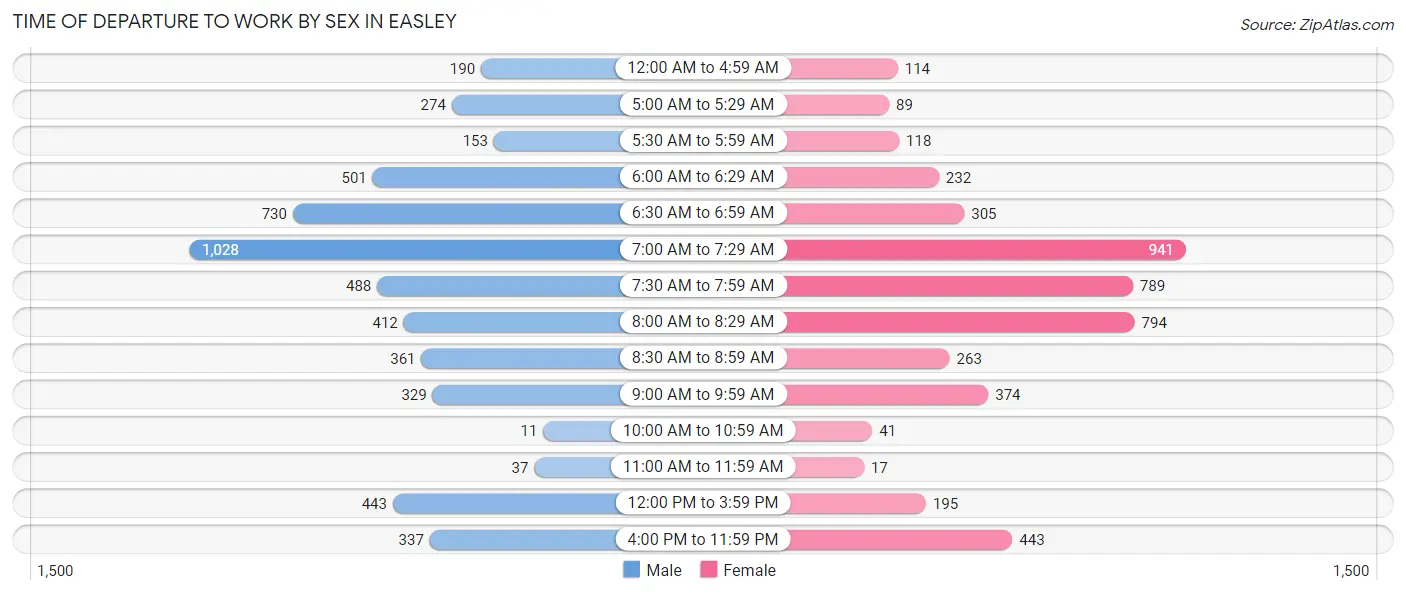
| Time of Departure | Male | Female |
| 12:00 AM to 4:59 AM | 190 (3.6%) | 114 (2.4%) |
| 5:00 AM to 5:29 AM | 274 (5.2%) | 89 (1.9%) |
| 5:30 AM to 5:59 AM | 153 (2.9%) | 118 (2.5%) |
| 6:00 AM to 6:29 AM | 501 (9.5%) | 232 (4.9%) |
| 6:30 AM to 6:59 AM | 730 (13.8%) | 305 (6.5%) |
| 7:00 AM to 7:29 AM | 1,028 (19.4%) | 941 (20.0%) |
| 7:30 AM to 7:59 AM | 488 (9.2%) | 789 (16.7%) |
| 8:00 AM to 8:29 AM | 412 (7.8%) | 794 (16.8%) |
| 8:30 AM to 8:59 AM | 361 (6.8%) | 263 (5.6%) |
| 9:00 AM to 9:59 AM | 329 (6.2%) | 374 (7.9%) |
| 10:00 AM to 10:59 AM | 11 (0.2%) | 41 (0.9%) |
| 11:00 AM to 11:59 AM | 37 (0.7%) | 17 (0.4%) |
| 12:00 PM to 3:59 PM | 443 (8.4%) | 195 (4.1%) |
| 4:00 PM to 11:59 PM | 337 (6.4%) | 443 (9.4%) |
| Total | 5,294 (100.0%) | 4,715 (100.0%) |
Housing Occupancy in Easley
Occupancy by Ownership in Easley
Of the total 10,252 dwellings in Easley, owner-occupied units account for 7,070 (69.0%), while renter-occupied units make up 3,182 (31.0%).
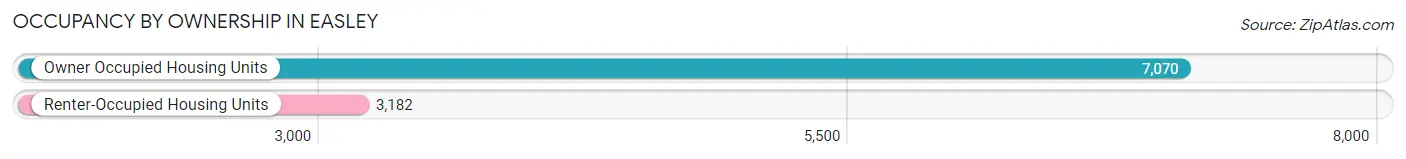
| Occupancy | # Housing Units | % Housing Units |
| Owner Occupied Housing Units | 7,070 | 69.0% |
| Renter-Occupied Housing Units | 3,182 | 31.0% |
| Total Occupied Housing Units | 10,252 | 100.0% |
Occupancy by Household Size in Easley
| Household Size | # Housing Units | % Housing Units |
| 1-Person Household | 3,386 | 33.0% |
| 2-Person Household | 3,347 | 32.7% |
| 3-Person Household | 1,816 | 17.7% |
| 4+ Person Household | 1,703 | 16.6% |
| Total Housing Units | 10,252 | 100.0% |
Occupancy by Ownership by Household Size in Easley
| Household Size | Owner-occupied | Renter-occupied |
| 1-Person Household | 1,786 (52.7%) | 1,600 (47.2%) |
| 2-Person Household | 2,496 (74.6%) | 851 (25.4%) |
| 3-Person Household | 1,415 (77.9%) | 401 (22.1%) |
| 4+ Person Household | 1,373 (80.6%) | 330 (19.4%) |
| Total Housing Units | 7,070 (69.0%) | 3,182 (31.0%) |
Occupancy by Educational Attainment in Easley
| Household Size | Owner-occupied | Renter-occupied |
| Less than High School | 423 (29.7%) | 999 (70.3%) |
| High School Diploma | 1,666 (65.7%) | 871 (34.3%) |
| College/Associate Degree | 2,195 (72.9%) | 818 (27.2%) |
| Bachelor's Degree or higher | 2,786 (84.9%) | 494 (15.1%) |
Occupancy by Age of Householder in Easley
| Age Bracket | # Households | % Households |
| Under 35 Years | 1,904 | 18.6% |
| 35 to 44 Years | 1,778 | 17.3% |
| 45 to 54 Years | 1,346 | 13.1% |
| 55 to 64 Years | 1,965 | 19.2% |
| 65 to 74 Years | 1,962 | 19.1% |
| 75 to 84 Years | 1,008 | 9.8% |
| 85 Years and Over | 289 | 2.8% |
| Total | 10,252 | 100.0% |
Housing Finances in Easley
Median Income by Occupancy in Easley
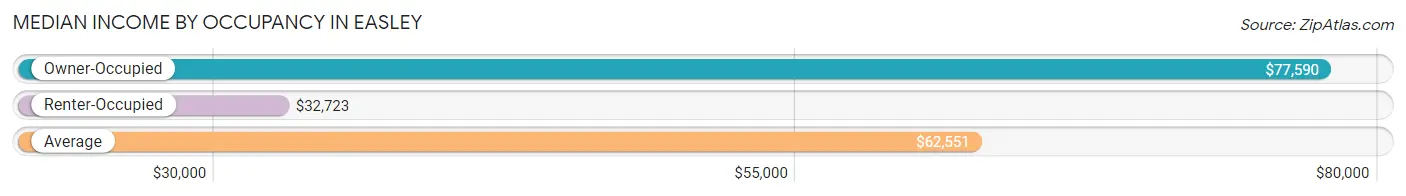
| Occupancy Type | # Households | Median Income |
| Owner-Occupied | 7,070 (69.0%) | $77,590 |
| Renter-Occupied | 3,182 (31.0%) | $32,723 |
| Average | 10,252 (100.0%) | $62,551 |
Occupancy by Householder Income Bracket in Easley
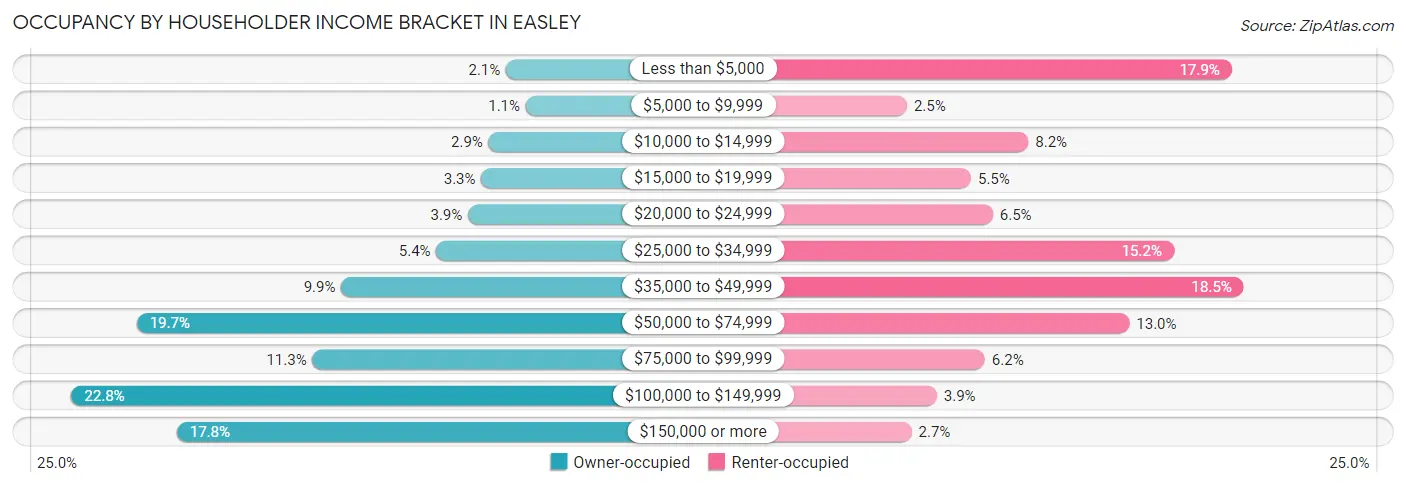
| Income Bracket | Owner-occupied | Renter-occupied |
| Less than $5,000 | 146 (2.1%) | 570 (17.9%) |
| $5,000 to $9,999 | 80 (1.1%) | 78 (2.5%) |
| $10,000 to $14,999 | 205 (2.9%) | 262 (8.2%) |
| $15,000 to $19,999 | 230 (3.3%) | 175 (5.5%) |
| $20,000 to $24,999 | 274 (3.9%) | 208 (6.5%) |
| $25,000 to $34,999 | 381 (5.4%) | 482 (15.1%) |
| $35,000 to $49,999 | 701 (9.9%) | 588 (18.5%) |
| $50,000 to $74,999 | 1,390 (19.7%) | 415 (13.0%) |
| $75,000 to $99,999 | 798 (11.3%) | 196 (6.2%) |
| $100,000 to $149,999 | 1,610 (22.8%) | 123 (3.9%) |
| $150,000 or more | 1,255 (17.7%) | 85 (2.7%) |
| Total | 7,070 (100.0%) | 3,182 (100.0%) |
Monthly Housing Cost Tiers in Easley
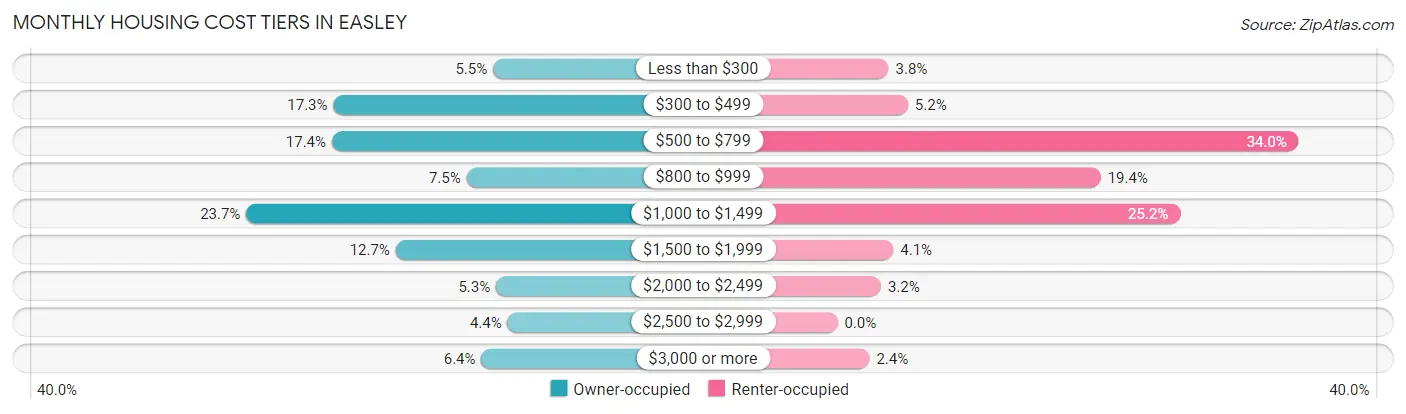
| Monthly Cost | Owner-occupied | Renter-occupied |
| Less than $300 | 389 (5.5%) | 120 (3.8%) |
| $300 to $499 | 1,220 (17.3%) | 165 (5.2%) |
| $500 to $799 | 1,228 (17.4%) | 1,081 (34.0%) |
| $800 to $999 | 527 (7.4%) | 617 (19.4%) |
| $1,000 to $1,499 | 1,674 (23.7%) | 803 (25.2%) |
| $1,500 to $1,999 | 896 (12.7%) | 131 (4.1%) |
| $2,000 to $2,499 | 373 (5.3%) | 102 (3.2%) |
| $2,500 to $2,999 | 313 (4.4%) | 0 (0.0%) |
| $3,000 or more | 450 (6.4%) | 75 (2.4%) |
| Total | 7,070 (100.0%) | 3,182 (100.0%) |
Physical Housing Characteristics in Easley
Housing Structures in Easley
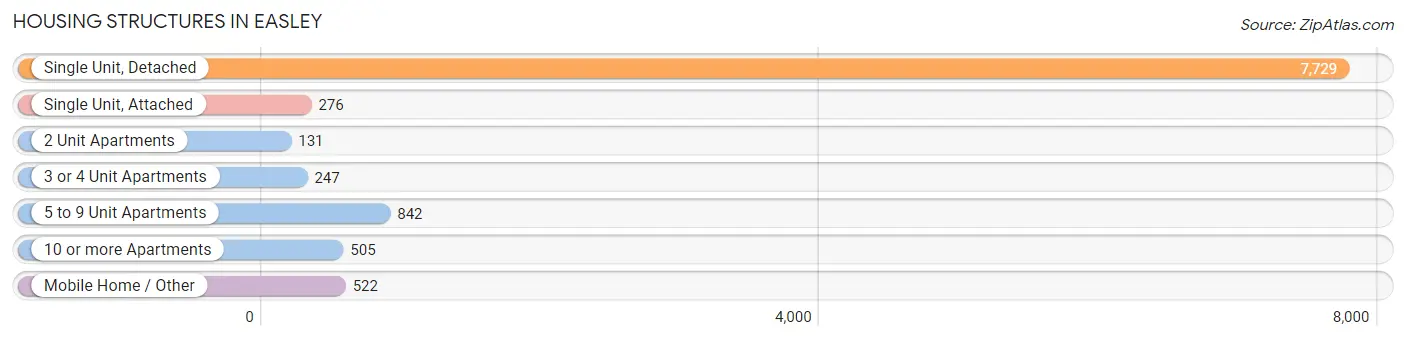
| Structure Type | # Housing Units | % Housing Units |
| Single Unit, Detached | 7,729 | 75.4% |
| Single Unit, Attached | 276 | 2.7% |
| 2 Unit Apartments | 131 | 1.3% |
| 3 or 4 Unit Apartments | 247 | 2.4% |
| 5 to 9 Unit Apartments | 842 | 8.2% |
| 10 or more Apartments | 505 | 4.9% |
| Mobile Home / Other | 522 | 5.1% |
| Total | 10,252 | 100.0% |
Housing Structures by Occupancy in Easley
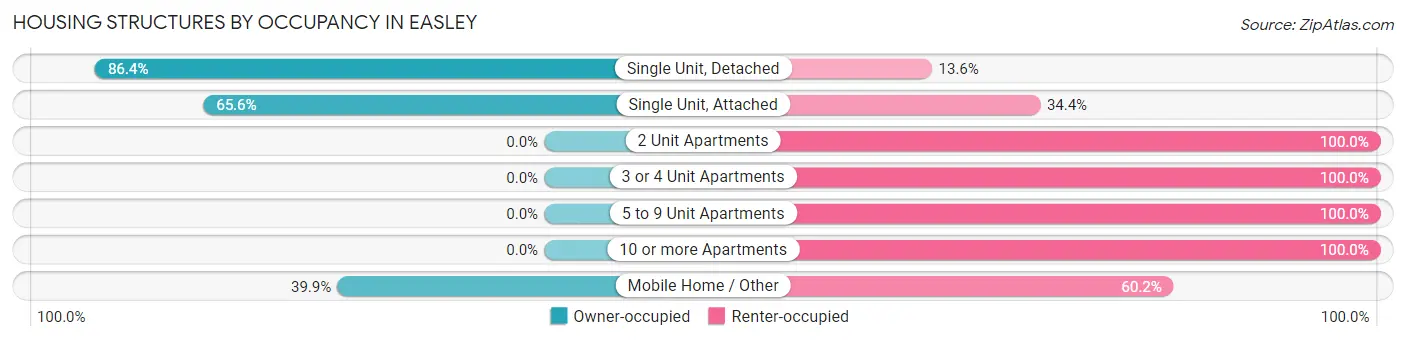
| Structure Type | Owner-occupied | Renter-occupied |
| Single Unit, Detached | 6,681 (86.4%) | 1,048 (13.6%) |
| Single Unit, Attached | 181 (65.6%) | 95 (34.4%) |
| 2 Unit Apartments | 0 (0.0%) | 131 (100.0%) |
| 3 or 4 Unit Apartments | 0 (0.0%) | 247 (100.0%) |
| 5 to 9 Unit Apartments | 0 (0.0%) | 842 (100.0%) |
| 10 or more Apartments | 0 (0.0%) | 505 (100.0%) |
| Mobile Home / Other | 208 (39.9%) | 314 (60.2%) |
| Total | 7,070 (69.0%) | 3,182 (31.0%) |
Housing Structures by Number of Rooms in Easley
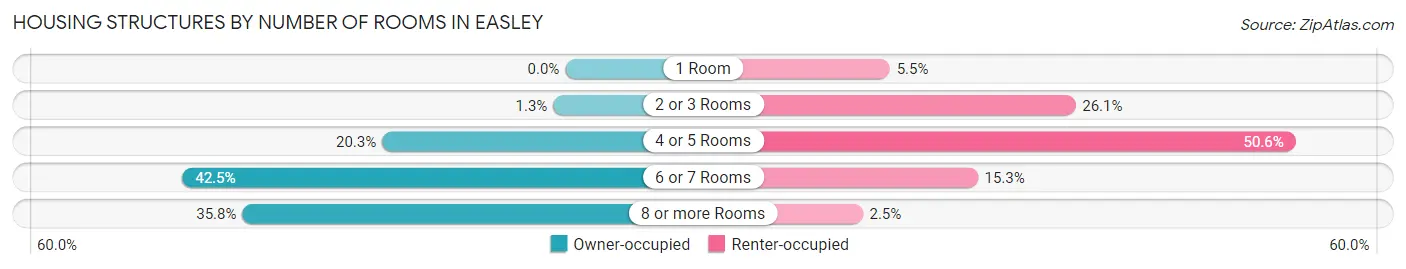
| Number of Rooms | Owner-occupied | Renter-occupied |
| 1 Room | 0 (0.0%) | 176 (5.5%) |
| 2 or 3 Rooms | 95 (1.3%) | 831 (26.1%) |
| 4 or 5 Rooms | 1,437 (20.3%) | 1,609 (50.6%) |
| 6 or 7 Rooms | 3,004 (42.5%) | 486 (15.3%) |
| 8 or more Rooms | 2,534 (35.8%) | 80 (2.5%) |
| Total | 7,070 (100.0%) | 3,182 (100.0%) |
Housing Structure by Heating Type in Easley
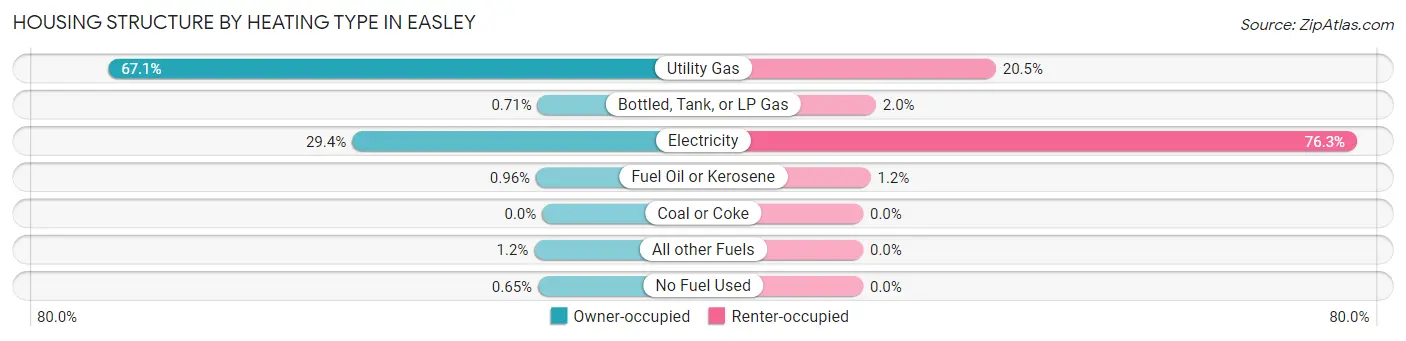
| Heating Type | Owner-occupied | Renter-occupied |
| Utility Gas | 4,742 (67.1%) | 653 (20.5%) |
| Bottled, Tank, or LP Gas | 50 (0.7%) | 63 (2.0%) |
| Electricity | 2,078 (29.4%) | 2,429 (76.3%) |
| Fuel Oil or Kerosene | 68 (1.0%) | 37 (1.2%) |
| Coal or Coke | 0 (0.0%) | 0 (0.0%) |
| All other Fuels | 86 (1.2%) | 0 (0.0%) |
| No Fuel Used | 46 (0.6%) | 0 (0.0%) |
| Total | 7,070 (100.0%) | 3,182 (100.0%) |
Household Vehicle Usage in Easley
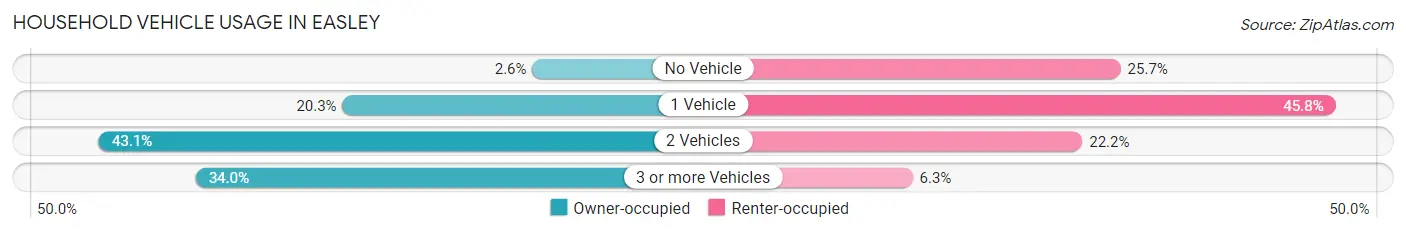
| Vehicles per Household | Owner-occupied | Renter-occupied |
| No Vehicle | 184 (2.6%) | 819 (25.7%) |
| 1 Vehicle | 1,437 (20.3%) | 1,457 (45.8%) |
| 2 Vehicles | 3,044 (43.1%) | 705 (22.2%) |
| 3 or more Vehicles | 2,405 (34.0%) | 201 (6.3%) |
| Total | 7,070 (100.0%) | 3,182 (100.0%) |
Real Estate & Mortgages in Easley
Real Estate and Mortgage Overview in Easley
| Characteristic | Without Mortgage | With Mortgage |
| Housing Units | 2,603 | 4,467 |
| Median Property Value | $227,300 | $230,700 |
| Median Household Income | $55,211 | $1,061 |
| Monthly Housing Costs | $449 | $433 |
| Real Estate Taxes | $724 | $62 |
Property Value by Mortgage Status in Easley
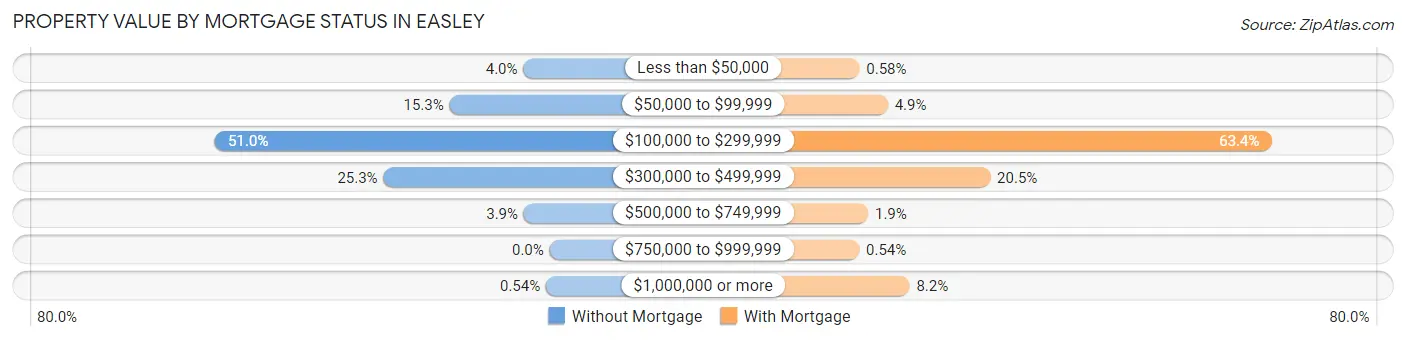
| Property Value | Without Mortgage | With Mortgage |
| Less than $50,000 | 104 (4.0%) | 26 (0.6%) |
| $50,000 to $99,999 | 397 (15.2%) | 219 (4.9%) |
| $100,000 to $299,999 | 1,327 (51.0%) | 2,830 (63.3%) |
| $300,000 to $499,999 | 659 (25.3%) | 916 (20.5%) |
| $500,000 to $749,999 | 102 (3.9%) | 85 (1.9%) |
| $750,000 to $999,999 | 0 (0.0%) | 24 (0.5%) |
| $1,000,000 or more | 14 (0.5%) | 367 (8.2%) |
| Total | 2,603 (100.0%) | 4,467 (100.0%) |
Household Income by Mortgage Status in Easley
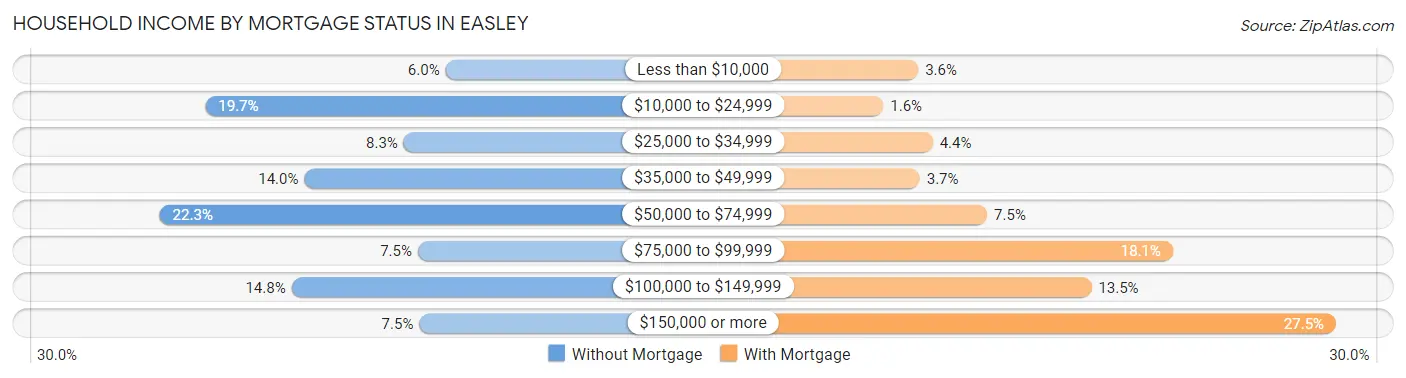
| Household Income | Without Mortgage | With Mortgage |
| Less than $10,000 | 155 (5.9%) | 160 (3.6%) |
| $10,000 to $24,999 | 512 (19.7%) | 71 (1.6%) |
| $25,000 to $34,999 | 217 (8.3%) | 197 (4.4%) |
| $35,000 to $49,999 | 365 (14.0%) | 164 (3.7%) |
| $50,000 to $74,999 | 580 (22.3%) | 336 (7.5%) |
| $75,000 to $99,999 | 196 (7.5%) | 810 (18.1%) |
| $100,000 to $149,999 | 384 (14.7%) | 602 (13.5%) |
| $150,000 or more | 194 (7.4%) | 1,226 (27.5%) |
| Total | 2,603 (100.0%) | 4,467 (100.0%) |
Property Value to Household Income Ratio in Easley
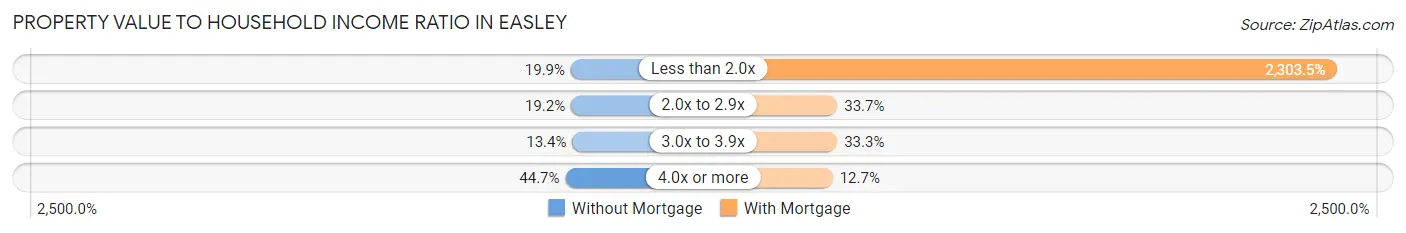
| Value-to-Income Ratio | Without Mortgage | With Mortgage |
| Less than 2.0x | 518 (19.9%) | 102,899 (2,303.5%) |
| 2.0x to 2.9x | 499 (19.2%) | 1,503 (33.7%) |
| 3.0x to 3.9x | 349 (13.4%) | 1,486 (33.3%) |
| 4.0x or more | 1,164 (44.7%) | 569 (12.7%) |
| Total | 2,603 (100.0%) | 4,467 (100.0%) |
Real Estate Taxes by Mortgage Status in Easley
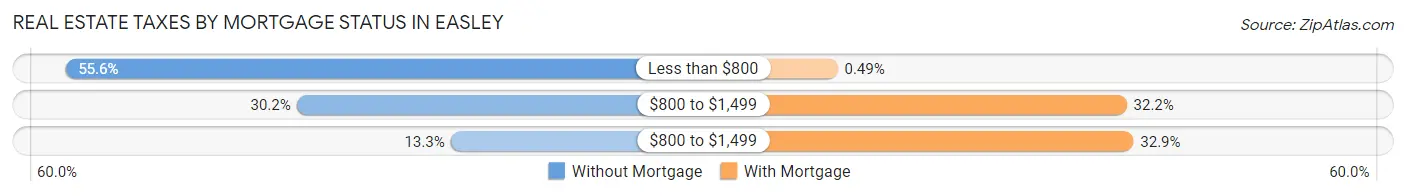
| Property Taxes | Without Mortgage | With Mortgage |
| Less than $800 | 1,446 (55.5%) | 22 (0.5%) |
| $800 to $1,499 | 786 (30.2%) | 1,437 (32.2%) |
| $800 to $1,499 | 347 (13.3%) | 1,470 (32.9%) |
| Total | 2,603 (100.0%) | 4,467 (100.0%) |
Health & Disability in Easley
Health Insurance Coverage by Age in Easley
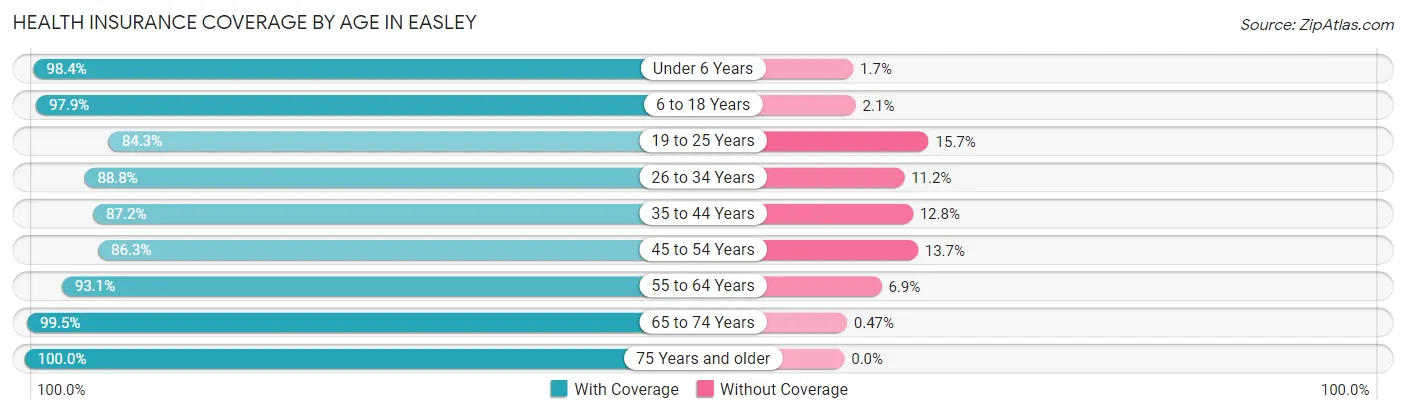
| Age Bracket | With Coverage | Without Coverage |
| Under 6 Years | 1,550 (98.4%) | 26 (1.7%) |
| 6 to 18 Years | 2,913 (97.9%) | 63 (2.1%) |
| 19 to 25 Years | 1,464 (84.3%) | 273 (15.7%) |
| 26 to 34 Years | 2,632 (88.8%) | 331 (11.2%) |
| 35 to 44 Years | 2,523 (87.2%) | 369 (12.8%) |
| 45 to 54 Years | 2,253 (86.3%) | 358 (13.7%) |
| 55 to 64 Years | 3,285 (93.1%) | 245 (6.9%) |
| 65 to 74 Years | 2,744 (99.5%) | 13 (0.5%) |
| 75 Years and older | 1,844 (100.0%) | 0 (0.0%) |
| Total | 21,208 (92.7%) | 1,678 (7.3%) |
Health Insurance Coverage by Citizenship Status in Easley
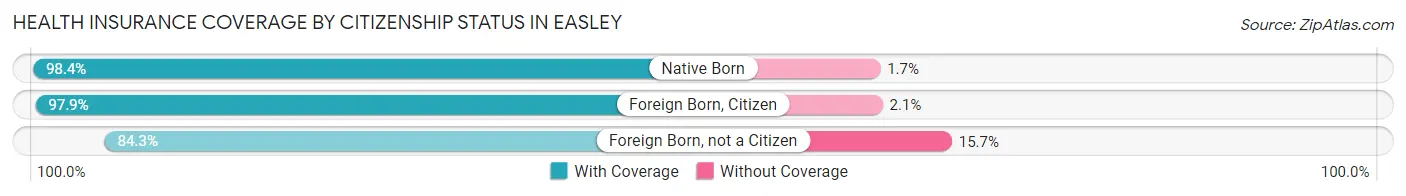
| Citizenship Status | With Coverage | Without Coverage |
| Native Born | 1,550 (98.4%) | 26 (1.7%) |
| Foreign Born, Citizen | 2,913 (97.9%) | 63 (2.1%) |
| Foreign Born, not a Citizen | 1,464 (84.3%) | 273 (15.7%) |
Health Insurance Coverage by Household Income in Easley
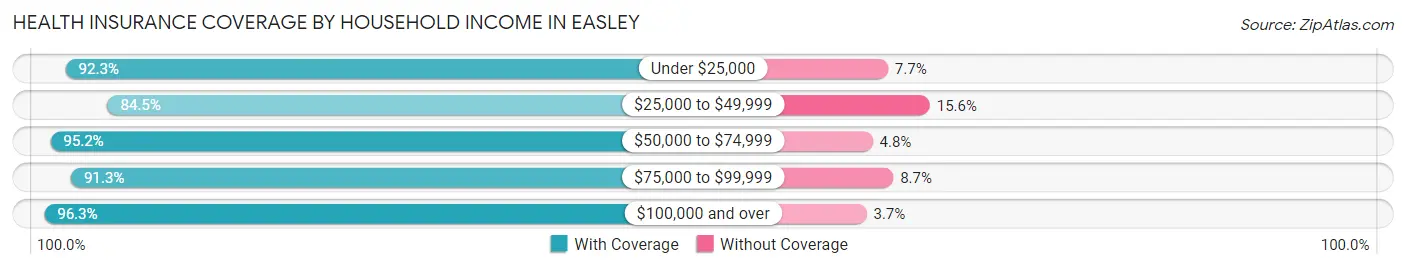
| Household Income | With Coverage | Without Coverage |
| Under $25,000 | 2,577 (92.3%) | 215 (7.7%) |
| $25,000 to $49,999 | 3,965 (84.5%) | 730 (15.5%) |
| $50,000 to $74,999 | 3,969 (95.2%) | 202 (4.8%) |
| $75,000 to $99,999 | 2,025 (91.3%) | 193 (8.7%) |
| $100,000 and over | 8,640 (96.3%) | 332 (3.7%) |
Public vs Private Health Insurance Coverage by Age in Easley
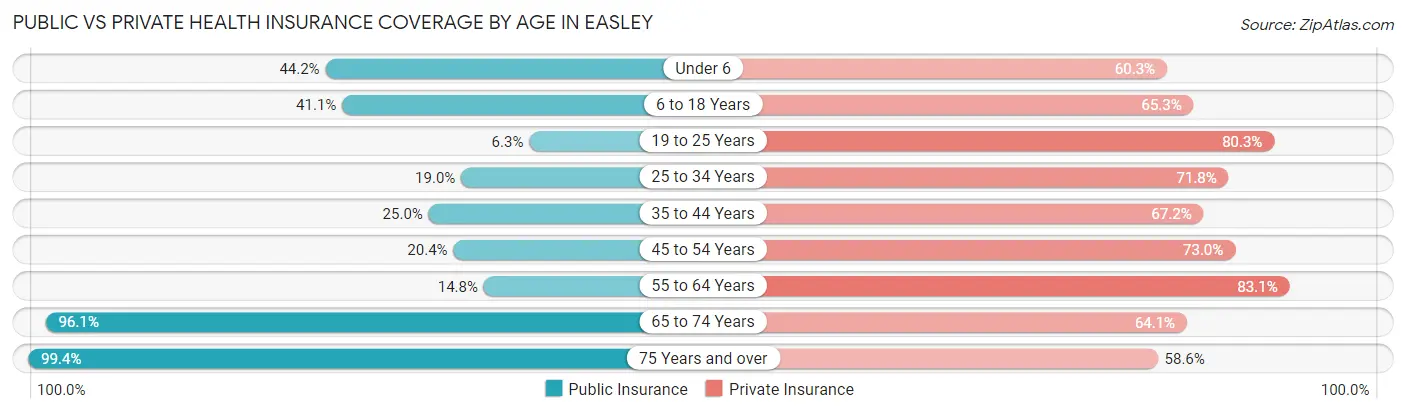
| Age Bracket | Public Insurance | Private Insurance |
| Under 6 | 696 (44.2%) | 951 (60.3%) |
| 6 to 18 Years | 1,222 (41.1%) | 1,943 (65.3%) |
| 19 to 25 Years | 110 (6.3%) | 1,394 (80.2%) |
| 25 to 34 Years | 562 (19.0%) | 2,127 (71.8%) |
| 35 to 44 Years | 723 (25.0%) | 1,942 (67.1%) |
| 45 to 54 Years | 533 (20.4%) | 1,906 (73.0%) |
| 55 to 64 Years | 521 (14.8%) | 2,933 (83.1%) |
| 65 to 74 Years | 2,650 (96.1%) | 1,766 (64.1%) |
| 75 Years and over | 1,832 (99.4%) | 1,081 (58.6%) |
| Total | 8,849 (38.7%) | 16,043 (70.1%) |
Disability Status by Sex by Age in Easley
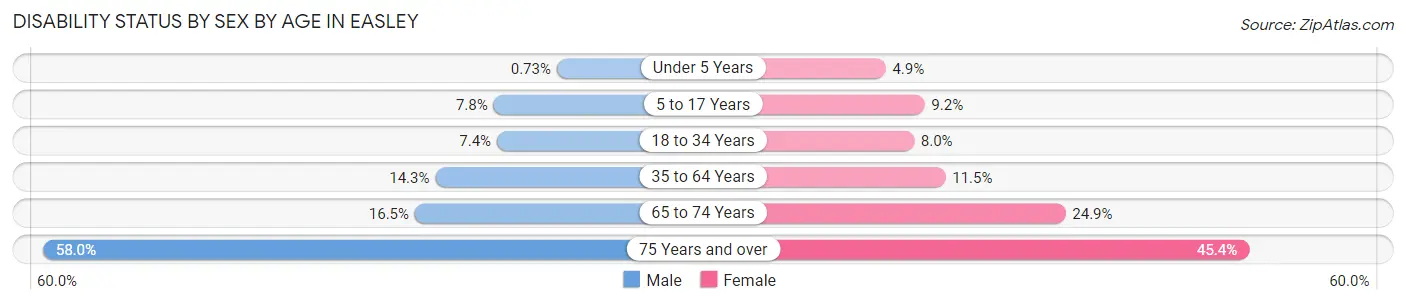
| Age Bracket | Male | Female |
| Under 5 Years | 6 (0.7%) | 27 (4.9%) |
| 5 to 17 Years | 111 (7.8%) | 150 (9.2%) |
| 18 to 34 Years | 178 (7.4%) | 193 (8.0%) |
| 35 to 64 Years | 614 (14.3%) | 545 (11.5%) |
| 65 to 74 Years | 197 (16.5%) | 390 (24.9%) |
| 75 Years and over | 389 (58.0%) | 532 (45.4%) |
Disability Class by Sex by Age in Easley
Disability Class: Hearing Difficulty
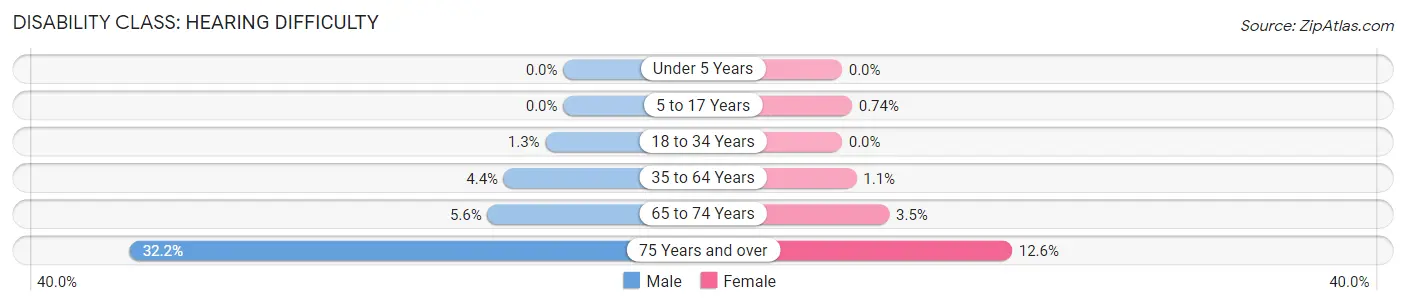
| Age Bracket | Male | Female |
| Under 5 Years | 0 (0.0%) | 0 (0.0%) |
| 5 to 17 Years | 0 (0.0%) | 12 (0.7%) |
| 18 to 34 Years | 32 (1.3%) | 0 (0.0%) |
| 35 to 64 Years | 190 (4.4%) | 51 (1.1%) |
| 65 to 74 Years | 67 (5.6%) | 55 (3.5%) |
| 75 Years and over | 216 (32.2%) | 148 (12.6%) |
Disability Class: Vision Difficulty
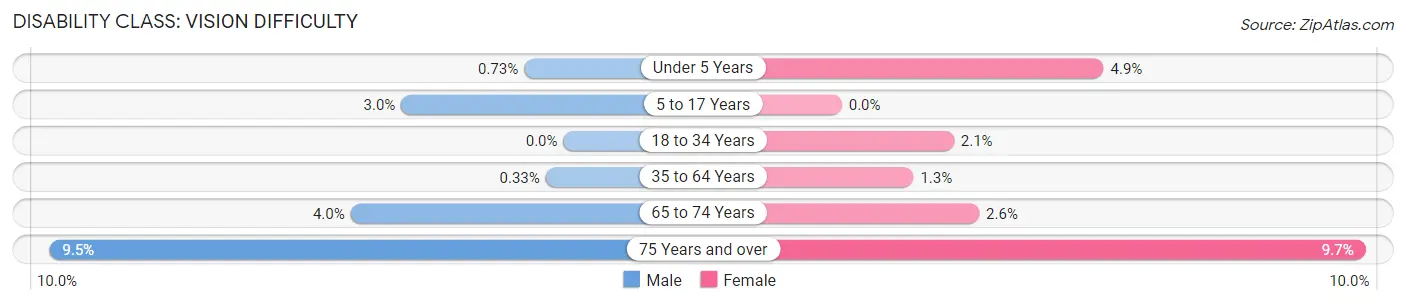
| Age Bracket | Male | Female |
| Under 5 Years | 6 (0.7%) | 27 (4.9%) |
| 5 to 17 Years | 43 (3.0%) | 0 (0.0%) |
| 18 to 34 Years | 0 (0.0%) | 50 (2.1%) |
| 35 to 64 Years | 14 (0.3%) | 63 (1.3%) |
| 65 to 74 Years | 47 (4.0%) | 40 (2.5%) |
| 75 Years and over | 64 (9.5%) | 114 (9.7%) |
Disability Class: Cognitive Difficulty
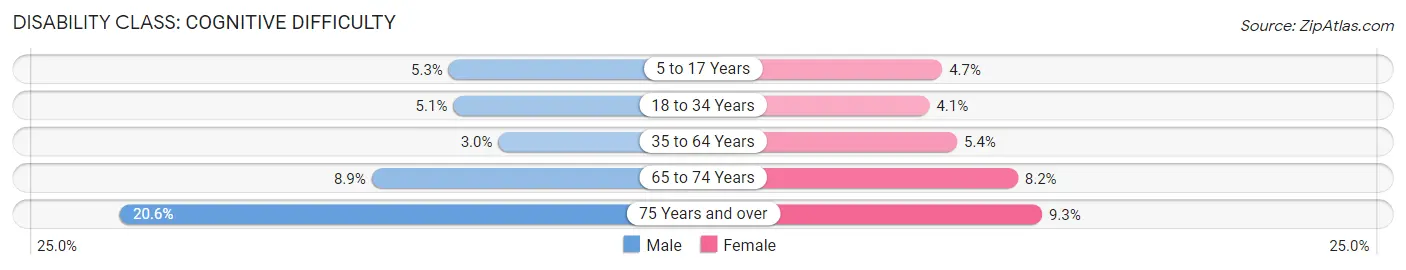
| Age Bracket | Male | Female |
| 5 to 17 Years | 76 (5.3%) | 76 (4.7%) |
| 18 to 34 Years | 123 (5.1%) | 98 (4.1%) |
| 35 to 64 Years | 130 (3.0%) | 253 (5.3%) |
| 65 to 74 Years | 106 (8.9%) | 128 (8.2%) |
| 75 Years and over | 138 (20.6%) | 109 (9.3%) |
Disability Class: Ambulatory Difficulty
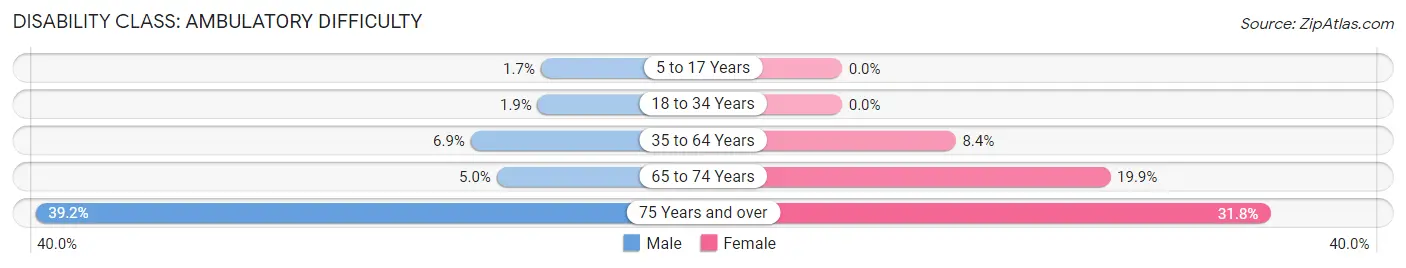
| Age Bracket | Male | Female |
| 5 to 17 Years | 24 (1.7%) | 0 (0.0%) |
| 18 to 34 Years | 46 (1.9%) | 0 (0.0%) |
| 35 to 64 Years | 296 (6.9%) | 399 (8.4%) |
| 65 to 74 Years | 59 (5.0%) | 312 (19.9%) |
| 75 Years and over | 263 (39.2%) | 373 (31.8%) |
Disability Class: Self-Care Difficulty
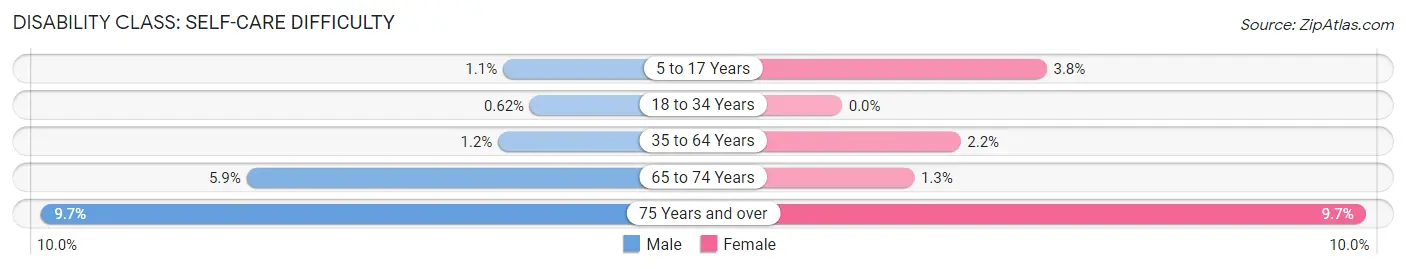
| Age Bracket | Male | Female |
| 5 to 17 Years | 16 (1.1%) | 62 (3.8%) |
| 18 to 34 Years | 15 (0.6%) | 0 (0.0%) |
| 35 to 64 Years | 52 (1.2%) | 104 (2.2%) |
| 65 to 74 Years | 70 (5.9%) | 21 (1.3%) |
| 75 Years and over | 65 (9.7%) | 114 (9.7%) |
Technology Access in Easley
Computing Device Access in Easley
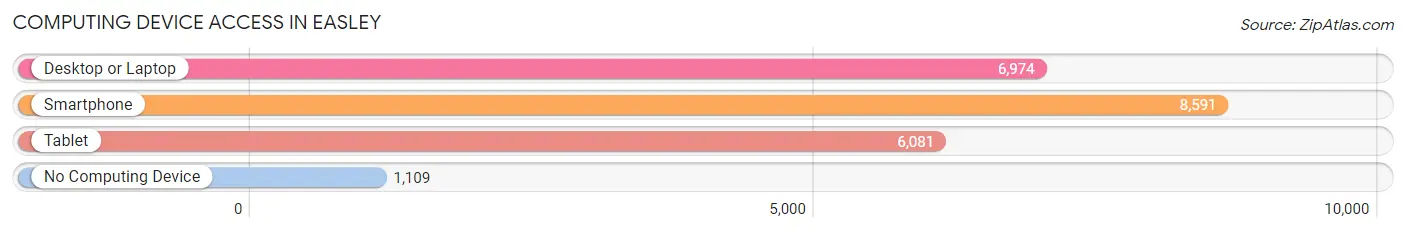
| Device Type | # Households | % Households |
| Desktop or Laptop | 6,974 | 68.0% |
| Smartphone | 8,591 | 83.8% |
| Tablet | 6,081 | 59.3% |
| No Computing Device | 1,109 | 10.8% |
| Total | 10,252 | 100.0% |
Internet Access in Easley
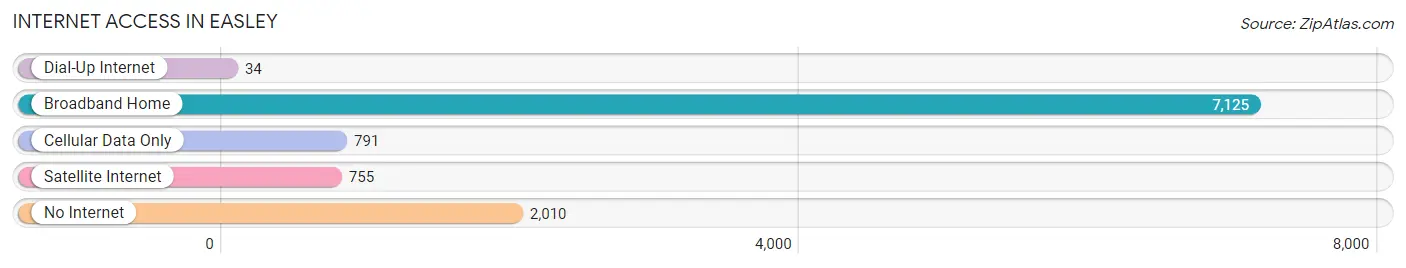
| Internet Type | # Households | % Households |
| Dial-Up Internet | 34 | 0.3% |
| Broadband Home | 7,125 | 69.5% |
| Cellular Data Only | 791 | 7.7% |
| Satellite Internet | 755 | 7.4% |
| No Internet | 2,010 | 19.6% |
| Total | 10,252 | 100.0% |
Easley Summary
Easley is a city located in Pickens County, South Carolina, United States. It is situated in the foothills of the Blue Ridge Mountains, about 20 miles from Greenville. The population was 19,993 at the 2010 census, with an estimated population of 20,890 in 2019.
Geography
Easley is located in the foothills of the Blue Ridge Mountains at an elevation of 890 feet. It is situated in the Piedmont region of South Carolina, about 20 miles from Greenville. The city is bordered by the Saluda River to the north and the Reedy River to the south. The city is located in the northwest corner of Pickens County, with the city limits extending into Anderson County to the west.
Climate
Easley has a humid subtropical climate, with hot, humid summers and mild winters. The average annual temperature is 61.3°F, with an average high of 79.2°F in July and an average low of 43.3°F in January. The average annual precipitation is 46.2 inches, with an average of 4.7 inches of snowfall per year.
Demographics
As of the 2010 census, there were 19,993 people, 7,845 households, and 5,541 families residing in the city. The population density was 1,093.3 people per square mile. The racial makeup of the city was 79.2% White, 15.3% African American, 0.3% Native American, 1.7% Asian, 0.1% Pacific Islander, 1.7% from other races, and 1.9% from two or more races. Hispanic or Latino of any race were 4.2% of the population.
Economy
Easley is home to several major employers, including the Easley Mill, a textile mill that has been in operation since the late 19th century. Other major employers include the Easley Medical Center, the Easley Municipal Airport, and the Easley Municipal Golf Course. The city is also home to several small businesses, including restaurants, retail stores, and professional services.
Education
Easley is served by the Pickens County School District, which operates seven elementary schools, two middle schools, and two high schools. The city is also home to Tri-County Technical College, a two-year public college that offers associate degrees and certificate programs.
Conclusion
Easley is a city located in Pickens County, South Carolina, United States. It is situated in the foothills of the Blue Ridge Mountains, about 20 miles from Greenville. The population was 19,993 at the 2010 census, with an estimated population of 20,890 in 2019. The city has a humid subtropical climate, with hot, humid summers and mild winters. The racial makeup of the city was 79.2% White, 15.3% African American, 0.3% Native American, 1.7% Asian, 0.1% Pacific Islander, 1.7% from other races, and 1.9% from two or more races. Hispanic or Latino of any race were 4.2% of the population. The economy of Easley is largely based on the textile industry, with the Easley Mill being the largest employer in the city. The city is also home to several small businesses, including restaurants, retail stores, and professional services. The city is served by the Pickens County School District, which operates seven elementary schools, two middle schools, and two high schools. Tri-County Technical College is also located in the city, offering associate degrees and certificate programs.
Common Questions
What is Per Capita Income in Easley?
Per Capita income in Easley is $44,672.
What is the Median Family Income in Easley?
Median Family Income in Easley is $79,151.
What is the Median Household income in Easley?
Median Household Income in Easley is $62,551.
What is Income or Wage Gap in Easley?
Income or Wage Gap in Easley is 33.1%.
Women in Easley earn 66.9 cents for every dollar earned by a man.
What is Family Income Deficit in Easley?
Family Income Deficit in Easley is $10,473.
Families that are below poverty line in Easley earn $10,473 less on average than the poverty threshold level.
What is Inequality or Gini Index in Easley?
Inequality or Gini Index in Easley is 0.56.
What is the Total Population of Easley?
Total Population of Easley is 23,135.
What is the Total Male Population of Easley?
Total Male Population of Easley is 10,902.
What is the Total Female Population of Easley?
Total Female Population of Easley is 12,233.
What is the Ratio of Males per 100 Females in Easley?
There are 89.12 Males per 100 Females in Easley.
What is the Ratio of Females per 100 Males in Easley?
There are 112.21 Females per 100 Males in Easley.
What is the Median Population Age in Easley?
Median Population Age in Easley is 42.8 Years.
What is the Average Family Size in Easley
Average Family Size in Easley is 2.8 People.
What is the Average Household Size in Easley
Average Household Size in Easley is 2.2 People.
How Large is the Labor Force in Easley?
There are 11,646 People in the Labor Forcein in Easley.
What is the Percentage of People in the Labor Force in Easley?
60.3% of People are in the Labor Force in Easley.
What is the Unemployment Rate in Easley?
Unemployment Rate in Easley is 3.8%.