Lugoff, SC Map & Demographics
Lugoff Map
Lugoff Overview
$28,041
PER CAPITA INCOME
$71,591
AVG FAMILY INCOME
$57,885
AVG HOUSEHOLD INCOME
29.8%
WAGE / INCOME GAP [ % ]
70.2¢/ $1
WAGE / INCOME GAP [ $ ]
$11,046
FAMILY INCOME DEFICIT
0.41
INEQUALITY / GINI INDEX
9,423
TOTAL POPULATION
4,814
MALE POPULATION
4,609
FEMALE POPULATION
104.45
MALES / 100 FEMALES
95.74
FEMALES / 100 MALES
39.4
MEDIAN AGE
3.1
AVG FAMILY SIZE
2.7
AVG HOUSEHOLD SIZE
4,306
LABOR FORCE [ PEOPLE ]
58.3%
PERCENT IN LABOR FORCE
3.7%
UNEMPLOYMENT RATE
Lugoff Zip Codes
Lugoff Area Codes
Income in Lugoff
Income Overview in Lugoff
Per Capita Income in Lugoff is $28,041, while median incomes of families and households are $71,591 and $57,885 respectively.
| Characteristic | Number | Measure |
| Per Capita Income | 9,423 | $28,041 |
| Median Family Income | 2,566 | $71,591 |
| Mean Family Income | 2,566 | $83,194 |
| Median Household Income | 3,503 | $57,885 |
| Mean Household Income | 3,503 | $73,419 |
| Income Deficit | 2,566 | $11,046 |
| Wage / Income Gap (%) | 9,423 | 29.84% |
| Wage / Income Gap ($) | 9,423 | 70.16¢ per $1 |
| Gini / Inequality Index | 9,423 | 0.41 |
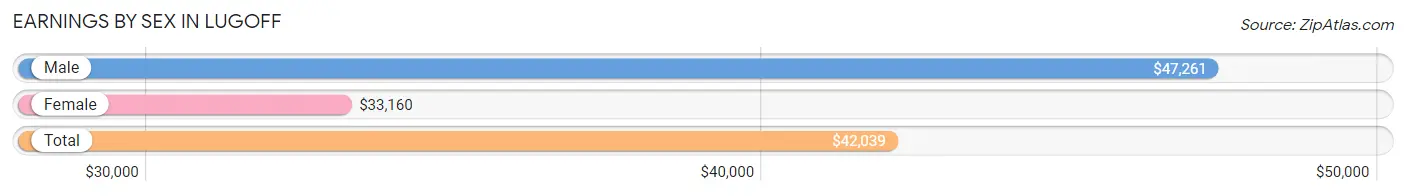
Earnings by Sex in Lugoff
Average Earnings in Lugoff are $42,039, $47,261 for men and $33,160 for women, a difference of 29.8%.
| Sex | Number | Average Earnings |
| Male | 2,415 (55.4%) | $47,261 |
| Female | 1,940 (44.6%) | $33,160 |
| Total | 4,355 (100.0%) | $42,039 |
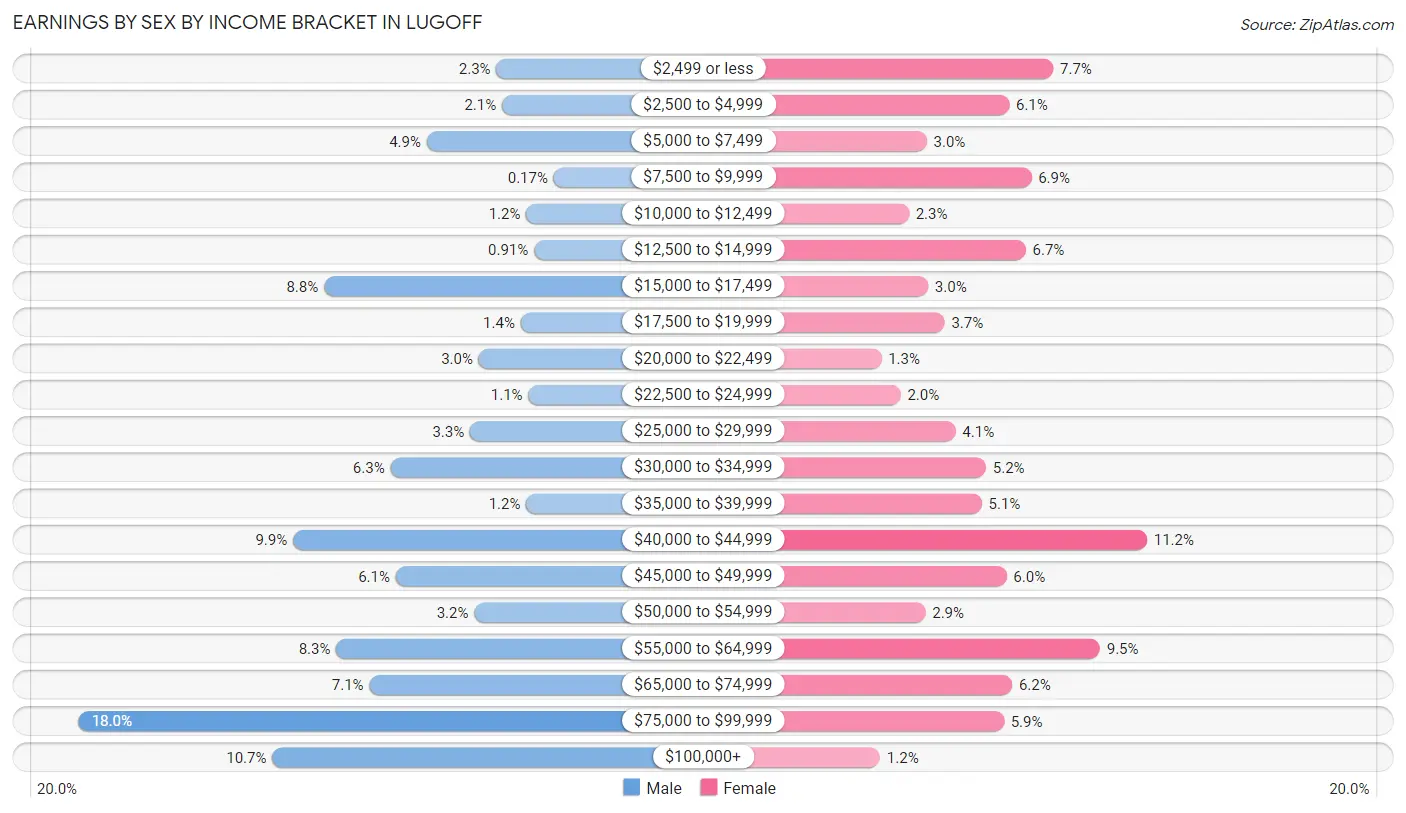
Earnings by Sex by Income Bracket in Lugoff
The most common earnings brackets in Lugoff are $75,000 to $99,999 for men (434 | 18.0%) and $40,000 to $44,999 for women (218 | 11.2%).
| Income | Male | Female |
| $2,499 or less | 56 (2.3%) | 150 (7.7%) |
| $2,500 to $4,999 | 51 (2.1%) | 118 (6.1%) |
| $5,000 to $7,499 | 119 (4.9%) | 58 (3.0%) |
| $7,500 to $9,999 | 4 (0.2%) | 134 (6.9%) |
| $10,000 to $12,499 | 29 (1.2%) | 45 (2.3%) |
| $12,500 to $14,999 | 22 (0.9%) | 130 (6.7%) |
| $15,000 to $17,499 | 212 (8.8%) | 59 (3.0%) |
| $17,500 to $19,999 | 34 (1.4%) | 71 (3.7%) |
| $20,000 to $22,499 | 72 (3.0%) | 25 (1.3%) |
| $22,500 to $24,999 | 27 (1.1%) | 39 (2.0%) |
| $25,000 to $29,999 | 80 (3.3%) | 79 (4.1%) |
| $30,000 to $34,999 | 152 (6.3%) | 101 (5.2%) |
| $35,000 to $39,999 | 29 (1.2%) | 98 (5.1%) |
| $40,000 to $44,999 | 240 (9.9%) | 218 (11.2%) |
| $45,000 to $49,999 | 147 (6.1%) | 116 (6.0%) |
| $50,000 to $54,999 | 76 (3.2%) | 57 (2.9%) |
| $55,000 to $64,999 | 201 (8.3%) | 184 (9.5%) |
| $65,000 to $74,999 | 171 (7.1%) | 120 (6.2%) |
| $75,000 to $99,999 | 434 (18.0%) | 114 (5.9%) |
| $100,000+ | 259 (10.7%) | 24 (1.2%) |
| Total | 2,415 (100.0%) | 1,940 (100.0%) |
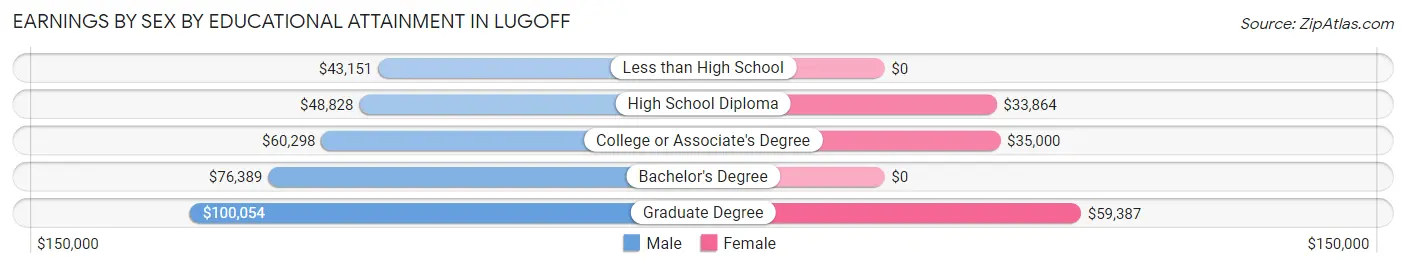
Earnings by Sex by Educational Attainment in Lugoff
Average earnings in Lugoff are $56,837 for men and $37,483 for women, a difference of 34.1%. Men with an educational attainment of graduate degree enjoy the highest average annual earnings of $100,054, while those with less than high school education earn the least with $43,151. Women with an educational attainment of graduate degree earn the most with the average annual earnings of $59,387, while those with high school diploma education have the smallest earnings of $33,864.
| Educational Attainment | Male Income | Female Income |
| Less than High School | $43,151 | $0 |
| High School Diploma | $48,828 | $33,864 |
| College or Associate's Degree | $60,298 | $35,000 |
| Bachelor's Degree | $76,389 | $0 |
| Graduate Degree | $100,054 | $59,387 |
| Total | $56,837 | $37,483 |
Family Income in Lugoff
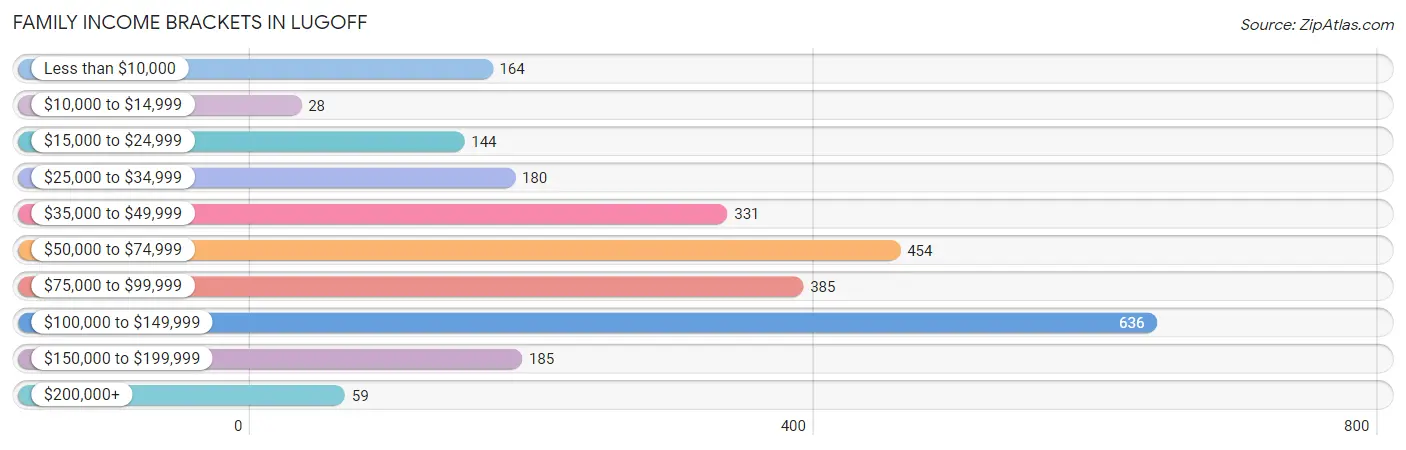
Family Income Brackets in Lugoff
According to the Lugoff family income data, there are 636 families falling into the $100,000 to $149,999 income range, which is the most common income bracket and makes up 24.8% of all families. Conversely, the $10,000 to $14,999 income bracket is the least frequent group with only 28 families (1.1%) belonging to this category.
| Income Bracket | # Families | % Families |
| Less than $10,000 | 164 | 6.4% |
| $10,000 to $14,999 | 28 | 1.1% |
| $15,000 to $24,999 | 144 | 5.6% |
| $25,000 to $34,999 | 180 | 7.0% |
| $35,000 to $49,999 | 331 | 12.9% |
| $50,000 to $74,999 | 454 | 17.7% |
| $75,000 to $99,999 | 385 | 15.0% |
| $100,000 to $149,999 | 636 | 24.8% |
| $150,000 to $199,999 | 185 | 7.2% |
| $200,000+ | 59 | 2.3% |
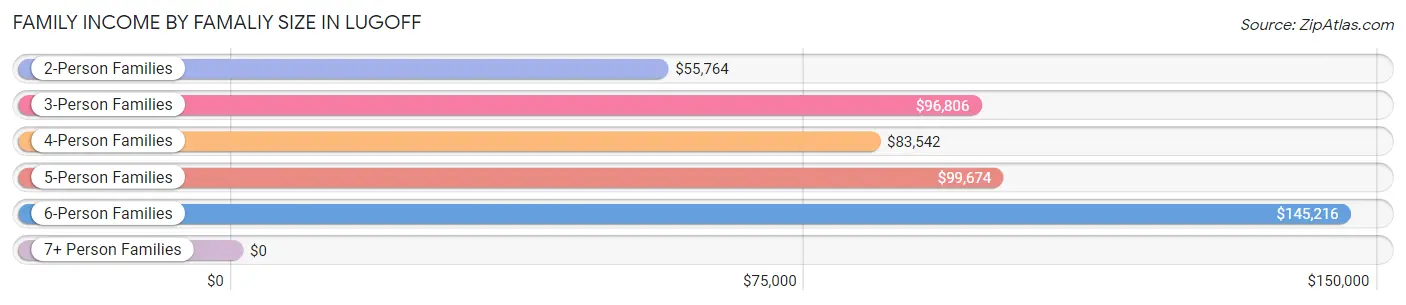
Family Income by Famaliy Size in Lugoff
6-person families (119 | 4.6%) account for the highest median family income in Lugoff with $145,216 per family, while 3-person families (390 | 15.2%) have the highest median income of $32,269 per family member.
| Income Bracket | # Families | Median Income |
| 2-Person Families | 1,341 (52.3%) | $55,764 |
| 3-Person Families | 390 (15.2%) | $96,806 |
| 4-Person Families | 538 (21.0%) | $83,542 |
| 5-Person Families | 178 (6.9%) | $99,674 |
| 6-Person Families | 119 (4.6%) | $145,216 |
| 7+ Person Families | 0 (0.0%) | $0 |
| Total | 2,566 (100.0%) | $71,591 |
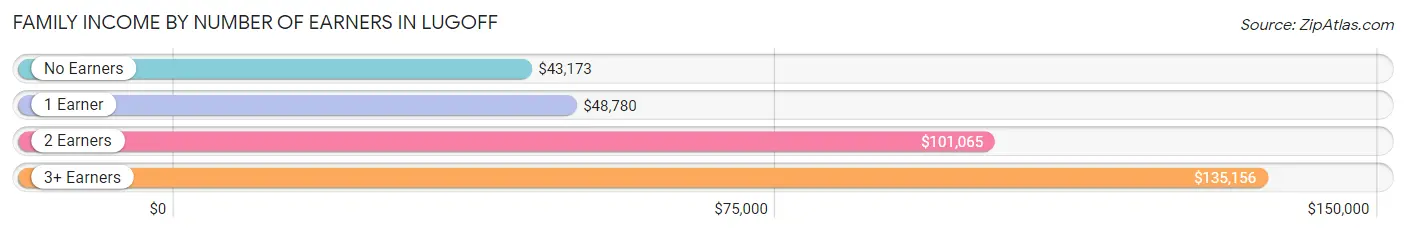
Family Income by Number of Earners in Lugoff
The median family income in Lugoff is $71,591, with families comprising 3+ earners (99) having the highest median family income of $135,156, while families with no earners (544) have the lowest median family income of $43,173, accounting for 3.9% and 21.2% of families, respectively.
| Number of Earners | # Families | Median Income |
| No Earners | 544 (21.2%) | $43,173 |
| 1 Earner | 724 (28.2%) | $48,780 |
| 2 Earners | 1,199 (46.7%) | $101,065 |
| 3+ Earners | 99 (3.9%) | $135,156 |
| Total | 2,566 (100.0%) | $71,591 |
Household Income in Lugoff
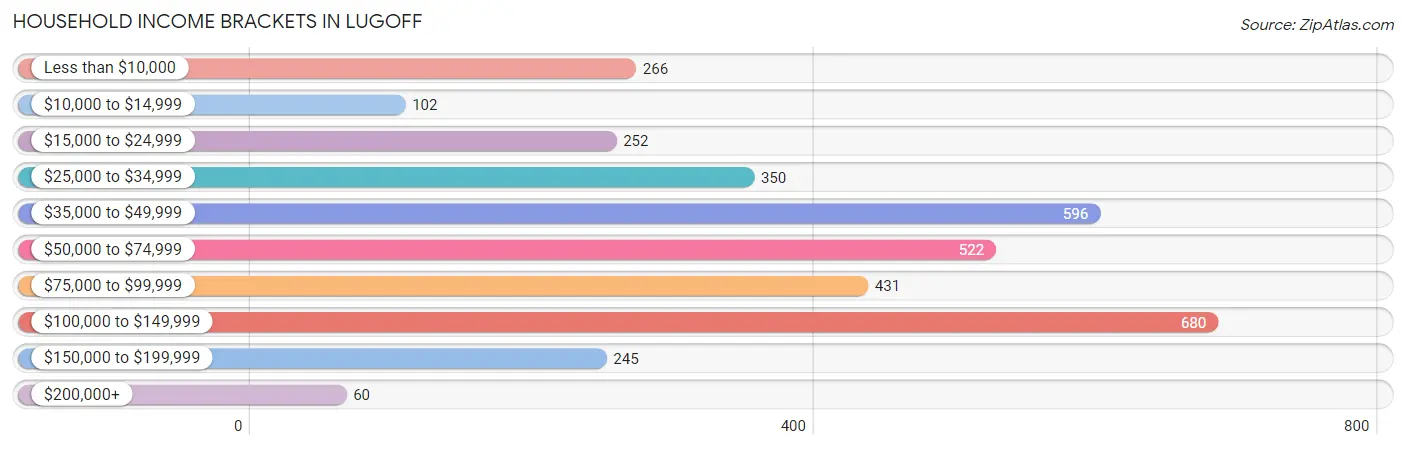
Household Income Brackets in Lugoff
With 680 households falling in the category, the $100,000 to $149,999 income range is the most frequent in Lugoff, accounting for 19.4% of all households. In contrast, only 60 households (1.7%) fall into the $200,000+ income bracket, making it the least populous group.
| Income Bracket | # Households | % Households |
| Less than $10,000 | 266 | 7.6% |
| $10,000 to $14,999 | 102 | 2.9% |
| $15,000 to $24,999 | 252 | 7.2% |
| $25,000 to $34,999 | 350 | 10.0% |
| $35,000 to $49,999 | 596 | 17.0% |
| $50,000 to $74,999 | 522 | 14.9% |
| $75,000 to $99,999 | 431 | 12.3% |
| $100,000 to $149,999 | 680 | 19.4% |
| $150,000 to $199,999 | 245 | 7.0% |
| $200,000+ | 60 | 1.7% |
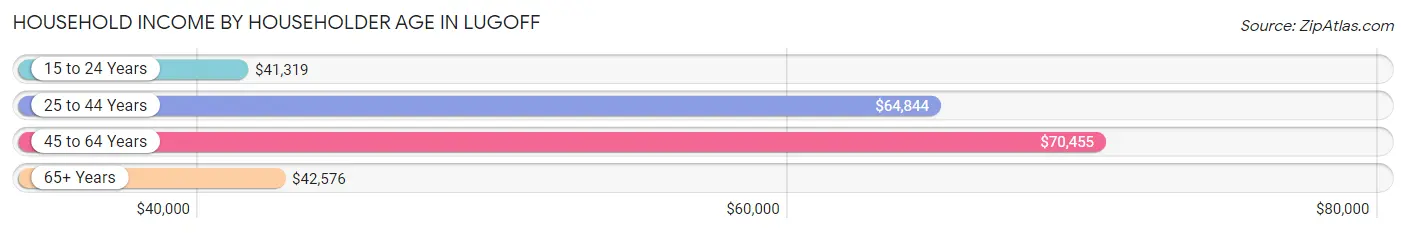
Household Income by Householder Age in Lugoff
The median household income in Lugoff is $57,885, with the highest median household income of $70,455 found in the 45 to 64 years age bracket for the primary householder. A total of 1,430 households (40.8%) fall into this category. Meanwhile, the 15 to 24 years age bracket for the primary householder has the lowest median household income of $41,319, with 95 households (2.7%) in this group.
| Income Bracket | # Households | Median Income |
| 15 to 24 Years | 95 (2.7%) | $41,319 |
| 25 to 44 Years | 1,074 (30.7%) | $64,844 |
| 45 to 64 Years | 1,430 (40.8%) | $70,455 |
| 65+ Years | 904 (25.8%) | $42,576 |
| Total | 3,503 (100.0%) | $57,885 |
Poverty in Lugoff
Income Below Poverty by Sex and Age in Lugoff
With 14.7% poverty level for males and 15.5% for females among the residents of Lugoff, 16 and 17 year old males and 25 to 34 year old females are the most vulnerable to poverty, with 40 males (35.7%) and 159 females (35.4%) in their respective age groups living below the poverty level.
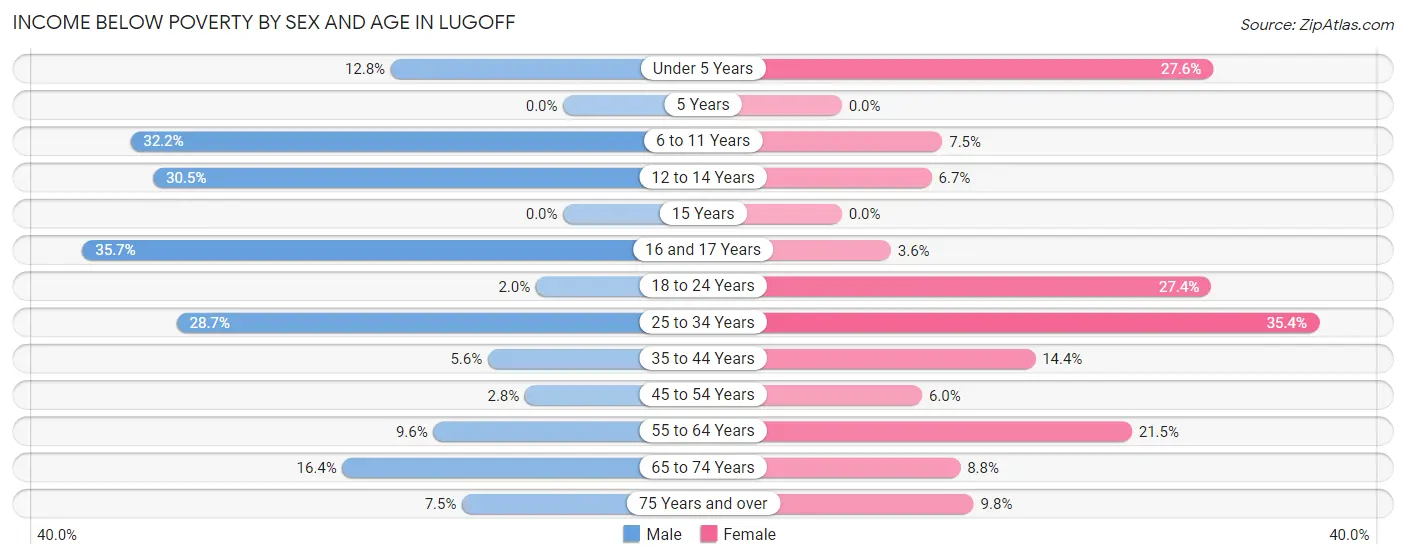
| Age Bracket | Male | Female |
| Under 5 Years | 42 (12.8%) | 62 (27.6%) |
| 5 Years | 0 (0.0%) | 0 (0.0%) |
| 6 to 11 Years | 191 (32.2%) | 32 (7.5%) |
| 12 to 14 Years | 46 (30.5%) | 8 (6.7%) |
| 15 Years | 0 (0.0%) | 0 (0.0%) |
| 16 and 17 Years | 40 (35.7%) | 6 (3.6%) |
| 18 to 24 Years | 10 (2.0%) | 99 (27.4%) |
| 25 to 34 Years | 178 (28.7%) | 159 (35.4%) |
| 35 to 44 Years | 26 (5.6%) | 85 (14.4%) |
| 45 to 54 Years | 13 (2.8%) | 36 (5.9%) |
| 55 to 64 Years | 69 (9.6%) | 141 (21.5%) |
| 65 to 74 Years | 69 (16.4%) | 47 (8.8%) |
| 75 Years and over | 24 (7.5%) | 41 (9.8%) |
| Total | 708 (14.7%) | 716 (15.5%) |
Income Above Poverty by Sex and Age in Lugoff
According to the poverty statistics in Lugoff, males aged 5 years and females aged 5 years are the age groups that are most secure financially, with 100.0% of males and 100.0% of females in these age groups living above the poverty line.
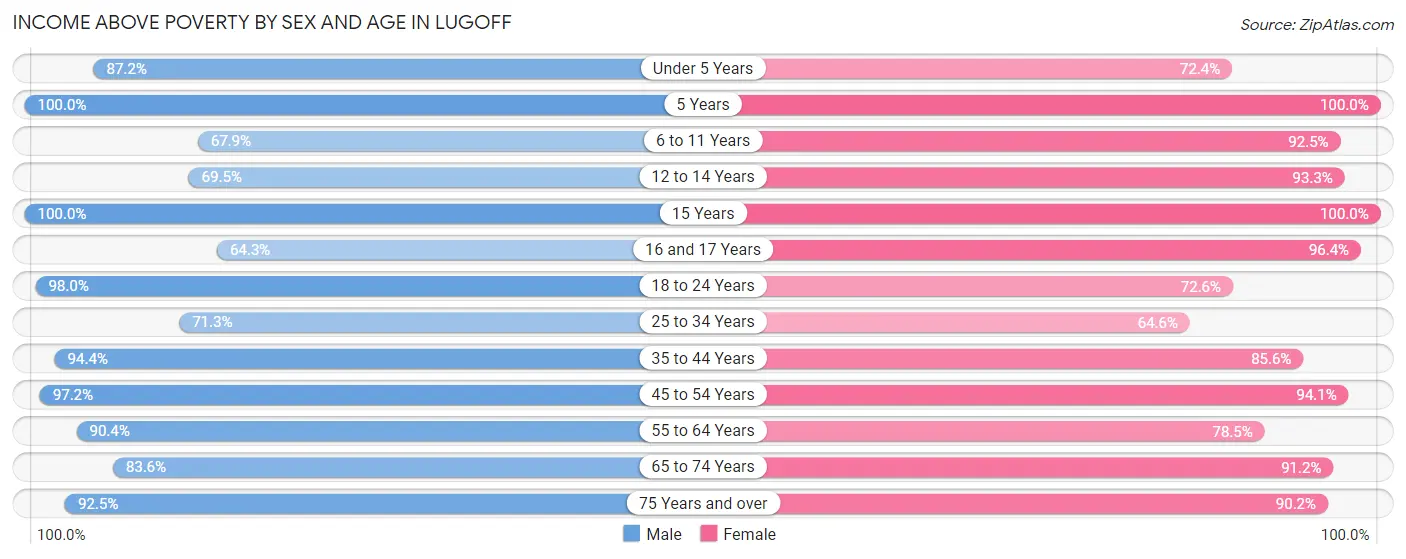
| Age Bracket | Male | Female |
| Under 5 Years | 286 (87.2%) | 163 (72.4%) |
| 5 Years | 11 (100.0%) | 36 (100.0%) |
| 6 to 11 Years | 403 (67.8%) | 397 (92.5%) |
| 12 to 14 Years | 105 (69.5%) | 112 (93.3%) |
| 15 Years | 125 (100.0%) | 18 (100.0%) |
| 16 and 17 Years | 72 (64.3%) | 159 (96.4%) |
| 18 to 24 Years | 483 (98.0%) | 262 (72.6%) |
| 25 to 34 Years | 442 (71.3%) | 290 (64.6%) |
| 35 to 44 Years | 439 (94.4%) | 507 (85.6%) |
| 45 to 54 Years | 445 (97.2%) | 569 (94.1%) |
| 55 to 64 Years | 647 (90.4%) | 514 (78.5%) |
| 65 to 74 Years | 352 (83.6%) | 488 (91.2%) |
| 75 Years and over | 296 (92.5%) | 378 (90.2%) |
| Total | 4,106 (85.3%) | 3,893 (84.5%) |
Income Below Poverty Among Married-Couple Families in Lugoff
The poverty statistics for married-couple families in Lugoff show that 10.9% or 212 of the total 1,950 families live below the poverty line. Families with 1 or 2 children have the highest poverty rate of 22.8%, comprising of 151 families. On the other hand, families with 3 or 4 children have the lowest poverty rate of 0.0%, which includes 0 families.
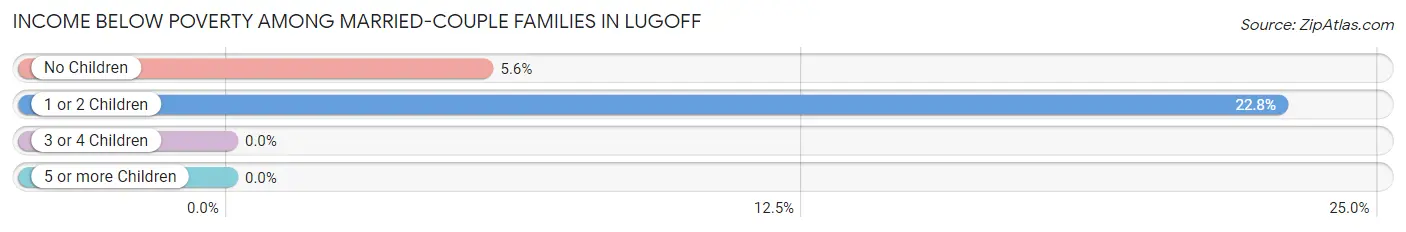
| Children | Above Poverty | Below Poverty |
| No Children | 1,037 (94.4%) | 61 (5.6%) |
| 1 or 2 Children | 510 (77.2%) | 151 (22.8%) |
| 3 or 4 Children | 191 (100.0%) | 0 (0.0%) |
| 5 or more Children | 0 (0.0%) | 0 (0.0%) |
| Total | 1,738 (89.1%) | 212 (10.9%) |
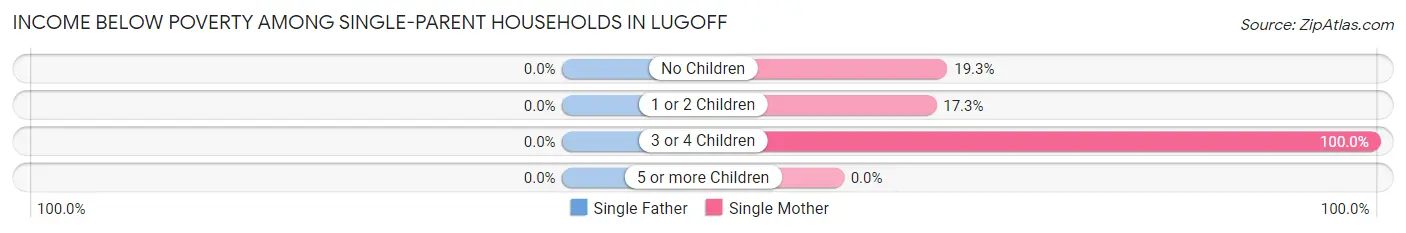
Income Below Poverty Among Single-Parent Households in Lugoff
| Children | Single Father | Single Mother |
| No Children | 0 (0.0%) | 28 (19.3%) |
| 1 or 2 Children | 0 (0.0%) | 49 (17.2%) |
| 3 or 4 Children | 0 (0.0%) | 17 (100.0%) |
| 5 or more Children | 0 (0.0%) | 0 (0.0%) |
| Total | 0 (0.0%) | 94 (21.1%) |
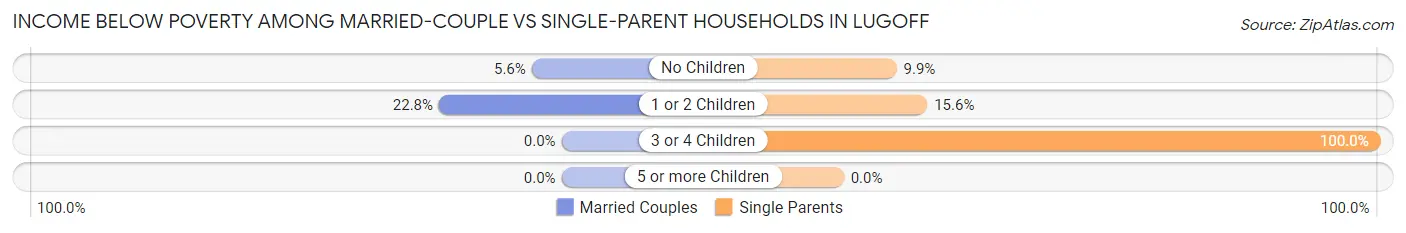
Income Below Poverty Among Married-Couple vs Single-Parent Households in Lugoff
The poverty data for Lugoff shows that 212 of the married-couple family households (10.9%) and 94 of the single-parent households (15.3%) are living below the poverty level. Within the married-couple family households, those with 1 or 2 children have the highest poverty rate, with 151 households (22.8%) falling below the poverty line. Among the single-parent households, those with 3 or 4 children have the highest poverty rate, with 17 household (100.0%) living below poverty.
| Children | Married-Couple Families | Single-Parent Households |
| No Children | 61 (5.6%) | 28 (9.9%) |
| 1 or 2 Children | 151 (22.8%) | 49 (15.6%) |
| 3 or 4 Children | 0 (0.0%) | 17 (100.0%) |
| 5 or more Children | 0 (0.0%) | 0 (0.0%) |
| Total | 212 (10.9%) | 94 (15.3%) |
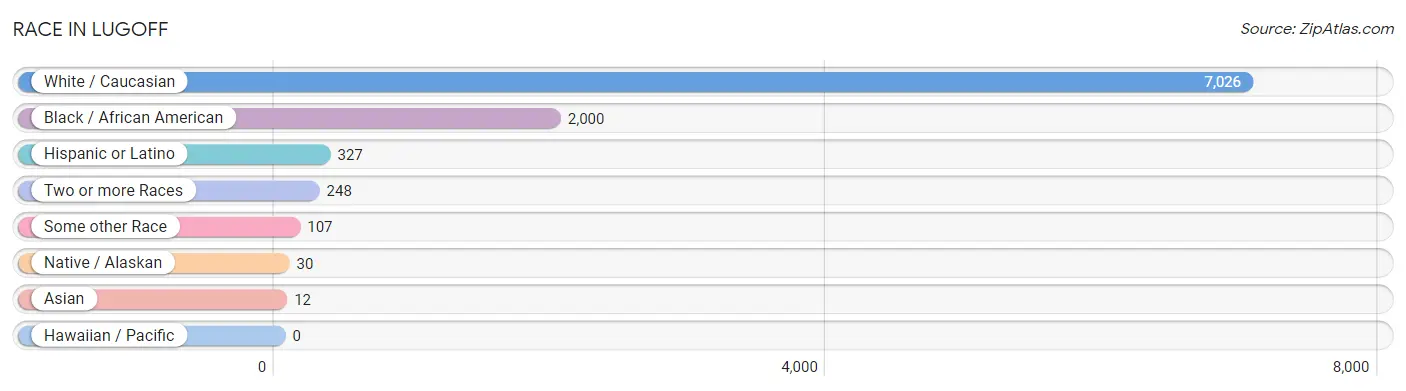
Race in Lugoff
The most populous races in Lugoff are White / Caucasian (7,026 | 74.6%), Black / African American (2,000 | 21.2%), and Hispanic or Latino (327 | 3.5%).
| Race | # Population | % Population |
| Asian | 12 | 0.1% |
| Black / African American | 2,000 | 21.2% |
| Hawaiian / Pacific | 0 | 0.0% |
| Hispanic or Latino | 327 | 3.5% |
| Native / Alaskan | 30 | 0.3% |
| White / Caucasian | 7,026 | 74.6% |
| Two or more Races | 248 | 2.6% |
| Some other Race | 107 | 1.1% |
| Total | 9,423 | 100.0% |
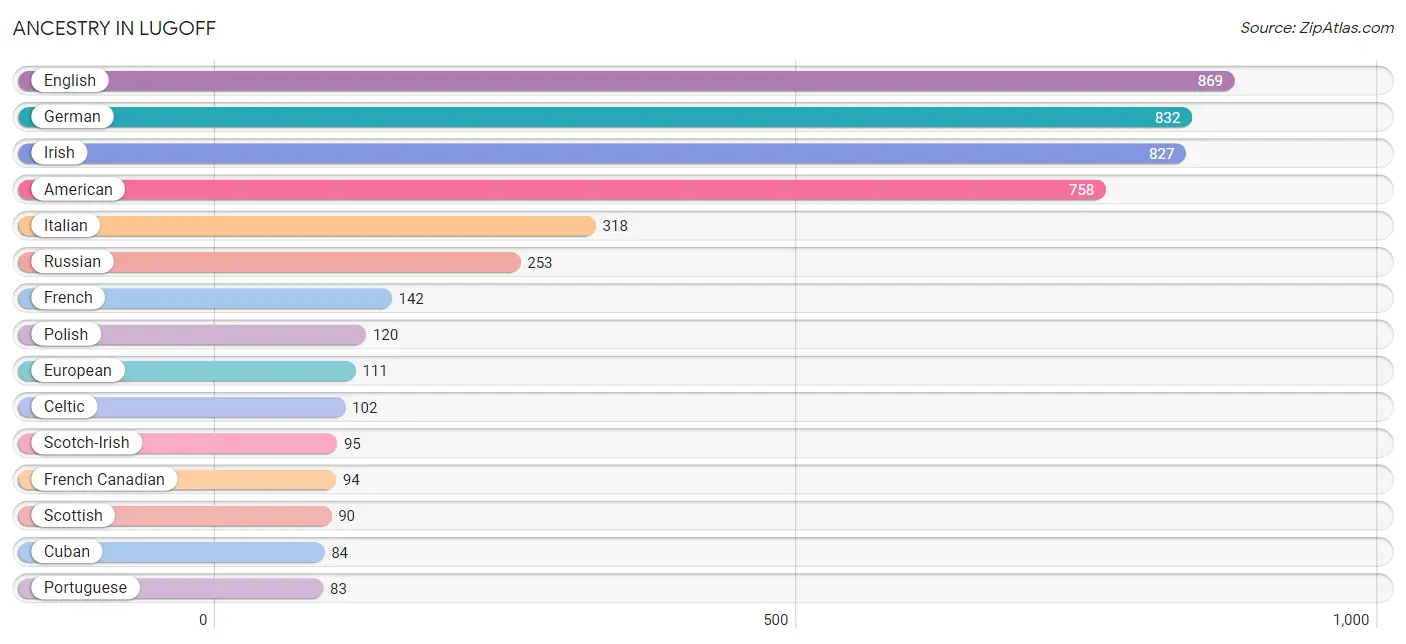
Ancestry in Lugoff
The most populous ancestries reported in Lugoff are English (869 | 9.2%), German (832 | 8.8%), Irish (827 | 8.8%), American (758 | 8.0%), and Italian (318 | 3.4%), together accounting for 38.2% of all Lugoff residents.
| Ancestry | # Population | % Population |
| African | 49 | 0.5% |
| American | 758 | 8.0% |
| Apache | 30 | 0.3% |
| Arab | 8 | 0.1% |
| Austrian | 9 | 0.1% |
| Belgian | 2 | 0.0% |
| British | 16 | 0.2% |
| Burmese | 12 | 0.1% |
| Celtic | 102 | 1.1% |
| Cherokee | 25 | 0.3% |
| Colombian | 13 | 0.1% |
| Cuban | 84 | 0.9% |
| Danish | 15 | 0.2% |
| Dominican | 10 | 0.1% |
| Dutch | 24 | 0.3% |
| Eastern European | 45 | 0.5% |
| English | 869 | 9.2% |
| European | 111 | 1.2% |
| French | 142 | 1.5% |
| French Canadian | 94 | 1.0% |
| German | 832 | 8.8% |
| Guyanese | 14 | 0.2% |
| Hungarian | 21 | 0.2% |
| Irish | 827 | 8.8% |
| Italian | 318 | 3.4% |
| Latvian | 21 | 0.2% |
| Lebanese | 8 | 0.1% |
| Mexican | 69 | 0.7% |
| Northern European | 13 | 0.1% |
| Norwegian | 11 | 0.1% |
| Polish | 120 | 1.3% |
| Portuguese | 83 | 0.9% |
| Puerto Rican | 54 | 0.6% |
| Russian | 253 | 2.7% |
| Scandinavian | 16 | 0.2% |
| Scotch-Irish | 95 | 1.0% |
| Scottish | 90 | 1.0% |
| South American | 13 | 0.1% |
| Subsaharan African | 49 | 0.5% |
| Ukrainian | 9 | 0.1% |
| Welsh | 65 | 0.7% | View All 41 Rows |
Immigrants in Lugoff
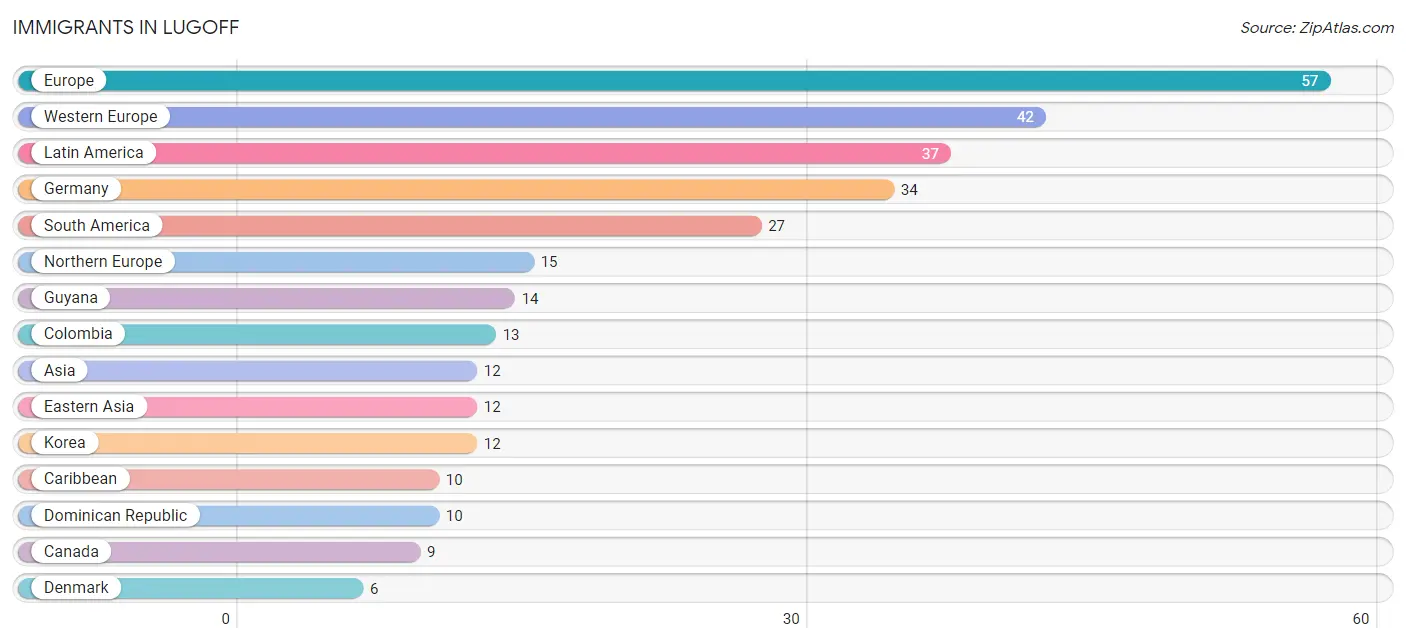
The most numerous immigrant groups reported in Lugoff came from Europe (57 | 0.6%), Western Europe (42 | 0.4%), Latin America (37 | 0.4%), Germany (34 | 0.4%), and South America (27 | 0.3%), together accounting for 2.1% of all Lugoff residents.
| Immigration Origin | # Population | % Population |
| Asia | 12 | 0.1% |
| Belgium | 2 | 0.0% |
| Canada | 9 | 0.1% |
| Caribbean | 10 | 0.1% |
| Colombia | 13 | 0.1% |
| Denmark | 6 | 0.1% |
| Dominican Republic | 10 | 0.1% |
| Eastern Asia | 12 | 0.1% |
| England | 6 | 0.1% |
| Europe | 57 | 0.6% |
| Germany | 34 | 0.4% |
| Guyana | 14 | 0.2% |
| Korea | 12 | 0.1% |
| Latin America | 37 | 0.4% |
| Netherlands | 6 | 0.1% |
| Northern Europe | 15 | 0.2% |
| South America | 27 | 0.3% |
| Western Europe | 42 | 0.4% | View All 18 Rows |
Sex and Age in Lugoff
Sex and Age in Lugoff
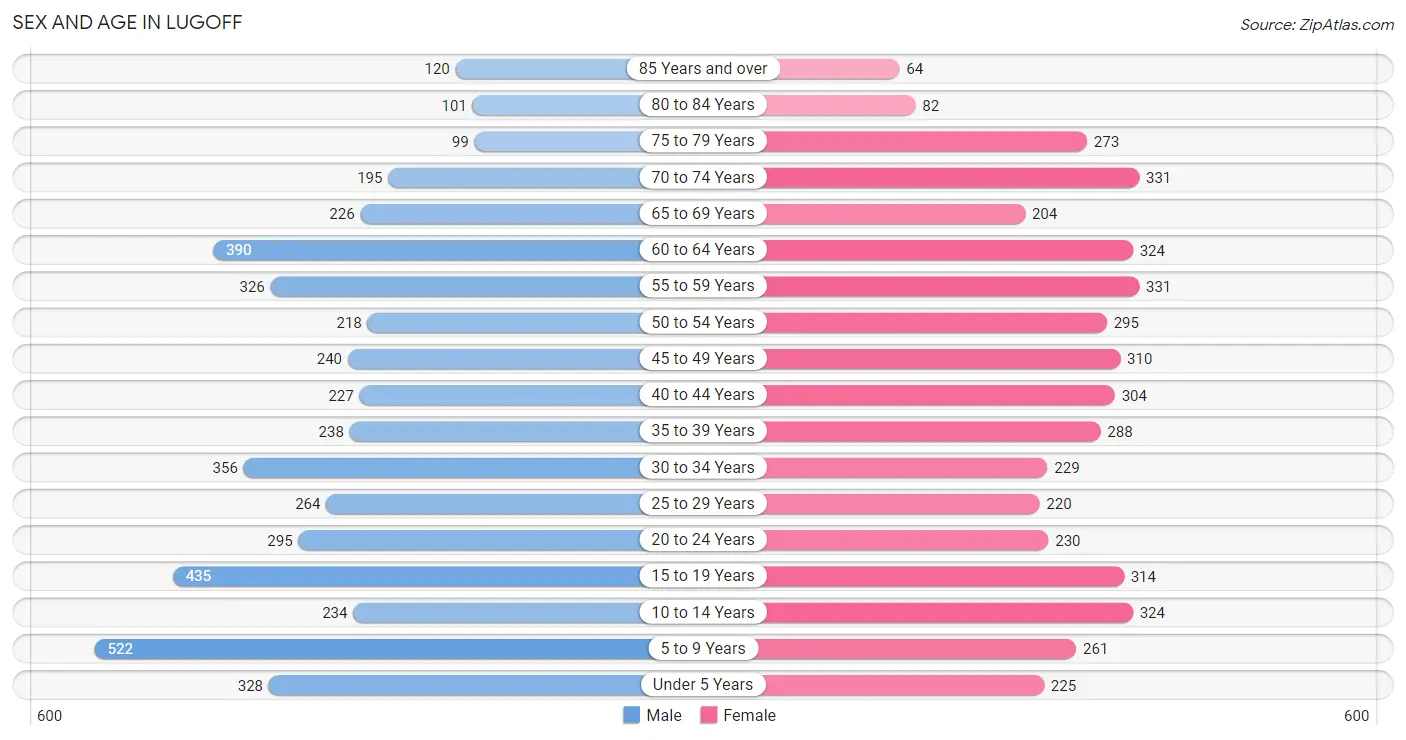
The most populous age groups in Lugoff are 5 to 9 Years (522 | 10.8%) for men and 55 to 59 Years (331 | 7.2%) for women.
| Age Bracket | Male | Female |
| Under 5 Years | 328 (6.8%) | 225 (4.9%) |
| 5 to 9 Years | 522 (10.8%) | 261 (5.7%) |
| 10 to 14 Years | 234 (4.9%) | 324 (7.0%) |
| 15 to 19 Years | 435 (9.0%) | 314 (6.8%) |
| 20 to 24 Years | 295 (6.1%) | 230 (5.0%) |
| 25 to 29 Years | 264 (5.5%) | 220 (4.8%) |
| 30 to 34 Years | 356 (7.4%) | 229 (5.0%) |
| 35 to 39 Years | 238 (4.9%) | 288 (6.2%) |
| 40 to 44 Years | 227 (4.7%) | 304 (6.6%) |
| 45 to 49 Years | 240 (5.0%) | 310 (6.7%) |
| 50 to 54 Years | 218 (4.5%) | 295 (6.4%) |
| 55 to 59 Years | 326 (6.8%) | 331 (7.2%) |
| 60 to 64 Years | 390 (8.1%) | 324 (7.0%) |
| 65 to 69 Years | 226 (4.7%) | 204 (4.4%) |
| 70 to 74 Years | 195 (4.1%) | 331 (7.2%) |
| 75 to 79 Years | 99 (2.1%) | 273 (5.9%) |
| 80 to 84 Years | 101 (2.1%) | 82 (1.8%) |
| 85 Years and over | 120 (2.5%) | 64 (1.4%) |
| Total | 4,814 (100.0%) | 4,609 (100.0%) |
Families and Households in Lugoff
Median Family Size in Lugoff
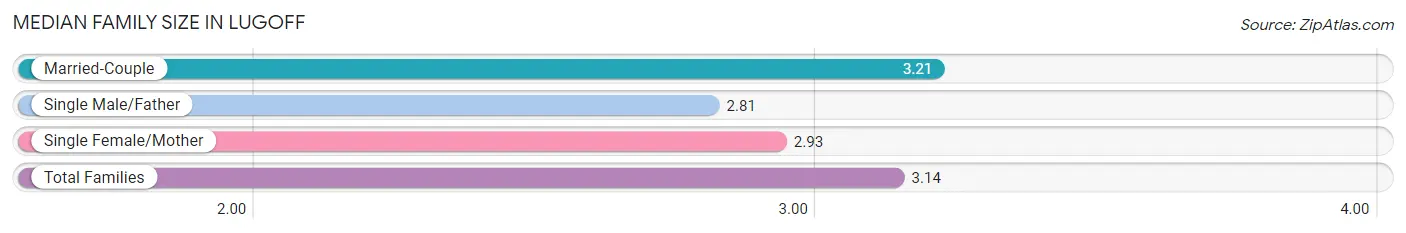
The median family size in Lugoff is 3.14 persons per family, with married-couple families (1,950 | 76.0%) accounting for the largest median family size of 3.21 persons per family. On the other hand, single male/father families (170 | 6.6%) represent the smallest median family size with 2.81 persons per family.
| Family Type | # Families | Family Size |
| Married-Couple | 1,950 (76.0%) | 3.21 |
| Single Male/Father | 170 (6.6%) | 2.81 |
| Single Female/Mother | 446 (17.4%) | 2.93 |
| Total Families | 2,566 (100.0%) | 3.14 |
Median Household Size in Lugoff
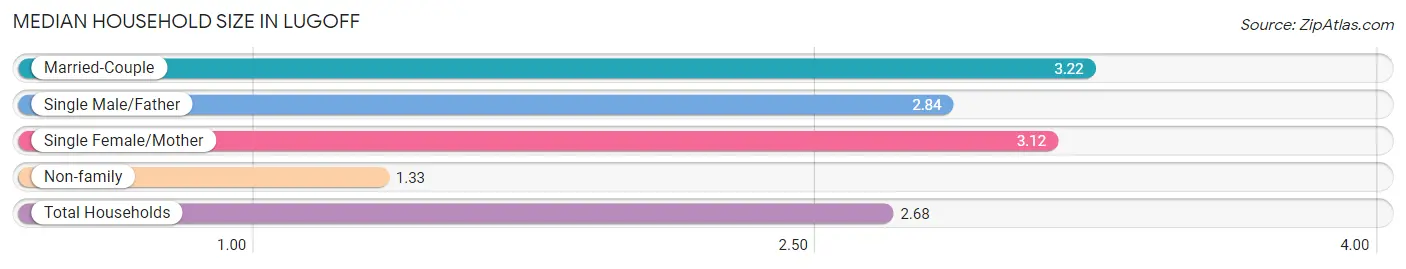
The median household size in Lugoff is 2.68 persons per household, with married-couple households (1,950 | 55.7%) accounting for the largest median household size of 3.22 persons per household. non-family households (937 | 26.8%) represent the smallest median household size with 1.33 persons per household.
| Household Type | # Households | Household Size |
| Married-Couple | 1,950 (55.7%) | 3.22 |
| Single Male/Father | 170 (4.9%) | 2.84 |
| Single Female/Mother | 446 (12.7%) | 3.12 |
| Non-family | 937 (26.8%) | 1.33 |
| Total Households | 3,503 (100.0%) | 2.68 |
Household Size by Marriage Status in Lugoff
Out of a total of 3,503 households in Lugoff, 2,566 (73.3%) are family households, while 937 (26.8%) are nonfamily households. The most numerous type of family households are 2-person households, comprising 1,328, and the most common type of nonfamily households are 1-person households, comprising 711.
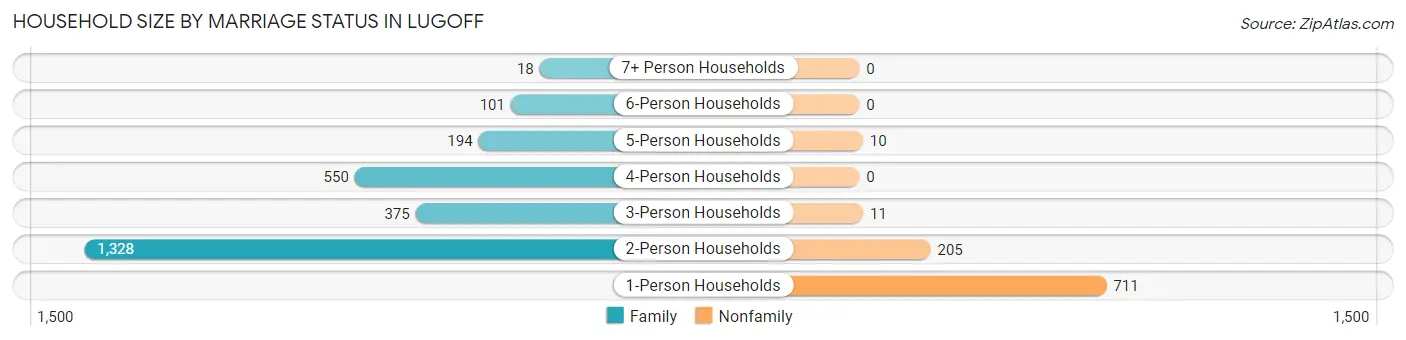
| Household Size | Family Households | Nonfamily Households |
| 1-Person Households | - | 711 (20.3%) |
| 2-Person Households | 1,328 (37.9%) | 205 (5.9%) |
| 3-Person Households | 375 (10.7%) | 11 (0.3%) |
| 4-Person Households | 550 (15.7%) | 0 (0.0%) |
| 5-Person Households | 194 (5.5%) | 10 (0.3%) |
| 6-Person Households | 101 (2.9%) | 0 (0.0%) |
| 7+ Person Households | 18 (0.5%) | 0 (0.0%) |
| Total | 2,566 (73.3%) | 937 (26.8%) |
Female Fertility in Lugoff
Fertility by Age in Lugoff
Average fertility rate in Lugoff is 37.0 births per 1,000 women. Women in the age bracket of 20 to 34 years have the highest fertility rate with 81.0 births per 1,000 women. Women in the age bracket of 20 to 34 years acount for 76.4% of all women with births.
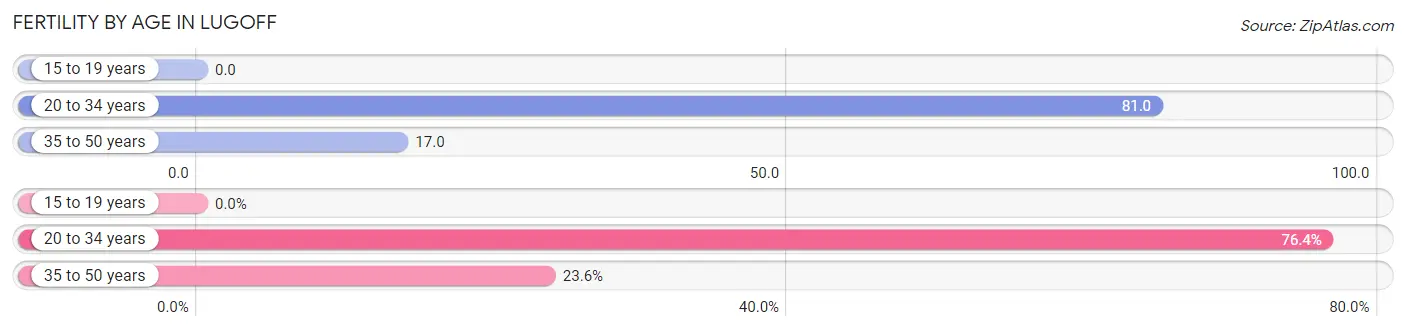
| Age Bracket | Women with Births | Births / 1,000 Women |
| 15 to 19 years | 0 (0.0%) | 0.0 |
| 20 to 34 years | 55 (76.4%) | 81.0 |
| 35 to 50 years | 17 (23.6%) | 17.0 |
| Total | 72 (100.0%) | 37.0 |
Fertility by Age by Marriage Status in Lugoff
76.4% of women with births (72) in Lugoff are married. The highest percentage of unmarried women with births falls into 20 to 34 years age bracket with 30.9% of them unmarried at the time of birth, while the lowest percentage of unmarried women with births belong to 35 to 50 years age bracket with 0.0% of them unmarried.
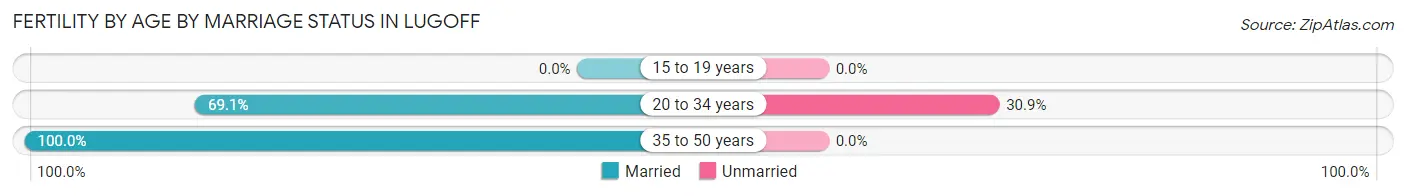
| Age Bracket | Married | Unmarried |
| 15 to 19 years | 0 (0.0%) | 0 (0.0%) |
| 20 to 34 years | 38 (69.1%) | 17 (30.9%) |
| 35 to 50 years | 17 (100.0%) | 0 (0.0%) |
| Total | 55 (76.4%) | 17 (23.6%) |
Fertility by Education in Lugoff
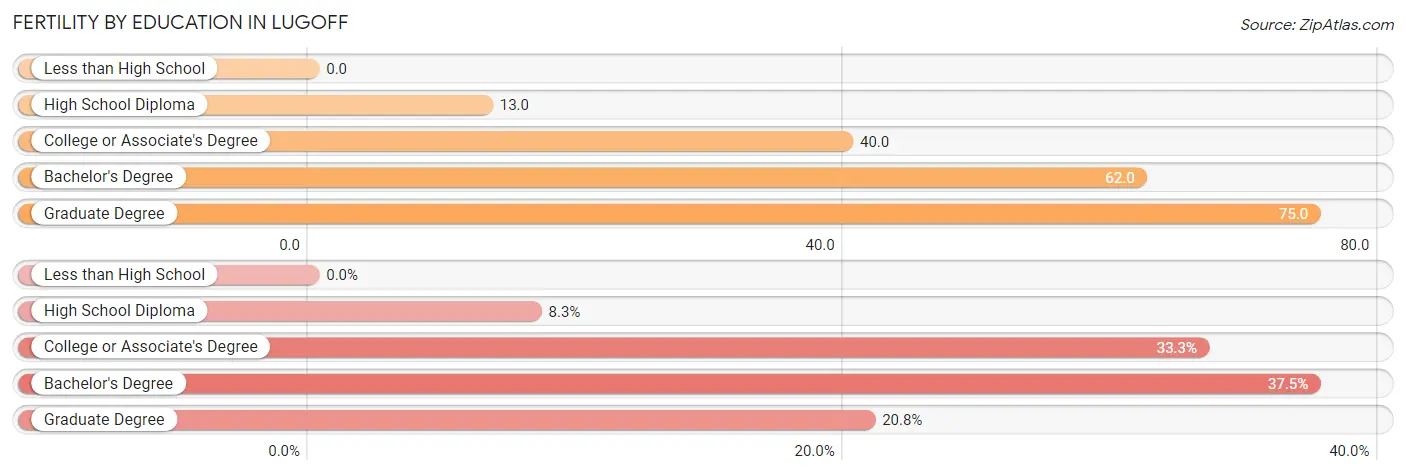
| Educational Attainment | Women with Births | Births / 1,000 Women |
| Less than High School | 0 (0.0%) | 0.0 |
| High School Diploma | 6 (8.3%) | 13.0 |
| College or Associate's Degree | 24 (33.3%) | 40.0 |
| Bachelor's Degree | 27 (37.5%) | 62.0 |
| Graduate Degree | 15 (20.8%) | 75.0 |
| Total | 72 (100.0%) | 37.0 |
Fertility by Education by Marriage Status in Lugoff
23.6% of women with births in Lugoff are unmarried. Women with the educational attainment of high school diploma are most likely to be married with 100.0% of them married at childbirth, while women with the educational attainment of college or associate's degree are least likely to be married with 70.8% of them unmarried at childbirth.
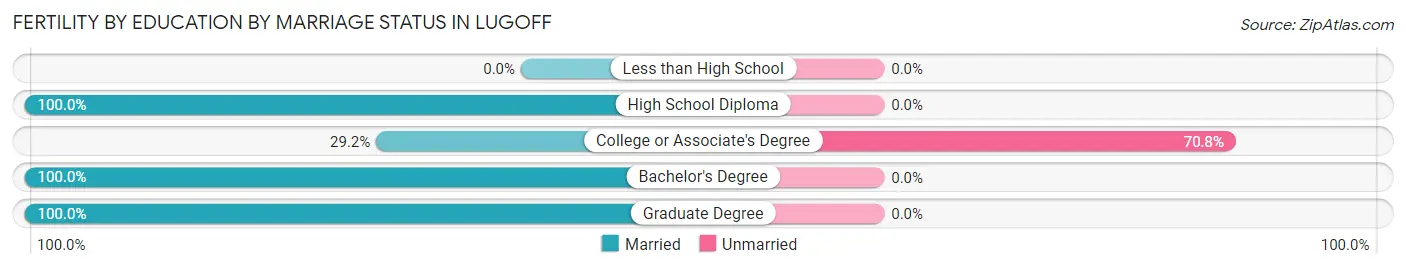
| Educational Attainment | Married | Unmarried |
| Less than High School | 0 (0.0%) | 0 (0.0%) |
| High School Diploma | 6 (100.0%) | 0 (0.0%) |
| College or Associate's Degree | 7 (29.2%) | 17 (70.8%) |
| Bachelor's Degree | 27 (100.0%) | 0 (0.0%) |
| Graduate Degree | 15 (100.0%) | 0 (0.0%) |
| Total | 55 (76.4%) | 17 (23.6%) |
Employment Characteristics in Lugoff
Employment by Class of Employer in Lugoff
Among the 4,111 employed individuals in Lugoff, private company employees (2,679 | 65.2%), not-for-profit organizations (384 | 9.3%), and federal government employees (316 | 7.7%) make up the most common classes of employment.
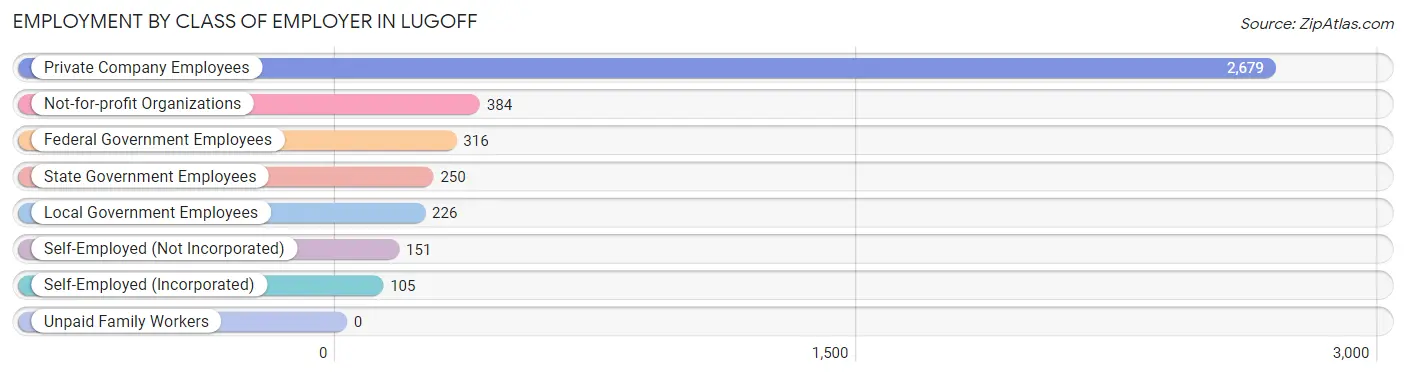
| Employer Class | # Employees | % Employees |
| Private Company Employees | 2,679 | 65.2% |
| Self-Employed (Incorporated) | 105 | 2.5% |
| Self-Employed (Not Incorporated) | 151 | 3.7% |
| Not-for-profit Organizations | 384 | 9.3% |
| Local Government Employees | 226 | 5.5% |
| State Government Employees | 250 | 6.1% |
| Federal Government Employees | 316 | 7.7% |
| Unpaid Family Workers | 0 | 0.0% |
| Total | 4,111 | 100.0% |
Employment Status by Age in Lugoff
According to the labor force statistics for Lugoff, out of the total population over 16 years of age (7,386), 58.3% or 4,306 individuals are in the labor force, with 3.7% or 159 of them unemployed. The age group with the highest labor force participation rate is 30 to 34 years, with 93.2% or 545 individuals in the labor force. Within the labor force, the 16 to 19 years age range has the highest percentage of unemployed individuals, with 19.9% or 56 of them being unemployed.
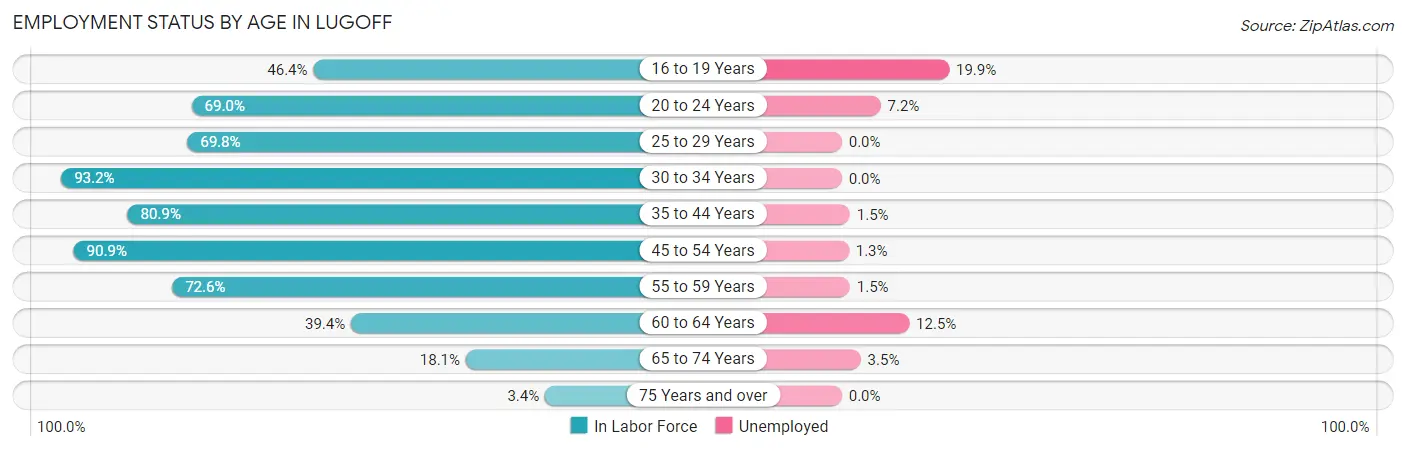
| Age Bracket | In Labor Force | Unemployed |
| 16 to 19 Years | 281 (46.4%) | 56 (19.9%) |
| 20 to 24 Years | 362 (69.0%) | 26 (7.2%) |
| 25 to 29 Years | 338 (69.8%) | 0 (0.0%) |
| 30 to 34 Years | 545 (93.2%) | 0 (0.0%) |
| 35 to 44 Years | 855 (80.9%) | 13 (1.5%) |
| 45 to 54 Years | 966 (90.9%) | 13 (1.3%) |
| 55 to 59 Years | 477 (72.6%) | 7 (1.5%) |
| 60 to 64 Years | 281 (39.4%) | 35 (12.5%) |
| 65 to 74 Years | 173 (18.1%) | 6 (3.5%) |
| 75 Years and over | 25 (3.4%) | 0 (0.0%) |
| Total | 4,306 (58.3%) | 159 (3.7%) |
Employment Status by Educational Attainment in Lugoff
According to labor force statistics for Lugoff, 75.9% of individuals (3,461) out of the total population between 25 and 64 years of age (4,560) are in the labor force, with 2.0% or 69 of them being unemployed. The group with the highest labor force participation rate are those with the educational attainment of bachelor's degree or higher, with 82.3% or 1,074 individuals in the labor force. Within the labor force, individuals with college / associate degree education have the highest percentage of unemployment, with 4.2% or 54 of them being unemployed.
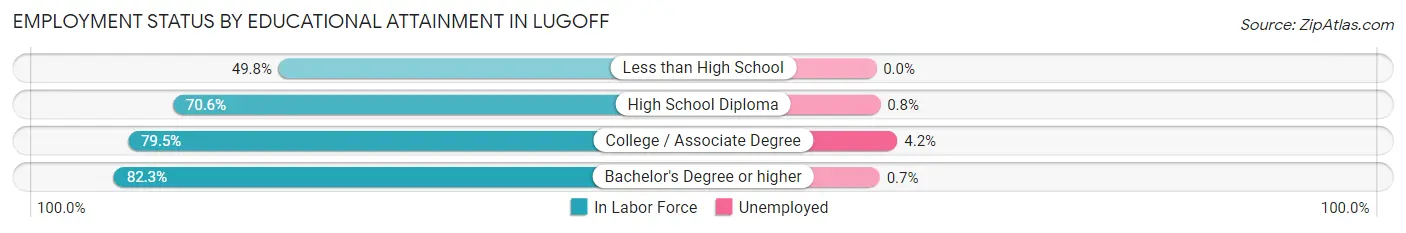
| Educational Attainment | In Labor Force | Unemployed |
| Less than High School | 132 (49.8%) | 0 (0.0%) |
| High School Diploma | 966 (70.6%) | 11 (0.8%) |
| College / Associate Degree | 1,289 (79.5%) | 68 (4.2%) |
| Bachelor's Degree or higher | 1,074 (82.3%) | 9 (0.7%) |
| Total | 3,461 (75.9%) | 91 (2.0%) |
Employment Occupations by Sex in Lugoff
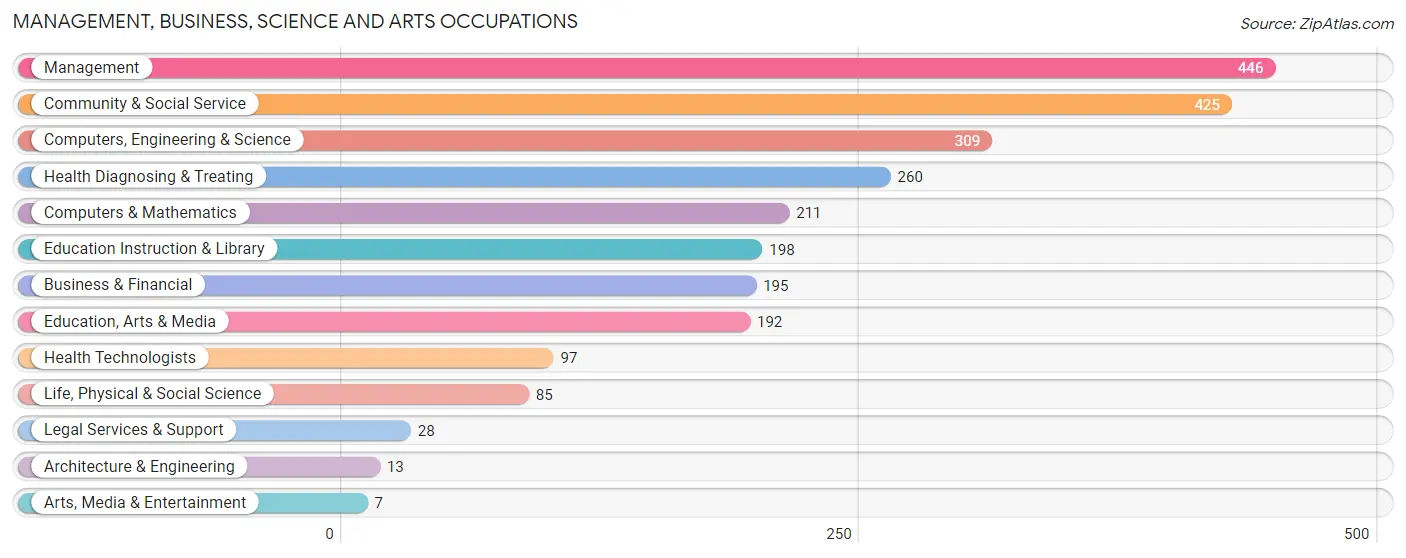
Management, Business, Science and Arts Occupations
The most common Management, Business, Science and Arts occupations in Lugoff are Management (446 | 11.2%), Community & Social Service (425 | 10.7%), Computers, Engineering & Science (309 | 7.8%), Health Diagnosing & Treating (260 | 6.5%), and Computers & Mathematics (211 | 5.3%).
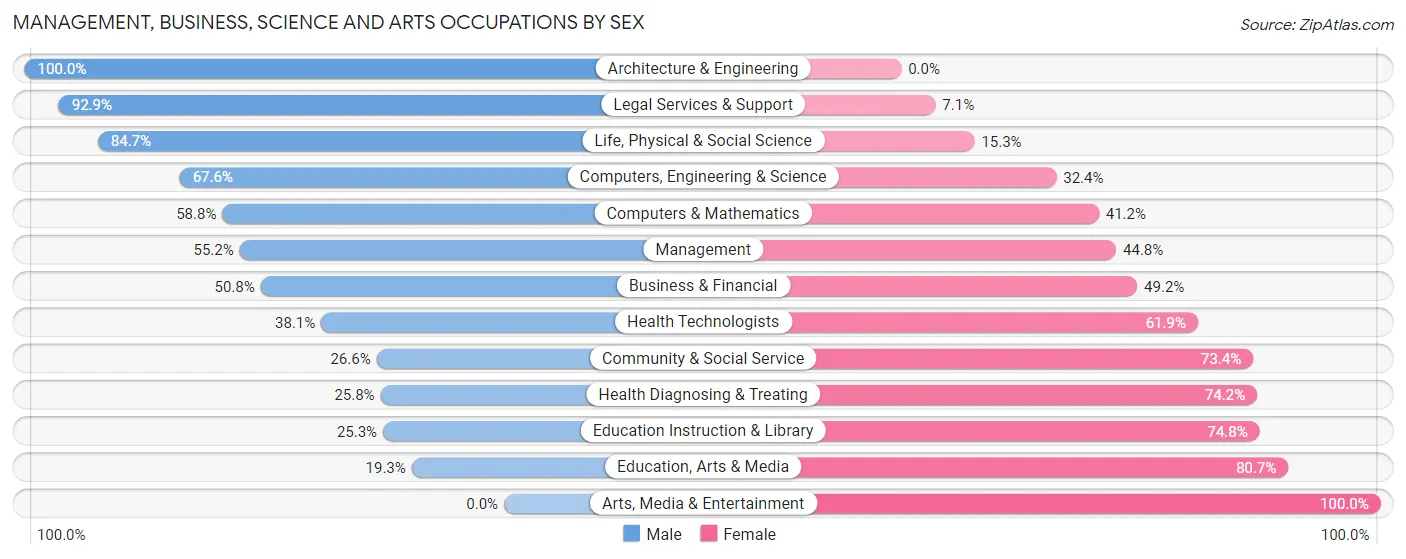
Management, Business, Science and Arts Occupations by Sex
Within the Management, Business, Science and Arts occupations in Lugoff, the most male-oriented occupations are Architecture & Engineering (100.0%), Legal Services & Support (92.9%), and Life, Physical & Social Science (84.7%), while the most female-oriented occupations are Arts, Media & Entertainment (100.0%), Education, Arts & Media (80.7%), and Education Instruction & Library (74.8%).
| Occupation | Male | Female |
| Management | 246 (55.2%) | 200 (44.8%) |
| Business & Financial | 99 (50.8%) | 96 (49.2%) |
| Computers, Engineering & Science | 209 (67.6%) | 100 (32.4%) |
| Computers & Mathematics | 124 (58.8%) | 87 (41.2%) |
| Architecture & Engineering | 13 (100.0%) | 0 (0.0%) |
| Life, Physical & Social Science | 72 (84.7%) | 13 (15.3%) |
| Community & Social Service | 113 (26.6%) | 312 (73.4%) |
| Education, Arts & Media | 37 (19.3%) | 155 (80.7%) |
| Legal Services & Support | 26 (92.9%) | 2 (7.1%) |
| Education Instruction & Library | 50 (25.3%) | 148 (74.8%) |
| Arts, Media & Entertainment | 0 (0.0%) | 7 (100.0%) |
| Health Diagnosing & Treating | 67 (25.8%) | 193 (74.2%) |
| Health Technologists | 37 (38.1%) | 60 (61.9%) |
| Total (Category) | 734 (44.9%) | 901 (55.1%) |
| Total (Overall) | 2,160 (54.2%) | 1,823 (45.8%) |
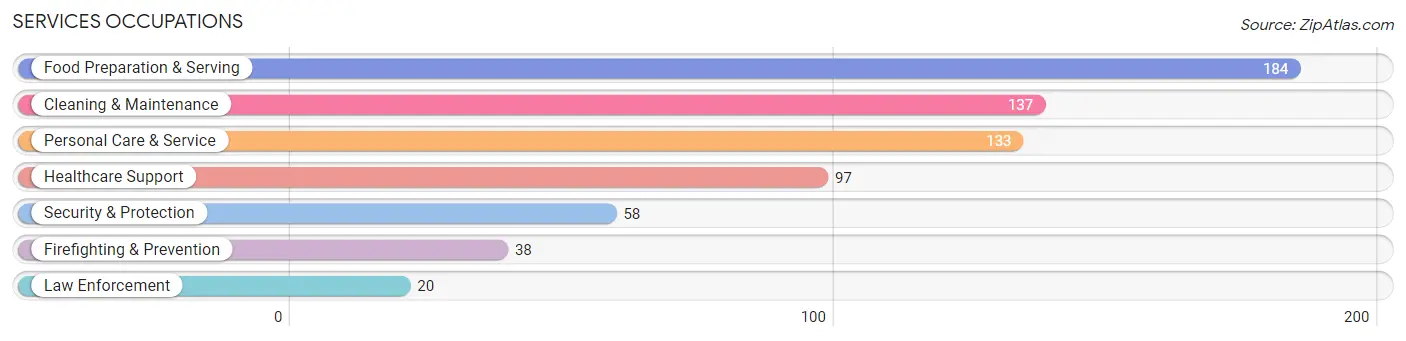
Services Occupations
The most common Services occupations in Lugoff are Food Preparation & Serving (184 | 4.6%), Cleaning & Maintenance (137 | 3.4%), Personal Care & Service (133 | 3.3%), Healthcare Support (97 | 2.4%), and Security & Protection (58 | 1.5%).
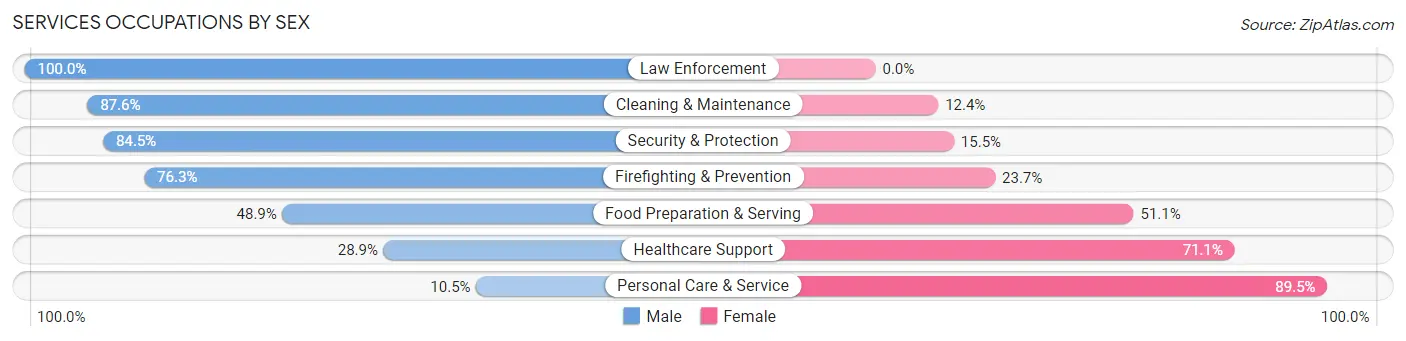
Services Occupations by Sex
Within the Services occupations in Lugoff, the most male-oriented occupations are Law Enforcement (100.0%), Cleaning & Maintenance (87.6%), and Security & Protection (84.5%), while the most female-oriented occupations are Personal Care & Service (89.5%), Healthcare Support (71.1%), and Food Preparation & Serving (51.1%).
| Occupation | Male | Female |
| Healthcare Support | 28 (28.9%) | 69 (71.1%) |
| Security & Protection | 49 (84.5%) | 9 (15.5%) |
| Firefighting & Prevention | 29 (76.3%) | 9 (23.7%) |
| Law Enforcement | 20 (100.0%) | 0 (0.0%) |
| Food Preparation & Serving | 90 (48.9%) | 94 (51.1%) |
| Cleaning & Maintenance | 120 (87.6%) | 17 (12.4%) |
| Personal Care & Service | 14 (10.5%) | 119 (89.5%) |
| Total (Category) | 301 (49.4%) | 308 (50.6%) |
| Total (Overall) | 2,160 (54.2%) | 1,823 (45.8%) |
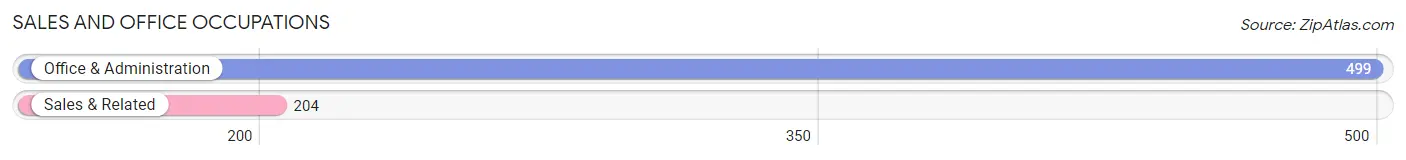
Sales and Office Occupations
The most common Sales and Office occupations in Lugoff are Office & Administration (499 | 12.5%), and Sales & Related (204 | 5.1%).
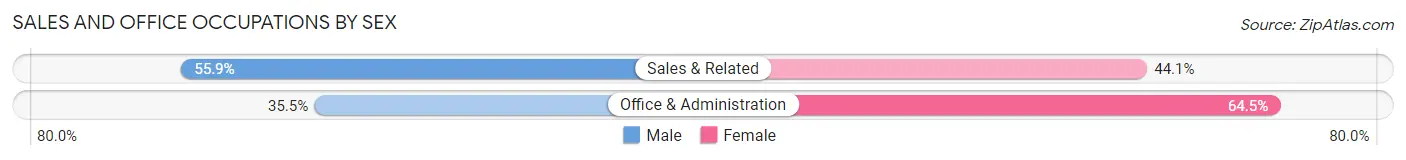
Sales and Office Occupations by Sex
| Occupation | Male | Female |
| Sales & Related | 114 (55.9%) | 90 (44.1%) |
| Office & Administration | 177 (35.5%) | 322 (64.5%) |
| Total (Category) | 291 (41.4%) | 412 (58.6%) |
| Total (Overall) | 2,160 (54.2%) | 1,823 (45.8%) |
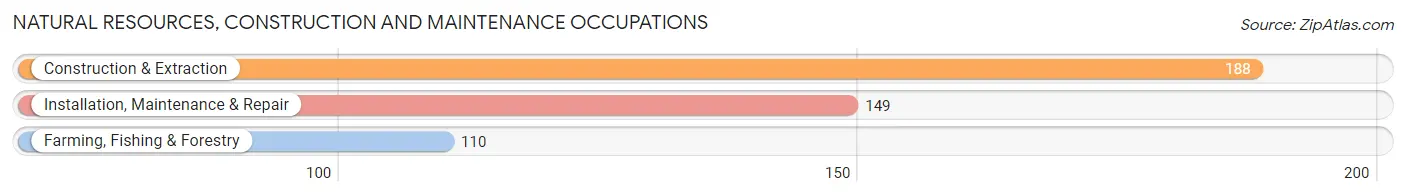
Natural Resources, Construction and Maintenance Occupations
The most common Natural Resources, Construction and Maintenance occupations in Lugoff are Construction & Extraction (188 | 4.7%), Installation, Maintenance & Repair (149 | 3.7%), and Farming, Fishing & Forestry (110 | 2.8%).
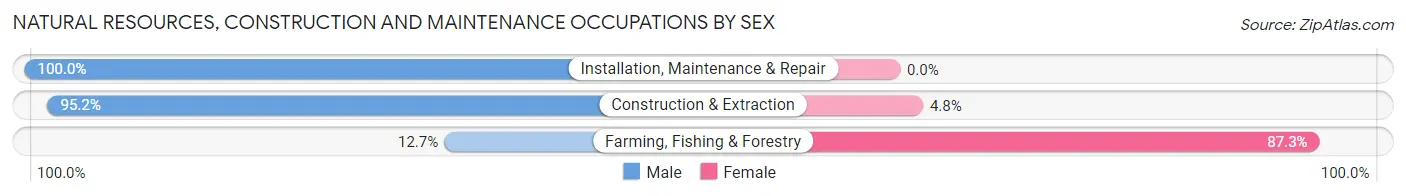
Natural Resources, Construction and Maintenance Occupations by Sex
| Occupation | Male | Female |
| Farming, Fishing & Forestry | 14 (12.7%) | 96 (87.3%) |
| Construction & Extraction | 179 (95.2%) | 9 (4.8%) |
| Installation, Maintenance & Repair | 149 (100.0%) | 0 (0.0%) |
| Total (Category) | 342 (76.5%) | 105 (23.5%) |
| Total (Overall) | 2,160 (54.2%) | 1,823 (45.8%) |
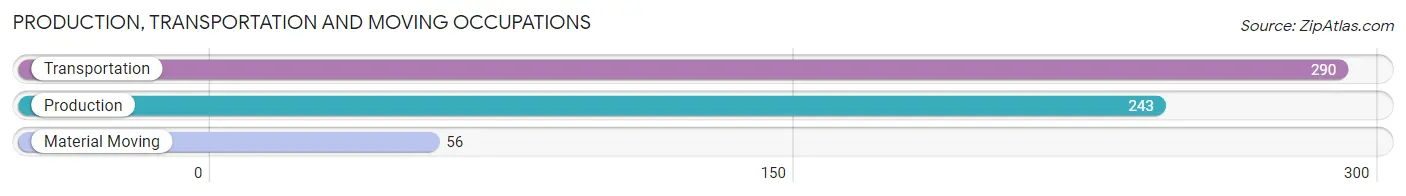
Production, Transportation and Moving Occupations
The most common Production, Transportation and Moving occupations in Lugoff are Transportation (290 | 7.3%), Production (243 | 6.1%), and Material Moving (56 | 1.4%).
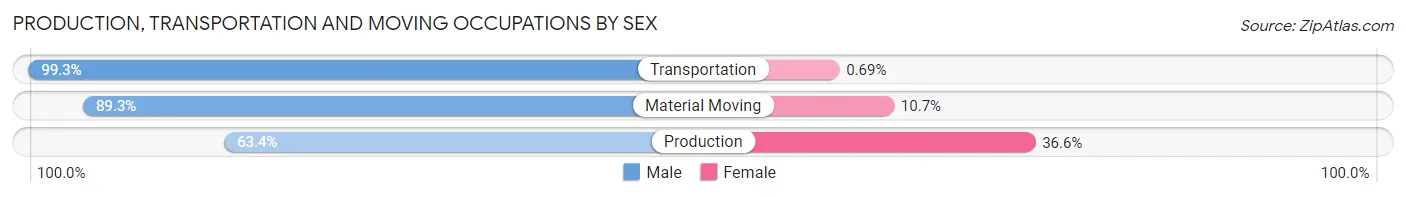
Production, Transportation and Moving Occupations by Sex
| Occupation | Male | Female |
| Production | 154 (63.4%) | 89 (36.6%) |
| Transportation | 288 (99.3%) | 2 (0.7%) |
| Material Moving | 50 (89.3%) | 6 (10.7%) |
| Total (Category) | 492 (83.5%) | 97 (16.5%) |
| Total (Overall) | 2,160 (54.2%) | 1,823 (45.8%) |
Employment Industries by Sex in Lugoff
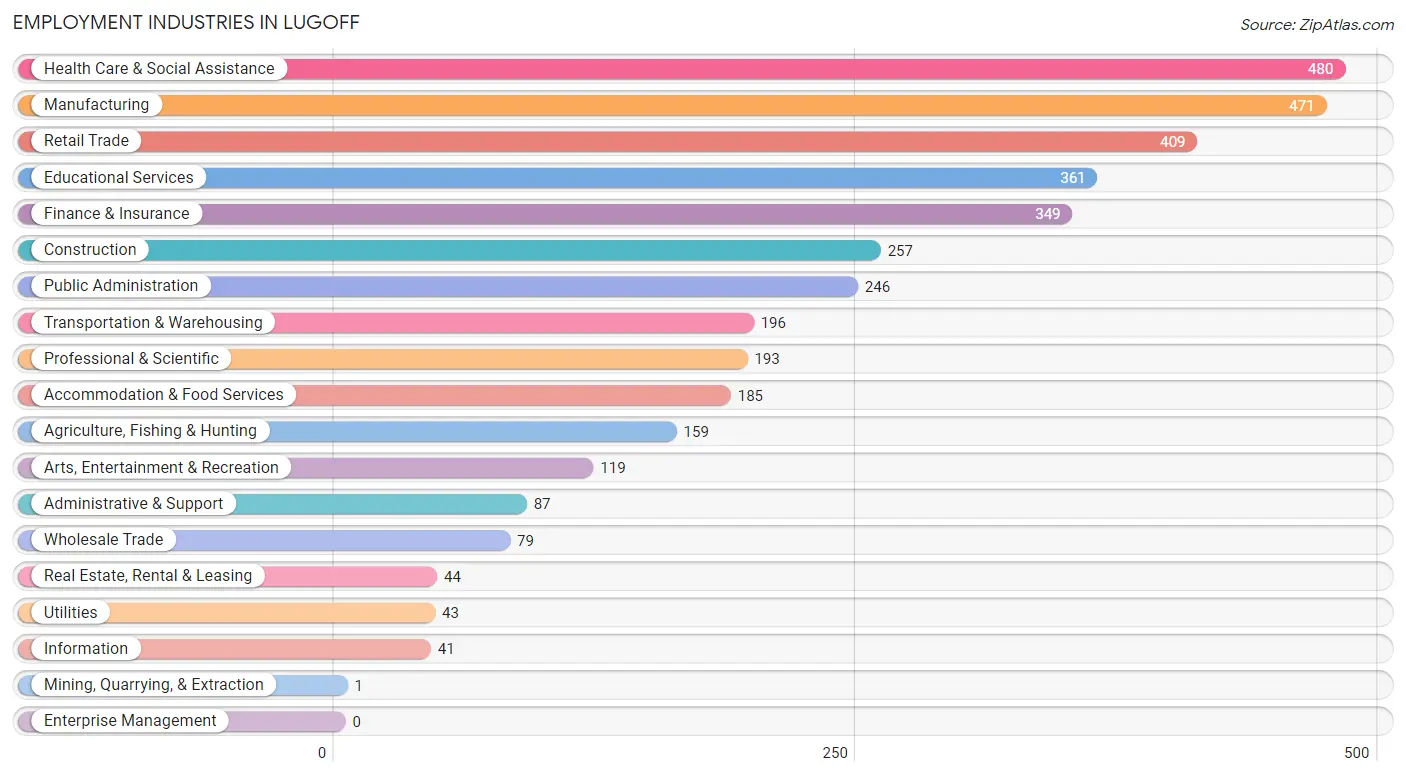
Employment Industries in Lugoff
The major employment industries in Lugoff include Health Care & Social Assistance (480 | 12.0%), Manufacturing (471 | 11.8%), Retail Trade (409 | 10.3%), Educational Services (361 | 9.1%), and Finance & Insurance (349 | 8.8%).
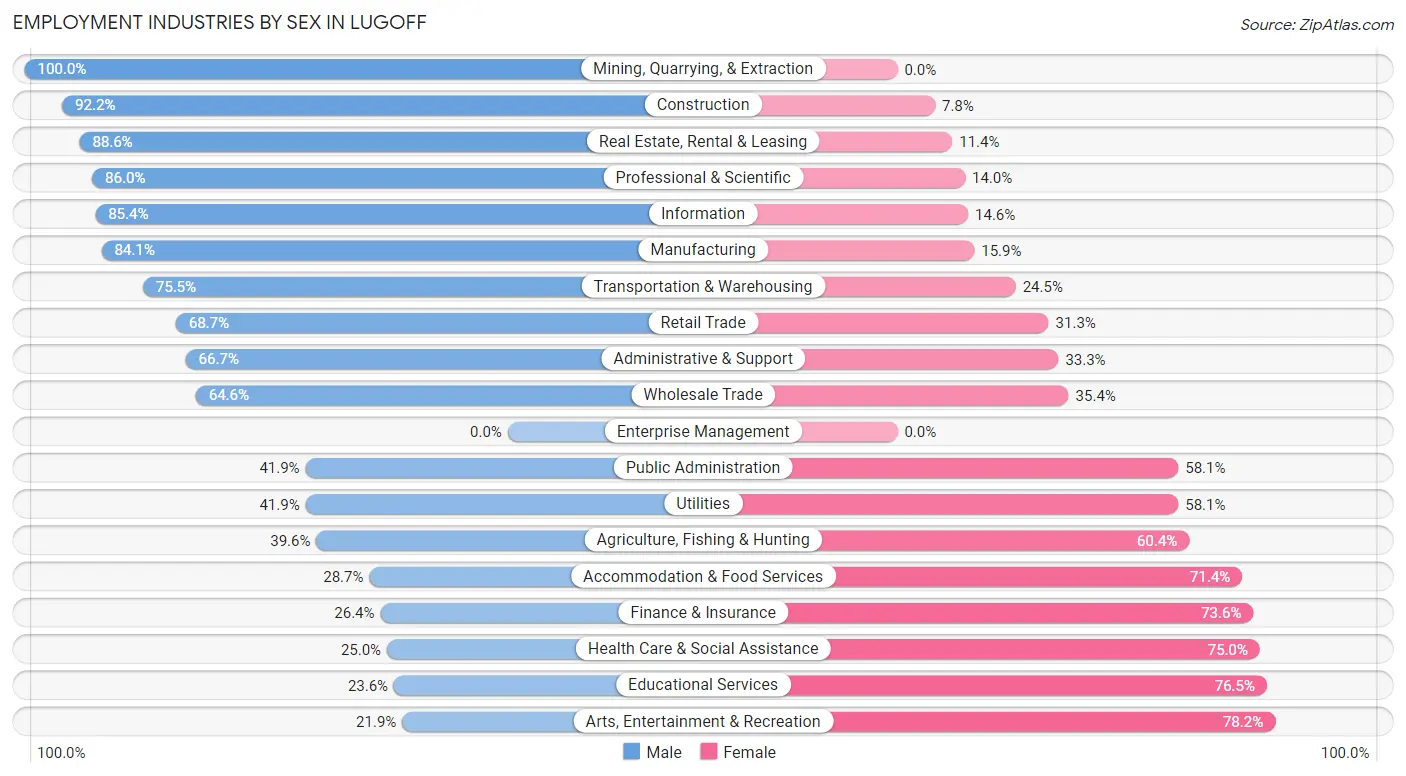
Employment Industries by Sex in Lugoff
The Lugoff industries that see more men than women are Mining, Quarrying, & Extraction (100.0%), Construction (92.2%), and Real Estate, Rental & Leasing (88.6%), whereas the industries that tend to have a higher number of women are Arts, Entertainment & Recreation (78.1%), Educational Services (76.4%), and Health Care & Social Assistance (75.0%).
| Industry | Male | Female |
| Agriculture, Fishing & Hunting | 63 (39.6%) | 96 (60.4%) |
| Mining, Quarrying, & Extraction | 1 (100.0%) | 0 (0.0%) |
| Construction | 237 (92.2%) | 20 (7.8%) |
| Manufacturing | 396 (84.1%) | 75 (15.9%) |
| Wholesale Trade | 51 (64.6%) | 28 (35.4%) |
| Retail Trade | 281 (68.7%) | 128 (31.3%) |
| Transportation & Warehousing | 148 (75.5%) | 48 (24.5%) |
| Utilities | 18 (41.9%) | 25 (58.1%) |
| Information | 35 (85.4%) | 6 (14.6%) |
| Finance & Insurance | 92 (26.4%) | 257 (73.6%) |
| Real Estate, Rental & Leasing | 39 (88.6%) | 5 (11.4%) |
| Professional & Scientific | 166 (86.0%) | 27 (14.0%) |
| Enterprise Management | 0 (0.0%) | 0 (0.0%) |
| Administrative & Support | 58 (66.7%) | 29 (33.3%) |
| Educational Services | 85 (23.5%) | 276 (76.4%) |
| Health Care & Social Assistance | 120 (25.0%) | 360 (75.0%) |
| Arts, Entertainment & Recreation | 26 (21.8%) | 93 (78.1%) |
| Accommodation & Food Services | 53 (28.6%) | 132 (71.4%) |
| Public Administration | 103 (41.9%) | 143 (58.1%) |
| Total | 2,160 (54.2%) | 1,823 (45.8%) |
Education in Lugoff
School Enrollment in Lugoff
The most common levels of schooling among the 2,533 students in Lugoff are elementary school (679 | 26.8%), high school (594 | 23.4%), and middle school (508 | 20.1%).
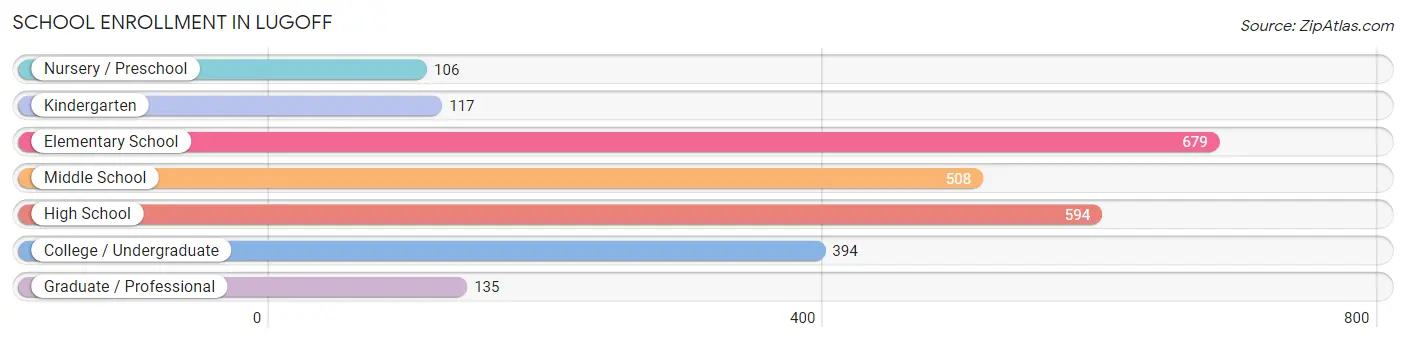
| School Level | # Students | % Students |
| Nursery / Preschool | 106 | 4.2% |
| Kindergarten | 117 | 4.6% |
| Elementary School | 679 | 26.8% |
| Middle School | 508 | 20.1% |
| High School | 594 | 23.4% |
| College / Undergraduate | 394 | 15.5% |
| Graduate / Professional | 135 | 5.3% |
| Total | 2,533 | 100.0% |
School Enrollment by Age by Funding Source in Lugoff
Out of a total of 2,533 students who are enrolled in schools in Lugoff, 405 (16.0%) attend a private institution, while the remaining 2,128 (84.0%) are enrolled in public schools. The age group of 3 to 4 year olds has the highest likelihood of being enrolled in private schools, with 69 (62.2% in the age bracket) enrolled. Conversely, the age group of 5 to 9 year old has the lowest likelihood of being enrolled in a private school, with 719 (94.1% in the age bracket) attending a public institution.
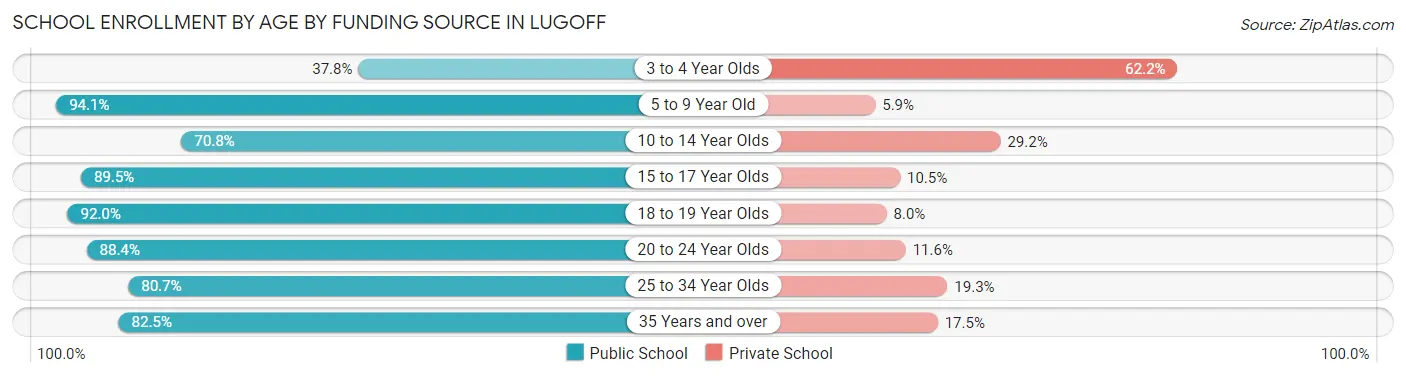
| Age Bracket | Public School | Private School |
| 3 to 4 Year Olds | 42 (37.8%) | 69 (62.2%) |
| 5 to 9 Year Old | 719 (94.1%) | 45 (5.9%) |
| 10 to 14 Year Olds | 395 (70.8%) | 163 (29.2%) |
| 15 to 17 Year Olds | 358 (89.5%) | 42 (10.5%) |
| 18 to 19 Year Olds | 230 (92.0%) | 20 (8.0%) |
| 20 to 24 Year Olds | 199 (88.4%) | 26 (11.6%) |
| 25 to 34 Year Olds | 71 (80.7%) | 17 (19.3%) |
| 35 Years and over | 113 (82.5%) | 24 (17.5%) |
| Total | 2,128 (84.0%) | 405 (16.0%) |
Educational Attainment by Field of Study in Lugoff
Business (326 | 19.3%), education (303 | 17.9%), social sciences (184 | 10.9%), bio, nature & agricultural (177 | 10.5%), and arts & humanities (141 | 8.3%) are the most common fields of study among 1,691 individuals in Lugoff who have obtained a bachelor's degree or higher.
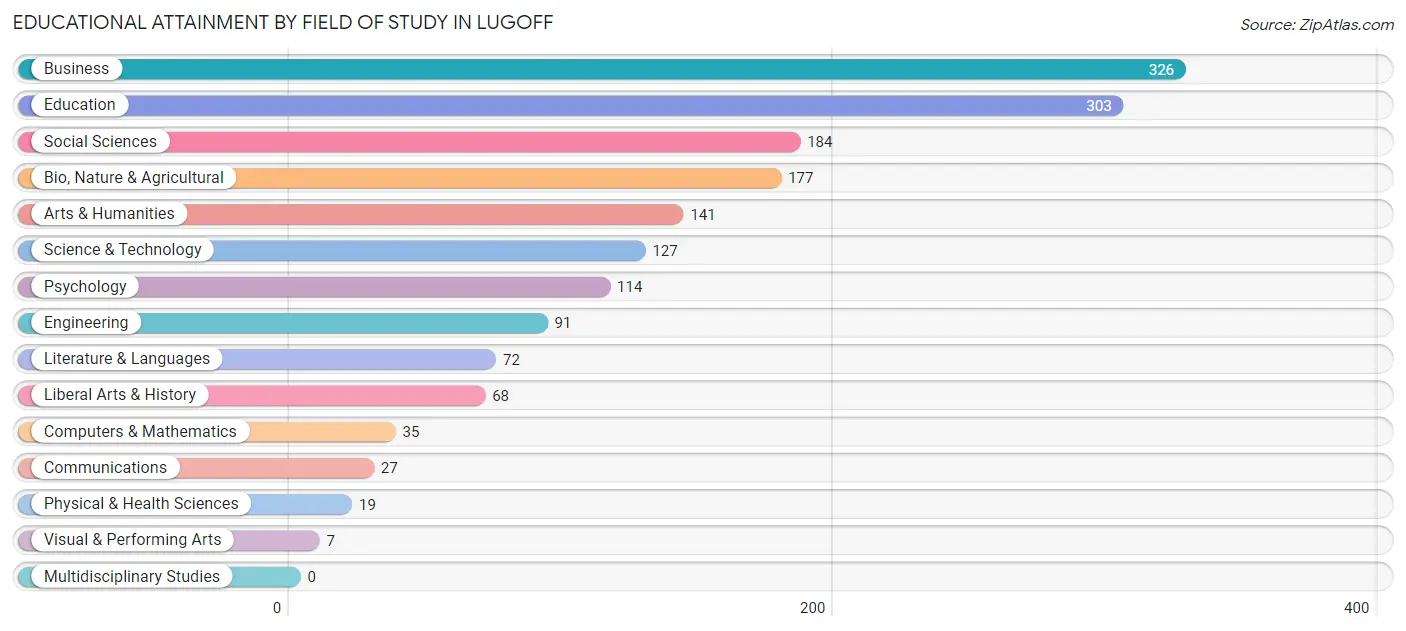
| Field of Study | # Graduates | % Graduates |
| Computers & Mathematics | 35 | 2.1% |
| Bio, Nature & Agricultural | 177 | 10.5% |
| Physical & Health Sciences | 19 | 1.1% |
| Psychology | 114 | 6.7% |
| Social Sciences | 184 | 10.9% |
| Engineering | 91 | 5.4% |
| Multidisciplinary Studies | 0 | 0.0% |
| Science & Technology | 127 | 7.5% |
| Business | 326 | 19.3% |
| Education | 303 | 17.9% |
| Literature & Languages | 72 | 4.3% |
| Liberal Arts & History | 68 | 4.0% |
| Visual & Performing Arts | 7 | 0.4% |
| Communications | 27 | 1.6% |
| Arts & Humanities | 141 | 8.3% |
| Total | 1,691 | 100.0% |
Transportation & Commute in Lugoff
Vehicle Availability by Sex in Lugoff
The most prevalent vehicle ownership categories in Lugoff are males with 2 vehicles (906, accounting for 39.0%) and females with 2 vehicles (740, making up 51.2%).
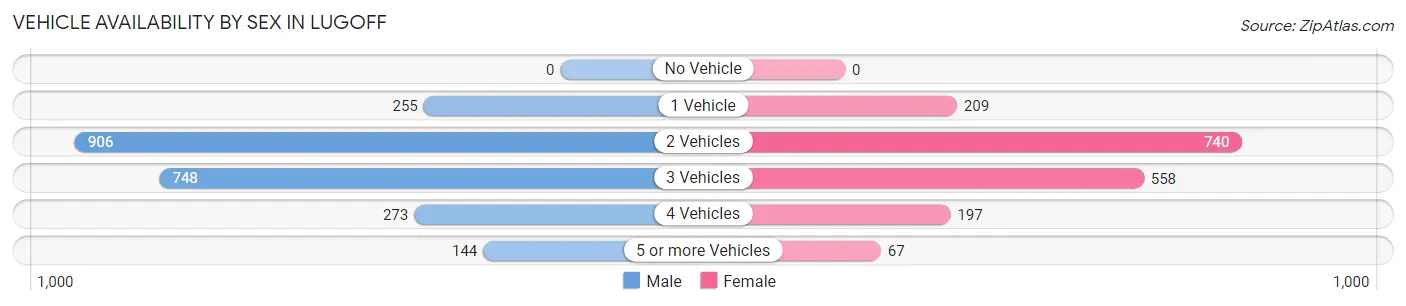
| Vehicles Available | Male | Female |
| No Vehicle | 0 (0.0%) | 0 (0.0%) |
| 1 Vehicle | 255 (11.0%) | 209 (11.8%) |
| 2 Vehicles | 906 (39.0%) | 740 (41.8%) |
| 3 Vehicles | 748 (32.2%) | 558 (31.5%) |
| 4 Vehicles | 273 (11.7%) | 197 (11.1%) |
| 5 or more Vehicles | 144 (6.2%) | 67 (3.8%) |
| Total | 2,326 (100.0%) | 1,771 (100.0%) |
Commute Time in Lugoff
The most frequently occuring commute durations in Lugoff are 30 to 34 minutes (987 commuters, 26.1%), 15 to 19 minutes (585 commuters, 15.4%), and 5 to 9 minutes (411 commuters, 10.9%).
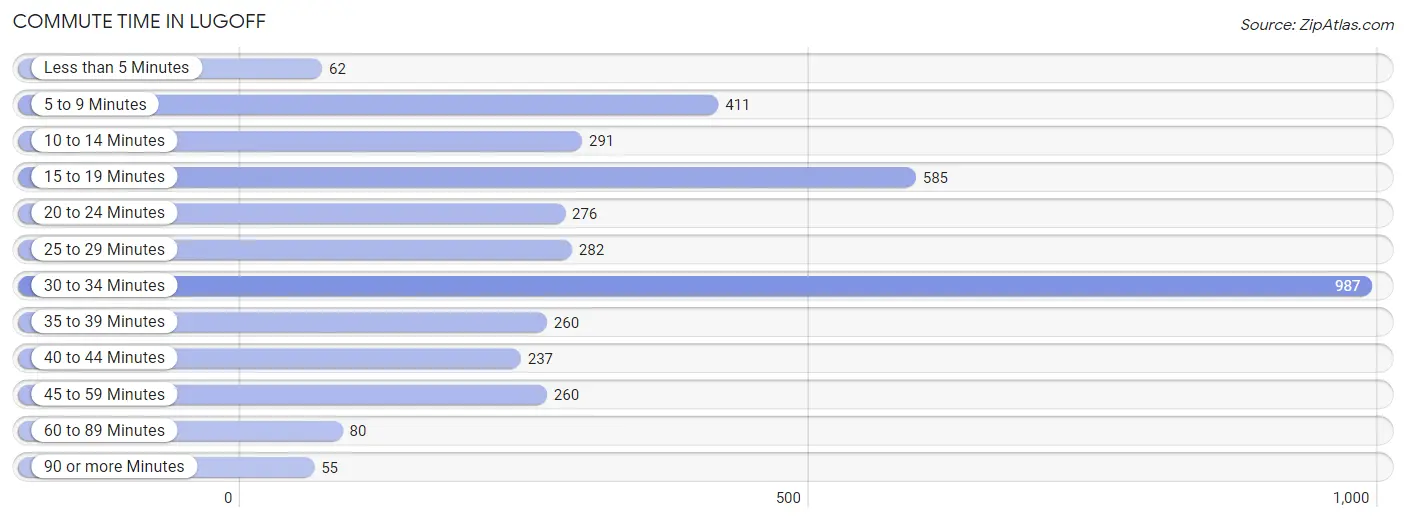
| Commute Time | # Commuters | % Commuters |
| Less than 5 Minutes | 62 | 1.6% |
| 5 to 9 Minutes | 411 | 10.9% |
| 10 to 14 Minutes | 291 | 7.7% |
| 15 to 19 Minutes | 585 | 15.4% |
| 20 to 24 Minutes | 276 | 7.3% |
| 25 to 29 Minutes | 282 | 7.4% |
| 30 to 34 Minutes | 987 | 26.1% |
| 35 to 39 Minutes | 260 | 6.9% |
| 40 to 44 Minutes | 237 | 6.3% |
| 45 to 59 Minutes | 260 | 6.9% |
| 60 to 89 Minutes | 80 | 2.1% |
| 90 or more Minutes | 55 | 1.5% |
Commute Time by Sex in Lugoff
The most common commute times in Lugoff are 30 to 34 minutes (505 commuters, 22.8%) for males and 30 to 34 minutes (482 commuters, 30.6%) for females.
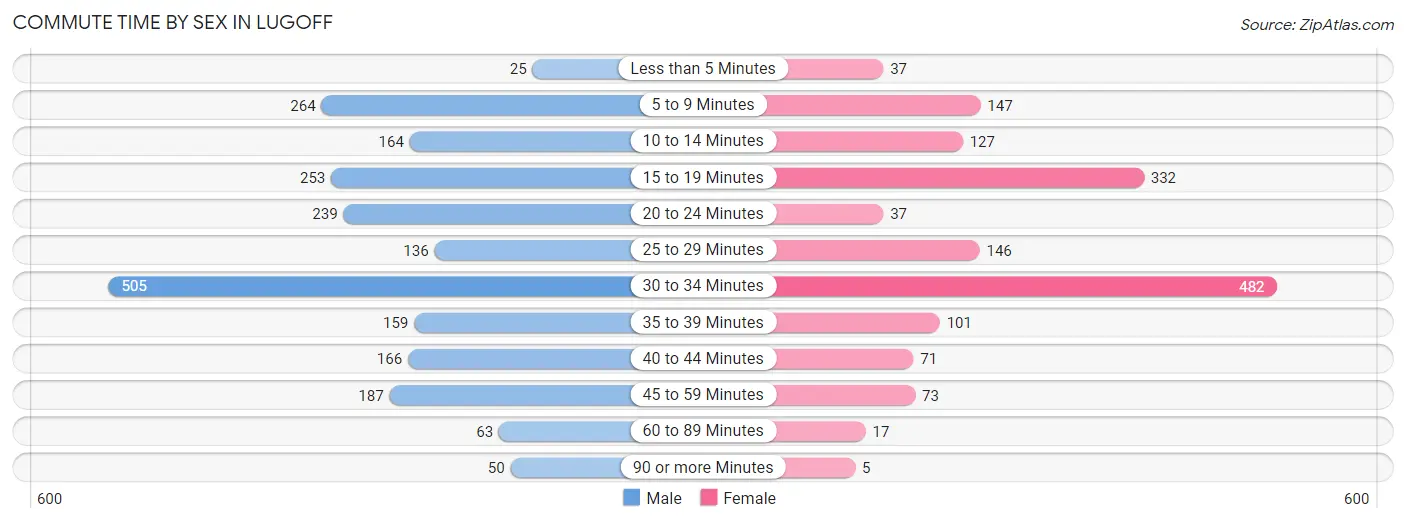
| Commute Time | Male | Female |
| Less than 5 Minutes | 25 (1.1%) | 37 (2.4%) |
| 5 to 9 Minutes | 264 (11.9%) | 147 (9.3%) |
| 10 to 14 Minutes | 164 (7.4%) | 127 (8.1%) |
| 15 to 19 Minutes | 253 (11.4%) | 332 (21.1%) |
| 20 to 24 Minutes | 239 (10.8%) | 37 (2.4%) |
| 25 to 29 Minutes | 136 (6.1%) | 146 (9.3%) |
| 30 to 34 Minutes | 505 (22.8%) | 482 (30.6%) |
| 35 to 39 Minutes | 159 (7.2%) | 101 (6.4%) |
| 40 to 44 Minutes | 166 (7.5%) | 71 (4.5%) |
| 45 to 59 Minutes | 187 (8.5%) | 73 (4.6%) |
| 60 to 89 Minutes | 63 (2.9%) | 17 (1.1%) |
| 90 or more Minutes | 50 (2.3%) | 5 (0.3%) |
Time of Departure to Work by Sex in Lugoff
The most frequent times of departure to work in Lugoff are 6:30 AM to 6:59 AM (423, 19.1%) for males and 7:30 AM to 7:59 AM (365, 23.2%) for females.
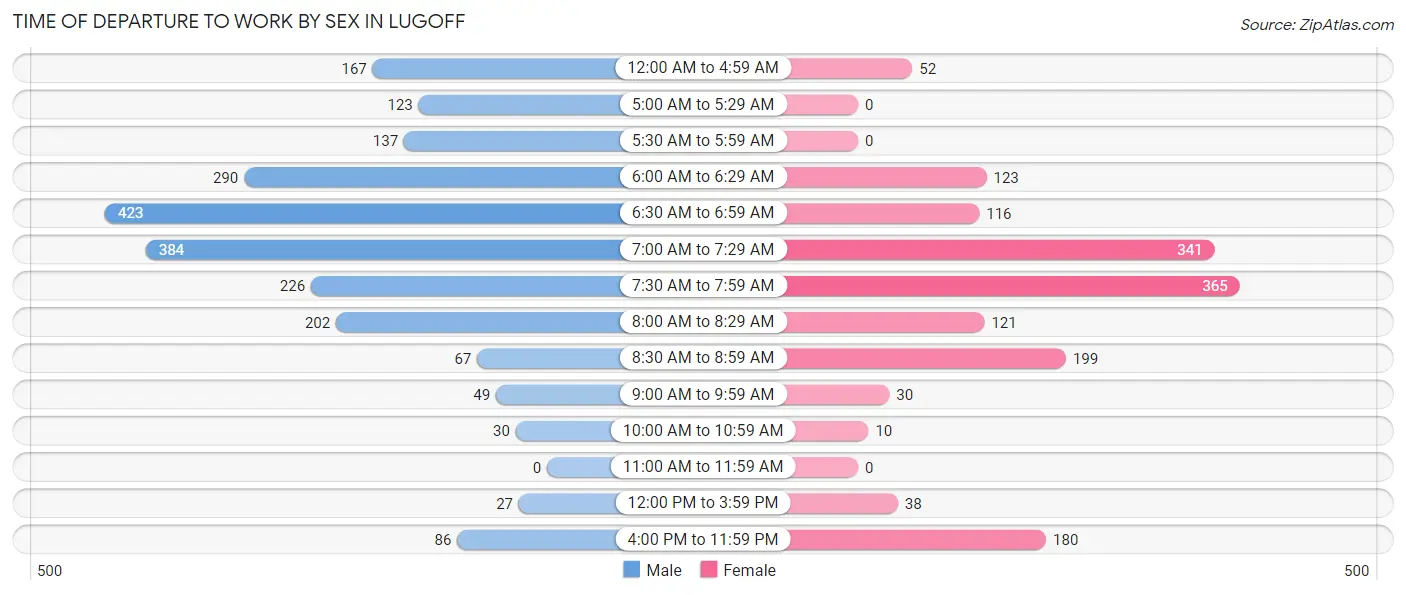
| Time of Departure | Male | Female |
| 12:00 AM to 4:59 AM | 167 (7.5%) | 52 (3.3%) |
| 5:00 AM to 5:29 AM | 123 (5.6%) | 0 (0.0%) |
| 5:30 AM to 5:59 AM | 137 (6.2%) | 0 (0.0%) |
| 6:00 AM to 6:29 AM | 290 (13.1%) | 123 (7.8%) |
| 6:30 AM to 6:59 AM | 423 (19.1%) | 116 (7.4%) |
| 7:00 AM to 7:29 AM | 384 (17.4%) | 341 (21.6%) |
| 7:30 AM to 7:59 AM | 226 (10.2%) | 365 (23.2%) |
| 8:00 AM to 8:29 AM | 202 (9.1%) | 121 (7.7%) |
| 8:30 AM to 8:59 AM | 67 (3.0%) | 199 (12.6%) |
| 9:00 AM to 9:59 AM | 49 (2.2%) | 30 (1.9%) |
| 10:00 AM to 10:59 AM | 30 (1.4%) | 10 (0.6%) |
| 11:00 AM to 11:59 AM | 0 (0.0%) | 0 (0.0%) |
| 12:00 PM to 3:59 PM | 27 (1.2%) | 38 (2.4%) |
| 4:00 PM to 11:59 PM | 86 (3.9%) | 180 (11.4%) |
| Total | 2,211 (100.0%) | 1,575 (100.0%) |
Housing Occupancy in Lugoff
Occupancy by Ownership in Lugoff
Of the total 3,503 dwellings in Lugoff, owner-occupied units account for 3,096 (88.4%), while renter-occupied units make up 407 (11.6%).
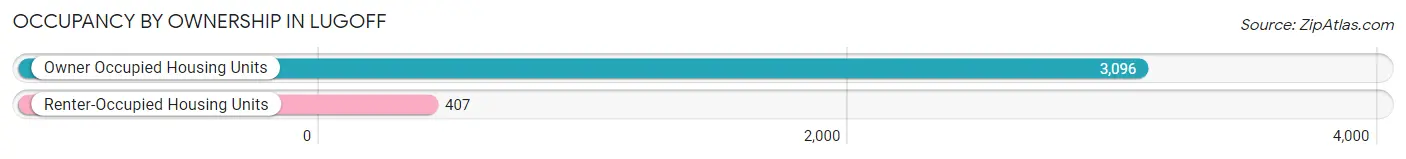
| Occupancy | # Housing Units | % Housing Units |
| Owner Occupied Housing Units | 3,096 | 88.4% |
| Renter-Occupied Housing Units | 407 | 11.6% |
| Total Occupied Housing Units | 3,503 | 100.0% |
Occupancy by Household Size in Lugoff
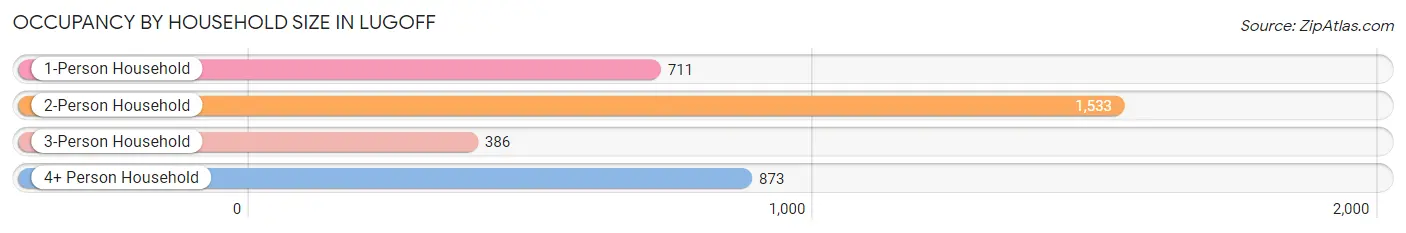
| Household Size | # Housing Units | % Housing Units |
| 1-Person Household | 711 | 20.3% |
| 2-Person Household | 1,533 | 43.8% |
| 3-Person Household | 386 | 11.0% |
| 4+ Person Household | 873 | 24.9% |
| Total Housing Units | 3,503 | 100.0% |
Occupancy by Ownership by Household Size in Lugoff
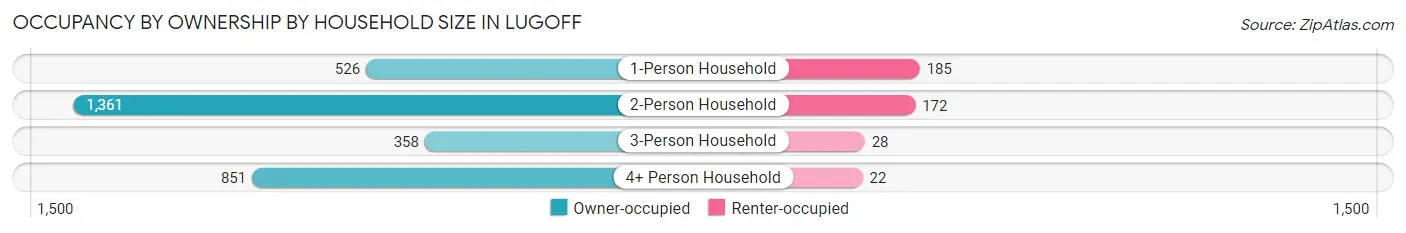
| Household Size | Owner-occupied | Renter-occupied |
| 1-Person Household | 526 (74.0%) | 185 (26.0%) |
| 2-Person Household | 1,361 (88.8%) | 172 (11.2%) |
| 3-Person Household | 358 (92.7%) | 28 (7.2%) |
| 4+ Person Household | 851 (97.5%) | 22 (2.5%) |
| Total Housing Units | 3,096 (88.4%) | 407 (11.6%) |
Occupancy by Educational Attainment in Lugoff
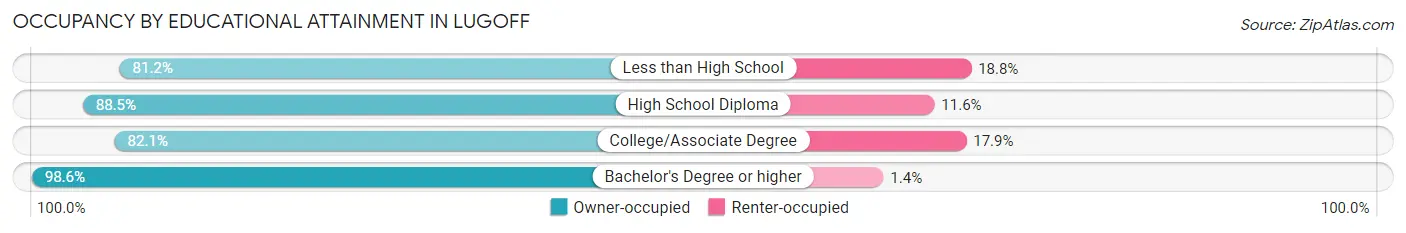
| Household Size | Owner-occupied | Renter-occupied |
| Less than High School | 168 (81.2%) | 39 (18.8%) |
| High School Diploma | 996 (88.4%) | 130 (11.6%) |
| College/Associate Degree | 1,035 (82.1%) | 225 (17.9%) |
| Bachelor's Degree or higher | 897 (98.6%) | 13 (1.4%) |
Occupancy by Age of Householder in Lugoff
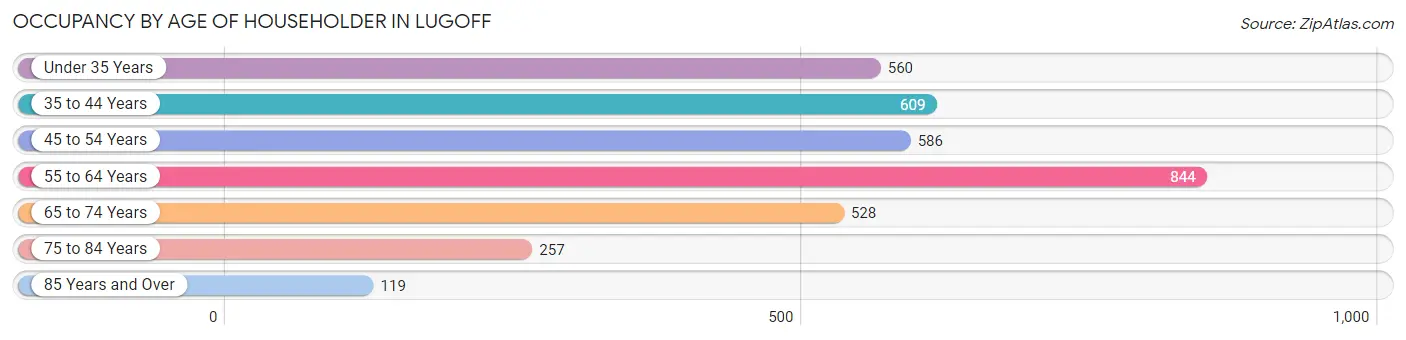
| Age Bracket | # Households | % Households |
| Under 35 Years | 560 | 16.0% |
| 35 to 44 Years | 609 | 17.4% |
| 45 to 54 Years | 586 | 16.7% |
| 55 to 64 Years | 844 | 24.1% |
| 65 to 74 Years | 528 | 15.1% |
| 75 to 84 Years | 257 | 7.3% |
| 85 Years and Over | 119 | 3.4% |
| Total | 3,503 | 100.0% |
Housing Finances in Lugoff
Median Income by Occupancy in Lugoff
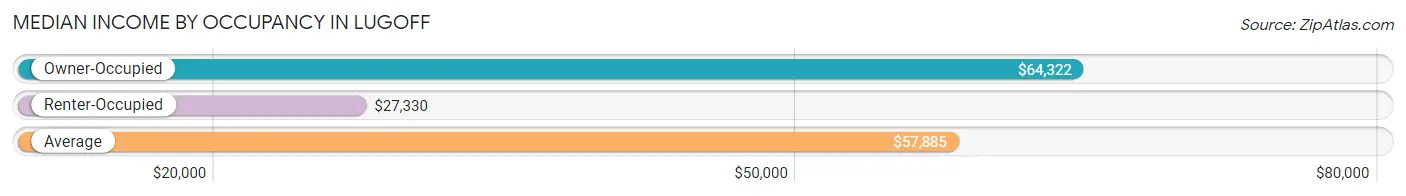
| Occupancy Type | # Households | Median Income |
| Owner-Occupied | 3,096 (88.4%) | $64,322 |
| Renter-Occupied | 407 (11.6%) | $27,330 |
| Average | 3,503 (100.0%) | $57,885 |
Occupancy by Householder Income Bracket in Lugoff
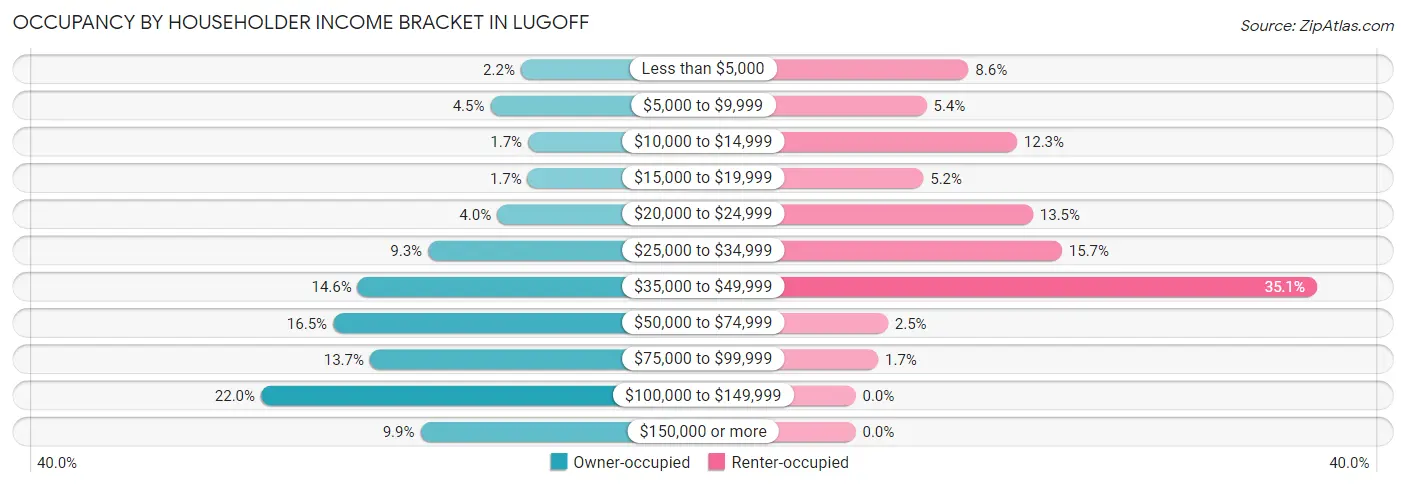
| Income Bracket | Owner-occupied | Renter-occupied |
| Less than $5,000 | 68 (2.2%) | 35 (8.6%) |
| $5,000 to $9,999 | 140 (4.5%) | 22 (5.4%) |
| $10,000 to $14,999 | 51 (1.7%) | 50 (12.3%) |
| $15,000 to $19,999 | 52 (1.7%) | 21 (5.2%) |
| $20,000 to $24,999 | 124 (4.0%) | 55 (13.5%) |
| $25,000 to $34,999 | 287 (9.3%) | 64 (15.7%) |
| $35,000 to $49,999 | 453 (14.6%) | 143 (35.1%) |
| $50,000 to $74,999 | 511 (16.5%) | 10 (2.5%) |
| $75,000 to $99,999 | 424 (13.7%) | 7 (1.7%) |
| $100,000 to $149,999 | 681 (22.0%) | 0 (0.0%) |
| $150,000 or more | 305 (9.9%) | 0 (0.0%) |
| Total | 3,096 (100.0%) | 407 (100.0%) |
Monthly Housing Cost Tiers in Lugoff
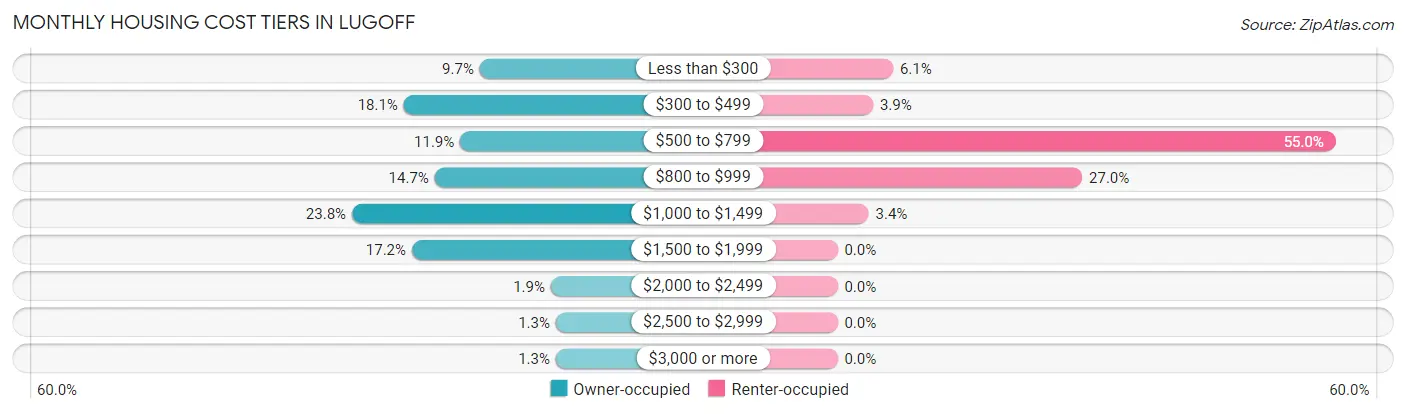
| Monthly Cost | Owner-occupied | Renter-occupied |
| Less than $300 | 301 (9.7%) | 25 (6.1%) |
| $300 to $499 | 561 (18.1%) | 16 (3.9%) |
| $500 to $799 | 368 (11.9%) | 224 (55.0%) |
| $800 to $999 | 455 (14.7%) | 110 (27.0%) |
| $1,000 to $1,499 | 738 (23.8%) | 14 (3.4%) |
| $1,500 to $1,999 | 533 (17.2%) | 0 (0.0%) |
| $2,000 to $2,499 | 58 (1.9%) | 0 (0.0%) |
| $2,500 to $2,999 | 41 (1.3%) | 0 (0.0%) |
| $3,000 or more | 41 (1.3%) | 0 (0.0%) |
| Total | 3,096 (100.0%) | 407 (100.0%) |
Physical Housing Characteristics in Lugoff
Housing Structures in Lugoff
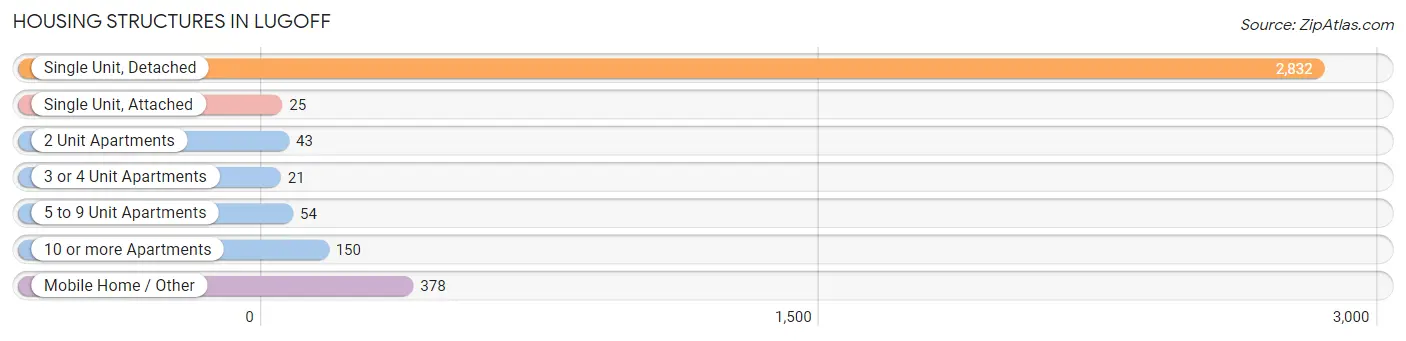
| Structure Type | # Housing Units | % Housing Units |
| Single Unit, Detached | 2,832 | 80.8% |
| Single Unit, Attached | 25 | 0.7% |
| 2 Unit Apartments | 43 | 1.2% |
| 3 or 4 Unit Apartments | 21 | 0.6% |
| 5 to 9 Unit Apartments | 54 | 1.5% |
| 10 or more Apartments | 150 | 4.3% |
| Mobile Home / Other | 378 | 10.8% |
| Total | 3,503 | 100.0% |
Housing Structures by Occupancy in Lugoff
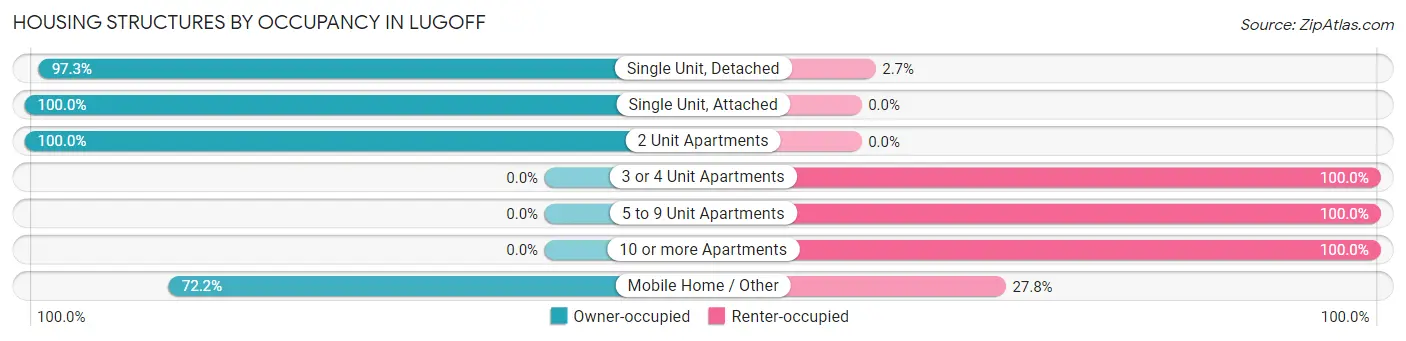
| Structure Type | Owner-occupied | Renter-occupied |
| Single Unit, Detached | 2,755 (97.3%) | 77 (2.7%) |
| Single Unit, Attached | 25 (100.0%) | 0 (0.0%) |
| 2 Unit Apartments | 43 (100.0%) | 0 (0.0%) |
| 3 or 4 Unit Apartments | 0 (0.0%) | 21 (100.0%) |
| 5 to 9 Unit Apartments | 0 (0.0%) | 54 (100.0%) |
| 10 or more Apartments | 0 (0.0%) | 150 (100.0%) |
| Mobile Home / Other | 273 (72.2%) | 105 (27.8%) |
| Total | 3,096 (88.4%) | 407 (11.6%) |
Housing Structures by Number of Rooms in Lugoff
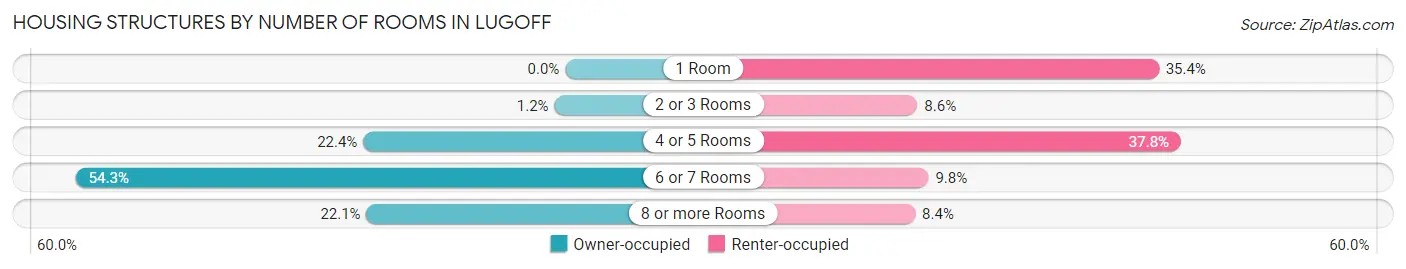
| Number of Rooms | Owner-occupied | Renter-occupied |
| 1 Room | 0 (0.0%) | 144 (35.4%) |
| 2 or 3 Rooms | 37 (1.2%) | 35 (8.6%) |
| 4 or 5 Rooms | 694 (22.4%) | 154 (37.8%) |
| 6 or 7 Rooms | 1,682 (54.3%) | 40 (9.8%) |
| 8 or more Rooms | 683 (22.1%) | 34 (8.4%) |
| Total | 3,096 (100.0%) | 407 (100.0%) |
Housing Structure by Heating Type in Lugoff
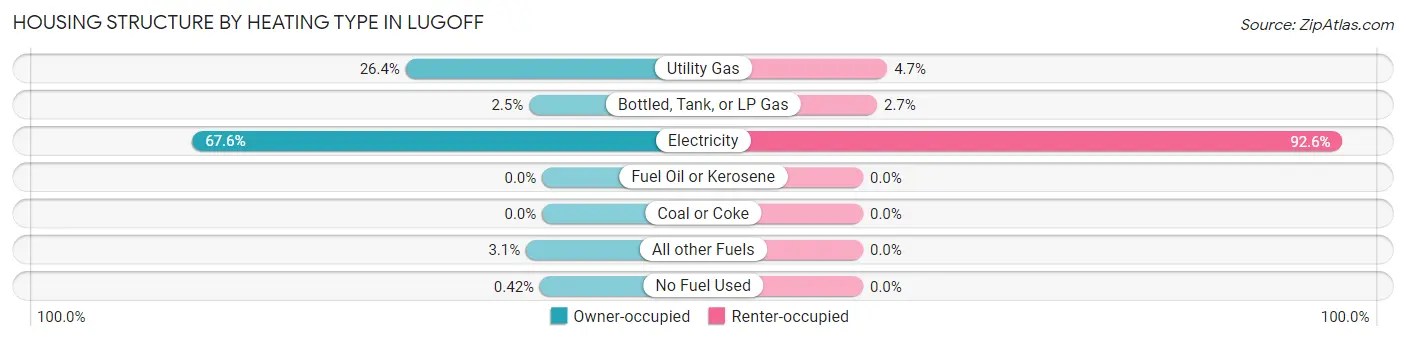
| Heating Type | Owner-occupied | Renter-occupied |
| Utility Gas | 816 (26.4%) | 19 (4.7%) |
| Bottled, Tank, or LP Gas | 78 (2.5%) | 11 (2.7%) |
| Electricity | 2,093 (67.6%) | 377 (92.6%) |
| Fuel Oil or Kerosene | 0 (0.0%) | 0 (0.0%) |
| Coal or Coke | 0 (0.0%) | 0 (0.0%) |
| All other Fuels | 96 (3.1%) | 0 (0.0%) |
| No Fuel Used | 13 (0.4%) | 0 (0.0%) |
| Total | 3,096 (100.0%) | 407 (100.0%) |
Household Vehicle Usage in Lugoff
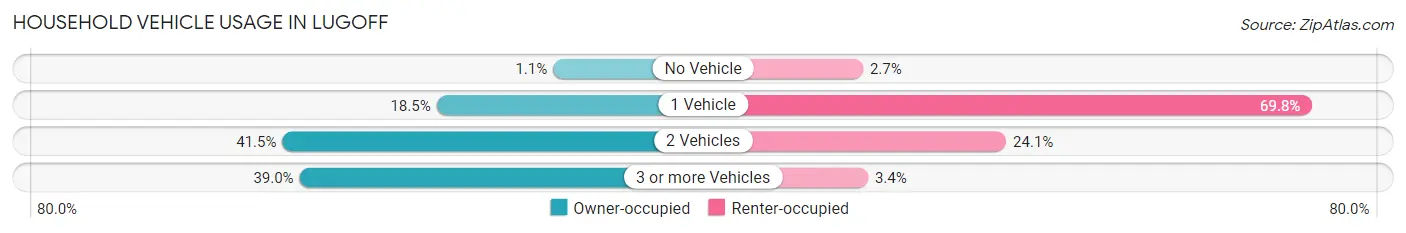
| Vehicles per Household | Owner-occupied | Renter-occupied |
| No Vehicle | 33 (1.1%) | 11 (2.7%) |
| 1 Vehicle | 572 (18.5%) | 284 (69.8%) |
| 2 Vehicles | 1,285 (41.5%) | 98 (24.1%) |
| 3 or more Vehicles | 1,206 (39.0%) | 14 (3.4%) |
| Total | 3,096 (100.0%) | 407 (100.0%) |
Real Estate & Mortgages in Lugoff
Real Estate and Mortgage Overview in Lugoff
| Characteristic | Without Mortgage | With Mortgage |
| Housing Units | 1,112 | 1,984 |
| Median Property Value | $173,700 | $192,800 |
| Median Household Income | $48,696 | $258 |
| Monthly Housing Costs | $378 | $41 |
| Real Estate Taxes | $799 | $0 |
Property Value by Mortgage Status in Lugoff
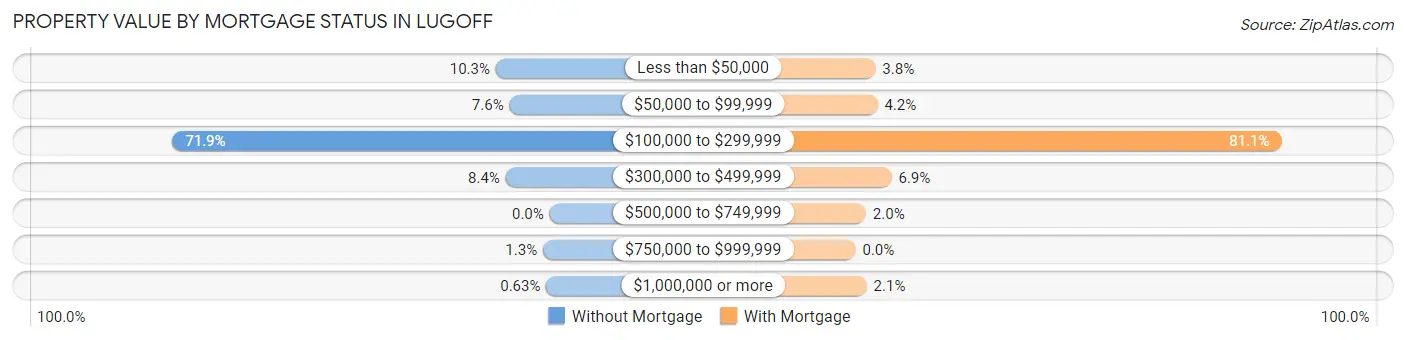
| Property Value | Without Mortgage | With Mortgage |
| Less than $50,000 | 114 (10.2%) | 75 (3.8%) |
| $50,000 to $99,999 | 85 (7.6%) | 83 (4.2%) |
| $100,000 to $299,999 | 799 (71.9%) | 1,609 (81.1%) |
| $300,000 to $499,999 | 93 (8.4%) | 136 (6.9%) |
| $500,000 to $749,999 | 0 (0.0%) | 39 (2.0%) |
| $750,000 to $999,999 | 14 (1.3%) | 0 (0.0%) |
| $1,000,000 or more | 7 (0.6%) | 42 (2.1%) |
| Total | 1,112 (100.0%) | 1,984 (100.0%) |
Household Income by Mortgage Status in Lugoff
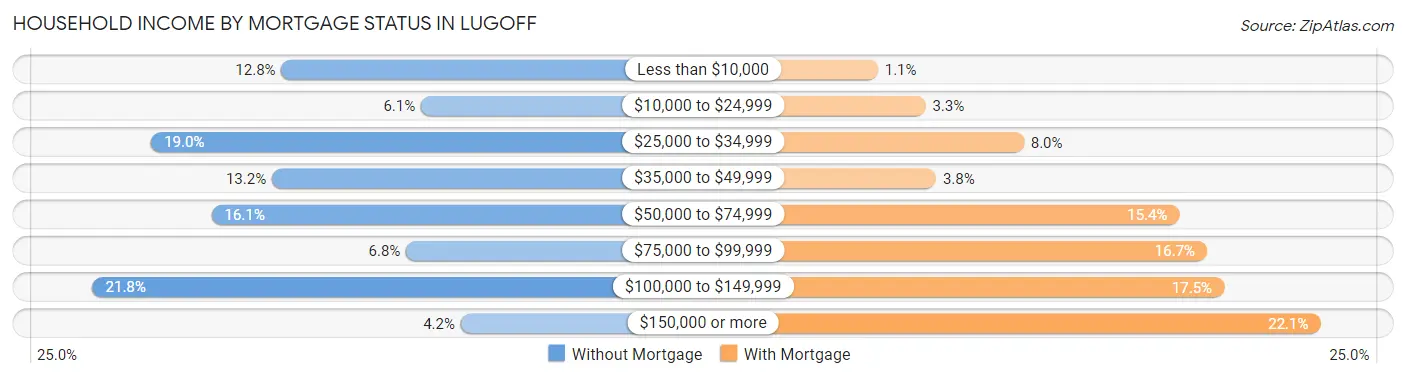
| Household Income | Without Mortgage | With Mortgage |
| Less than $10,000 | 142 (12.8%) | 21 (1.1%) |
| $10,000 to $24,999 | 68 (6.1%) | 66 (3.3%) |
| $25,000 to $34,999 | 211 (19.0%) | 159 (8.0%) |
| $35,000 to $49,999 | 147 (13.2%) | 76 (3.8%) |
| $50,000 to $74,999 | 179 (16.1%) | 306 (15.4%) |
| $75,000 to $99,999 | 76 (6.8%) | 332 (16.7%) |
| $100,000 to $149,999 | 242 (21.8%) | 348 (17.5%) |
| $150,000 or more | 47 (4.2%) | 439 (22.1%) |
| Total | 1,112 (100.0%) | 1,984 (100.0%) |
Property Value to Household Income Ratio in Lugoff
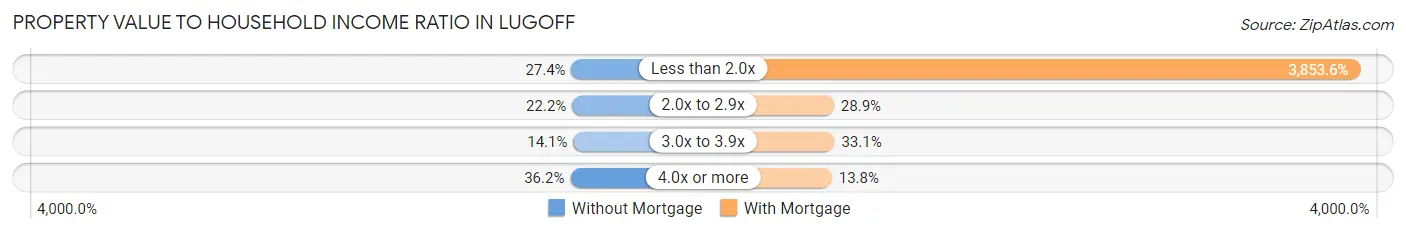
| Value-to-Income Ratio | Without Mortgage | With Mortgage |
| Less than 2.0x | 305 (27.4%) | 76,456 (3,853.6%) |
| 2.0x to 2.9x | 247 (22.2%) | 574 (28.9%) |
| 3.0x to 3.9x | 157 (14.1%) | 656 (33.1%) |
| 4.0x or more | 403 (36.2%) | 274 (13.8%) |
| Total | 1,112 (100.0%) | 1,984 (100.0%) |
Real Estate Taxes by Mortgage Status in Lugoff
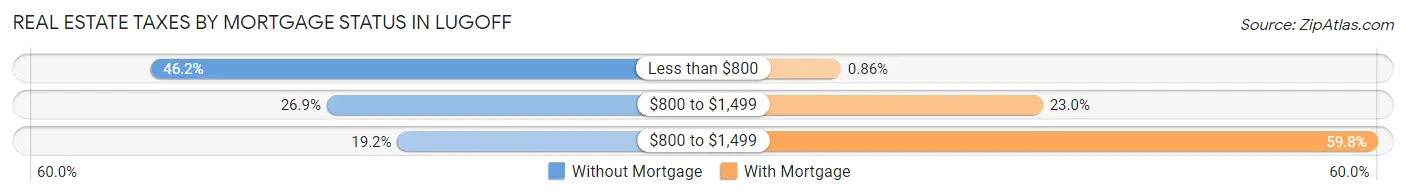
| Property Taxes | Without Mortgage | With Mortgage |
| Less than $800 | 514 (46.2%) | 17 (0.9%) |
| $800 to $1,499 | 299 (26.9%) | 456 (23.0%) |
| $800 to $1,499 | 213 (19.2%) | 1,186 (59.8%) |
| Total | 1,112 (100.0%) | 1,984 (100.0%) |
Health & Disability in Lugoff
Health Insurance Coverage by Age in Lugoff
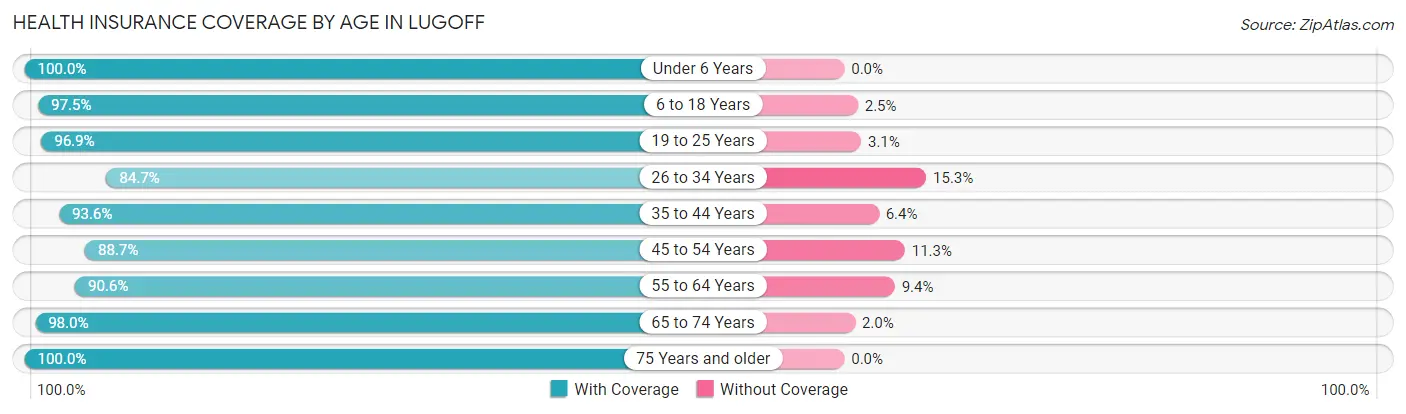
| Age Bracket | With Coverage | Without Coverage |
| Under 6 Years | 600 (100.0%) | 0 (0.0%) |
| 6 to 18 Years | 1,896 (97.5%) | 49 (2.5%) |
| 19 to 25 Years | 651 (96.9%) | 21 (3.1%) |
| 26 to 34 Years | 794 (84.7%) | 143 (15.3%) |
| 35 to 44 Years | 919 (93.6%) | 63 (6.4%) |
| 45 to 54 Years | 936 (88.7%) | 119 (11.3%) |
| 55 to 64 Years | 1,242 (90.6%) | 129 (9.4%) |
| 65 to 74 Years | 937 (98.0%) | 19 (2.0%) |
| 75 Years and older | 739 (100.0%) | 0 (0.0%) |
| Total | 8,714 (94.1%) | 543 (5.9%) |
Health Insurance Coverage by Citizenship Status in Lugoff
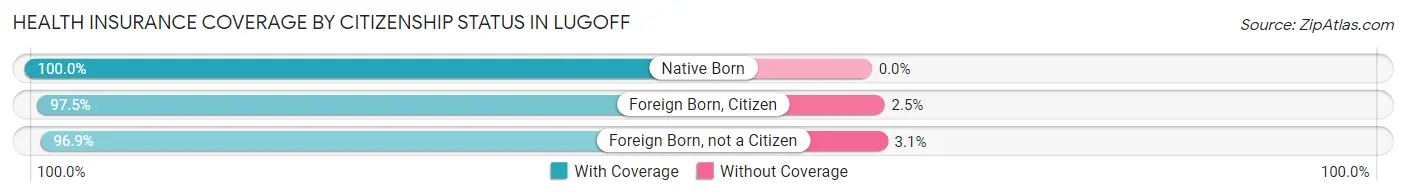
| Citizenship Status | With Coverage | Without Coverage |
| Native Born | 600 (100.0%) | 0 (0.0%) |
| Foreign Born, Citizen | 1,896 (97.5%) | 49 (2.5%) |
| Foreign Born, not a Citizen | 651 (96.9%) | 21 (3.1%) |
Health Insurance Coverage by Household Income in Lugoff
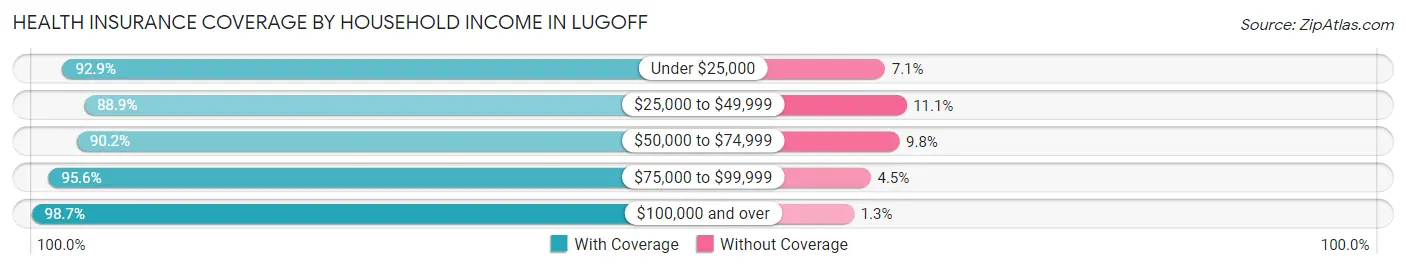
| Household Income | With Coverage | Without Coverage |
| Under $25,000 | 1,069 (92.9%) | 82 (7.1%) |
| $25,000 to $49,999 | 1,764 (88.9%) | 221 (11.1%) |
| $50,000 to $74,999 | 1,234 (90.2%) | 134 (9.8%) |
| $75,000 to $99,999 | 1,354 (95.6%) | 63 (4.4%) |
| $100,000 and over | 3,273 (98.7%) | 43 (1.3%) |
Public vs Private Health Insurance Coverage by Age in Lugoff
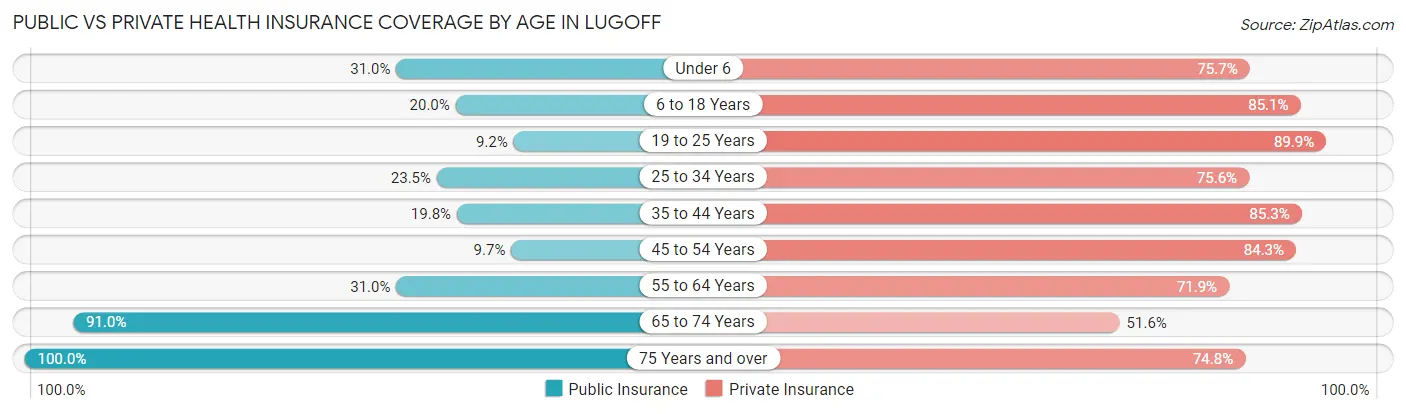
| Age Bracket | Public Insurance | Private Insurance |
| Under 6 | 186 (31.0%) | 454 (75.7%) |
| 6 to 18 Years | 389 (20.0%) | 1,655 (85.1%) |
| 19 to 25 Years | 62 (9.2%) | 604 (89.9%) |
| 25 to 34 Years | 220 (23.5%) | 708 (75.6%) |
| 35 to 44 Years | 194 (19.8%) | 838 (85.3%) |
| 45 to 54 Years | 102 (9.7%) | 889 (84.3%) |
| 55 to 64 Years | 425 (31.0%) | 985 (71.9%) |
| 65 to 74 Years | 870 (91.0%) | 493 (51.6%) |
| 75 Years and over | 739 (100.0%) | 553 (74.8%) |
| Total | 3,187 (34.4%) | 7,179 (77.5%) |
Disability Status by Sex by Age in Lugoff
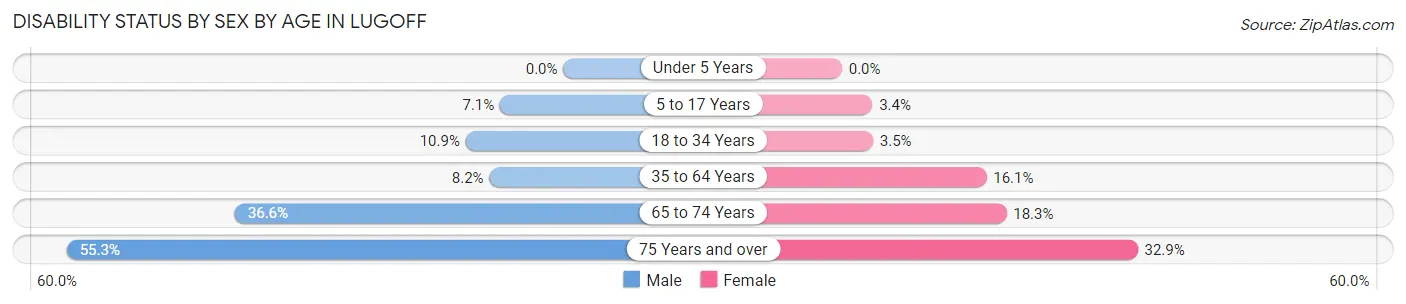
| Age Bracket | Male | Female |
| Under 5 Years | 0 (0.0%) | 0 (0.0%) |
| 5 to 17 Years | 70 (7.0%) | 26 (3.4%) |
| 18 to 34 Years | 112 (10.9%) | 28 (3.5%) |
| 35 to 64 Years | 128 (8.2%) | 298 (16.1%) |
| 65 to 74 Years | 154 (36.6%) | 98 (18.3%) |
| 75 Years and over | 177 (55.3%) | 138 (32.9%) |
Disability Class by Sex by Age in Lugoff
Disability Class: Hearing Difficulty
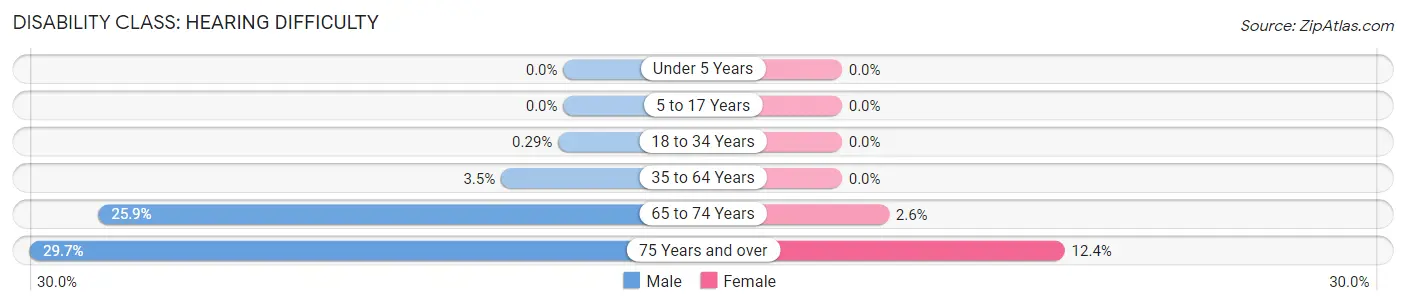
| Age Bracket | Male | Female |
| Under 5 Years | 0 (0.0%) | 0 (0.0%) |
| 5 to 17 Years | 0 (0.0%) | 0 (0.0%) |
| 18 to 34 Years | 3 (0.3%) | 0 (0.0%) |
| 35 to 64 Years | 54 (3.5%) | 0 (0.0%) |
| 65 to 74 Years | 109 (25.9%) | 14 (2.6%) |
| 75 Years and over | 95 (29.7%) | 52 (12.4%) |
Disability Class: Vision Difficulty
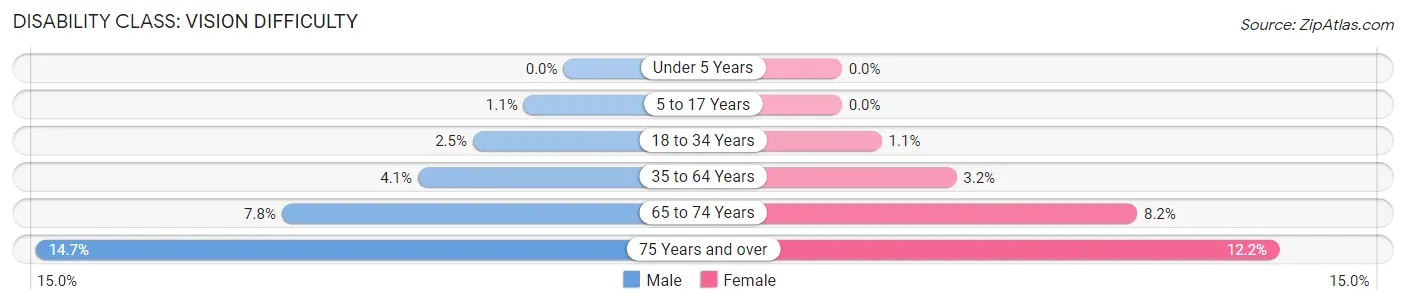
| Age Bracket | Male | Female |
| Under 5 Years | 0 (0.0%) | 0 (0.0%) |
| 5 to 17 Years | 11 (1.1%) | 0 (0.0%) |
| 18 to 34 Years | 26 (2.5%) | 9 (1.1%) |
| 35 to 64 Years | 63 (4.1%) | 59 (3.2%) |
| 65 to 74 Years | 33 (7.8%) | 44 (8.2%) |
| 75 Years and over | 47 (14.7%) | 51 (12.2%) |
Disability Class: Cognitive Difficulty
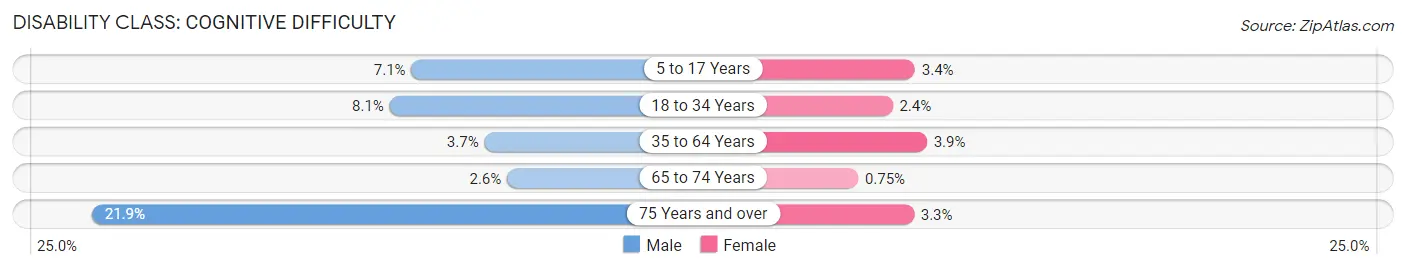
| Age Bracket | Male | Female |
| 5 to 17 Years | 70 (7.0%) | 26 (3.4%) |
| 18 to 34 Years | 83 (8.1%) | 19 (2.4%) |
| 35 to 64 Years | 57 (3.7%) | 73 (3.9%) |
| 65 to 74 Years | 11 (2.6%) | 4 (0.7%) |
| 75 Years and over | 70 (21.9%) | 14 (3.3%) |
Disability Class: Ambulatory Difficulty
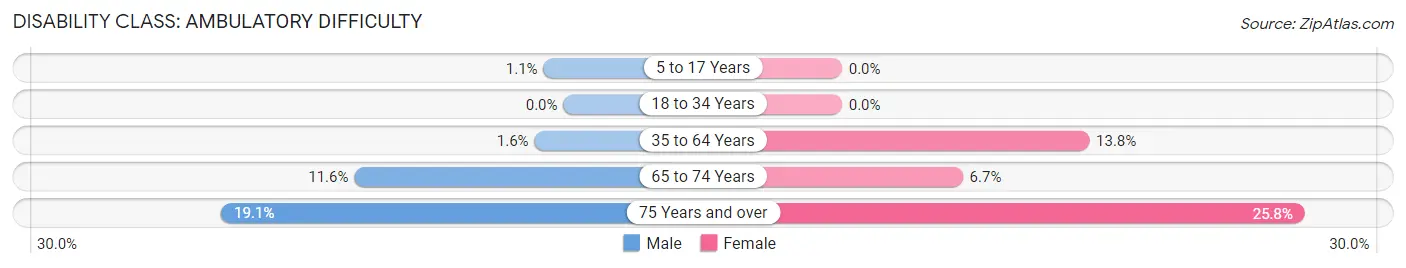
| Age Bracket | Male | Female |
| 5 to 17 Years | 11 (1.1%) | 0 (0.0%) |
| 18 to 34 Years | 0 (0.0%) | 0 (0.0%) |
| 35 to 64 Years | 25 (1.6%) | 255 (13.8%) |
| 65 to 74 Years | 49 (11.6%) | 36 (6.7%) |
| 75 Years and over | 61 (19.1%) | 108 (25.8%) |
Disability Class: Self-Care Difficulty
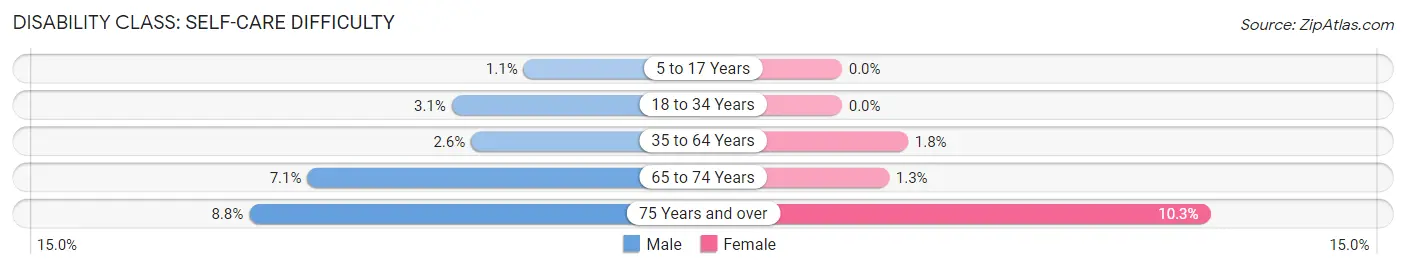
| Age Bracket | Male | Female |
| 5 to 17 Years | 11 (1.1%) | 0 (0.0%) |
| 18 to 34 Years | 32 (3.1%) | 0 (0.0%) |
| 35 to 64 Years | 40 (2.6%) | 34 (1.8%) |
| 65 to 74 Years | 30 (7.1%) | 7 (1.3%) |
| 75 Years and over | 28 (8.7%) | 43 (10.3%) |
Technology Access in Lugoff
Computing Device Access in Lugoff
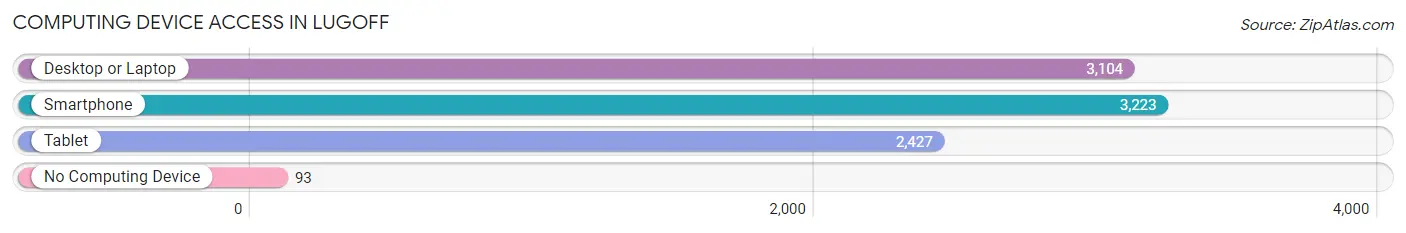
| Device Type | # Households | % Households |
| Desktop or Laptop | 3,104 | 88.6% |
| Smartphone | 3,223 | 92.0% |
| Tablet | 2,427 | 69.3% |
| No Computing Device | 93 | 2.6% |
| Total | 3,503 | 100.0% |
Internet Access in Lugoff
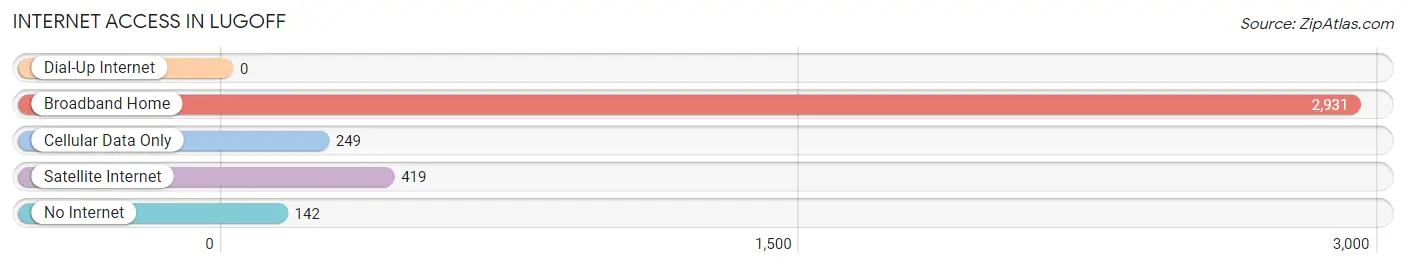
| Internet Type | # Households | % Households |
| Dial-Up Internet | 0 | 0.0% |
| Broadband Home | 2,931 | 83.7% |
| Cellular Data Only | 249 | 7.1% |
| Satellite Internet | 419 | 12.0% |
| No Internet | 142 | 4.1% |
| Total | 3,503 | 100.0% |
Lugoff Summary
Lugoff is a small town located in Kershaw County, South Carolina. It is situated approximately 20 miles northeast of Columbia, the state capital. The town was founded in 1883 and is named after the Lugoff family, who were early settlers in the area. The population of Lugoff was 2,845 as of the 2010 census.
Geography
Lugoff is located in the Piedmont region of South Carolina, which is characterized by rolling hills and flat plains. The town is situated on the banks of the Wateree River, which is a major tributary of the Santee River. The town is located at an elevation of approximately 200 feet above sea level. The climate in Lugoff is humid subtropical, with hot, humid summers and mild winters.
Economy
Lugoff’s economy is largely based on agriculture and manufacturing. The town is home to several large farms, which produce a variety of crops, including corn, soybeans, cotton, and tobacco. The town is also home to several manufacturing companies, including a paper mill, a furniture factory, and a plastics plant. In addition, Lugoff is home to several small businesses, including restaurants, retail stores, and service providers.
Demographics
As of the 2010 census, the population of Lugoff was 2,845. The racial makeup of the town was 79.3% White, 17.2% African American, 0.7% Native American, 0.7% Asian, 0.2% Pacific Islander, and 1.9% from other races. The median household income in Lugoff was $37,917, and the median family income was $45,938. The per capita income in Lugoff was $19,945.
History
Lugoff was founded in 1883 by the Lugoff family, who were early settlers in the area. The town was originally known as “Lugoff’s Crossroads”, as it was located at the intersection of two major roads. In the early 1900s, the town was home to several businesses, including a general store, a blacksmith shop, and a cotton gin. In the 1920s, the town was home to a movie theater, a hotel, and a bank.
In the 1950s, the town began to experience rapid growth, as new businesses and industries moved into the area. In the 1960s, the town was home to several large farms, which produced a variety of crops. In the 1970s, the town was home to several manufacturing companies, including a paper mill, a furniture factory, and a plastics plant.
Today, Lugoff is a small, rural town with a population of approximately 2,845. The town is home to several businesses, including restaurants, retail stores, and service providers. The town is also home to several large farms, which produce a variety of crops. In addition, Lugoff is home to several manufacturing companies, which provide jobs for many of the town’s residents.
Common Questions
What is Per Capita Income in Lugoff?
Per Capita income in Lugoff is $28,041.
What is the Median Family Income in Lugoff?
Median Family Income in Lugoff is $71,591.
What is the Median Household income in Lugoff?
Median Household Income in Lugoff is $57,885.
What is Income or Wage Gap in Lugoff?
Income or Wage Gap in Lugoff is 29.8%.
Women in Lugoff earn 70.2 cents for every dollar earned by a man.
What is Family Income Deficit in Lugoff?
Family Income Deficit in Lugoff is $11,046.
Families that are below poverty line in Lugoff earn $11,046 less on average than the poverty threshold level.
What is Inequality or Gini Index in Lugoff?
Inequality or Gini Index in Lugoff is 0.41.
What is the Total Population of Lugoff?
Total Population of Lugoff is 9,423.
What is the Total Male Population of Lugoff?
Total Male Population of Lugoff is 4,814.
What is the Total Female Population of Lugoff?
Total Female Population of Lugoff is 4,609.
What is the Ratio of Males per 100 Females in Lugoff?
There are 104.45 Males per 100 Females in Lugoff.
What is the Ratio of Females per 100 Males in Lugoff?
There are 95.74 Females per 100 Males in Lugoff.
What is the Median Population Age in Lugoff?
Median Population Age in Lugoff is 39.4 Years.
What is the Average Family Size in Lugoff
Average Family Size in Lugoff is 3.1 People.
What is the Average Household Size in Lugoff
Average Household Size in Lugoff is 2.7 People.
How Large is the Labor Force in Lugoff?
There are 4,306 People in the Labor Forcein in Lugoff.
What is the Percentage of People in the Labor Force in Lugoff?
58.3% of People are in the Labor Force in Lugoff.
What is the Unemployment Rate in Lugoff?
Unemployment Rate in Lugoff is 3.7%.