Sullivan s Island, SC Map & Demographics
Sullivan s Island Map
Sullivan s Island Overview
$107,987
PER CAPITA INCOME
$213,750
AVG FAMILY INCOME
$171,838
AVG HOUSEHOLD INCOME
0.51
INEQUALITY / GINI INDEX
2,317
TOTAL POPULATION
1,168
MALE POPULATION
1,149
FEMALE POPULATION
101.65
MALES / 100 FEMALES
98.37
FEMALES / 100 MALES
51.7
MEDIAN AGE
2.9
AVG FAMILY SIZE
2.7
AVG HOUSEHOLD SIZE
1,213
LABOR FORCE [ PEOPLE ]
60.6%
PERCENT IN LABOR FORCE
1.6%
UNEMPLOYMENT RATE
Income in Sullivan s Island
Income Overview in Sullivan s Island
Per Capita Income in Sullivan s Island is $107,987, while median incomes of families and households are $213,750 and $171,838 respectively.
| Characteristic | Number | Measure |
| Per Capita Income | 2,317 | $107,987 |
| Median Family Income | 621 | $213,750 |
| Mean Family Income | 621 | $343,430 |
| Median Household Income | 846 | $171,838 |
| Mean Household Income | 846 | $291,546 |
| Income Deficit | 621 | $0 |
| Wage / Income Gap (%) | 2,317 | 0.00% |
| Wage / Income Gap ($) | 2,317 | 100.00¢ per $1 |
| Gini / Inequality Index | 2,317 | 0.51 |
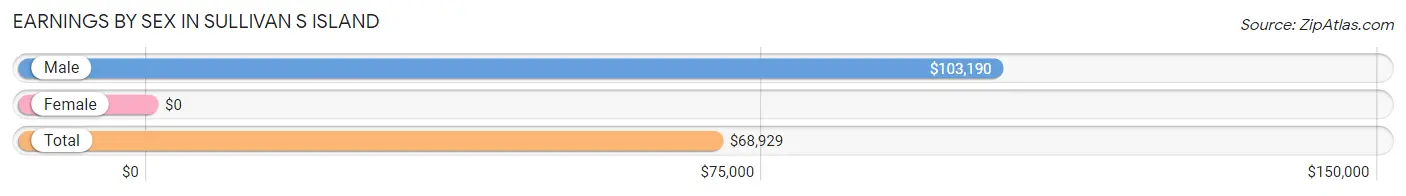
Earnings by Sex in Sullivan s Island
| Sex | Number | Average Earnings |
| Male | 739 (57.0%) | $103,190 |
| Female | 557 (43.0%) | $0 |
| Total | 1,296 (100.0%) | $68,929 |
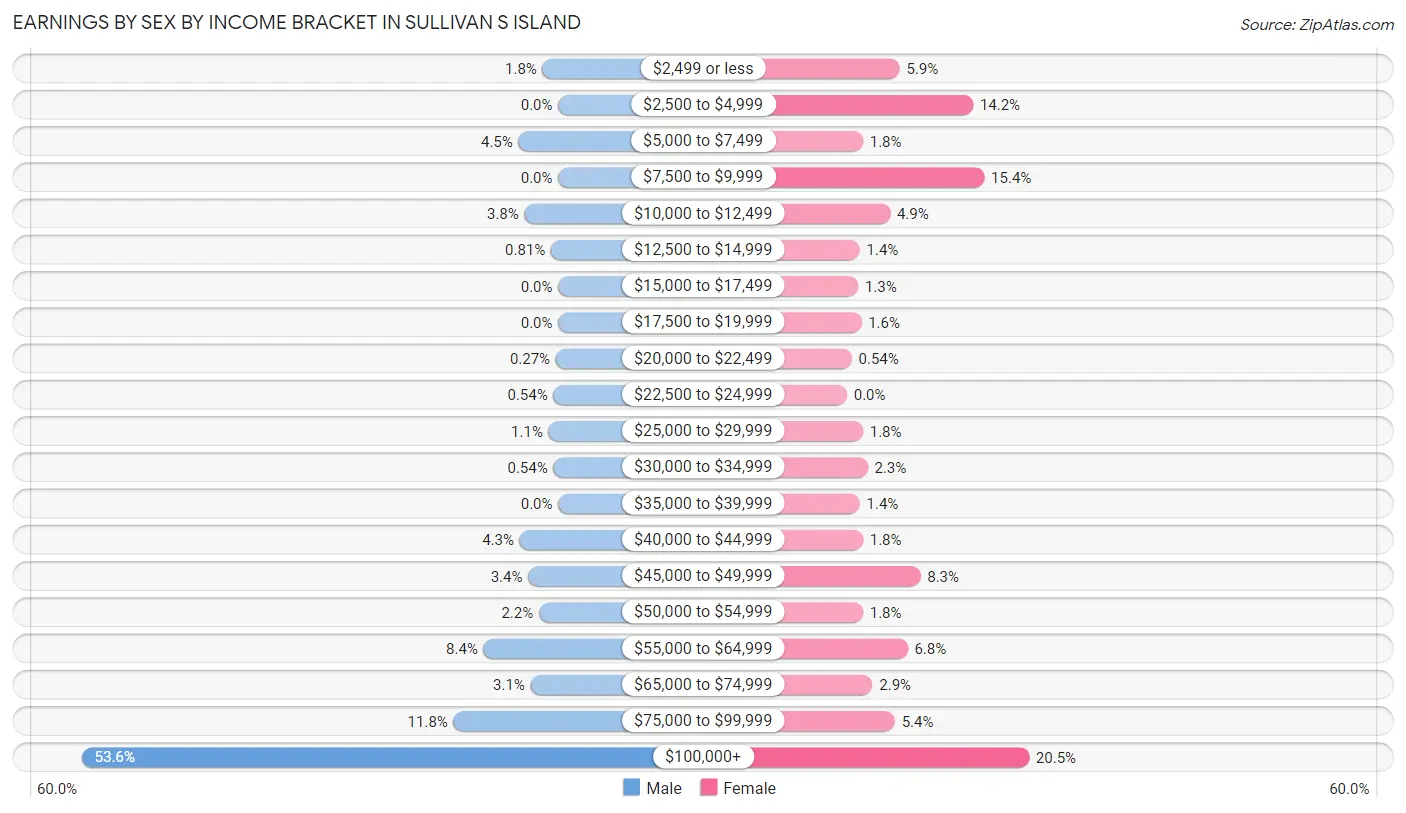
Earnings by Sex by Income Bracket in Sullivan s Island
The most common earnings brackets in Sullivan s Island are $100,000+ for men (396 | 53.6%) and $100,000+ for women (114 | 20.5%).
| Income | Male | Female |
| $2,499 or less | 13 (1.8%) | 33 (5.9%) |
| $2,500 to $4,999 | 0 (0.0%) | 79 (14.2%) |
| $5,000 to $7,499 | 33 (4.5%) | 10 (1.8%) |
| $7,500 to $9,999 | 0 (0.0%) | 86 (15.4%) |
| $10,000 to $12,499 | 28 (3.8%) | 27 (4.9%) |
| $12,500 to $14,999 | 6 (0.8%) | 8 (1.4%) |
| $15,000 to $17,499 | 0 (0.0%) | 7 (1.3%) |
| $17,500 to $19,999 | 0 (0.0%) | 9 (1.6%) |
| $20,000 to $22,499 | 2 (0.3%) | 3 (0.5%) |
| $22,500 to $24,999 | 4 (0.5%) | 0 (0.0%) |
| $25,000 to $29,999 | 8 (1.1%) | 10 (1.8%) |
| $30,000 to $34,999 | 4 (0.5%) | 13 (2.3%) |
| $35,000 to $39,999 | 0 (0.0%) | 8 (1.4%) |
| $40,000 to $44,999 | 32 (4.3%) | 10 (1.8%) |
| $45,000 to $49,999 | 25 (3.4%) | 46 (8.3%) |
| $50,000 to $54,999 | 16 (2.2%) | 10 (1.8%) |
| $55,000 to $64,999 | 62 (8.4%) | 38 (6.8%) |
| $65,000 to $74,999 | 23 (3.1%) | 16 (2.9%) |
| $75,000 to $99,999 | 87 (11.8%) | 30 (5.4%) |
| $100,000+ | 396 (53.6%) | 114 (20.5%) |
| Total | 739 (100.0%) | 557 (100.0%) |
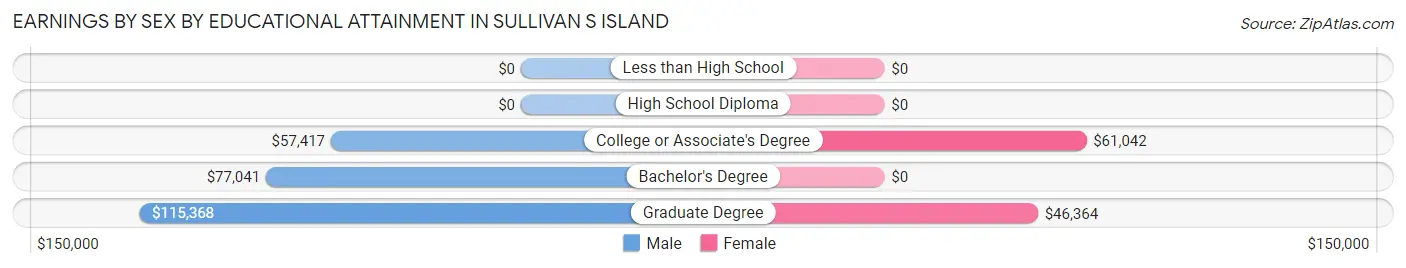
Earnings by Sex by Educational Attainment in Sullivan s Island
| Educational Attainment | Male Income | Female Income |
| Less than High School | - | - |
| High School Diploma | - | - |
| College or Associate's Degree | $57,417 | $61,042 |
| Bachelor's Degree | $77,041 | $0 |
| Graduate Degree | $115,368 | $46,364 |
| Total | $103,880 | $0 |
Family Income in Sullivan s Island
Family Income Brackets in Sullivan s Island
According to the Sullivan s Island family income data, there are 324 families falling into the $200,000+ income range, which is the most common income bracket and makes up 52.2% of all families.
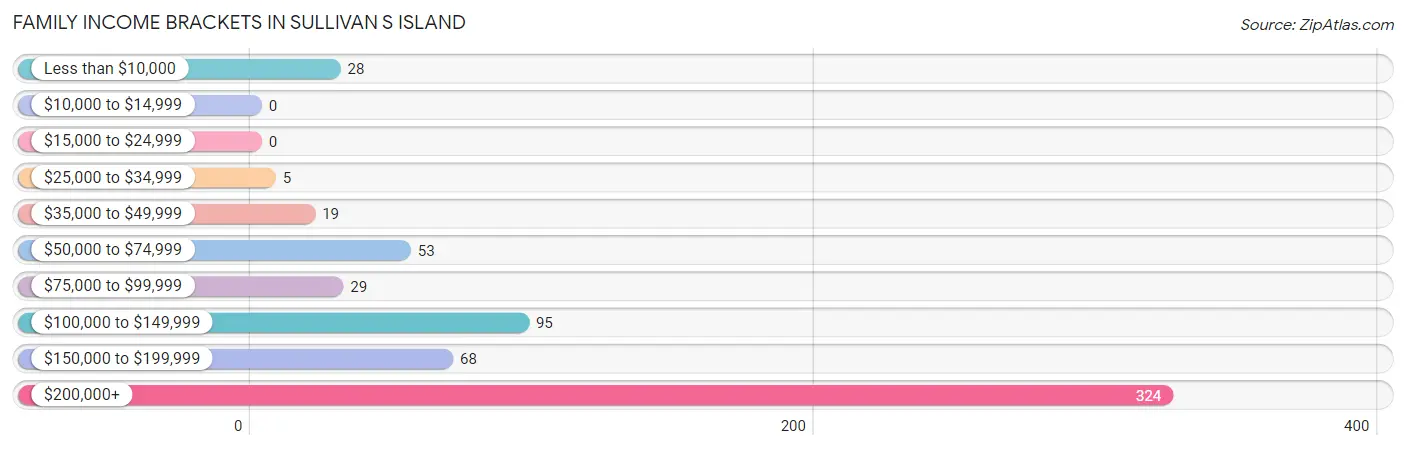
| Income Bracket | # Families | % Families |
| Less than $10,000 | 28 | 4.5% |
| $10,000 to $14,999 | 0 | 0.0% |
| $15,000 to $24,999 | 0 | 0.0% |
| $25,000 to $34,999 | 5 | 0.8% |
| $35,000 to $49,999 | 19 | 3.1% |
| $50,000 to $74,999 | 53 | 8.5% |
| $75,000 to $99,999 | 29 | 4.7% |
| $100,000 to $149,999 | 95 | 15.3% |
| $150,000 to $199,999 | 68 | 11.0% |
| $200,000+ | 324 | 52.2% |
Family Income by Famaliy Size in Sullivan s Island
3-person families (92 | 14.8%) account for the highest median family income in Sullivan s Island with $250,001 per family, while 2-person families (330 | 53.1%) have the highest median income of $89,166 per family member.
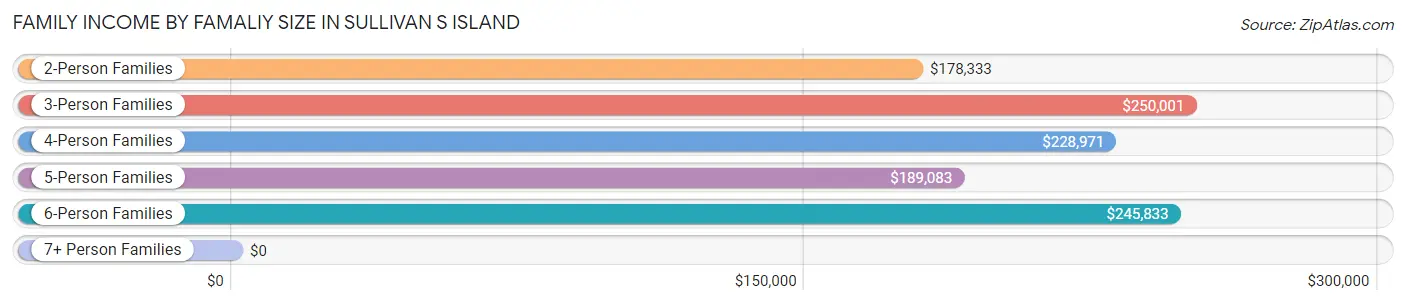
| Income Bracket | # Families | Median Income |
| 2-Person Families | 330 (53.1%) | $178,333 |
| 3-Person Families | 92 (14.8%) | $250,001 |
| 4-Person Families | 132 (21.3%) | $228,971 |
| 5-Person Families | 57 (9.2%) | $189,083 |
| 6-Person Families | 10 (1.6%) | $245,833 |
| 7+ Person Families | 0 (0.0%) | $0 |
| Total | 621 (100.0%) | $213,750 |
Family Income by Number of Earners in Sullivan s Island
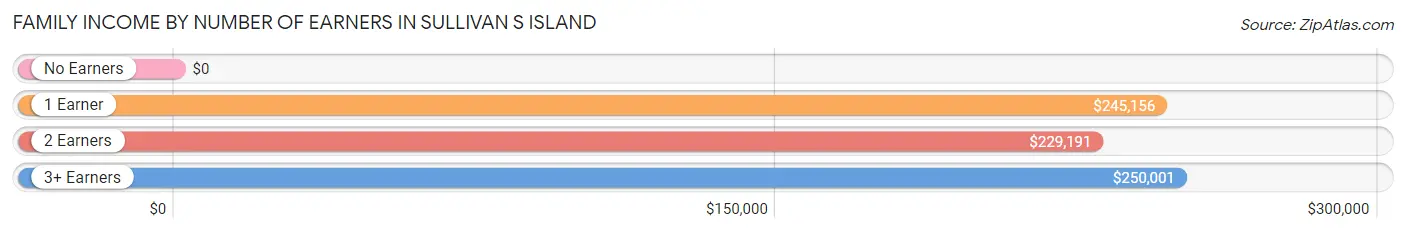
| Number of Earners | # Families | Median Income |
| No Earners | 113 (18.2%) | $0 |
| 1 Earner | 217 (34.9%) | $245,156 |
| 2 Earners | 227 (36.5%) | $229,191 |
| 3+ Earners | 64 (10.3%) | $250,001 |
| Total | 621 (100.0%) | $213,750 |
Household Income in Sullivan s Island
Household Income Brackets in Sullivan s Island
With 356 households falling in the category, the $200,000+ income range is the most frequent in Sullivan s Island, accounting for 42.1% of all households. In contrast, only 3 households (0.4%) fall into the $10,000 to $14,999 income bracket, making it the least populous group.
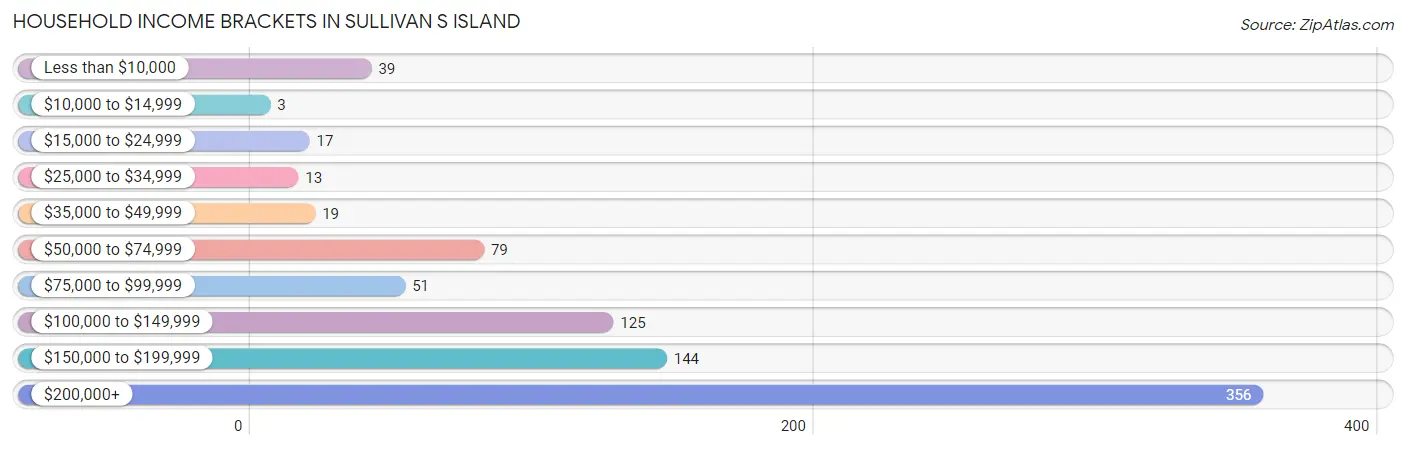
| Income Bracket | # Households | % Households |
| Less than $10,000 | 39 | 4.6% |
| $10,000 to $14,999 | 3 | 0.4% |
| $15,000 to $24,999 | 17 | 2.0% |
| $25,000 to $34,999 | 13 | 1.5% |
| $35,000 to $49,999 | 19 | 2.2% |
| $50,000 to $74,999 | 79 | 9.3% |
| $75,000 to $99,999 | 51 | 6.0% |
| $100,000 to $149,999 | 125 | 14.8% |
| $150,000 to $199,999 | 144 | 17.0% |
| $200,000+ | 356 | 42.1% |
Household Income by Householder Age in Sullivan s Island
The median household income in Sullivan s Island is $171,838, with the highest median household income of $191,250 found in the 25 to 44 years age bracket for the primary householder. A total of 106 households (12.5%) fall into this category. Meanwhile, the 15 to 24 years age bracket for the primary householder has the lowest median household income of $0, with 10 households (1.2%) in this group.
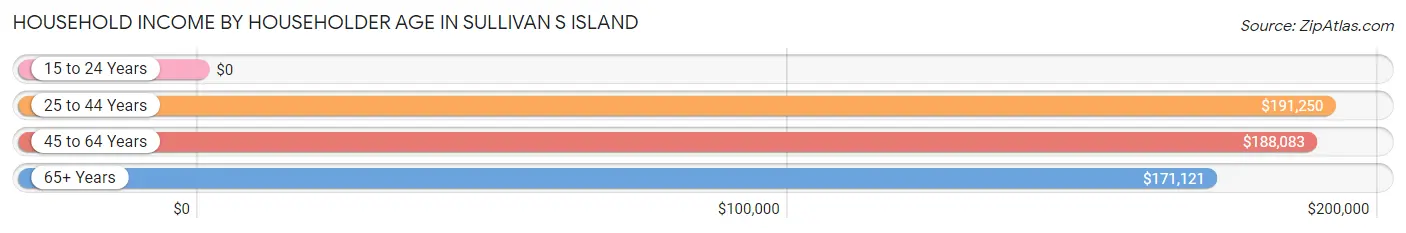
| Income Bracket | # Households | Median Income |
| 15 to 24 Years | 10 (1.2%) | $0 |
| 25 to 44 Years | 106 (12.5%) | $191,250 |
| 45 to 64 Years | 413 (48.8%) | $188,083 |
| 65+ Years | 317 (37.5%) | $171,121 |
| Total | 846 (100.0%) | $171,838 |
Poverty in Sullivan s Island
Income Below Poverty by Sex and Age in Sullivan s Island
With 6.6% poverty level for males and 13.7% for females among the residents of Sullivan s Island, 18 to 24 year old males and 65 to 74 year old females are the most vulnerable to poverty, with 32 males (54.2%) and 81 females (28.8%) in their respective age groups living below the poverty level.
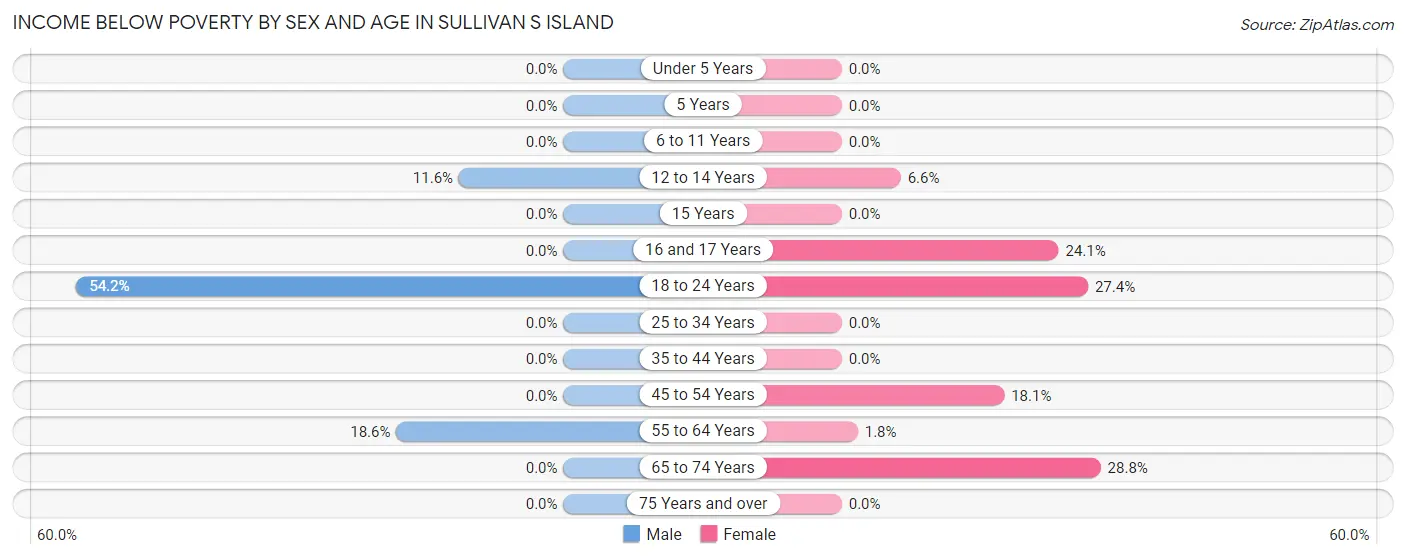
| Age Bracket | Male | Female |
| Under 5 Years | 0 (0.0%) | 0 (0.0%) |
| 5 Years | 0 (0.0%) | 0 (0.0%) |
| 6 to 11 Years | 0 (0.0%) | 0 (0.0%) |
| 12 to 14 Years | 5 (11.6%) | 4 (6.6%) |
| 15 Years | 0 (0.0%) | 0 (0.0%) |
| 16 and 17 Years | 0 (0.0%) | 14 (24.1%) |
| 18 to 24 Years | 32 (54.2%) | 17 (27.4%) |
| 25 to 34 Years | 0 (0.0%) | 0 (0.0%) |
| 35 to 44 Years | 0 (0.0%) | 0 (0.0%) |
| 45 to 54 Years | 0 (0.0%) | 36 (18.1%) |
| 55 to 64 Years | 40 (18.6%) | 4 (1.8%) |
| 65 to 74 Years | 0 (0.0%) | 81 (28.8%) |
| 75 Years and over | 0 (0.0%) | 0 (0.0%) |
| Total | 77 (6.6%) | 156 (13.7%) |
Income Above Poverty by Sex and Age in Sullivan s Island
According to the poverty statistics in Sullivan s Island, males aged under 5 years and females aged under 5 years are the age groups that are most secure financially, with 100.0% of males and 100.0% of females in these age groups living above the poverty line.
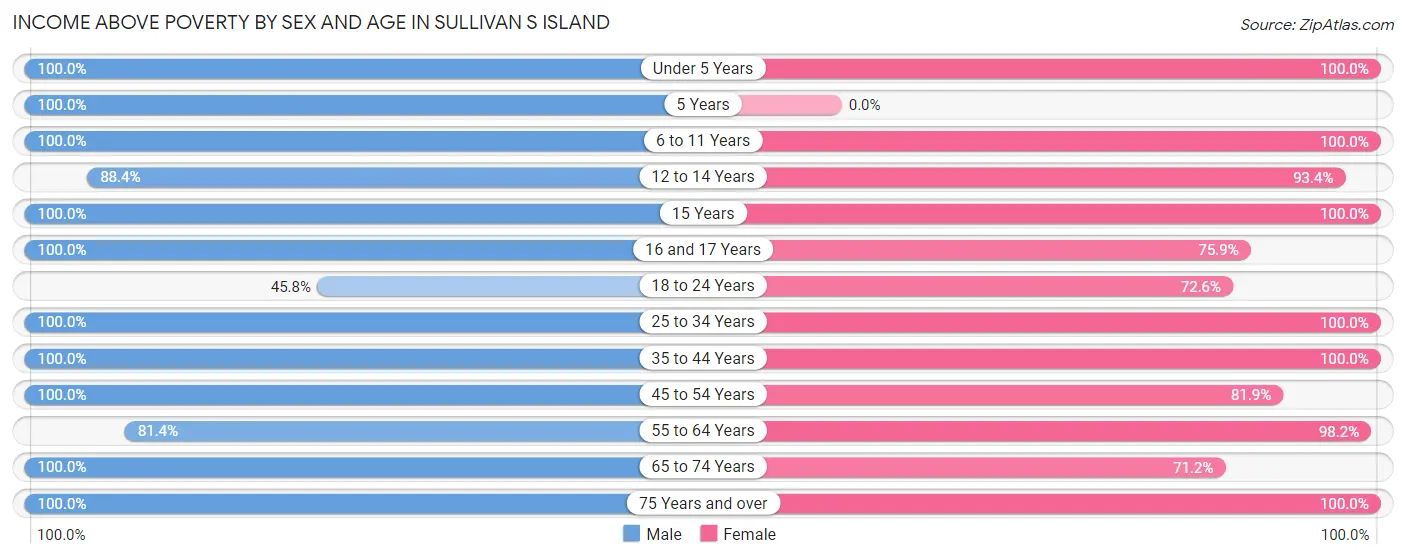
| Age Bracket | Male | Female |
| Under 5 Years | 43 (100.0%) | 32 (100.0%) |
| 5 Years | 3 (100.0%) | 0 (0.0%) |
| 6 to 11 Years | 84 (100.0%) | 24 (100.0%) |
| 12 to 14 Years | 38 (88.4%) | 57 (93.4%) |
| 15 Years | 6 (100.0%) | 8 (100.0%) |
| 16 and 17 Years | 53 (100.0%) | 44 (75.9%) |
| 18 to 24 Years | 27 (45.8%) | 45 (72.6%) |
| 25 to 34 Years | 79 (100.0%) | 40 (100.0%) |
| 35 to 44 Years | 183 (100.0%) | 72 (100.0%) |
| 45 to 54 Years | 168 (100.0%) | 163 (81.9%) |
| 55 to 64 Years | 175 (81.4%) | 221 (98.2%) |
| 65 to 74 Years | 132 (100.0%) | 200 (71.2%) |
| 75 Years and over | 94 (100.0%) | 81 (100.0%) |
| Total | 1,085 (93.4%) | 987 (86.4%) |
Income Below Poverty Among Married-Couple Families in Sullivan s Island
The poverty statistics for married-couple families in Sullivan s Island show that 4.0% or 23 of the total 578 families live below the poverty line. Families with 1 or 2 children have the highest poverty rate of 8.8%, comprising of 15 families. On the other hand, families with 3 or 4 children have the lowest poverty rate of 0.0%, which includes 0 families.
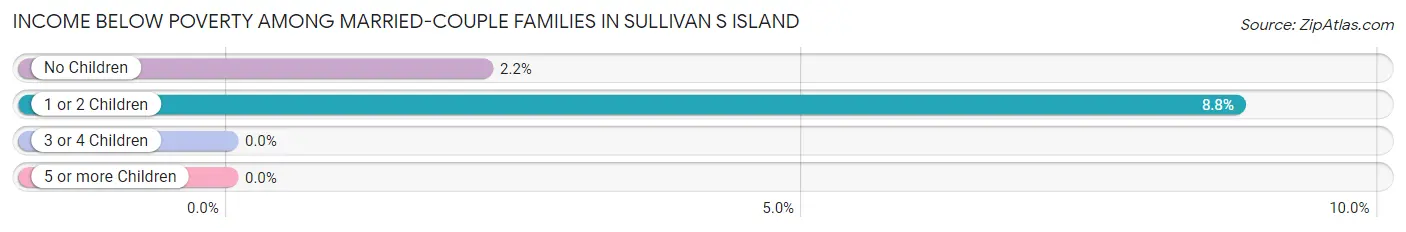
| Children | Above Poverty | Below Poverty |
| No Children | 353 (97.8%) | 8 (2.2%) |
| 1 or 2 Children | 156 (91.2%) | 15 (8.8%) |
| 3 or 4 Children | 46 (100.0%) | 0 (0.0%) |
| 5 or more Children | 0 (0.0%) | 0 (0.0%) |
| Total | 555 (96.0%) | 23 (4.0%) |
Income Below Poverty Among Single-Parent Households in Sullivan s Island
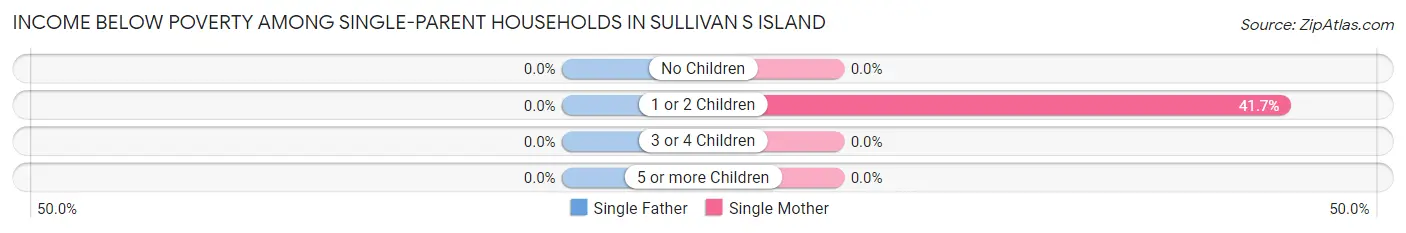
| Children | Single Father | Single Mother |
| No Children | 0 (0.0%) | 0 (0.0%) |
| 1 or 2 Children | 0 (0.0%) | 5 (41.7%) |
| 3 or 4 Children | 0 (0.0%) | 0 (0.0%) |
| 5 or more Children | 0 (0.0%) | 0 (0.0%) |
| Total | 0 (0.0%) | 5 (14.7%) |
Income Below Poverty Among Married-Couple vs Single-Parent Households in Sullivan s Island
The poverty data for Sullivan s Island shows that 23 of the married-couple family households (4.0%) and 5 of the single-parent households (11.6%) are living below the poverty level. Within the married-couple family households, those with 1 or 2 children have the highest poverty rate, with 15 households (8.8%) falling below the poverty line. Among the single-parent households, those with 1 or 2 children have the highest poverty rate, with 5 household (35.7%) living below poverty.
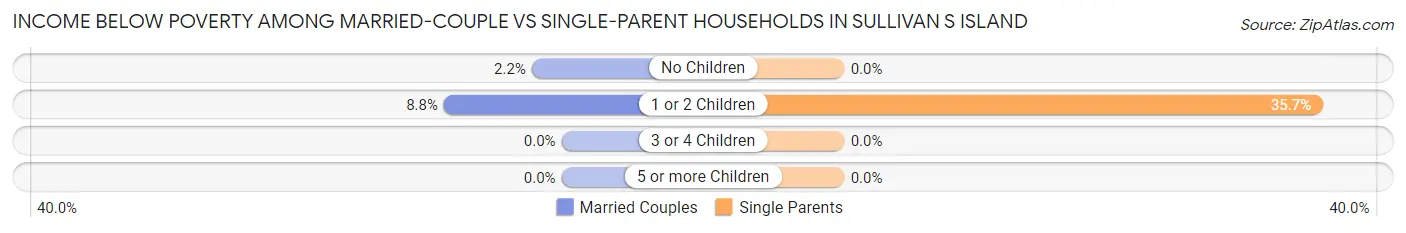
| Children | Married-Couple Families | Single-Parent Households |
| No Children | 8 (2.2%) | 0 (0.0%) |
| 1 or 2 Children | 15 (8.8%) | 5 (35.7%) |
| 3 or 4 Children | 0 (0.0%) | 0 (0.0%) |
| 5 or more Children | 0 (0.0%) | 0 (0.0%) |
| Total | 23 (4.0%) | 5 (11.6%) |
Race in Sullivan s Island
The most populous races in Sullivan s Island are White / Caucasian (2,269 | 97.9%), Hispanic or Latino (36 | 1.5%), and Asian (23 | 1.0%).
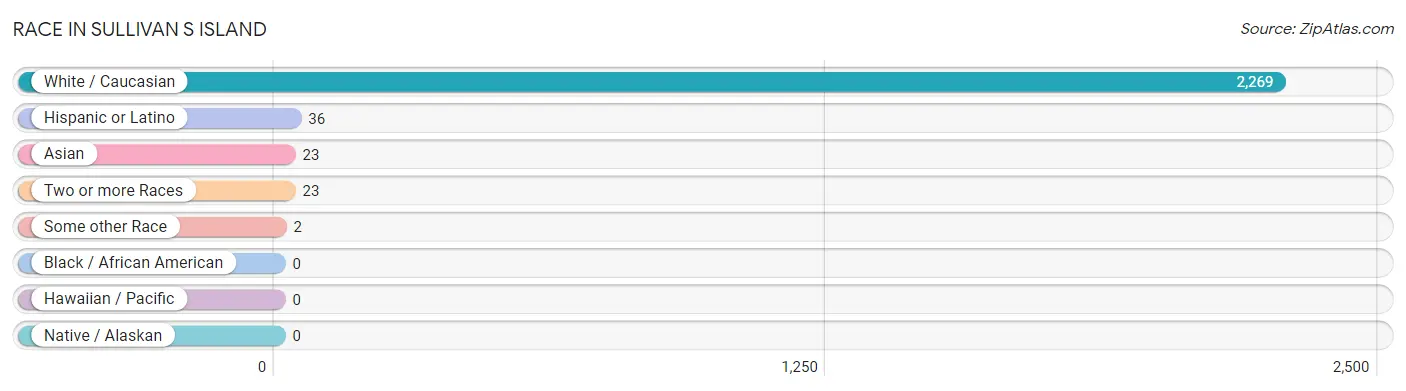
| Race | # Population | % Population |
| Asian | 23 | 1.0% |
| Black / African American | 0 | 0.0% |
| Hawaiian / Pacific | 0 | 0.0% |
| Hispanic or Latino | 36 | 1.5% |
| Native / Alaskan | 0 | 0.0% |
| White / Caucasian | 2,269 | 97.9% |
| Two or more Races | 23 | 1.0% |
| Some other Race | 2 | 0.1% |
| Total | 2,317 | 100.0% |
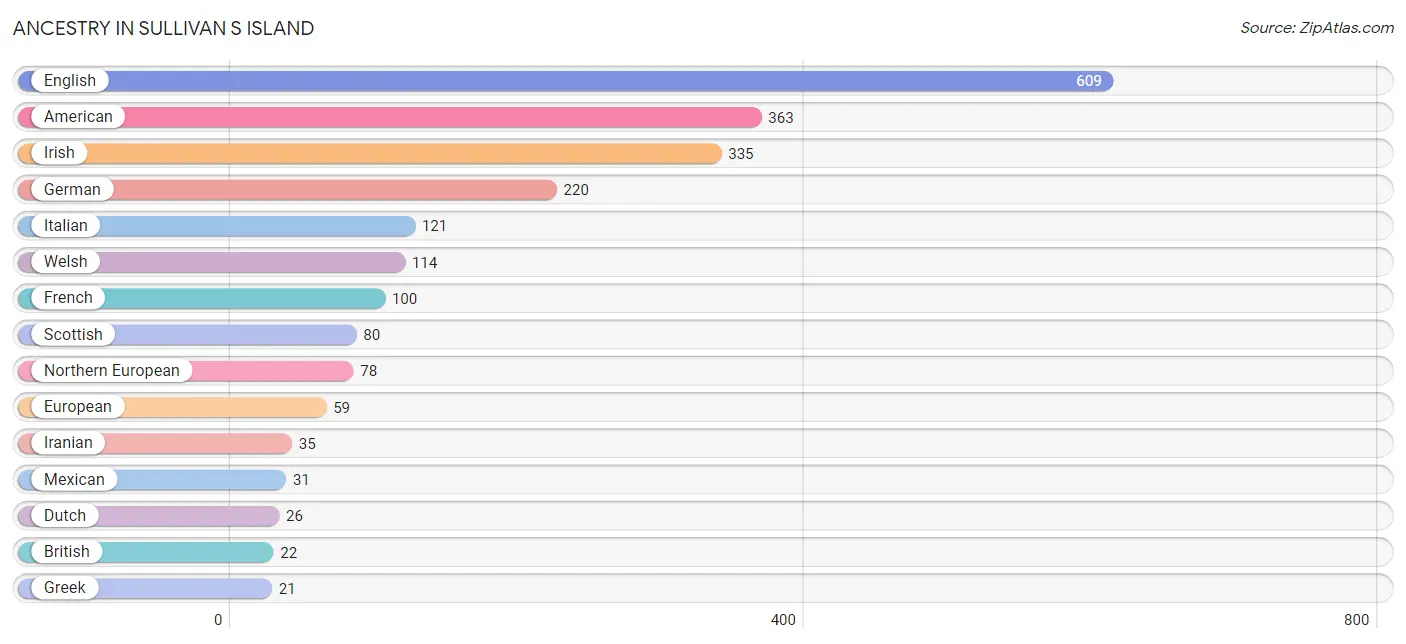
Ancestry in Sullivan s Island
The most populous ancestries reported in Sullivan s Island are English (609 | 26.3%), American (363 | 15.7%), Irish (335 | 14.5%), German (220 | 9.5%), and Italian (121 | 5.2%), together accounting for 71.1% of all Sullivan s Island residents.
| Ancestry | # Population | % Population |
| Albanian | 5 | 0.2% |
| American | 363 | 15.7% |
| Arab | 16 | 0.7% |
| Bhutanese | 6 | 0.3% |
| British | 22 | 0.9% |
| Burmese | 9 | 0.4% |
| Canadian | 4 | 0.2% |
| Danish | 3 | 0.1% |
| Dutch | 26 | 1.1% |
| Eastern European | 8 | 0.4% |
| English | 609 | 26.3% |
| European | 59 | 2.5% |
| French | 100 | 4.3% |
| German | 220 | 9.5% |
| Greek | 21 | 0.9% |
| Iranian | 35 | 1.5% |
| Irish | 335 | 14.5% |
| Italian | 121 | 5.2% |
| Lebanese | 16 | 0.7% |
| Lithuanian | 5 | 0.2% |
| Mexican | 31 | 1.3% |
| Northern European | 78 | 3.4% |
| Norwegian | 5 | 0.2% |
| Polish | 13 | 0.6% |
| Russian | 18 | 0.8% |
| Scandinavian | 13 | 0.6% |
| Scotch-Irish | 20 | 0.9% |
| Scottish | 80 | 3.5% |
| Slovak | 5 | 0.2% |
| South American | 2 | 0.1% |
| Spanish | 3 | 0.1% |
| Swedish | 4 | 0.2% |
| Swiss | 2 | 0.1% |
| Thai | 14 | 0.6% |
| Ukrainian | 4 | 0.2% |
| Venezuelan | 2 | 0.1% |
| Welsh | 114 | 4.9% | View All 37 Rows |
Immigrants in Sullivan s Island
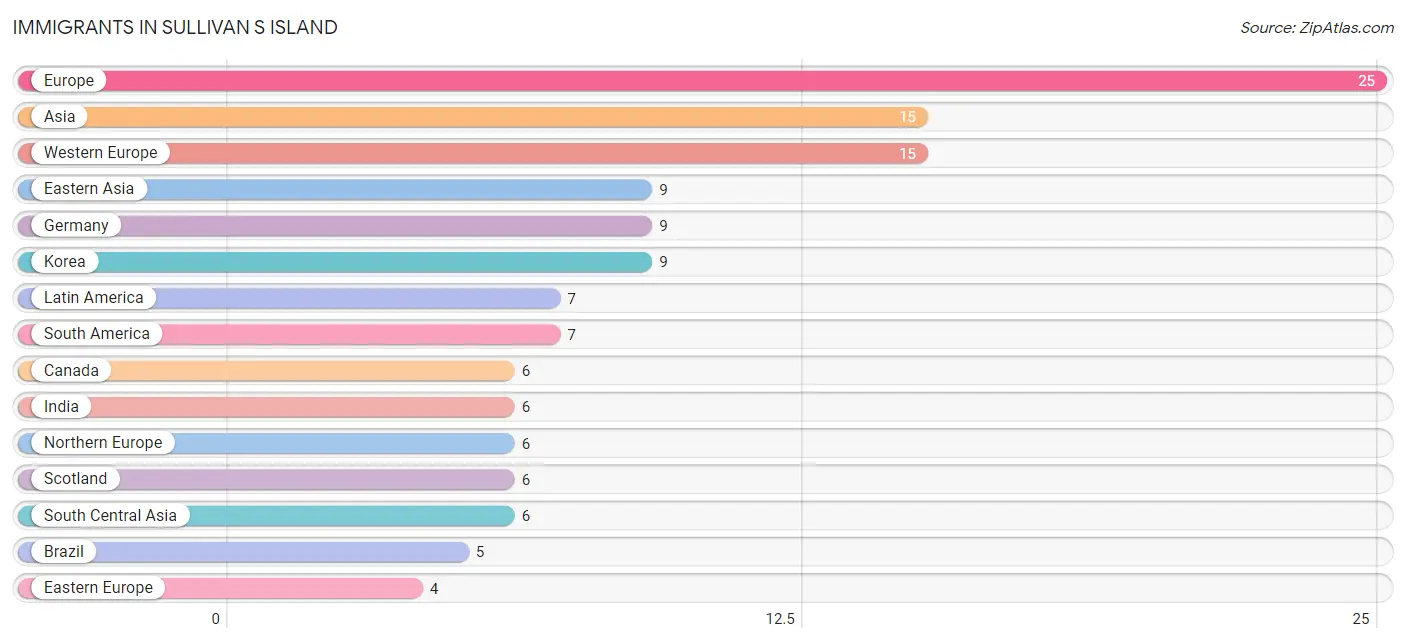
The most numerous immigrant groups reported in Sullivan s Island came from Europe (25 | 1.1%), Asia (15 | 0.6%), Western Europe (15 | 0.6%), Eastern Asia (9 | 0.4%), and Germany (9 | 0.4%), together accounting for 3.2% of all Sullivan s Island residents.
| Immigration Origin | # Population | % Population |
| Asia | 15 | 0.6% |
| Belgium | 3 | 0.1% |
| Brazil | 5 | 0.2% |
| Canada | 6 | 0.3% |
| Eastern Asia | 9 | 0.4% |
| Eastern Europe | 4 | 0.2% |
| Europe | 25 | 1.1% |
| France | 3 | 0.1% |
| Germany | 9 | 0.4% |
| India | 6 | 0.3% |
| Korea | 9 | 0.4% |
| Latin America | 7 | 0.3% |
| Northern Europe | 6 | 0.3% |
| Scotland | 6 | 0.3% |
| South America | 7 | 0.3% |
| South Central Asia | 6 | 0.3% |
| Ukraine | 4 | 0.2% |
| Venezuela | 2 | 0.1% |
| Western Europe | 15 | 0.6% | View All 19 Rows |
Sex and Age in Sullivan s Island
Sex and Age in Sullivan s Island
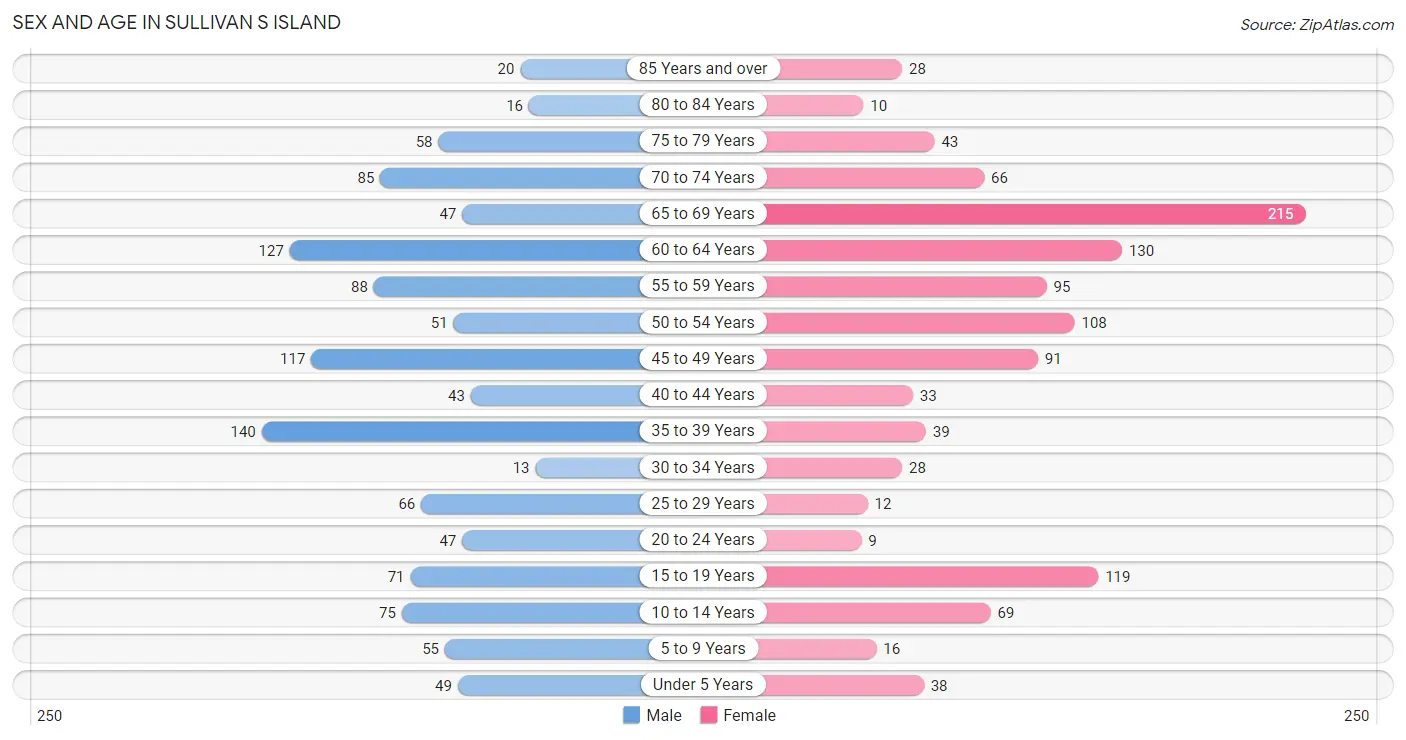
The most populous age groups in Sullivan s Island are 35 to 39 Years (140 | 12.0%) for men and 65 to 69 Years (215 | 18.7%) for women.
| Age Bracket | Male | Female |
| Under 5 Years | 49 (4.2%) | 38 (3.3%) |
| 5 to 9 Years | 55 (4.7%) | 16 (1.4%) |
| 10 to 14 Years | 75 (6.4%) | 69 (6.0%) |
| 15 to 19 Years | 71 (6.1%) | 119 (10.4%) |
| 20 to 24 Years | 47 (4.0%) | 9 (0.8%) |
| 25 to 29 Years | 66 (5.7%) | 12 (1.0%) |
| 30 to 34 Years | 13 (1.1%) | 28 (2.4%) |
| 35 to 39 Years | 140 (12.0%) | 39 (3.4%) |
| 40 to 44 Years | 43 (3.7%) | 33 (2.9%) |
| 45 to 49 Years | 117 (10.0%) | 91 (7.9%) |
| 50 to 54 Years | 51 (4.4%) | 108 (9.4%) |
| 55 to 59 Years | 88 (7.5%) | 95 (8.3%) |
| 60 to 64 Years | 127 (10.9%) | 130 (11.3%) |
| 65 to 69 Years | 47 (4.0%) | 215 (18.7%) |
| 70 to 74 Years | 85 (7.3%) | 66 (5.7%) |
| 75 to 79 Years | 58 (5.0%) | 43 (3.7%) |
| 80 to 84 Years | 16 (1.4%) | 10 (0.9%) |
| 85 Years and over | 20 (1.7%) | 28 (2.4%) |
| Total | 1,168 (100.0%) | 1,149 (100.0%) |
Families and Households in Sullivan s Island
Median Family Size in Sullivan s Island
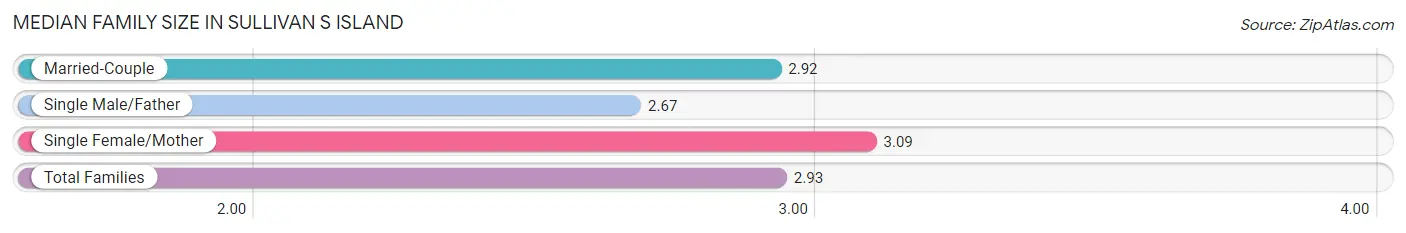
The median family size in Sullivan s Island is 2.93 persons per family, with single female/mother families (34 | 5.5%) accounting for the largest median family size of 3.09 persons per family. On the other hand, single male/father families (9 | 1.5%) represent the smallest median family size with 2.67 persons per family.
| Family Type | # Families | Family Size |
| Married-Couple | 578 (93.1%) | 2.92 |
| Single Male/Father | 9 (1.5%) | 2.67 |
| Single Female/Mother | 34 (5.5%) | 3.09 |
| Total Families | 621 (100.0%) | 2.93 |
Median Household Size in Sullivan s Island
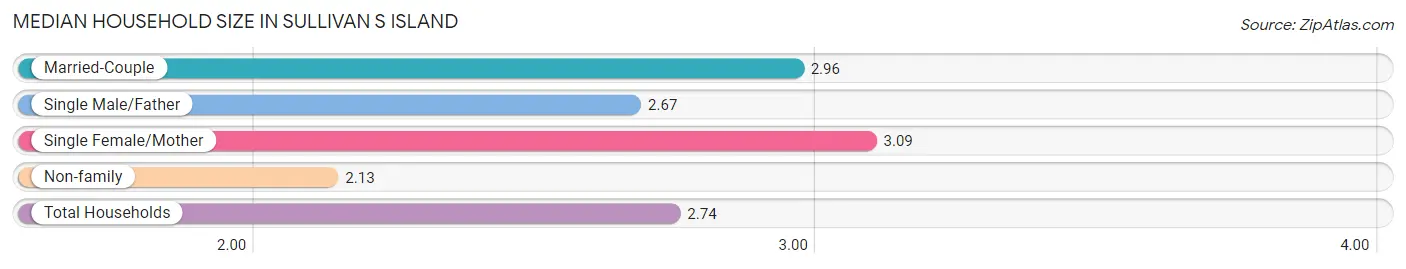
The median household size in Sullivan s Island is 2.74 persons per household, with single female/mother households (34 | 4.0%) accounting for the largest median household size of 3.09 persons per household. non-family households (225 | 26.6%) represent the smallest median household size with 2.13 persons per household.
| Household Type | # Households | Household Size |
| Married-Couple | 578 (68.3%) | 2.96 |
| Single Male/Father | 9 (1.1%) | 2.67 |
| Single Female/Mother | 34 (4.0%) | 3.09 |
| Non-family | 225 (26.6%) | 2.13 |
| Total Households | 846 (100.0%) | 2.74 |
Household Size by Marriage Status in Sullivan s Island
Out of a total of 846 households in Sullivan s Island, 621 (73.4%) are family households, while 225 (26.6%) are nonfamily households. The most numerous type of family households are 2-person households, comprising 322, and the most common type of nonfamily households are 1-person households, comprising 127.
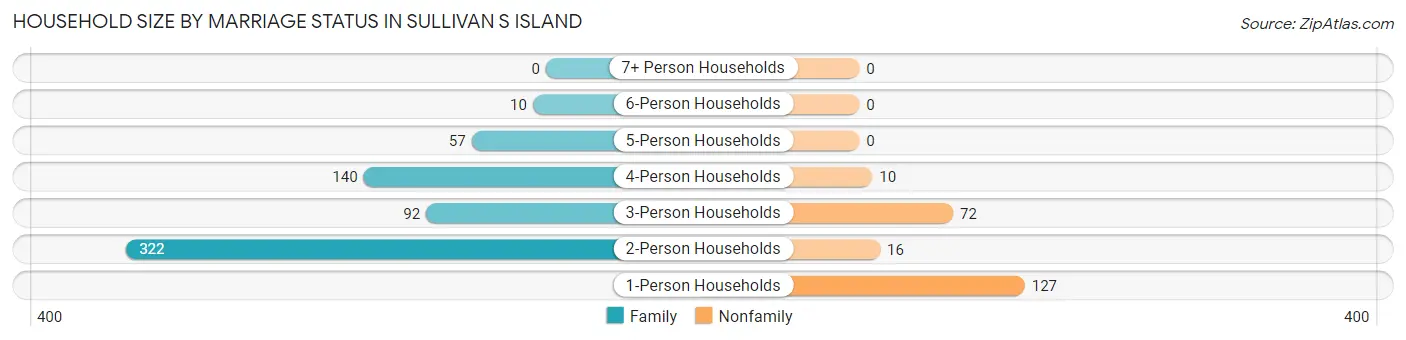
| Household Size | Family Households | Nonfamily Households |
| 1-Person Households | - | 127 (15.0%) |
| 2-Person Households | 322 (38.1%) | 16 (1.9%) |
| 3-Person Households | 92 (10.9%) | 72 (8.5%) |
| 4-Person Households | 140 (16.6%) | 10 (1.2%) |
| 5-Person Households | 57 (6.7%) | 0 (0.0%) |
| 6-Person Households | 10 (1.2%) | 0 (0.0%) |
| 7+ Person Households | 0 (0.0%) | 0 (0.0%) |
| Total | 621 (73.4%) | 225 (26.6%) |
Female Fertility in Sullivan s Island
Fertility by Age in Sullivan s Island
Average fertility rate in Sullivan s Island is 39.0 births per 1,000 women. Women in the age bracket of 20 to 34 years have the highest fertility rate with 265.0 births per 1,000 women. Women in the age bracket of 20 to 34 years acount for 100.0% of all women with births.
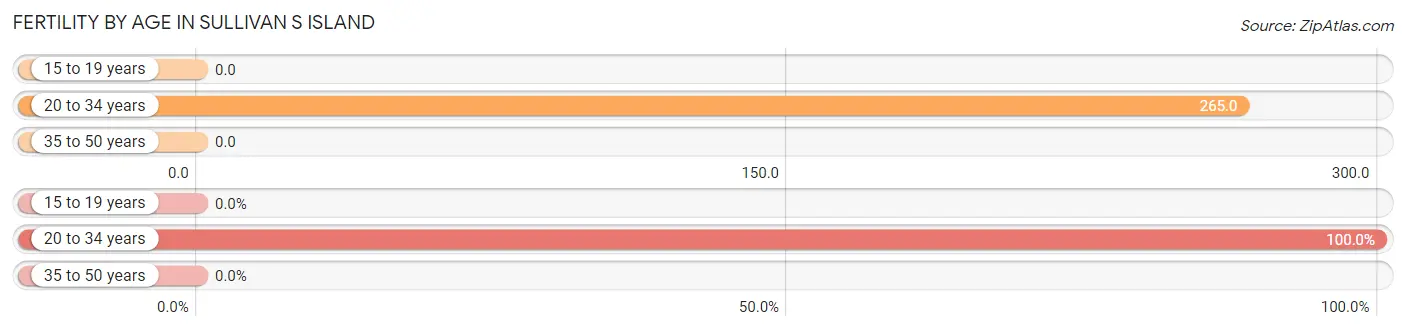
| Age Bracket | Women with Births | Births / 1,000 Women |
| 15 to 19 years | 0 (0.0%) | 0.0 |
| 20 to 34 years | 13 (100.0%) | 265.0 |
| 35 to 50 years | 0 (0.0%) | 0.0 |
| Total | 13 (100.0%) | 39.0 |
Fertility by Age by Marriage Status in Sullivan s Island
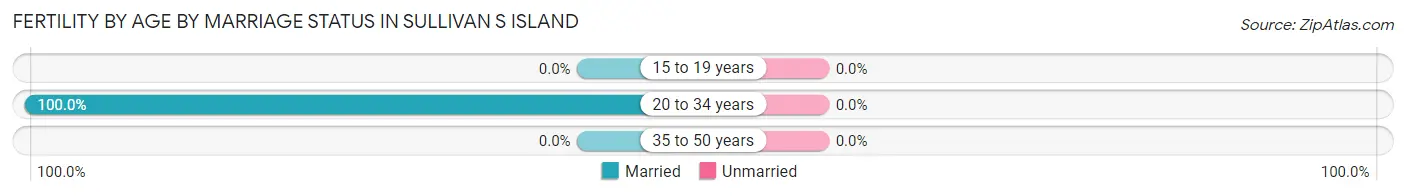
| Age Bracket | Married | Unmarried |
| 15 to 19 years | 0 (0.0%) | 0 (0.0%) |
| 20 to 34 years | 13 (100.0%) | 0 (0.0%) |
| 35 to 50 years | 0 (0.0%) | 0 (0.0%) |
| Total | 13 (100.0%) | 0 (0.0%) |
Fertility by Education in Sullivan s Island
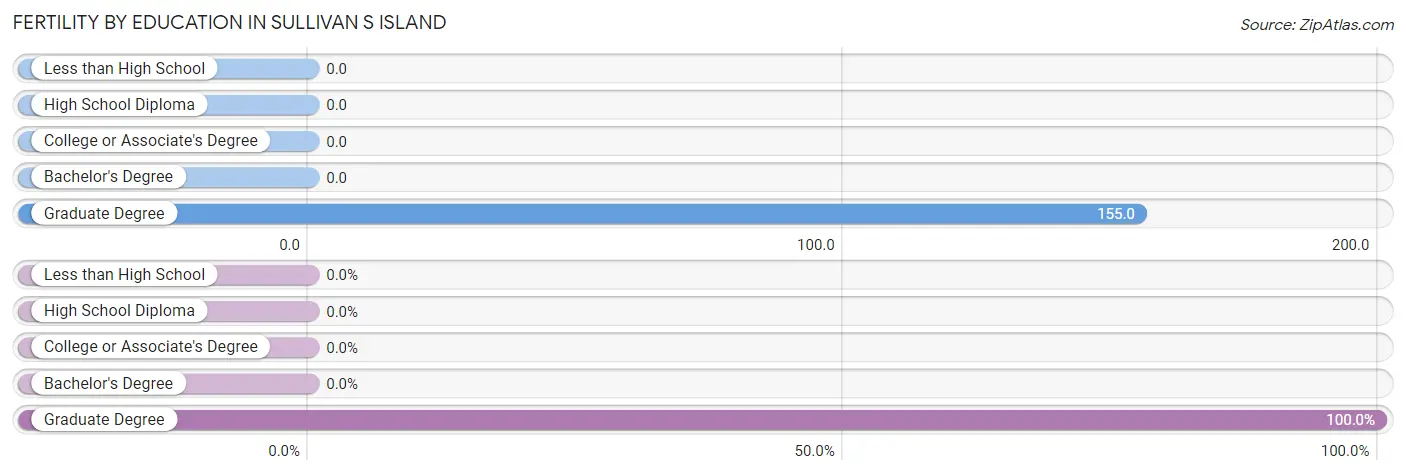
| Educational Attainment | Women with Births | Births / 1,000 Women |
| Less than High School | 0 (0.0%) | 0.0 |
| High School Diploma | 0 (0.0%) | 0.0 |
| College or Associate's Degree | 0 (0.0%) | 0.0 |
| Bachelor's Degree | 0 (0.0%) | 0.0 |
| Graduate Degree | 13 (100.0%) | 155.0 |
| Total | 13 (100.0%) | 39.0 |
Fertility by Education by Marriage Status in Sullivan s Island
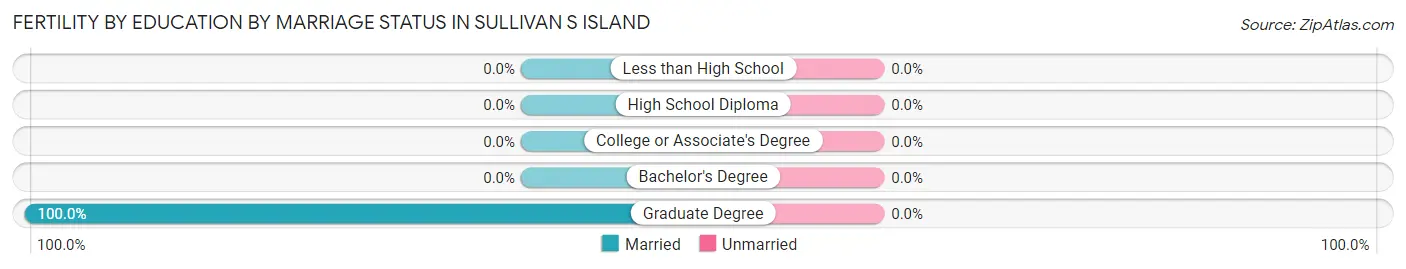
| Educational Attainment | Married | Unmarried |
| Less than High School | 0 (0.0%) | 0 (0.0%) |
| High School Diploma | 0 (0.0%) | 0 (0.0%) |
| College or Associate's Degree | 0 (0.0%) | 0 (0.0%) |
| Bachelor's Degree | 0 (0.0%) | 0 (0.0%) |
| Graduate Degree | 13 (100.0%) | 0 (0.0%) |
| Total | 13 (100.0%) | 0 (0.0%) |
Employment Characteristics in Sullivan s Island
Employment by Class of Employer in Sullivan s Island
Among the 1,151 employed individuals in Sullivan s Island, private company employees (634 | 55.1%), federal government employees (111 | 9.6%), and self-employed (incorporated) (108 | 9.4%) make up the most common classes of employment.
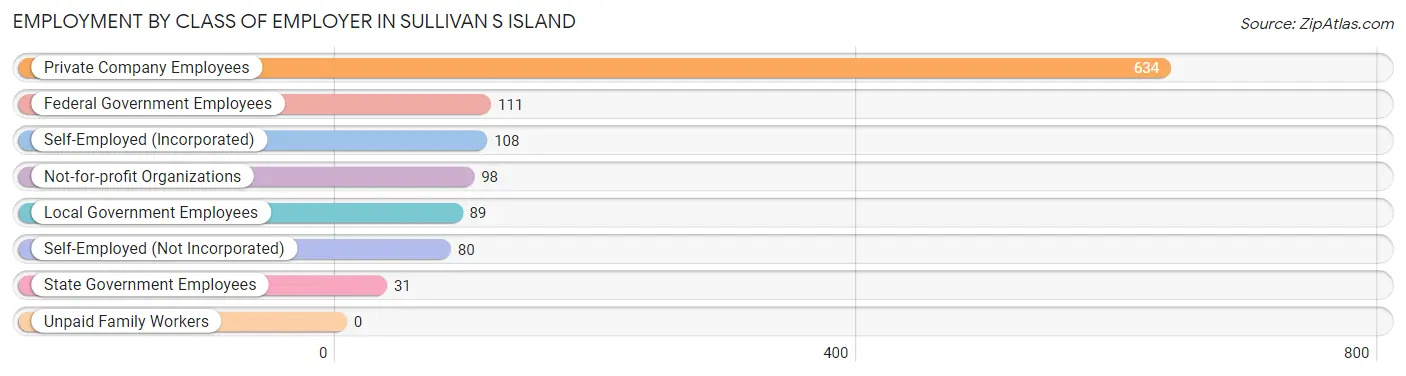
| Employer Class | # Employees | % Employees |
| Private Company Employees | 634 | 55.1% |
| Self-Employed (Incorporated) | 108 | 9.4% |
| Self-Employed (Not Incorporated) | 80 | 7.0% |
| Not-for-profit Organizations | 98 | 8.5% |
| Local Government Employees | 89 | 7.7% |
| State Government Employees | 31 | 2.7% |
| Federal Government Employees | 111 | 9.6% |
| Unpaid Family Workers | 0 | 0.0% |
| Total | 1,151 | 100.0% |
Employment Status by Age in Sullivan s Island
According to the labor force statistics for Sullivan s Island, out of the total population over 16 years of age (2,001), 60.6% or 1,213 individuals are in the labor force, with 1.6% or 19 of them unemployed. The age group with the highest labor force participation rate is 30 to 34 years, with 100.0% or 41 individuals in the labor force. Within the labor force, the 20 to 24 years age range has the highest percentage of unemployed individuals, with 36.8% or 14 of them being unemployed.
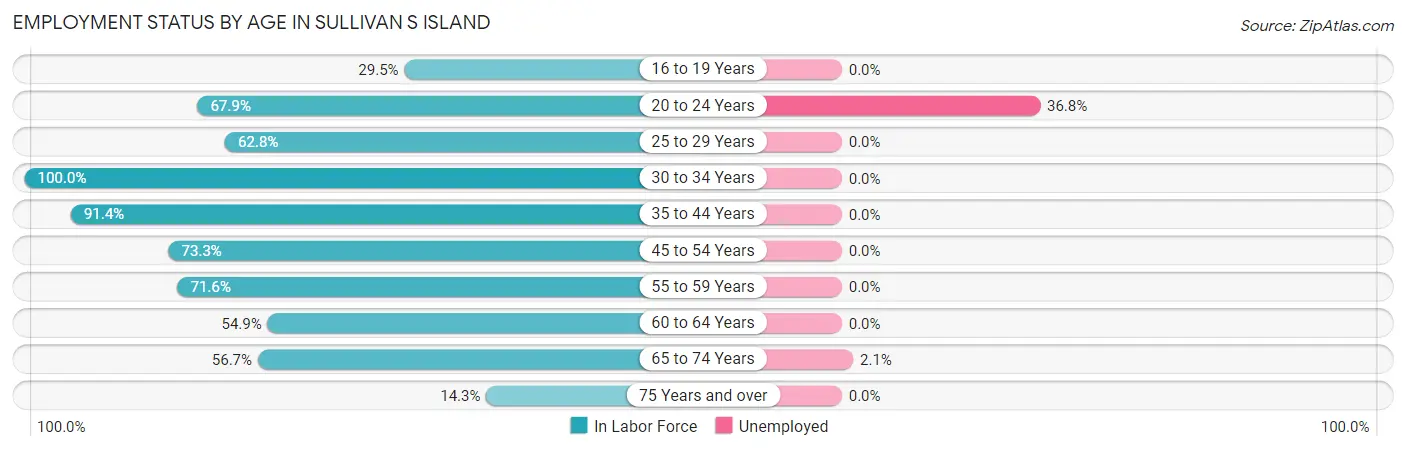
| Age Bracket | In Labor Force | Unemployed |
| 16 to 19 Years | 52 (29.5%) | 0 (0.0%) |
| 20 to 24 Years | 38 (67.9%) | 14 (36.8%) |
| 25 to 29 Years | 49 (62.8%) | 0 (0.0%) |
| 30 to 34 Years | 41 (100.0%) | 0 (0.0%) |
| 35 to 44 Years | 233 (91.4%) | 0 (0.0%) |
| 45 to 54 Years | 269 (73.3%) | 0 (0.0%) |
| 55 to 59 Years | 131 (71.6%) | 0 (0.0%) |
| 60 to 64 Years | 141 (54.9%) | 0 (0.0%) |
| 65 to 74 Years | 234 (56.7%) | 5 (2.1%) |
| 75 Years and over | 25 (14.3%) | 0 (0.0%) |
| Total | 1,213 (60.6%) | 19 (1.6%) |
Employment Status by Educational Attainment in Sullivan s Island
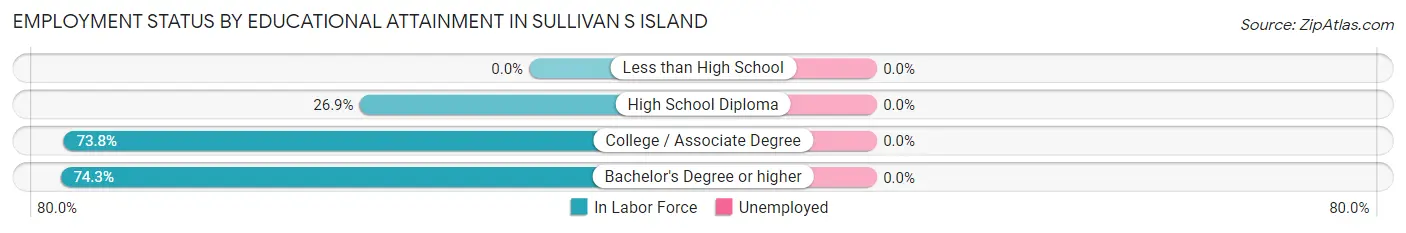
| Educational Attainment | In Labor Force | Unemployed |
| Less than High School | 0 (0.0%) | 0 (0.0%) |
| High School Diploma | 7 (26.9%) | 0 (0.0%) |
| College / Associate Degree | 104 (73.8%) | 0 (0.0%) |
| Bachelor's Degree or higher | 753 (74.3%) | 0 (0.0%) |
| Total | 864 (73.2%) | 0 (0.0%) |
Employment Occupations by Sex in Sullivan s Island
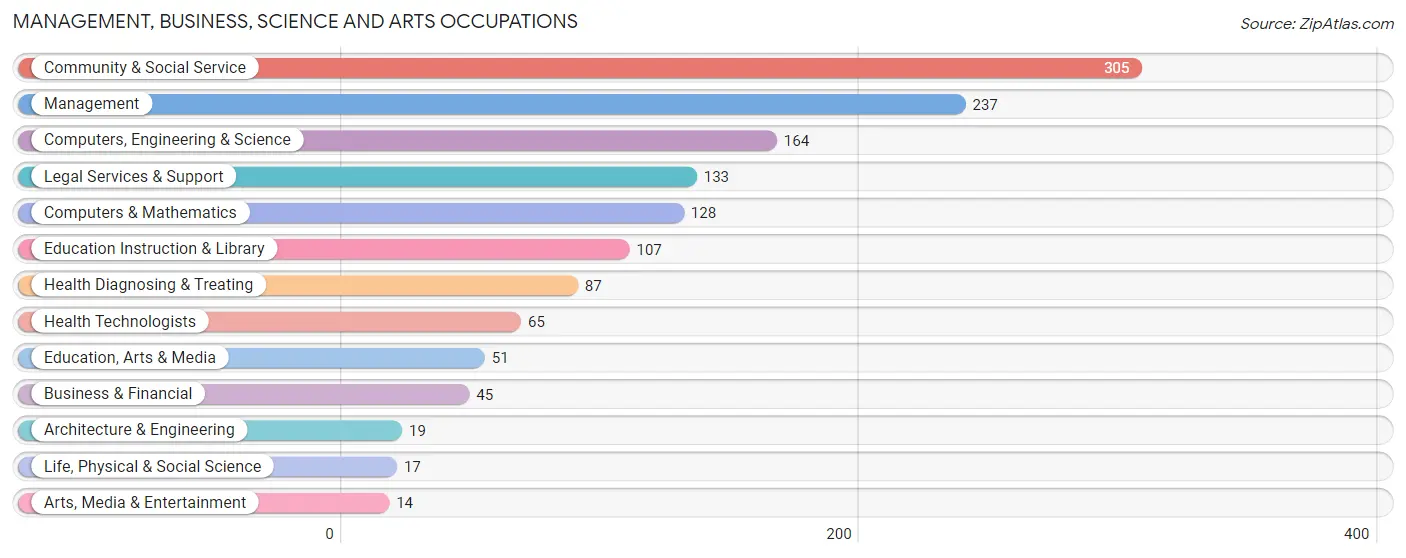
Management, Business, Science and Arts Occupations
The most common Management, Business, Science and Arts occupations in Sullivan s Island are Community & Social Service (305 | 25.5%), Management (237 | 19.9%), Computers, Engineering & Science (164 | 13.7%), Legal Services & Support (133 | 11.1%), and Computers & Mathematics (128 | 10.7%).
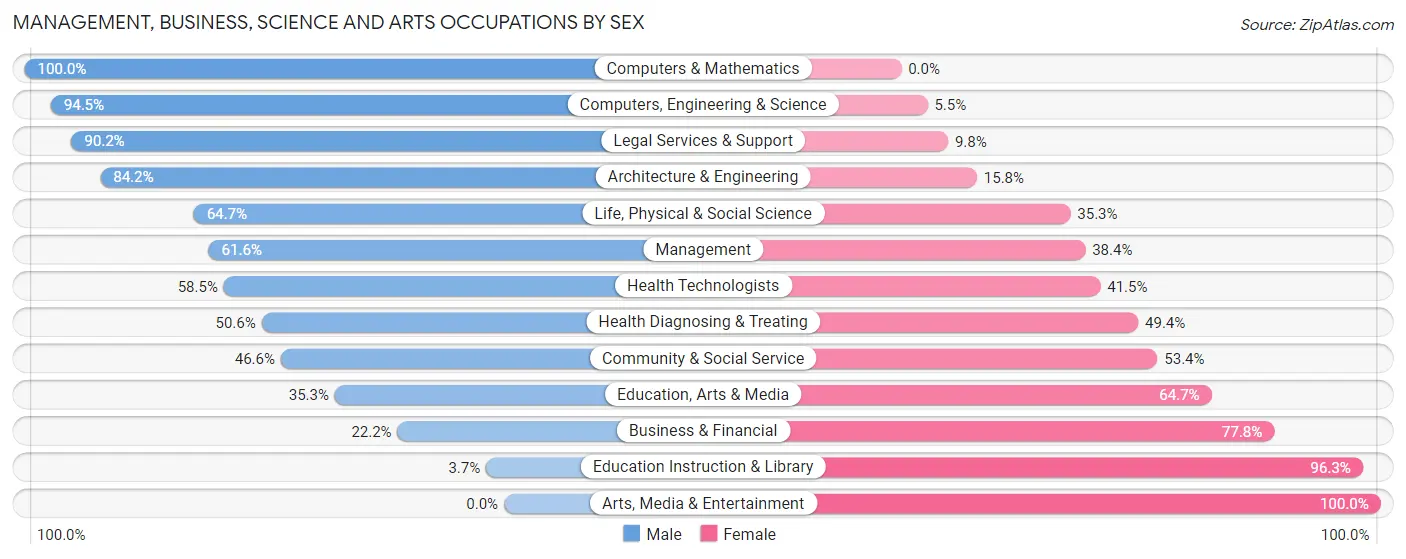
Management, Business, Science and Arts Occupations by Sex
Within the Management, Business, Science and Arts occupations in Sullivan s Island, the most male-oriented occupations are Computers & Mathematics (100.0%), Computers, Engineering & Science (94.5%), and Legal Services & Support (90.2%), while the most female-oriented occupations are Arts, Media & Entertainment (100.0%), Education Instruction & Library (96.3%), and Business & Financial (77.8%).
| Occupation | Male | Female |
| Management | 146 (61.6%) | 91 (38.4%) |
| Business & Financial | 10 (22.2%) | 35 (77.8%) |
| Computers, Engineering & Science | 155 (94.5%) | 9 (5.5%) |
| Computers & Mathematics | 128 (100.0%) | 0 (0.0%) |
| Architecture & Engineering | 16 (84.2%) | 3 (15.8%) |
| Life, Physical & Social Science | 11 (64.7%) | 6 (35.3%) |
| Community & Social Service | 142 (46.6%) | 163 (53.4%) |
| Education, Arts & Media | 18 (35.3%) | 33 (64.7%) |
| Legal Services & Support | 120 (90.2%) | 13 (9.8%) |
| Education Instruction & Library | 4 (3.7%) | 103 (96.3%) |
| Arts, Media & Entertainment | 0 (0.0%) | 14 (100.0%) |
| Health Diagnosing & Treating | 44 (50.6%) | 43 (49.4%) |
| Health Technologists | 38 (58.5%) | 27 (41.5%) |
| Total (Category) | 497 (59.3%) | 341 (40.7%) |
| Total (Overall) | 680 (57.0%) | 514 (43.0%) |
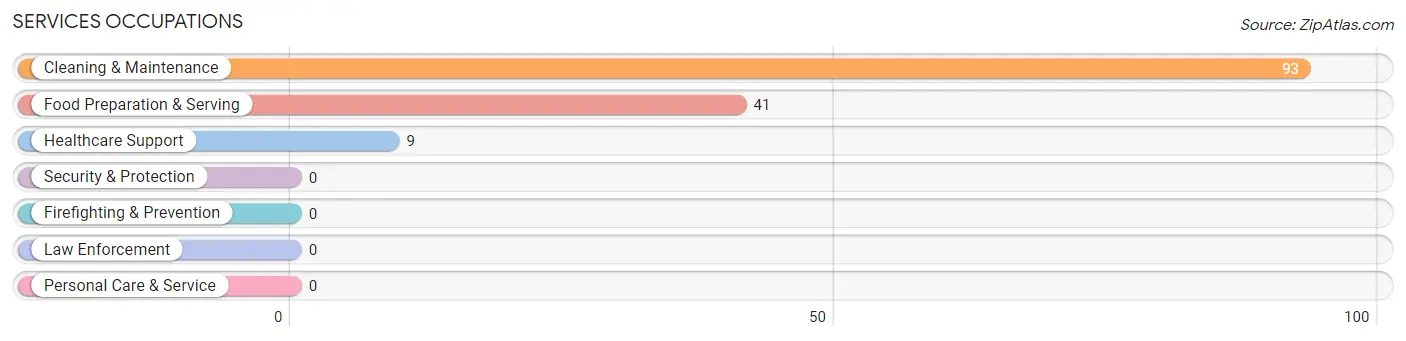
Services Occupations
The most common Services occupations in Sullivan s Island are Cleaning & Maintenance (93 | 7.8%), Food Preparation & Serving (41 | 3.4%), and Healthcare Support (9 | 0.7%).
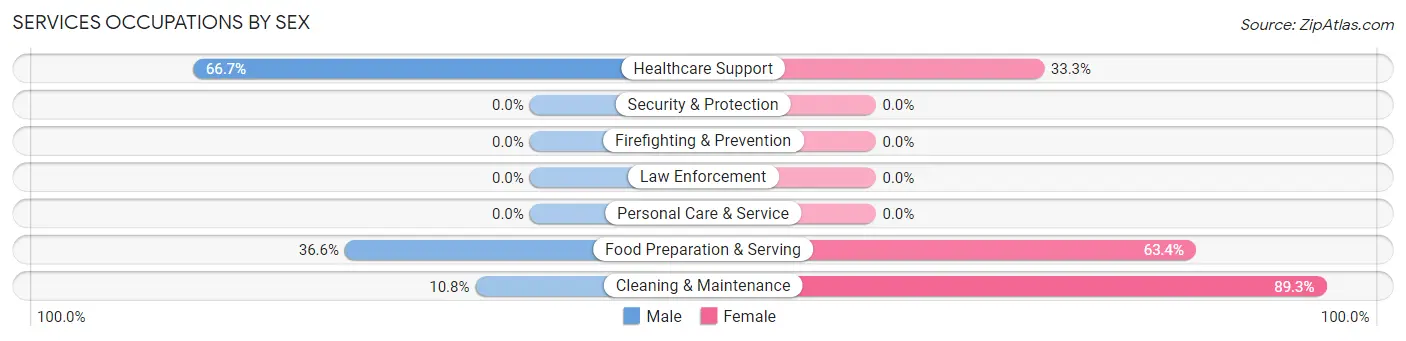
Services Occupations by Sex
Within the Services occupations in Sullivan s Island, the most male-oriented occupations are Healthcare Support (66.7%), Food Preparation & Serving (36.6%), and Cleaning & Maintenance (10.7%), while the most female-oriented occupations are Cleaning & Maintenance (89.2%), Food Preparation & Serving (63.4%), and Healthcare Support (33.3%).
| Occupation | Male | Female |
| Healthcare Support | 6 (66.7%) | 3 (33.3%) |
| Security & Protection | 0 (0.0%) | 0 (0.0%) |
| Firefighting & Prevention | 0 (0.0%) | 0 (0.0%) |
| Law Enforcement | 0 (0.0%) | 0 (0.0%) |
| Food Preparation & Serving | 15 (36.6%) | 26 (63.4%) |
| Cleaning & Maintenance | 10 (10.7%) | 83 (89.2%) |
| Personal Care & Service | 0 (0.0%) | 0 (0.0%) |
| Total (Category) | 31 (21.7%) | 112 (78.3%) |
| Total (Overall) | 680 (57.0%) | 514 (43.0%) |
Sales and Office Occupations
The most common Sales and Office occupations in Sullivan s Island are Sales & Related (112 | 9.4%), and Office & Administration (66 | 5.5%).
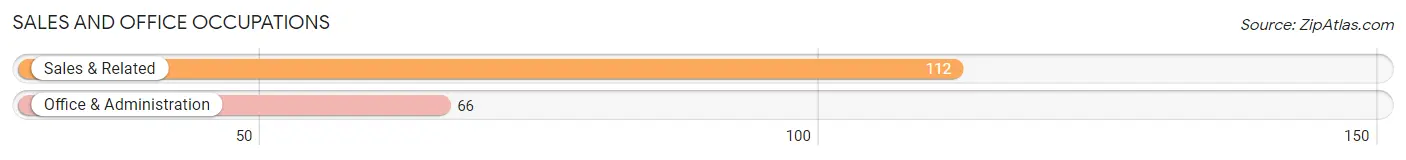
Sales and Office Occupations by Sex
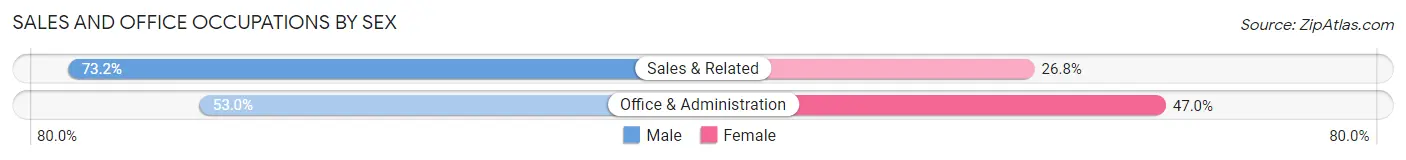
| Occupation | Male | Female |
| Sales & Related | 82 (73.2%) | 30 (26.8%) |
| Office & Administration | 35 (53.0%) | 31 (47.0%) |
| Total (Category) | 117 (65.7%) | 61 (34.3%) |
| Total (Overall) | 680 (57.0%) | 514 (43.0%) |
Natural Resources, Construction and Maintenance Occupations
The most common Natural Resources, Construction and Maintenance occupations in Sullivan s Island are , and Construction & Extraction (23 | 1.9%).
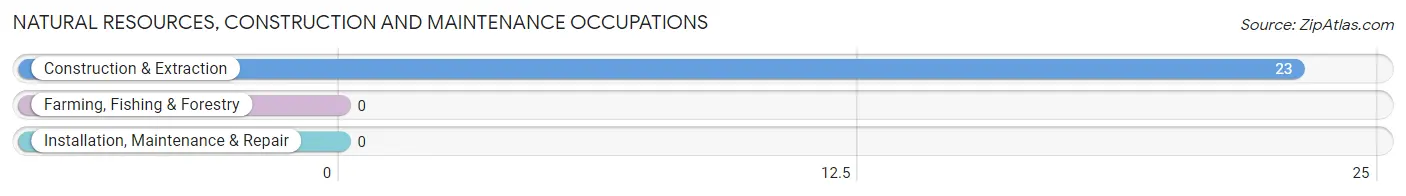
Natural Resources, Construction and Maintenance Occupations by Sex
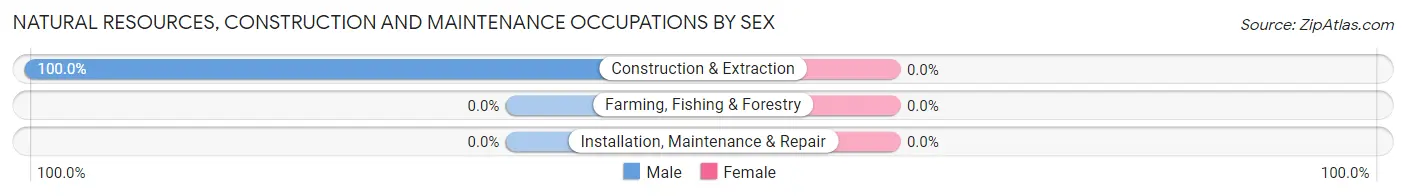
| Occupation | Male | Female |
| Farming, Fishing & Forestry | 0 (0.0%) | 0 (0.0%) |
| Construction & Extraction | 23 (100.0%) | 0 (0.0%) |
| Installation, Maintenance & Repair | 0 (0.0%) | 0 (0.0%) |
| Total (Category) | 23 (100.0%) | 0 (0.0%) |
| Total (Overall) | 680 (57.0%) | 514 (43.0%) |
Production, Transportation and Moving Occupations
The most common Production, Transportation and Moving occupations in Sullivan s Island are Material Moving (8 | 0.7%), and Transportation (4 | 0.3%).
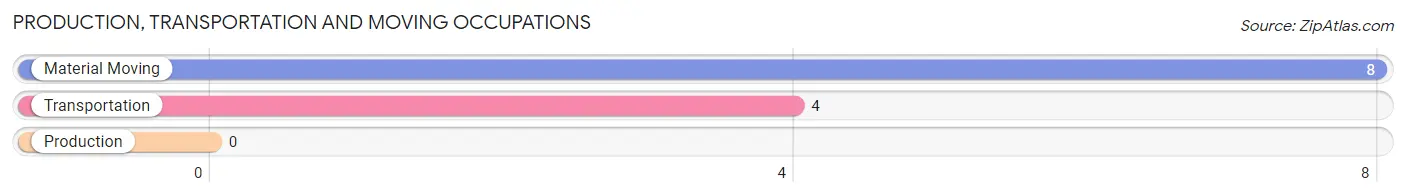
Production, Transportation and Moving Occupations by Sex
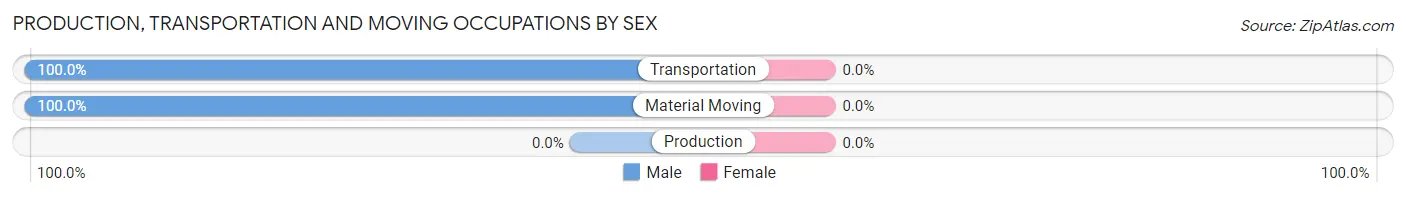
| Occupation | Male | Female |
| Production | 0 (0.0%) | 0 (0.0%) |
| Transportation | 4 (100.0%) | 0 (0.0%) |
| Material Moving | 8 (100.0%) | 0 (0.0%) |
| Total (Category) | 12 (100.0%) | 0 (0.0%) |
| Total (Overall) | 680 (57.0%) | 514 (43.0%) |
Employment Industries by Sex in Sullivan s Island
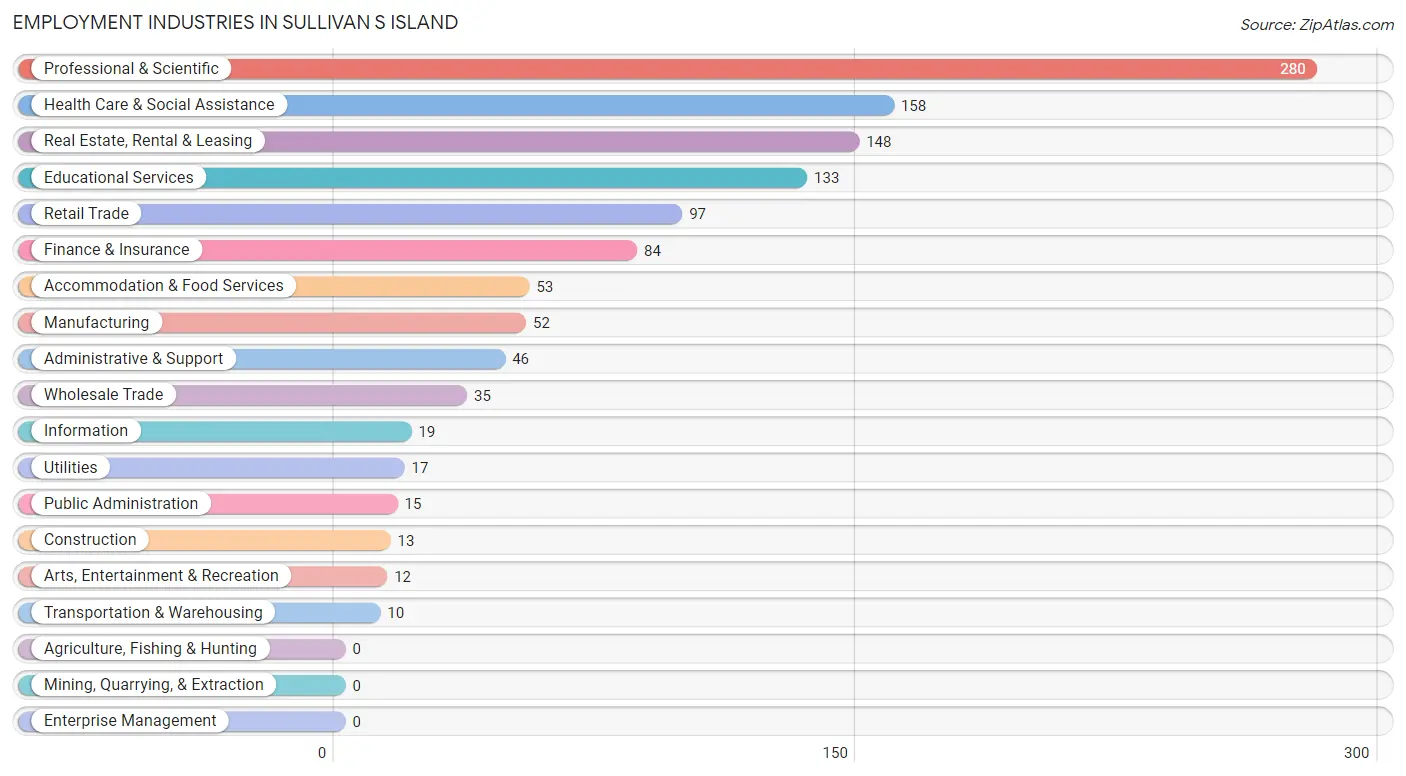
Employment Industries in Sullivan s Island
The major employment industries in Sullivan s Island include Professional & Scientific (280 | 23.4%), Health Care & Social Assistance (158 | 13.2%), Real Estate, Rental & Leasing (148 | 12.4%), Educational Services (133 | 11.1%), and Retail Trade (97 | 8.1%).
Employment Industries by Sex in Sullivan s Island
The Sullivan s Island industries that see more men than women are Construction (100.0%), Transportation & Warehousing (100.0%), and Utilities (100.0%), whereas the industries that tend to have a higher number of women are Educational Services (87.2%), Retail Trade (80.4%), and Public Administration (73.3%).
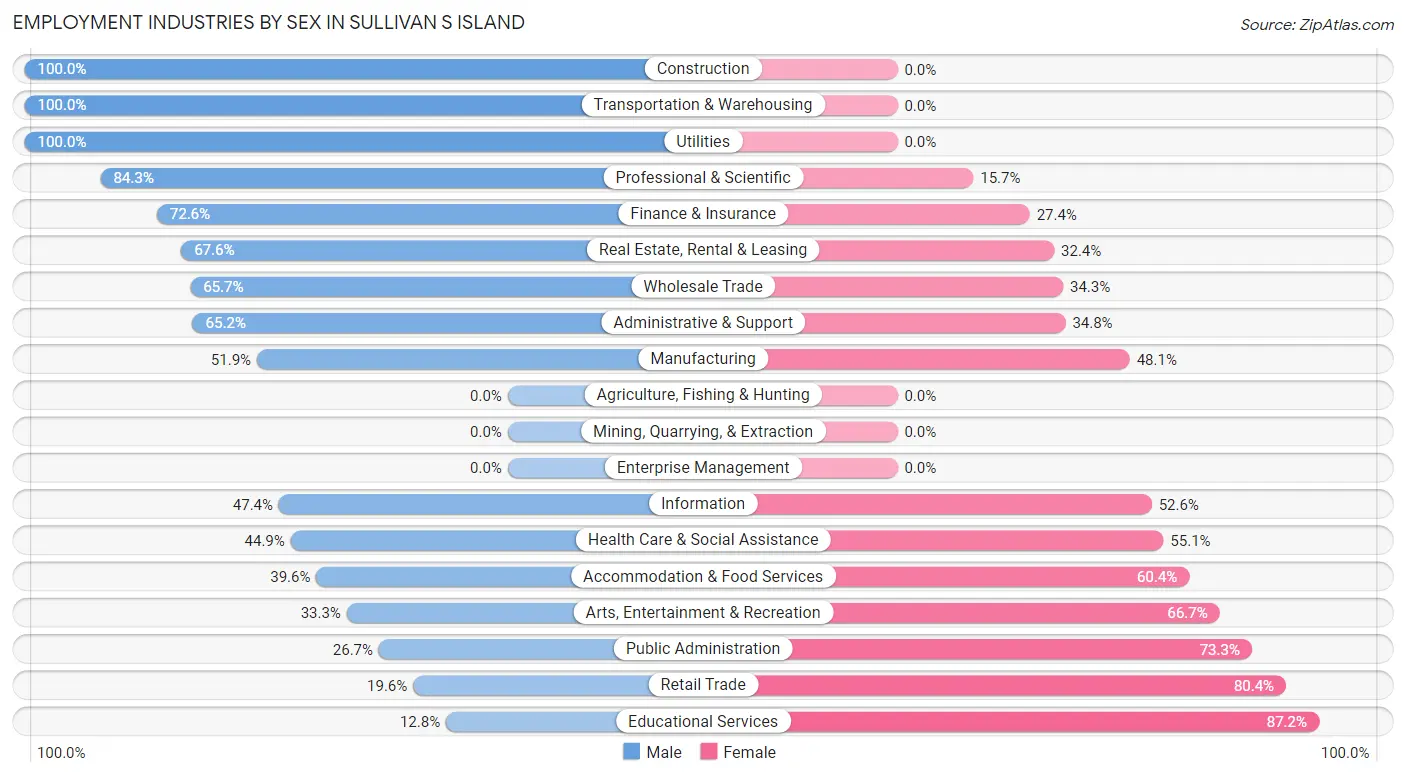
| Industry | Male | Female |
| Agriculture, Fishing & Hunting | 0 (0.0%) | 0 (0.0%) |
| Mining, Quarrying, & Extraction | 0 (0.0%) | 0 (0.0%) |
| Construction | 13 (100.0%) | 0 (0.0%) |
| Manufacturing | 27 (51.9%) | 25 (48.1%) |
| Wholesale Trade | 23 (65.7%) | 12 (34.3%) |
| Retail Trade | 19 (19.6%) | 78 (80.4%) |
| Transportation & Warehousing | 10 (100.0%) | 0 (0.0%) |
| Utilities | 17 (100.0%) | 0 (0.0%) |
| Information | 9 (47.4%) | 10 (52.6%) |
| Finance & Insurance | 61 (72.6%) | 23 (27.4%) |
| Real Estate, Rental & Leasing | 100 (67.6%) | 48 (32.4%) |
| Professional & Scientific | 236 (84.3%) | 44 (15.7%) |
| Enterprise Management | 0 (0.0%) | 0 (0.0%) |
| Administrative & Support | 30 (65.2%) | 16 (34.8%) |
| Educational Services | 17 (12.8%) | 116 (87.2%) |
| Health Care & Social Assistance | 71 (44.9%) | 87 (55.1%) |
| Arts, Entertainment & Recreation | 4 (33.3%) | 8 (66.7%) |
| Accommodation & Food Services | 21 (39.6%) | 32 (60.4%) |
| Public Administration | 4 (26.7%) | 11 (73.3%) |
| Total | 680 (57.0%) | 514 (43.0%) |
Education in Sullivan s Island
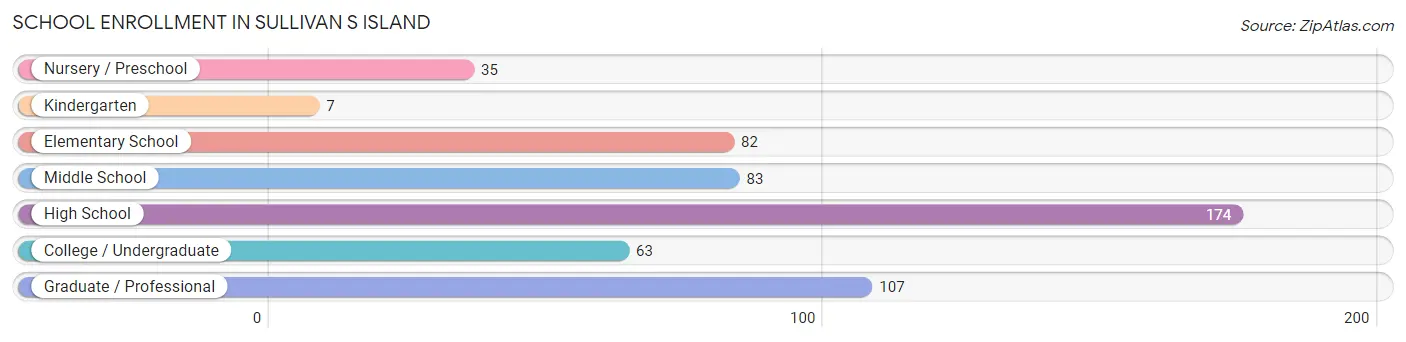
School Enrollment in Sullivan s Island
The most common levels of schooling among the 551 students in Sullivan s Island are high school (174 | 31.6%), graduate / professional (107 | 19.4%), and middle school (83 | 15.1%).
| School Level | # Students | % Students |
| Nursery / Preschool | 35 | 6.4% |
| Kindergarten | 7 | 1.3% |
| Elementary School | 82 | 14.9% |
| Middle School | 83 | 15.1% |
| High School | 174 | 31.6% |
| College / Undergraduate | 63 | 11.4% |
| Graduate / Professional | 107 | 19.4% |
| Total | 551 | 100.0% |
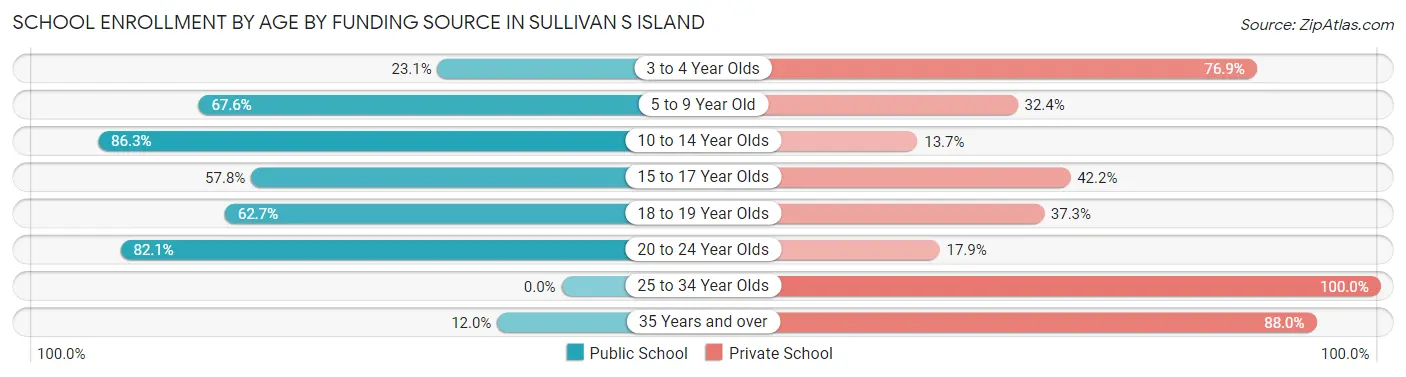
School Enrollment by Age by Funding Source in Sullivan s Island
Out of a total of 551 students who are enrolled in schools in Sullivan s Island, 250 (45.4%) attend a private institution, while the remaining 301 (54.6%) are enrolled in public schools. The age group of 25 to 34 year olds has the highest likelihood of being enrolled in private schools, with 4 (100.0% in the age bracket) enrolled. Conversely, the age group of 10 to 14 year olds has the lowest likelihood of being enrolled in a private school, with 107 (86.3% in the age bracket) attending a public institution.
| Age Bracket | Public School | Private School |
| 3 to 4 Year Olds | 9 (23.1%) | 30 (76.9%) |
| 5 to 9 Year Old | 48 (67.6%) | 23 (32.4%) |
| 10 to 14 Year Olds | 107 (86.3%) | 17 (13.7%) |
| 15 to 17 Year Olds | 63 (57.8%) | 46 (42.2%) |
| 18 to 19 Year Olds | 37 (62.7%) | 22 (37.3%) |
| 20 to 24 Year Olds | 23 (82.1%) | 5 (17.9%) |
| 25 to 34 Year Olds | 0 (0.0%) | 4 (100.0%) |
| 35 Years and over | 14 (12.0%) | 103 (88.0%) |
| Total | 301 (54.6%) | 250 (45.4%) |
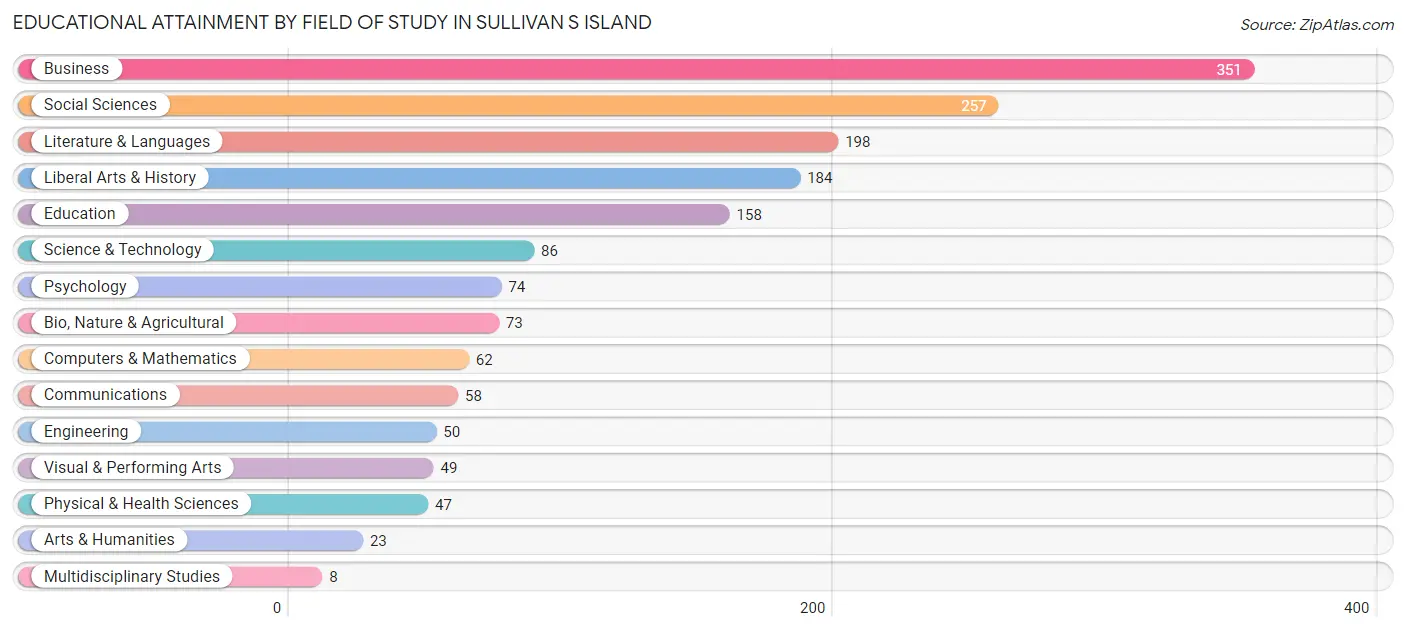
Educational Attainment by Field of Study in Sullivan s Island
Business (351 | 20.9%), social sciences (257 | 15.3%), literature & languages (198 | 11.8%), liberal arts & history (184 | 11.0%), and education (158 | 9.4%) are the most common fields of study among 1,678 individuals in Sullivan s Island who have obtained a bachelor's degree or higher.
| Field of Study | # Graduates | % Graduates |
| Computers & Mathematics | 62 | 3.7% |
| Bio, Nature & Agricultural | 73 | 4.3% |
| Physical & Health Sciences | 47 | 2.8% |
| Psychology | 74 | 4.4% |
| Social Sciences | 257 | 15.3% |
| Engineering | 50 | 3.0% |
| Multidisciplinary Studies | 8 | 0.5% |
| Science & Technology | 86 | 5.1% |
| Business | 351 | 20.9% |
| Education | 158 | 9.4% |
| Literature & Languages | 198 | 11.8% |
| Liberal Arts & History | 184 | 11.0% |
| Visual & Performing Arts | 49 | 2.9% |
| Communications | 58 | 3.5% |
| Arts & Humanities | 23 | 1.4% |
| Total | 1,678 | 100.0% |
Transportation & Commute in Sullivan s Island
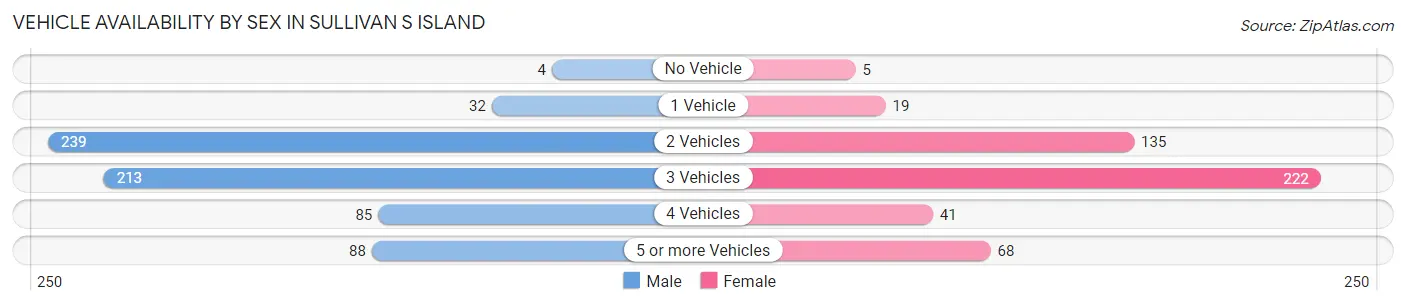
Vehicle Availability by Sex in Sullivan s Island
The most prevalent vehicle ownership categories in Sullivan s Island are males with 2 vehicles (239, accounting for 36.2%) and females with 2 vehicles (135, making up 48.8%).
| Vehicles Available | Male | Female |
| No Vehicle | 4 (0.6%) | 5 (1.0%) |
| 1 Vehicle | 32 (4.8%) | 19 (3.9%) |
| 2 Vehicles | 239 (36.2%) | 135 (27.6%) |
| 3 Vehicles | 213 (32.2%) | 222 (45.3%) |
| 4 Vehicles | 85 (12.9%) | 41 (8.4%) |
| 5 or more Vehicles | 88 (13.3%) | 68 (13.9%) |
| Total | 661 (100.0%) | 490 (100.0%) |
Commute Time in Sullivan s Island
The most frequently occuring commute durations in Sullivan s Island are 20 to 24 minutes (268 commuters, 25.9%), 30 to 34 minutes (208 commuters, 20.1%), and 5 to 9 minutes (196 commuters, 19.0%).
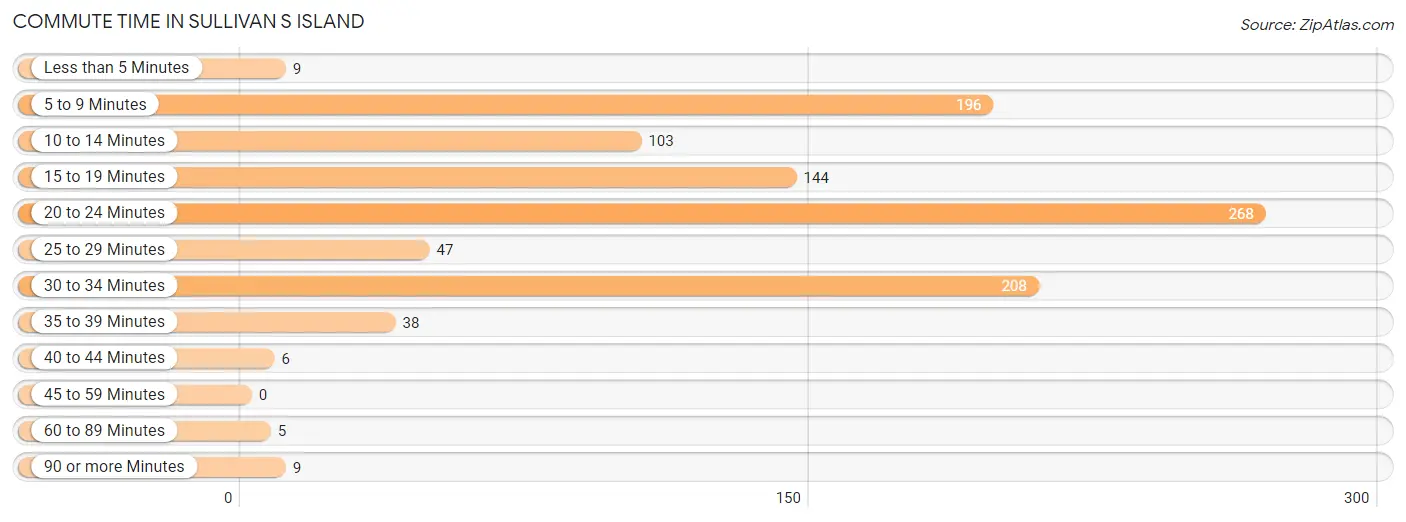
| Commute Time | # Commuters | % Commuters |
| Less than 5 Minutes | 9 | 0.9% |
| 5 to 9 Minutes | 196 | 19.0% |
| 10 to 14 Minutes | 103 | 10.0% |
| 15 to 19 Minutes | 144 | 13.9% |
| 20 to 24 Minutes | 268 | 25.9% |
| 25 to 29 Minutes | 47 | 4.5% |
| 30 to 34 Minutes | 208 | 20.1% |
| 35 to 39 Minutes | 38 | 3.7% |
| 40 to 44 Minutes | 6 | 0.6% |
| 45 to 59 Minutes | 0 | 0.0% |
| 60 to 89 Minutes | 5 | 0.5% |
| 90 or more Minutes | 9 | 0.9% |
Commute Time by Sex in Sullivan s Island
The most common commute times in Sullivan s Island are 20 to 24 minutes (222 commuters, 38.0%) for males and 30 to 34 minutes (158 commuters, 35.2%) for females.
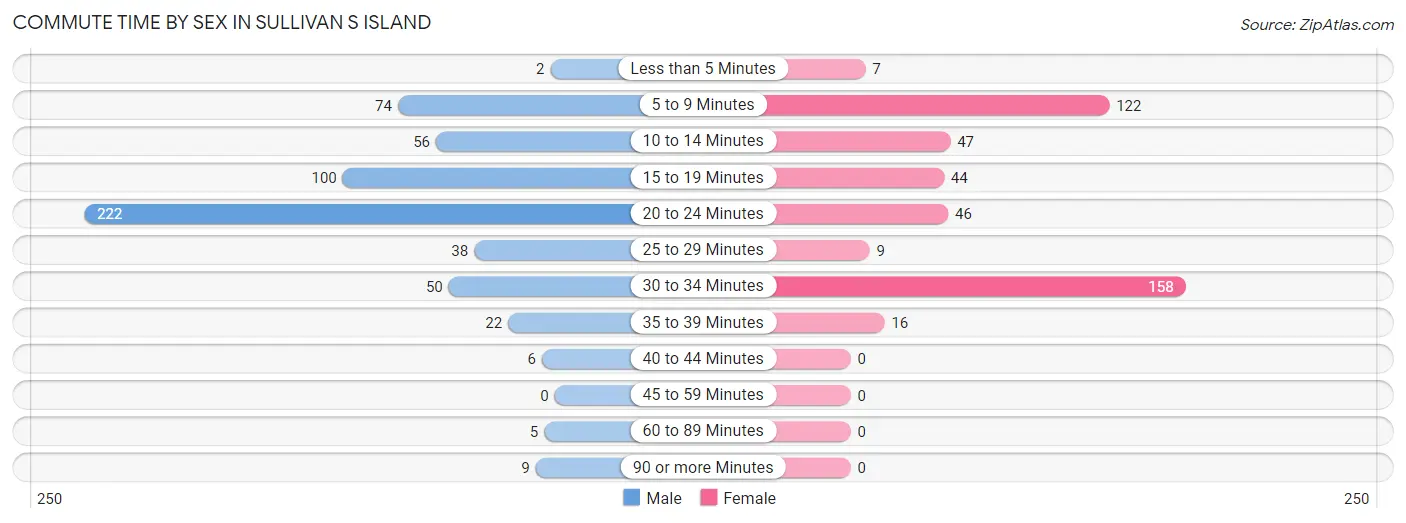
| Commute Time | Male | Female |
| Less than 5 Minutes | 2 (0.3%) | 7 (1.6%) |
| 5 to 9 Minutes | 74 (12.7%) | 122 (27.2%) |
| 10 to 14 Minutes | 56 (9.6%) | 47 (10.5%) |
| 15 to 19 Minutes | 100 (17.1%) | 44 (9.8%) |
| 20 to 24 Minutes | 222 (38.0%) | 46 (10.2%) |
| 25 to 29 Minutes | 38 (6.5%) | 9 (2.0%) |
| 30 to 34 Minutes | 50 (8.6%) | 158 (35.2%) |
| 35 to 39 Minutes | 22 (3.8%) | 16 (3.6%) |
| 40 to 44 Minutes | 6 (1.0%) | 0 (0.0%) |
| 45 to 59 Minutes | 0 (0.0%) | 0 (0.0%) |
| 60 to 89 Minutes | 5 (0.9%) | 0 (0.0%) |
| 90 or more Minutes | 9 (1.5%) | 0 (0.0%) |
Time of Departure to Work by Sex in Sullivan s Island
The most frequent times of departure to work in Sullivan s Island are 6:00 AM to 6:29 AM (148, 25.3%) for males and 8:00 AM to 8:29 AM (187, 41.6%) for females.
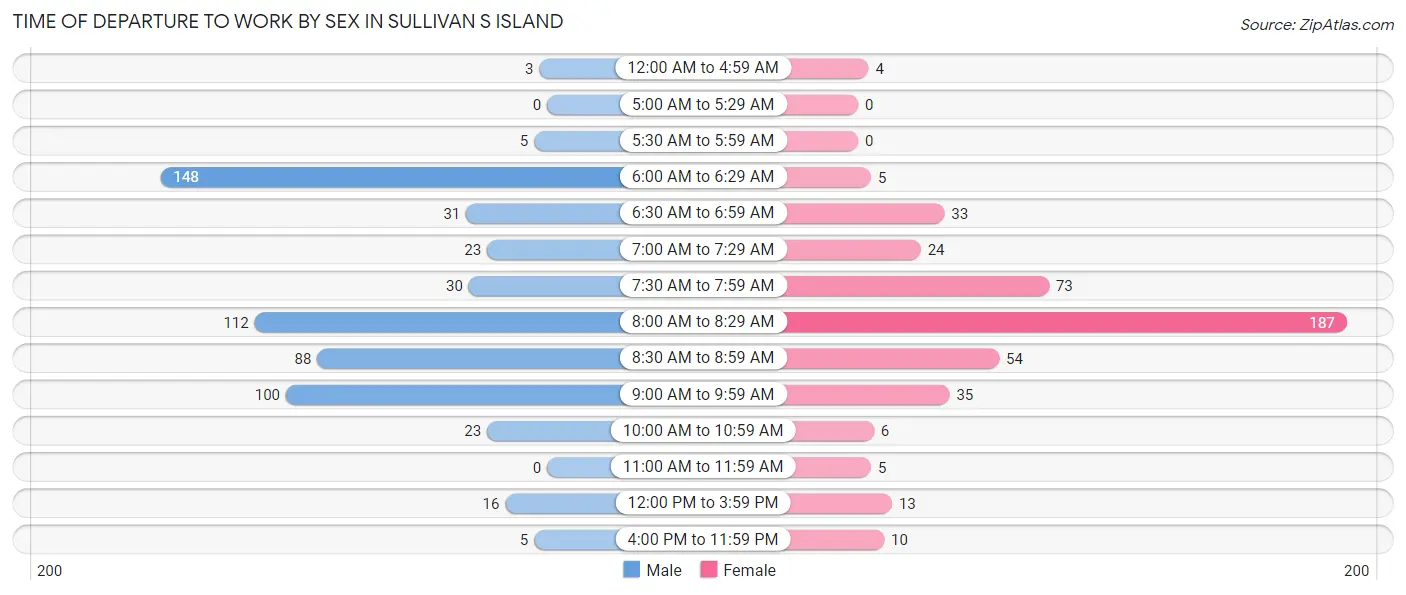
| Time of Departure | Male | Female |
| 12:00 AM to 4:59 AM | 3 (0.5%) | 4 (0.9%) |
| 5:00 AM to 5:29 AM | 0 (0.0%) | 0 (0.0%) |
| 5:30 AM to 5:59 AM | 5 (0.9%) | 0 (0.0%) |
| 6:00 AM to 6:29 AM | 148 (25.3%) | 5 (1.1%) |
| 6:30 AM to 6:59 AM | 31 (5.3%) | 33 (7.3%) |
| 7:00 AM to 7:29 AM | 23 (3.9%) | 24 (5.3%) |
| 7:30 AM to 7:59 AM | 30 (5.1%) | 73 (16.3%) |
| 8:00 AM to 8:29 AM | 112 (19.2%) | 187 (41.6%) |
| 8:30 AM to 8:59 AM | 88 (15.1%) | 54 (12.0%) |
| 9:00 AM to 9:59 AM | 100 (17.1%) | 35 (7.8%) |
| 10:00 AM to 10:59 AM | 23 (3.9%) | 6 (1.3%) |
| 11:00 AM to 11:59 AM | 0 (0.0%) | 5 (1.1%) |
| 12:00 PM to 3:59 PM | 16 (2.7%) | 13 (2.9%) |
| 4:00 PM to 11:59 PM | 5 (0.9%) | 10 (2.2%) |
| Total | 584 (100.0%) | 449 (100.0%) |
Housing Occupancy in Sullivan s Island
Occupancy by Ownership in Sullivan s Island
Of the total 846 dwellings in Sullivan s Island, owner-occupied units account for 713 (84.3%), while renter-occupied units make up 133 (15.7%).
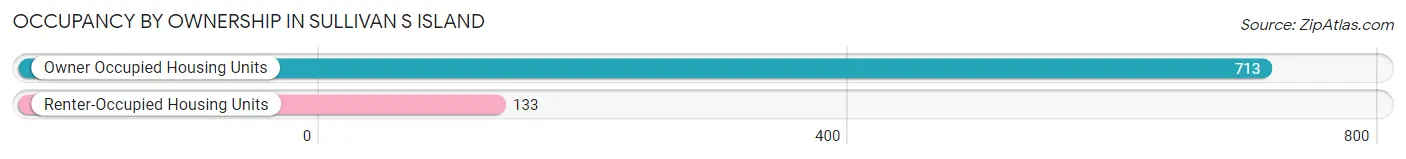
| Occupancy | # Housing Units | % Housing Units |
| Owner Occupied Housing Units | 713 | 84.3% |
| Renter-Occupied Housing Units | 133 | 15.7% |
| Total Occupied Housing Units | 846 | 100.0% |
Occupancy by Household Size in Sullivan s Island
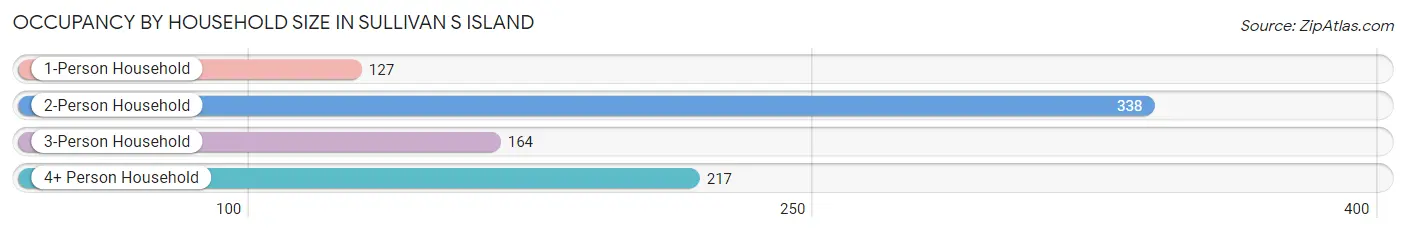
| Household Size | # Housing Units | % Housing Units |
| 1-Person Household | 127 | 15.0% |
| 2-Person Household | 338 | 40.0% |
| 3-Person Household | 164 | 19.4% |
| 4+ Person Household | 217 | 25.7% |
| Total Housing Units | 846 | 100.0% |
Occupancy by Ownership by Household Size in Sullivan s Island
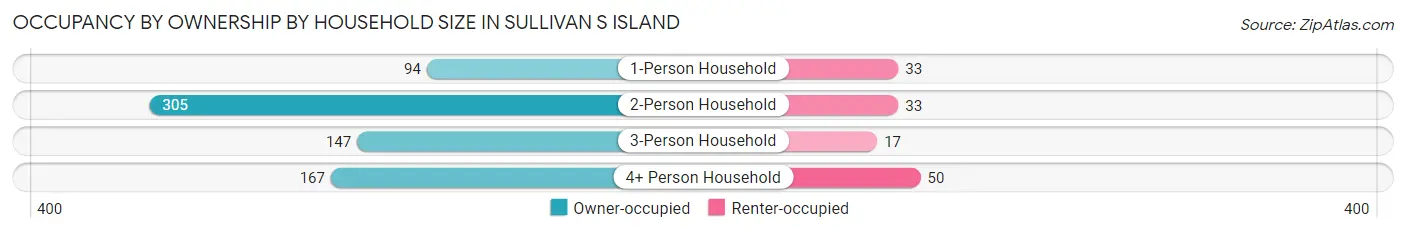
| Household Size | Owner-occupied | Renter-occupied |
| 1-Person Household | 94 (74.0%) | 33 (26.0%) |
| 2-Person Household | 305 (90.2%) | 33 (9.8%) |
| 3-Person Household | 147 (89.6%) | 17 (10.4%) |
| 4+ Person Household | 167 (77.0%) | 50 (23.0%) |
| Total Housing Units | 713 (84.3%) | 133 (15.7%) |
Occupancy by Educational Attainment in Sullivan s Island
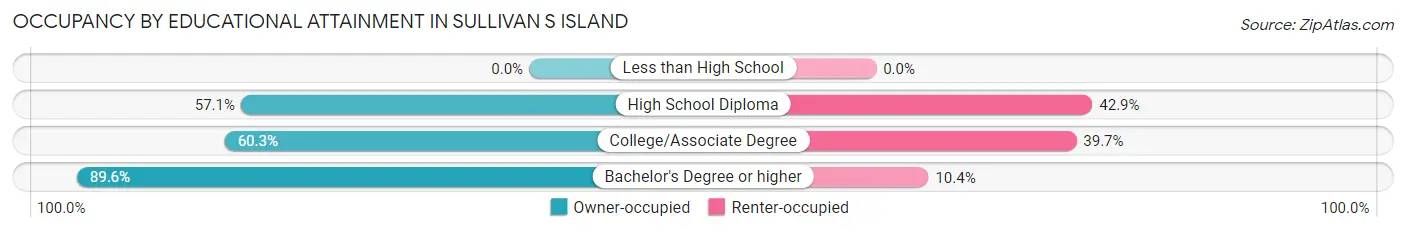
| Household Size | Owner-occupied | Renter-occupied |
| Less than High School | 0 (0.0%) | 0 (0.0%) |
| High School Diploma | 12 (57.1%) | 9 (42.9%) |
| College/Associate Degree | 79 (60.3%) | 52 (39.7%) |
| Bachelor's Degree or higher | 622 (89.6%) | 72 (10.4%) |
Occupancy by Age of Householder in Sullivan s Island
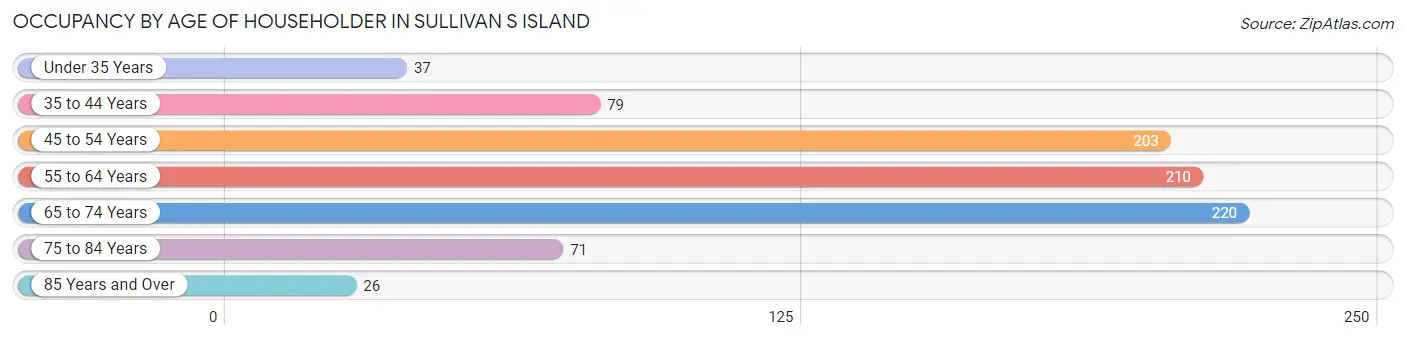
| Age Bracket | # Households | % Households |
| Under 35 Years | 37 | 4.4% |
| 35 to 44 Years | 79 | 9.3% |
| 45 to 54 Years | 203 | 24.0% |
| 55 to 64 Years | 210 | 24.8% |
| 65 to 74 Years | 220 | 26.0% |
| 75 to 84 Years | 71 | 8.4% |
| 85 Years and Over | 26 | 3.1% |
| Total | 846 | 100.0% |
Housing Finances in Sullivan s Island
Median Income by Occupancy in Sullivan s Island
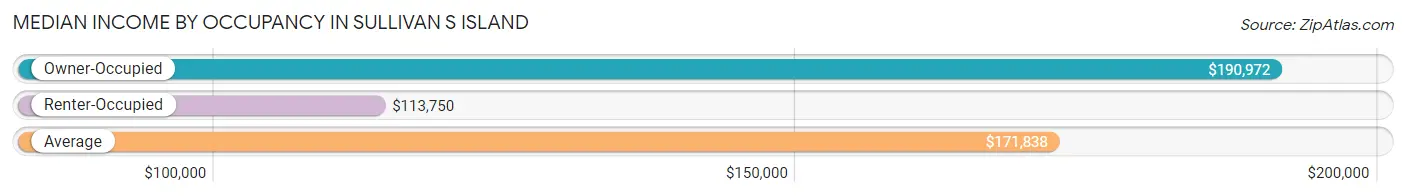
| Occupancy Type | # Households | Median Income |
| Owner-Occupied | 713 (84.3%) | $190,972 |
| Renter-Occupied | 133 (15.7%) | $113,750 |
| Average | 846 (100.0%) | $171,838 |
Occupancy by Householder Income Bracket in Sullivan s Island

| Income Bracket | Owner-occupied | Renter-occupied |
| Less than $5,000 | 23 (3.2%) | 11 (8.3%) |
| $5,000 to $9,999 | 5 (0.7%) | 0 (0.0%) |
| $10,000 to $14,999 | 3 (0.4%) | 0 (0.0%) |
| $15,000 to $19,999 | 0 (0.0%) | 12 (9.0%) |
| $20,000 to $24,999 | 5 (0.7%) | 0 (0.0%) |
| $25,000 to $34,999 | 13 (1.8%) | 0 (0.0%) |
| $35,000 to $49,999 | 19 (2.7%) | 0 (0.0%) |
| $50,000 to $74,999 | 50 (7.0%) | 29 (21.8%) |
| $75,000 to $99,999 | 47 (6.6%) | 4 (3.0%) |
| $100,000 to $149,999 | 76 (10.7%) | 49 (36.8%) |
| $150,000 or more | 472 (66.2%) | 28 (21.0%) |
| Total | 713 (100.0%) | 133 (100.0%) |
Monthly Housing Cost Tiers in Sullivan s Island
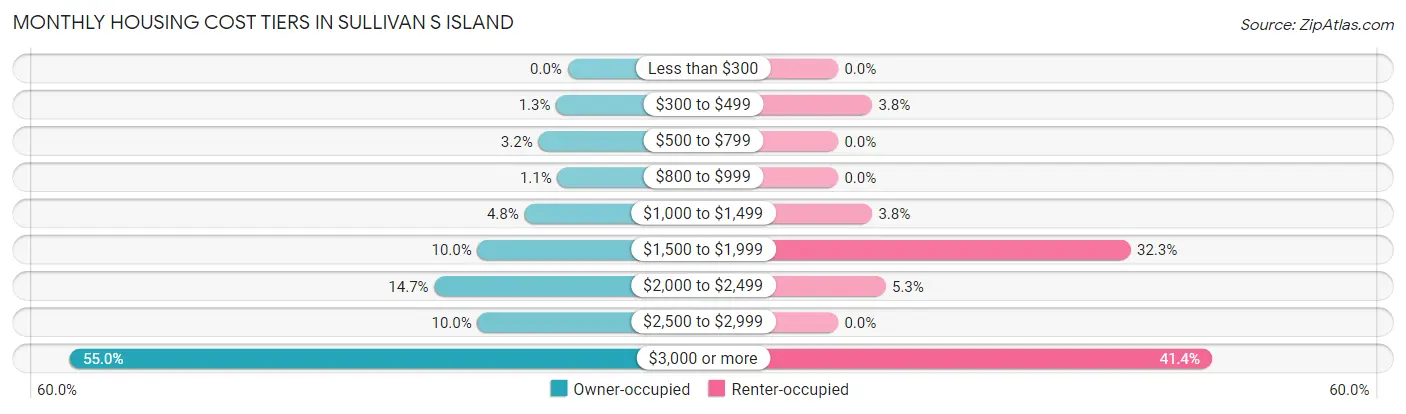
| Monthly Cost | Owner-occupied | Renter-occupied |
| Less than $300 | 0 (0.0%) | 0 (0.0%) |
| $300 to $499 | 9 (1.3%) | 5 (3.8%) |
| $500 to $799 | 23 (3.2%) | 0 (0.0%) |
| $800 to $999 | 8 (1.1%) | 0 (0.0%) |
| $1,000 to $1,499 | 34 (4.8%) | 5 (3.8%) |
| $1,500 to $1,999 | 71 (10.0%) | 43 (32.3%) |
| $2,000 to $2,499 | 105 (14.7%) | 7 (5.3%) |
| $2,500 to $2,999 | 71 (10.0%) | 0 (0.0%) |
| $3,000 or more | 392 (55.0%) | 55 (41.3%) |
| Total | 713 (100.0%) | 133 (100.0%) |
Physical Housing Characteristics in Sullivan s Island
Housing Structures in Sullivan s Island
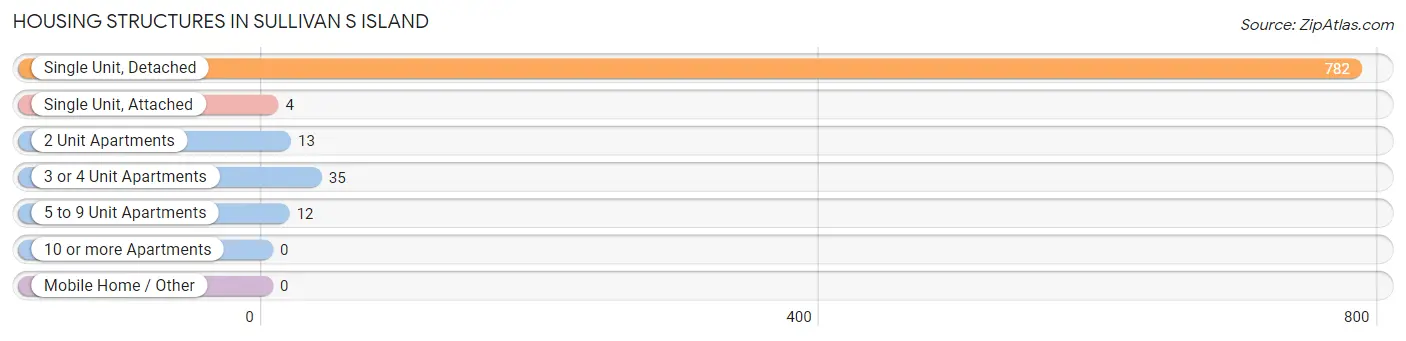
| Structure Type | # Housing Units | % Housing Units |
| Single Unit, Detached | 782 | 92.4% |
| Single Unit, Attached | 4 | 0.5% |
| 2 Unit Apartments | 13 | 1.5% |
| 3 or 4 Unit Apartments | 35 | 4.1% |
| 5 to 9 Unit Apartments | 12 | 1.4% |
| 10 or more Apartments | 0 | 0.0% |
| Mobile Home / Other | 0 | 0.0% |
| Total | 846 | 100.0% |
Housing Structures by Occupancy in Sullivan s Island
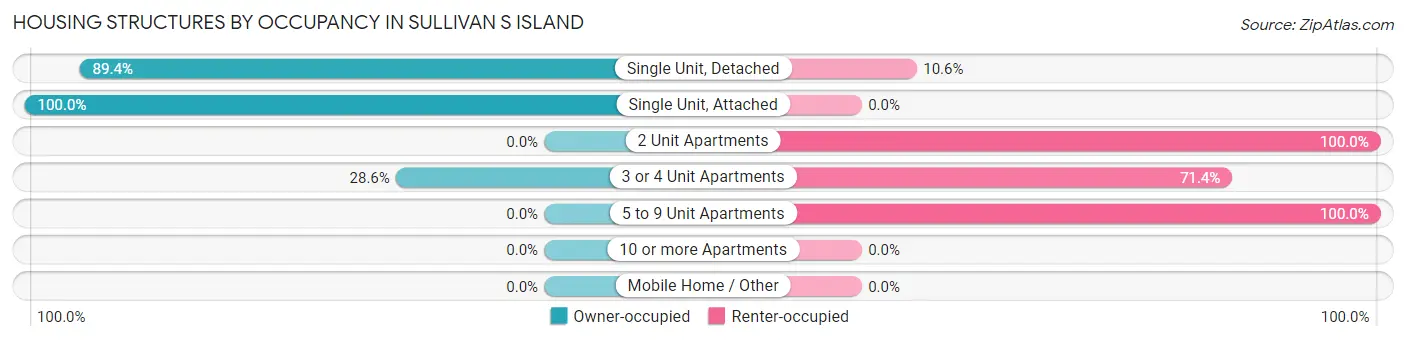
| Structure Type | Owner-occupied | Renter-occupied |
| Single Unit, Detached | 699 (89.4%) | 83 (10.6%) |
| Single Unit, Attached | 4 (100.0%) | 0 (0.0%) |
| 2 Unit Apartments | 0 (0.0%) | 13 (100.0%) |
| 3 or 4 Unit Apartments | 10 (28.6%) | 25 (71.4%) |
| 5 to 9 Unit Apartments | 0 (0.0%) | 12 (100.0%) |
| 10 or more Apartments | 0 (0.0%) | 0 (0.0%) |
| Mobile Home / Other | 0 (0.0%) | 0 (0.0%) |
| Total | 713 (84.3%) | 133 (15.7%) |
Housing Structures by Number of Rooms in Sullivan s Island
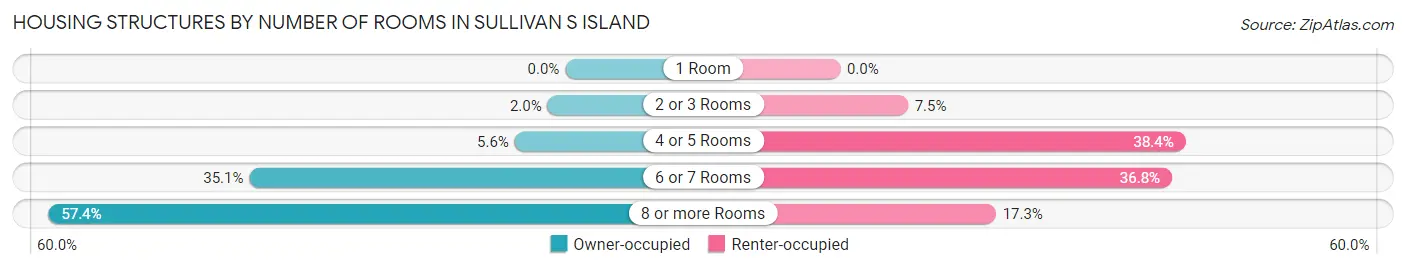
| Number of Rooms | Owner-occupied | Renter-occupied |
| 1 Room | 0 (0.0%) | 0 (0.0%) |
| 2 or 3 Rooms | 14 (2.0%) | 10 (7.5%) |
| 4 or 5 Rooms | 40 (5.6%) | 51 (38.4%) |
| 6 or 7 Rooms | 250 (35.1%) | 49 (36.8%) |
| 8 or more Rooms | 409 (57.4%) | 23 (17.3%) |
| Total | 713 (100.0%) | 133 (100.0%) |
Housing Structure by Heating Type in Sullivan s Island
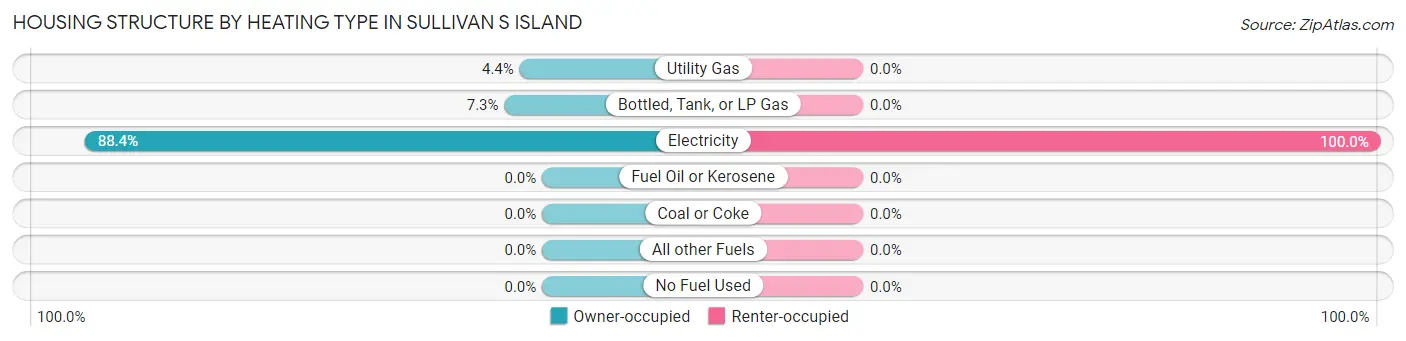
| Heating Type | Owner-occupied | Renter-occupied |
| Utility Gas | 31 (4.3%) | 0 (0.0%) |
| Bottled, Tank, or LP Gas | 52 (7.3%) | 0 (0.0%) |
| Electricity | 630 (88.4%) | 133 (100.0%) |
| Fuel Oil or Kerosene | 0 (0.0%) | 0 (0.0%) |
| Coal or Coke | 0 (0.0%) | 0 (0.0%) |
| All other Fuels | 0 (0.0%) | 0 (0.0%) |
| No Fuel Used | 0 (0.0%) | 0 (0.0%) |
| Total | 713 (100.0%) | 133 (100.0%) |
Household Vehicle Usage in Sullivan s Island
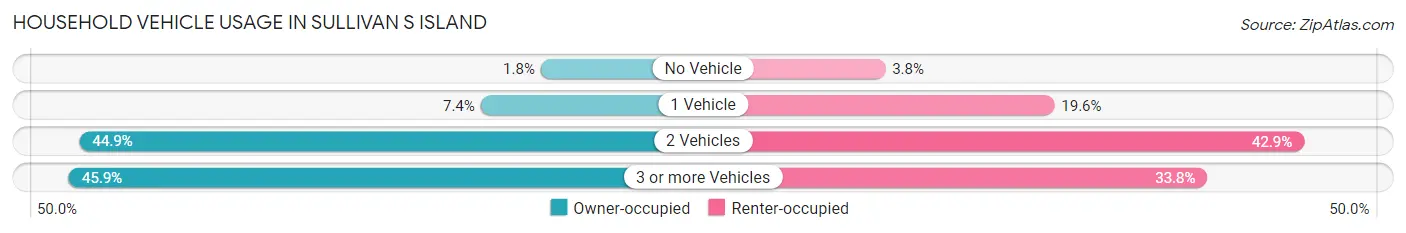
| Vehicles per Household | Owner-occupied | Renter-occupied |
| No Vehicle | 13 (1.8%) | 5 (3.8%) |
| 1 Vehicle | 53 (7.4%) | 26 (19.6%) |
| 2 Vehicles | 320 (44.9%) | 57 (42.9%) |
| 3 or more Vehicles | 327 (45.9%) | 45 (33.8%) |
| Total | 713 (100.0%) | 133 (100.0%) |
Real Estate & Mortgages in Sullivan s Island
Real Estate and Mortgage Overview in Sullivan s Island
| Characteristic | Without Mortgage | With Mortgage |
| Housing Units | 182 | 531 |
| Median Property Value | $2,000,001 | $2,000,001 |
| Median Household Income | $91,250 | $399 |
| Monthly Housing Costs | $1,501 | $377 |
| Real Estate Taxes | $8,289 | $14 |
Property Value by Mortgage Status in Sullivan s Island
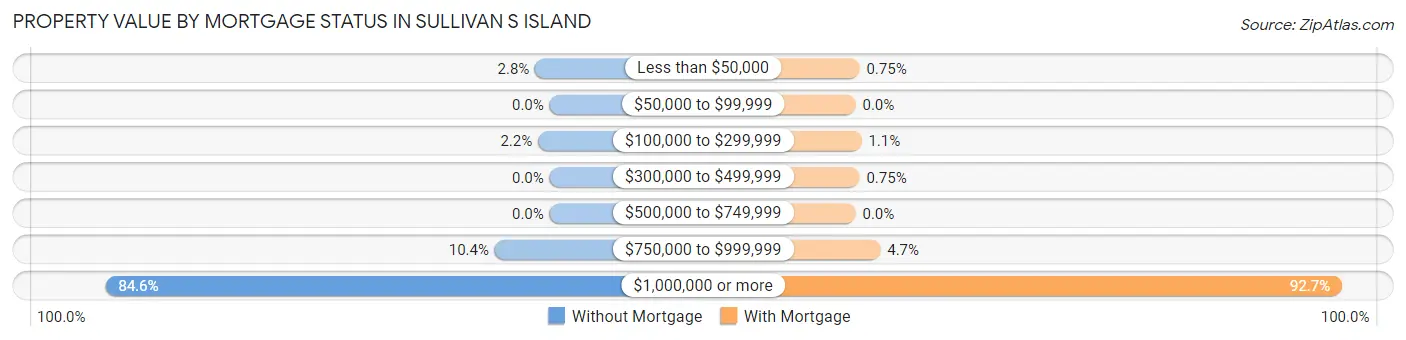
| Property Value | Without Mortgage | With Mortgage |
| Less than $50,000 | 5 (2.8%) | 4 (0.7%) |
| $50,000 to $99,999 | 0 (0.0%) | 0 (0.0%) |
| $100,000 to $299,999 | 4 (2.2%) | 6 (1.1%) |
| $300,000 to $499,999 | 0 (0.0%) | 4 (0.7%) |
| $500,000 to $749,999 | 0 (0.0%) | 0 (0.0%) |
| $750,000 to $999,999 | 19 (10.4%) | 25 (4.7%) |
| $1,000,000 or more | 154 (84.6%) | 492 (92.7%) |
| Total | 182 (100.0%) | 531 (100.0%) |
Household Income by Mortgage Status in Sullivan s Island
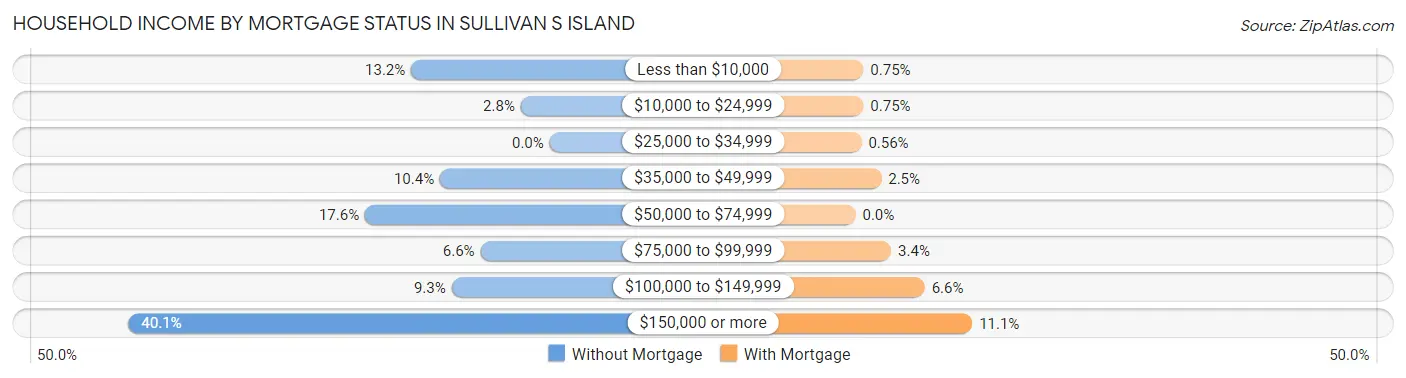
| Household Income | Without Mortgage | With Mortgage |
| Less than $10,000 | 24 (13.2%) | 4 (0.7%) |
| $10,000 to $24,999 | 5 (2.8%) | 4 (0.7%) |
| $25,000 to $34,999 | 0 (0.0%) | 3 (0.6%) |
| $35,000 to $49,999 | 19 (10.4%) | 13 (2.5%) |
| $50,000 to $74,999 | 32 (17.6%) | 0 (0.0%) |
| $75,000 to $99,999 | 12 (6.6%) | 18 (3.4%) |
| $100,000 to $149,999 | 17 (9.3%) | 35 (6.6%) |
| $150,000 or more | 73 (40.1%) | 59 (11.1%) |
| Total | 182 (100.0%) | 531 (100.0%) |
Property Value to Household Income Ratio in Sullivan s Island
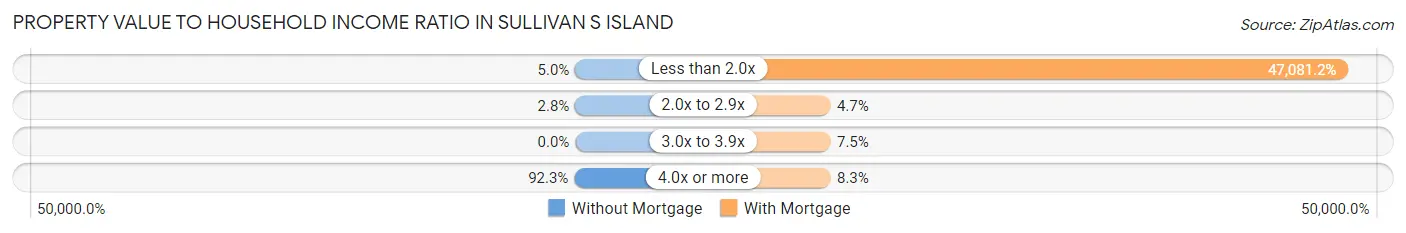
| Value-to-Income Ratio | Without Mortgage | With Mortgage |
| Less than 2.0x | 9 (5.0%) | 250,001 (47,081.2%) |
| 2.0x to 2.9x | 5 (2.8%) | 25 (4.7%) |
| 3.0x to 3.9x | 0 (0.0%) | 40 (7.5%) |
| 4.0x or more | 168 (92.3%) | 44 (8.3%) |
| Total | 182 (100.0%) | 531 (100.0%) |
Real Estate Taxes by Mortgage Status in Sullivan s Island
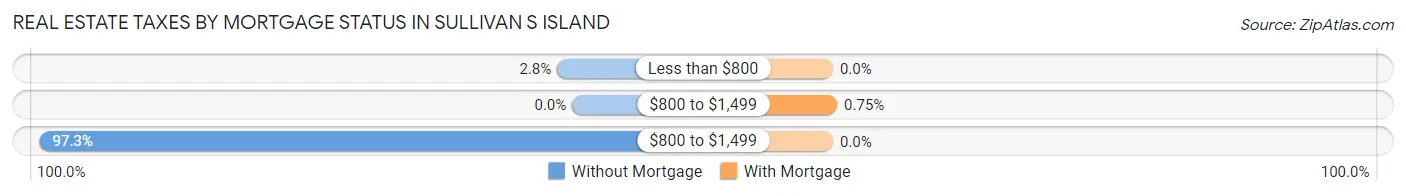
| Property Taxes | Without Mortgage | With Mortgage |
| Less than $800 | 5 (2.8%) | 0 (0.0%) |
| $800 to $1,499 | 0 (0.0%) | 4 (0.7%) |
| $800 to $1,499 | 177 (97.3%) | 0 (0.0%) |
| Total | 182 (100.0%) | 531 (100.0%) |
Health & Disability in Sullivan s Island
Health Insurance Coverage by Age in Sullivan s Island
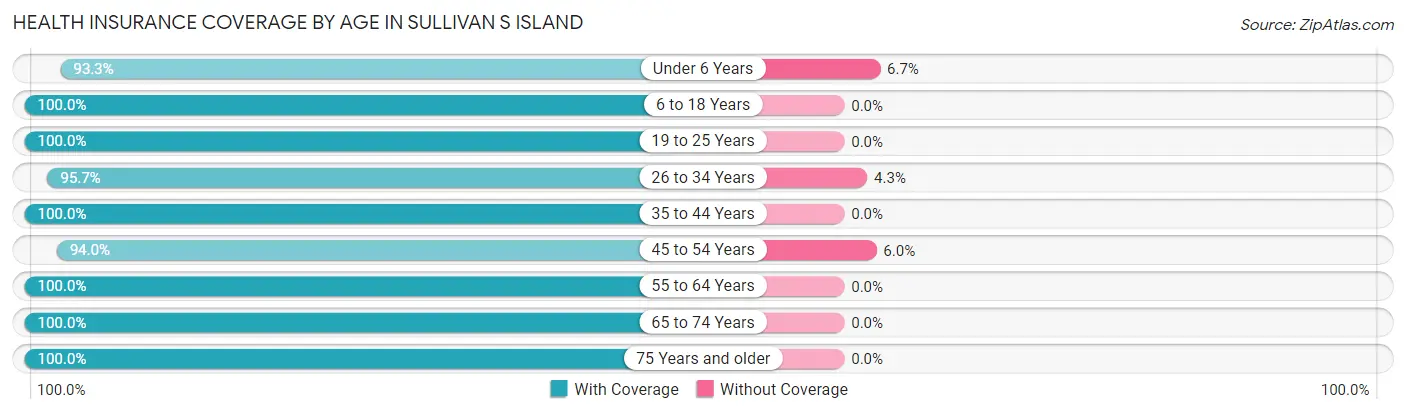
| Age Bracket | With Coverage | Without Coverage |
| Under 6 Years | 84 (93.3%) | 6 (6.7%) |
| 6 to 18 Years | 381 (100.0%) | 0 (0.0%) |
| 19 to 25 Years | 102 (100.0%) | 0 (0.0%) |
| 26 to 34 Years | 90 (95.7%) | 4 (4.3%) |
| 35 to 44 Years | 255 (100.0%) | 0 (0.0%) |
| 45 to 54 Years | 345 (94.0%) | 22 (6.0%) |
| 55 to 64 Years | 440 (100.0%) | 0 (0.0%) |
| 65 to 74 Years | 413 (100.0%) | 0 (0.0%) |
| 75 Years and older | 175 (100.0%) | 0 (0.0%) |
| Total | 2,285 (98.6%) | 32 (1.4%) |
Health Insurance Coverage by Citizenship Status in Sullivan s Island
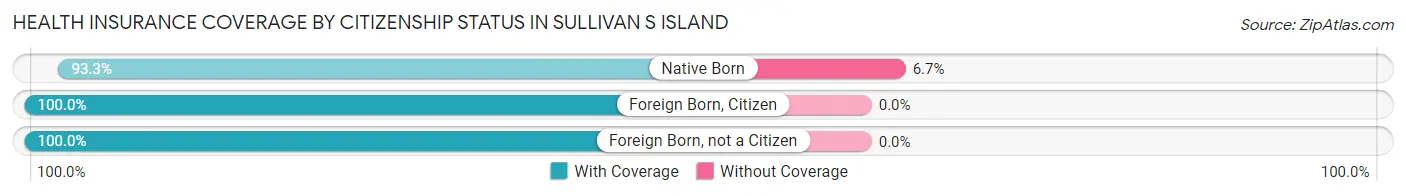
| Citizenship Status | With Coverage | Without Coverage |
| Native Born | 84 (93.3%) | 6 (6.7%) |
| Foreign Born, Citizen | 381 (100.0%) | 0 (0.0%) |
| Foreign Born, not a Citizen | 102 (100.0%) | 0 (0.0%) |
Health Insurance Coverage by Household Income in Sullivan s Island
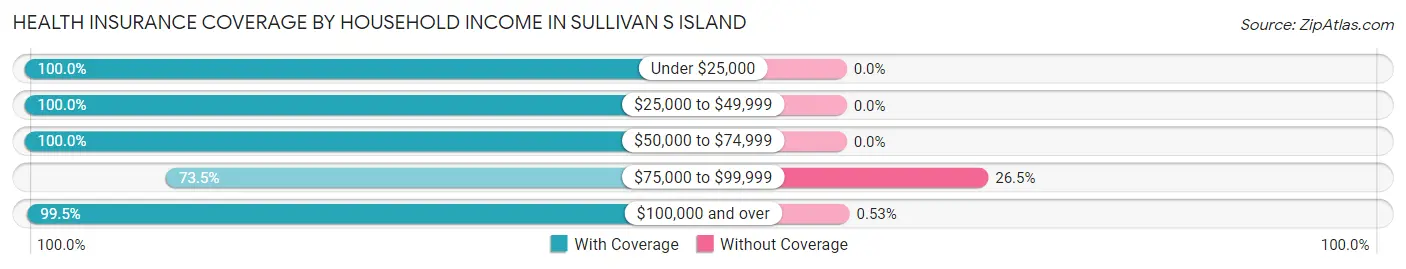
| Household Income | With Coverage | Without Coverage |
| Under $25,000 | 140 (100.0%) | 0 (0.0%) |
| $25,000 to $49,999 | 60 (100.0%) | 0 (0.0%) |
| $50,000 to $74,999 | 137 (100.0%) | 0 (0.0%) |
| $75,000 to $99,999 | 61 (73.5%) | 22 (26.5%) |
| $100,000 and over | 1,887 (99.5%) | 10 (0.5%) |
Public vs Private Health Insurance Coverage by Age in Sullivan s Island
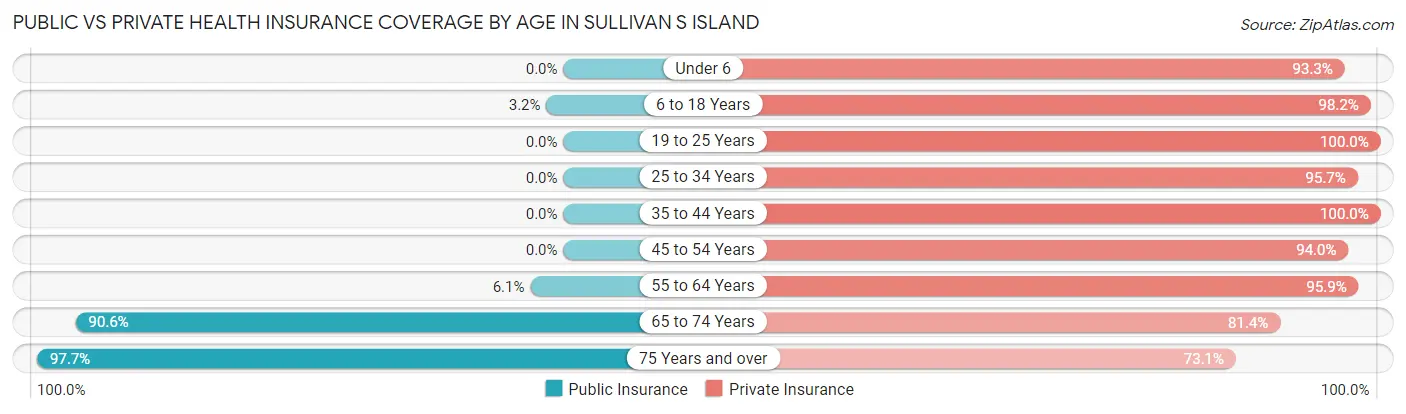
| Age Bracket | Public Insurance | Private Insurance |
| Under 6 | 0 (0.0%) | 84 (93.3%) |
| 6 to 18 Years | 12 (3.2%) | 374 (98.2%) |
| 19 to 25 Years | 0 (0.0%) | 102 (100.0%) |
| 25 to 34 Years | 0 (0.0%) | 90 (95.7%) |
| 35 to 44 Years | 0 (0.0%) | 255 (100.0%) |
| 45 to 54 Years | 0 (0.0%) | 345 (94.0%) |
| 55 to 64 Years | 27 (6.1%) | 422 (95.9%) |
| 65 to 74 Years | 374 (90.6%) | 336 (81.4%) |
| 75 Years and over | 171 (97.7%) | 128 (73.1%) |
| Total | 584 (25.2%) | 2,136 (92.2%) |
Disability Status by Sex by Age in Sullivan s Island
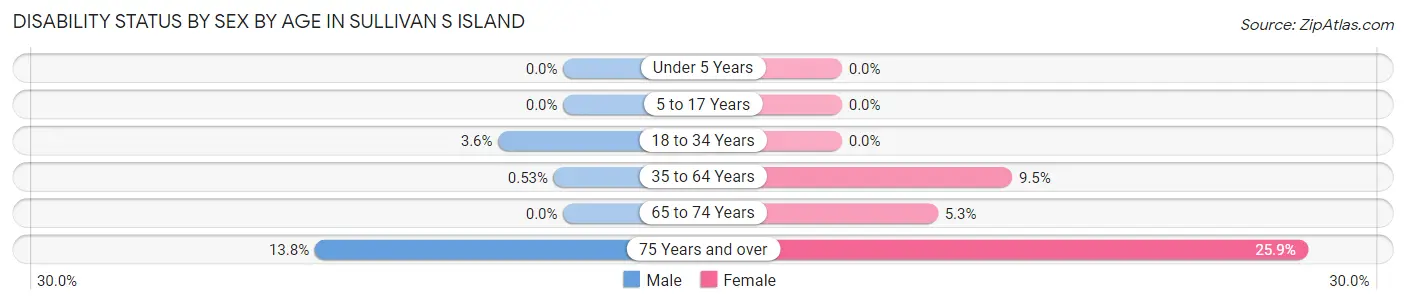
| Age Bracket | Male | Female |
| Under 5 Years | 0 (0.0%) | 0 (0.0%) |
| 5 to 17 Years | 0 (0.0%) | 0 (0.0%) |
| 18 to 34 Years | 5 (3.6%) | 0 (0.0%) |
| 35 to 64 Years | 3 (0.5%) | 47 (9.5%) |
| 65 to 74 Years | 0 (0.0%) | 15 (5.3%) |
| 75 Years and over | 13 (13.8%) | 21 (25.9%) |
Disability Class by Sex by Age in Sullivan s Island
Disability Class: Hearing Difficulty
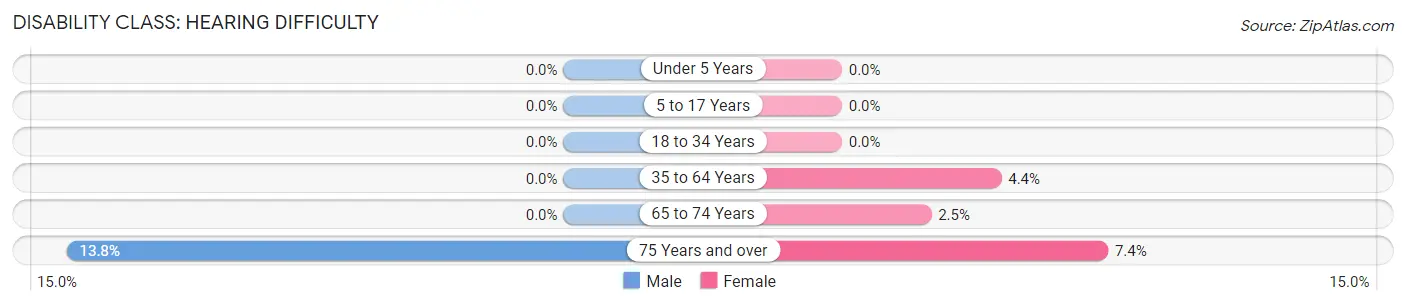
| Age Bracket | Male | Female |
| Under 5 Years | 0 (0.0%) | 0 (0.0%) |
| 5 to 17 Years | 0 (0.0%) | 0 (0.0%) |
| 18 to 34 Years | 0 (0.0%) | 0 (0.0%) |
| 35 to 64 Years | 0 (0.0%) | 22 (4.4%) |
| 65 to 74 Years | 0 (0.0%) | 7 (2.5%) |
| 75 Years and over | 13 (13.8%) | 6 (7.4%) |
Disability Class: Vision Difficulty
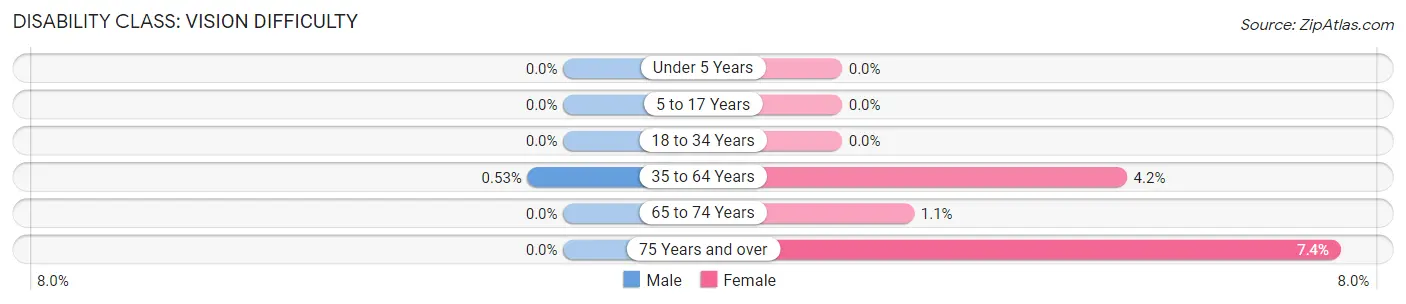
| Age Bracket | Male | Female |
| Under 5 Years | 0 (0.0%) | 0 (0.0%) |
| 5 to 17 Years | 0 (0.0%) | 0 (0.0%) |
| 18 to 34 Years | 0 (0.0%) | 0 (0.0%) |
| 35 to 64 Years | 3 (0.5%) | 21 (4.2%) |
| 65 to 74 Years | 0 (0.0%) | 3 (1.1%) |
| 75 Years and over | 0 (0.0%) | 6 (7.4%) |
Disability Class: Cognitive Difficulty
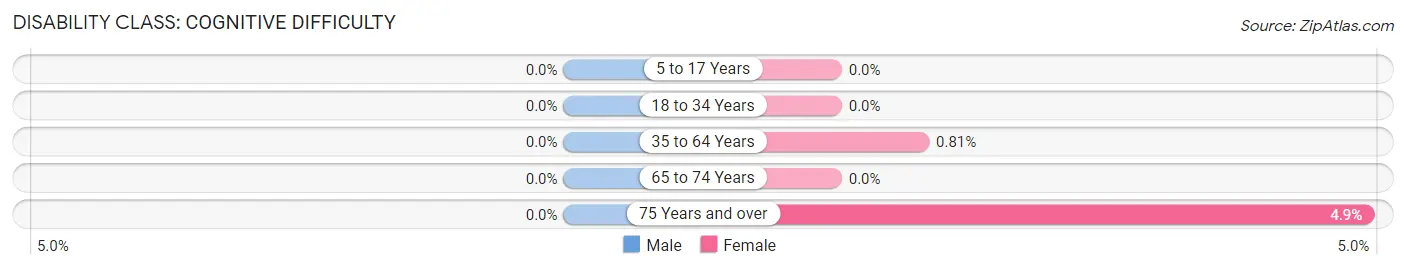
| Age Bracket | Male | Female |
| 5 to 17 Years | 0 (0.0%) | 0 (0.0%) |
| 18 to 34 Years | 0 (0.0%) | 0 (0.0%) |
| 35 to 64 Years | 0 (0.0%) | 4 (0.8%) |
| 65 to 74 Years | 0 (0.0%) | 0 (0.0%) |
| 75 Years and over | 0 (0.0%) | 4 (4.9%) |
Disability Class: Ambulatory Difficulty
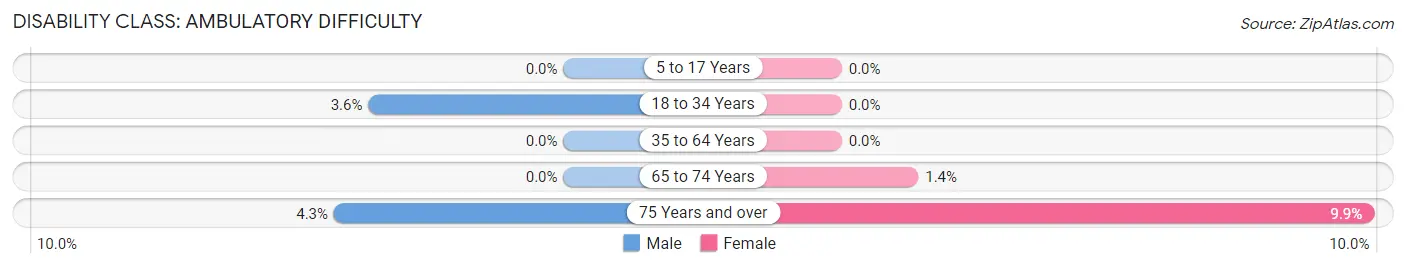
| Age Bracket | Male | Female |
| 5 to 17 Years | 0 (0.0%) | 0 (0.0%) |
| 18 to 34 Years | 5 (3.6%) | 0 (0.0%) |
| 35 to 64 Years | 0 (0.0%) | 0 (0.0%) |
| 65 to 74 Years | 0 (0.0%) | 4 (1.4%) |
| 75 Years and over | 4 (4.3%) | 8 (9.9%) |
Disability Class: Self-Care Difficulty
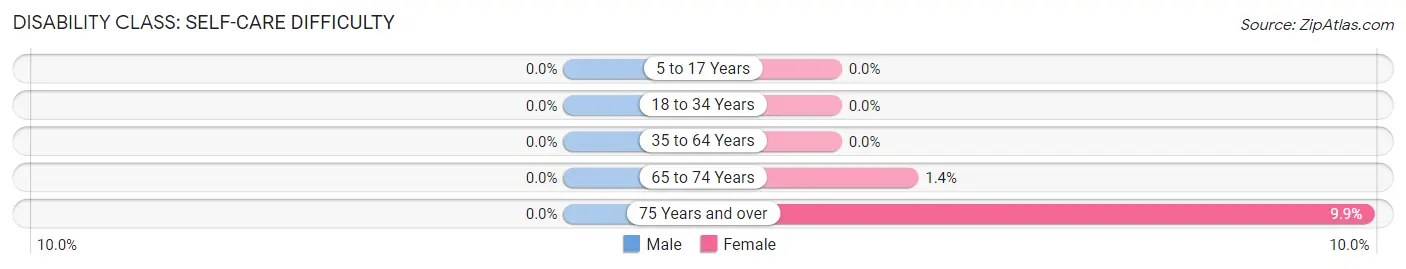
| Age Bracket | Male | Female |
| 5 to 17 Years | 0 (0.0%) | 0 (0.0%) |
| 18 to 34 Years | 0 (0.0%) | 0 (0.0%) |
| 35 to 64 Years | 0 (0.0%) | 0 (0.0%) |
| 65 to 74 Years | 0 (0.0%) | 4 (1.4%) |
| 75 Years and over | 0 (0.0%) | 8 (9.9%) |
Technology Access in Sullivan s Island
Computing Device Access in Sullivan s Island
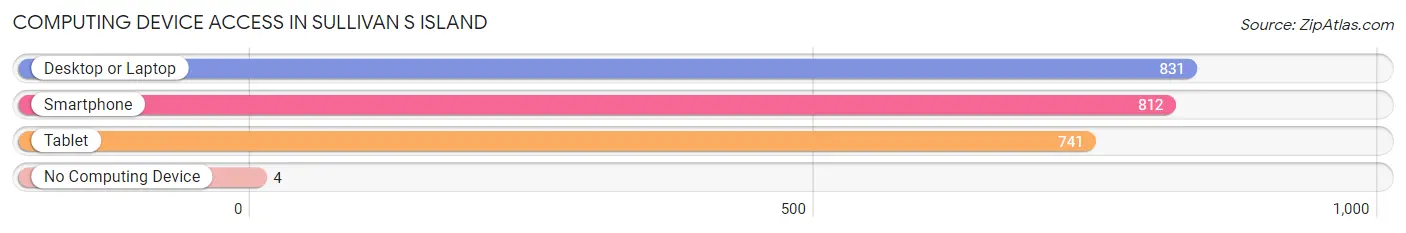
| Device Type | # Households | % Households |
| Desktop or Laptop | 831 | 98.2% |
| Smartphone | 812 | 96.0% |
| Tablet | 741 | 87.6% |
| No Computing Device | 4 | 0.5% |
| Total | 846 | 100.0% |
Internet Access in Sullivan s Island
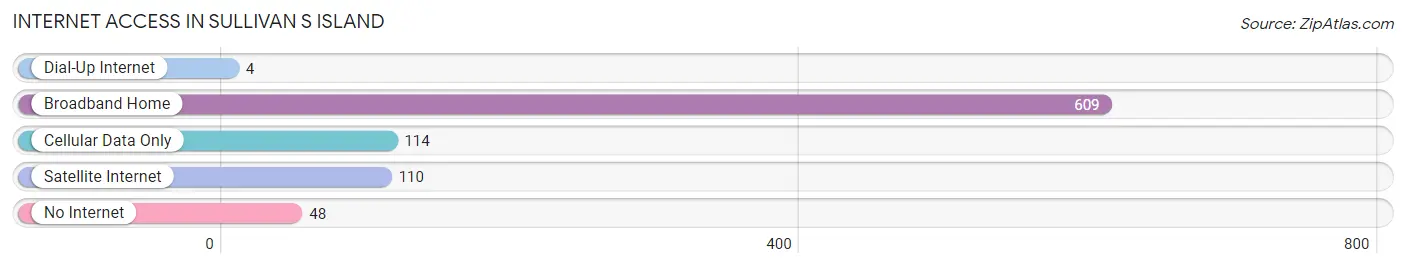
| Internet Type | # Households | % Households |
| Dial-Up Internet | 4 | 0.5% |
| Broadband Home | 609 | 72.0% |
| Cellular Data Only | 114 | 13.5% |
| Satellite Internet | 110 | 13.0% |
| No Internet | 48 | 5.7% |
| Total | 846 | 100.0% |
Sullivan s Island Summary
Sullivan’s Island is a small barrier island located off the coast of South Carolina, just north of Charleston. It is a popular tourist destination, known for its beautiful beaches, historic sites, and laid-back atmosphere. The island is home to a variety of wildlife, including sea turtles, dolphins, and a variety of birds. Sullivan’s Island is also home to a number of historic sites, including Fort Moultrie, a Revolutionary War fort, and the Sullivan’s Island Lighthouse.
Geography
Sullivan’s Island is located off the coast of South Carolina, just north of Charleston. It is a barrier island, meaning it is separated from the mainland by a body of water. The island is approximately three miles long and one mile wide, and is bordered by the Atlantic Ocean to the east and the Intracoastal Waterway to the west. The island is made up of mostly sand, with some areas of marshland.
Economy
Sullivan’s Island is a popular tourist destination, and the island’s economy is largely based on tourism. The island is home to a number of hotels, restaurants, and shops, as well as a variety of recreational activities, such as fishing, boating, and swimming. The island also has a number of historic sites, including Fort Moultrie and the Sullivan’s Island Lighthouse.
Demographics
As of the 2010 census, the population of Sullivan’s Island was 2,476. The population is predominantly white (90.2%), with a small percentage of African Americans (7.2%) and other races (2.6%). The median household income is $90,945, and the median age is 44.
History
Sullivan’s Island has a long and storied history. The island was first settled by Europeans in the late 1600s, and was named after Captain Florence O’Sullivan, who was the first to settle the island. During the Revolutionary War, the island was the site of the Battle of Sullivan’s Island, which was a decisive victory for the American forces. In the 19th century, the island was used as a quarantine station for immigrants arriving in Charleston. In the 20th century, the island was used as a military base, and is now a popular tourist destination.
Common Questions
What is Per Capita Income in Sullivan s Island?
Per Capita income in Sullivan s Island is $107,987.
What is the Median Family Income in Sullivan s Island?
Median Family Income in Sullivan s Island is $213,750.
What is the Median Household income in Sullivan s Island?
Median Household Income in Sullivan s Island is $171,838.
What is Inequality or Gini Index in Sullivan s Island?
Inequality or Gini Index in Sullivan s Island is 0.51.
What is the Total Population of Sullivan s Island?
Total Population of Sullivan s Island is 2,317.
What is the Total Male Population of Sullivan s Island?
Total Male Population of Sullivan s Island is 1,168.
What is the Total Female Population of Sullivan s Island?
Total Female Population of Sullivan s Island is 1,149.
What is the Ratio of Males per 100 Females in Sullivan s Island?
There are 101.65 Males per 100 Females in Sullivan s Island.
What is the Ratio of Females per 100 Males in Sullivan s Island?
There are 98.37 Females per 100 Males in Sullivan s Island.
What is the Median Population Age in Sullivan s Island?
Median Population Age in Sullivan s Island is 51.7 Years.
What is the Average Family Size in Sullivan s Island
Average Family Size in Sullivan s Island is 2.9 People.
What is the Average Household Size in Sullivan s Island
Average Household Size in Sullivan s Island is 2.7 People.
How Large is the Labor Force in Sullivan s Island?
There are 1,213 People in the Labor Forcein in Sullivan s Island.
What is the Percentage of People in the Labor Force in Sullivan s Island?
60.6% of People are in the Labor Force in Sullivan s Island.
What is the Unemployment Rate in Sullivan s Island?
Unemployment Rate in Sullivan s Island is 1.6%.