Northlake, SC Map & Demographics
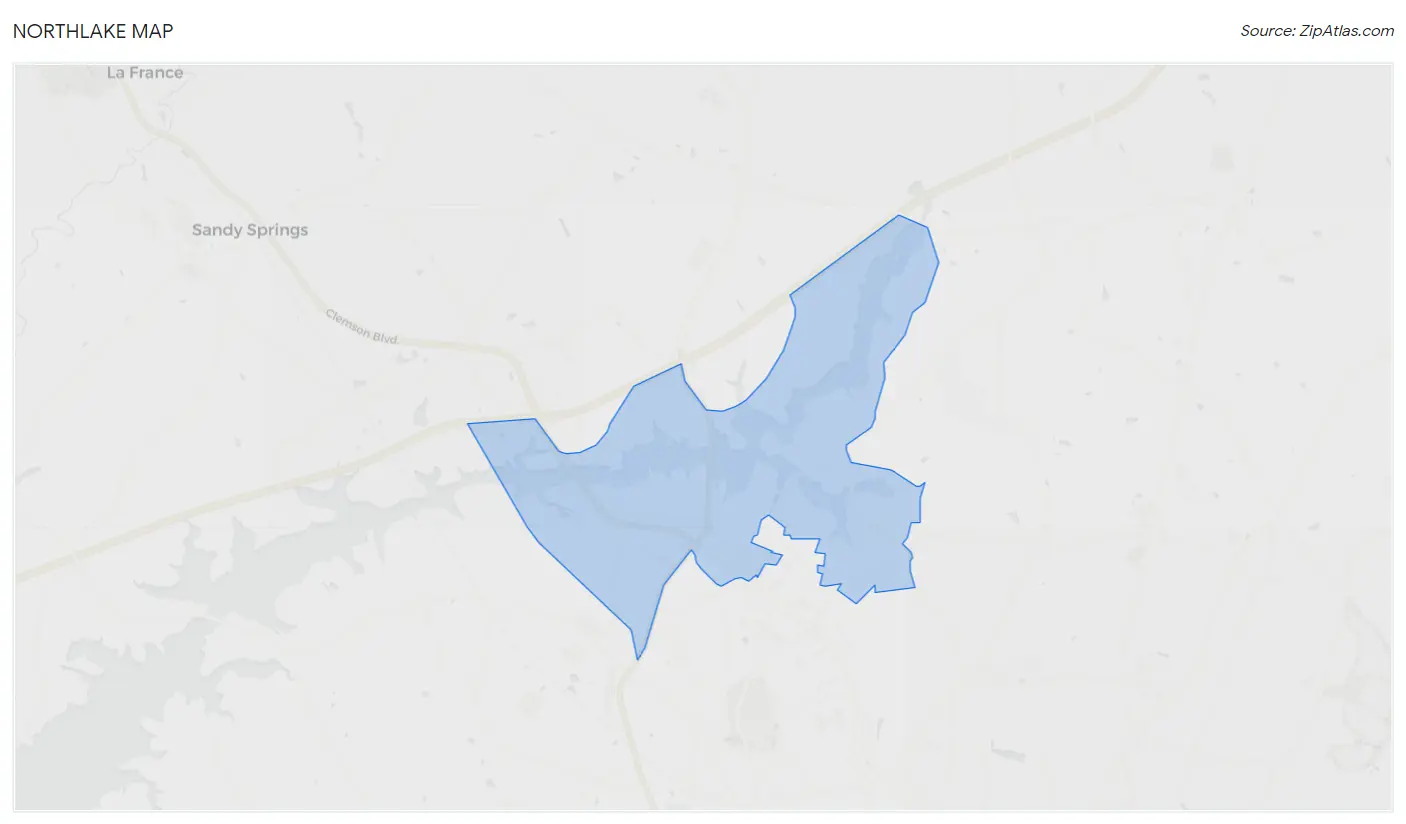
Northlake Map
Northlake Overview
$50,051
PER CAPITA INCOME
$106,701
AVG FAMILY INCOME
$93,271
AVG HOUSEHOLD INCOME
44.9%
WAGE / INCOME GAP [ % ]
55.1¢/ $1
WAGE / INCOME GAP [ $ ]
0.47
INEQUALITY / GINI INDEX
3,989
TOTAL POPULATION
1,945
MALE POPULATION
2,044
FEMALE POPULATION
95.16
MALES / 100 FEMALES
105.09
FEMALES / 100 MALES
46.6
MEDIAN AGE
3.0
AVG FAMILY SIZE
2.5
AVG HOUSEHOLD SIZE
1,856
LABOR FORCE [ PEOPLE ]
57.2%
PERCENT IN LABOR FORCE
5.6%
UNEMPLOYMENT RATE
Income in Northlake
Income Overview in Northlake
Per Capita Income in Northlake is $50,051, while median incomes of families and households are $106,701 and $93,271 respectively.
| Characteristic | Number | Measure |
| Per Capita Income | 3,989 | $50,051 |
| Median Family Income | 1,111 | $106,701 |
| Mean Family Income | 1,111 | $148,432 |
| Median Household Income | 1,623 | $93,271 |
| Mean Household Income | 1,623 | $120,571 |
| Income Deficit | 1,111 | $0 |
| Wage / Income Gap (%) | 3,989 | 44.91% |
| Wage / Income Gap ($) | 3,989 | 55.09¢ per $1 |
| Gini / Inequality Index | 3,989 | 0.47 |
Earnings by Sex in Northlake
Average Earnings in Northlake are $47,188, $57,305 for men and $31,569 for women, a difference of 44.9%.
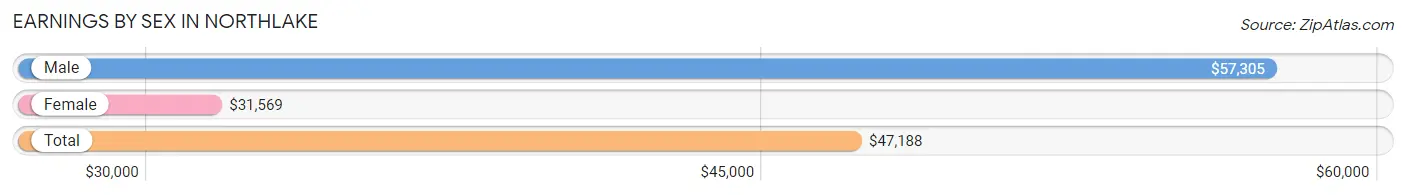
| Sex | Number | Average Earnings |
| Male | 1,066 (53.1%) | $57,305 |
| Female | 943 (46.9%) | $31,569 |
| Total | 2,009 (100.0%) | $47,188 |
Earnings by Sex by Income Bracket in Northlake
The most common earnings brackets in Northlake are $100,000+ for men (271 | 25.4%) and $100,000+ for women (120 | 12.7%).
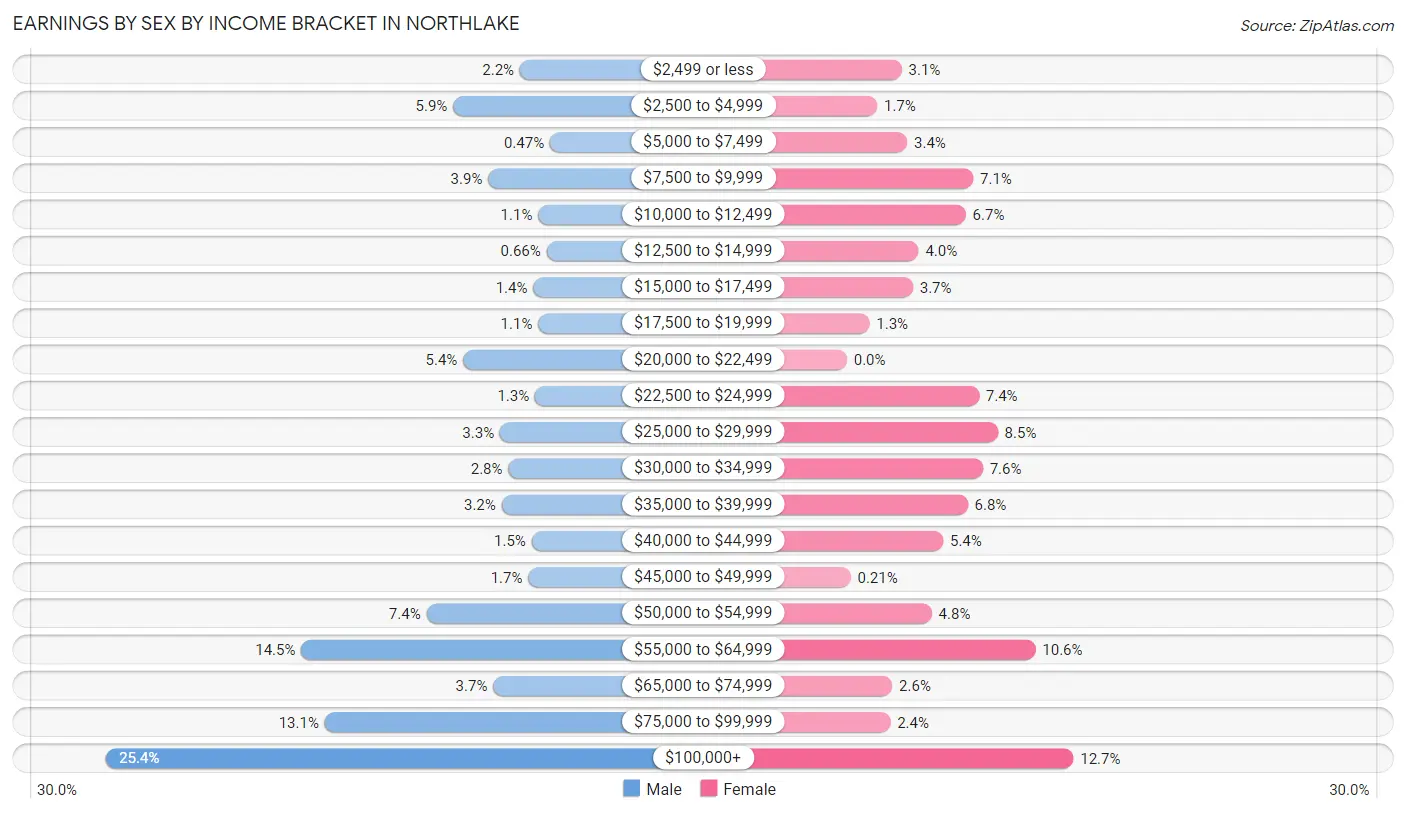
| Income | Male | Female |
| $2,499 or less | 23 (2.2%) | 29 (3.1%) |
| $2,500 to $4,999 | 63 (5.9%) | 16 (1.7%) |
| $5,000 to $7,499 | 5 (0.5%) | 32 (3.4%) |
| $7,500 to $9,999 | 42 (3.9%) | 67 (7.1%) |
| $10,000 to $12,499 | 12 (1.1%) | 63 (6.7%) |
| $12,500 to $14,999 | 7 (0.7%) | 38 (4.0%) |
| $15,000 to $17,499 | 15 (1.4%) | 35 (3.7%) |
| $17,500 to $19,999 | 12 (1.1%) | 12 (1.3%) |
| $20,000 to $22,499 | 57 (5.3%) | 0 (0.0%) |
| $22,500 to $24,999 | 14 (1.3%) | 70 (7.4%) |
| $25,000 to $29,999 | 35 (3.3%) | 80 (8.5%) |
| $30,000 to $34,999 | 30 (2.8%) | 72 (7.6%) |
| $35,000 to $39,999 | 34 (3.2%) | 64 (6.8%) |
| $40,000 to $44,999 | 16 (1.5%) | 51 (5.4%) |
| $45,000 to $49,999 | 18 (1.7%) | 2 (0.2%) |
| $50,000 to $54,999 | 79 (7.4%) | 45 (4.8%) |
| $55,000 to $64,999 | 154 (14.4%) | 100 (10.6%) |
| $65,000 to $74,999 | 39 (3.7%) | 24 (2.5%) |
| $75,000 to $99,999 | 140 (13.1%) | 23 (2.4%) |
| $100,000+ | 271 (25.4%) | 120 (12.7%) |
| Total | 1,066 (100.0%) | 943 (100.0%) |
Earnings by Sex by Educational Attainment in Northlake
Average earnings in Northlake are $58,380 for men and $35,987 for women, a difference of 38.4%. Men with an educational attainment of graduate degree enjoy the highest average annual earnings of $84,600, while those with high school diploma education earn the least with $54,063. Women with an educational attainment of graduate degree earn the most with the average annual earnings of $51,058, while those with college or associate's degree education have the smallest earnings of $32,917.
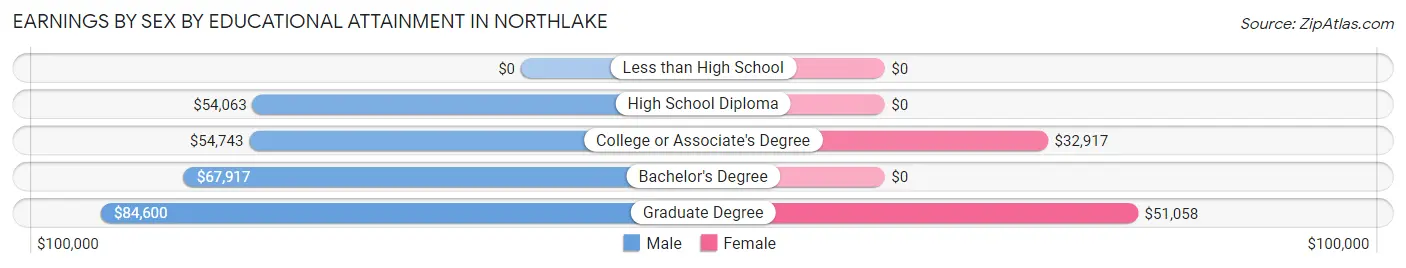
| Educational Attainment | Male Income | Female Income |
| Less than High School | - | - |
| High School Diploma | $54,063 | $0 |
| College or Associate's Degree | $54,743 | $32,917 |
| Bachelor's Degree | $67,917 | $0 |
| Graduate Degree | $84,600 | $51,058 |
| Total | $58,380 | $35,987 |
Family Income in Northlake
Family Income Brackets in Northlake
According to the Northlake family income data, there are 324 families falling into the $100,000 to $149,999 income range, which is the most common income bracket and makes up 29.2% of all families.
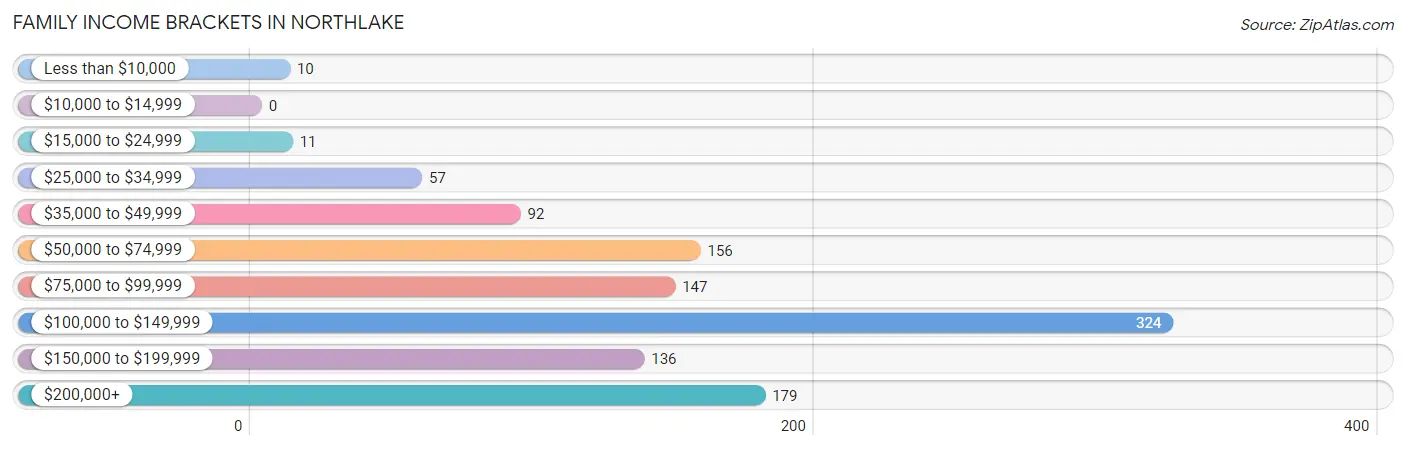
| Income Bracket | # Families | % Families |
| Less than $10,000 | 10 | 0.9% |
| $10,000 to $14,999 | 0 | 0.0% |
| $15,000 to $24,999 | 11 | 1.0% |
| $25,000 to $34,999 | 57 | 5.1% |
| $35,000 to $49,999 | 92 | 8.3% |
| $50,000 to $74,999 | 156 | 14.0% |
| $75,000 to $99,999 | 147 | 13.2% |
| $100,000 to $149,999 | 324 | 29.2% |
| $150,000 to $199,999 | 136 | 12.2% |
| $200,000+ | 179 | 16.1% |
Family Income by Famaliy Size in Northlake
3-person families (212 | 19.1%) account for the highest median family income in Northlake with $129,516 per family, while 2-person families (620 | 55.8%) have the highest median income of $48,102 per family member.
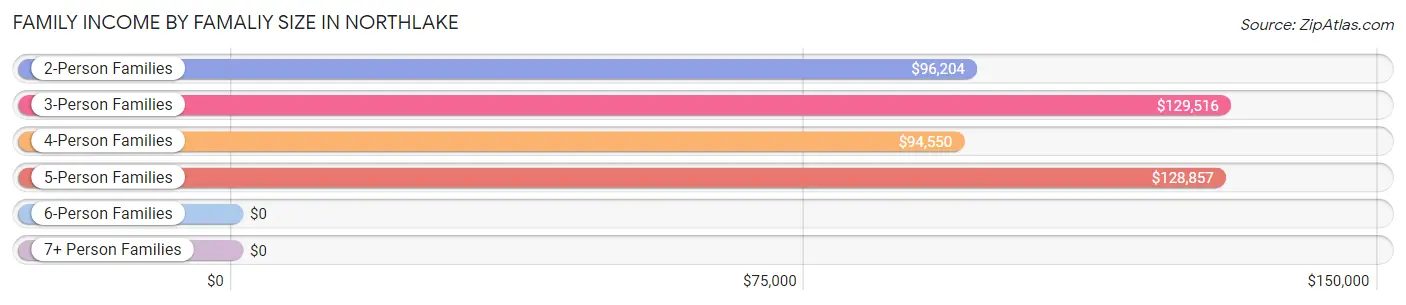
| Income Bracket | # Families | Median Income |
| 2-Person Families | 620 (55.8%) | $96,204 |
| 3-Person Families | 212 (19.1%) | $129,516 |
| 4-Person Families | 150 (13.5%) | $94,550 |
| 5-Person Families | 86 (7.7%) | $128,857 |
| 6-Person Families | 34 (3.1%) | $0 |
| 7+ Person Families | 9 (0.8%) | $0 |
| Total | 1,111 (100.0%) | $106,701 |
Family Income by Number of Earners in Northlake
The median family income in Northlake is $106,701, with families comprising 3+ earners (110) having the highest median family income of $207,984, while families with no earners (184) have the lowest median family income of $44,915, accounting for 9.9% and 16.6% of families, respectively.
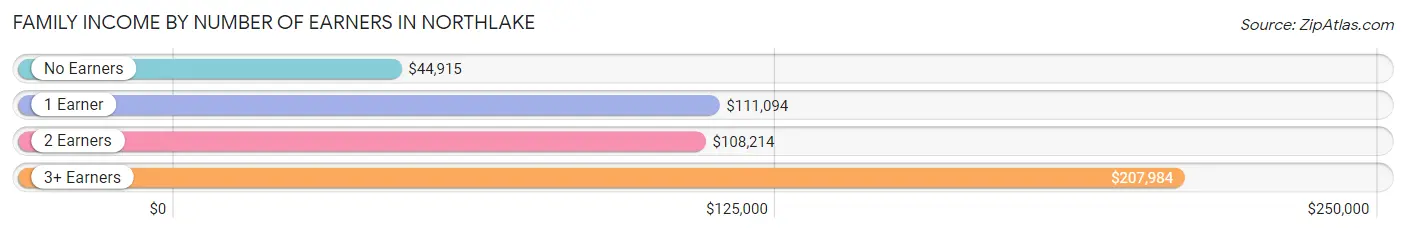
| Number of Earners | # Families | Median Income |
| No Earners | 184 (16.6%) | $44,915 |
| 1 Earner | 433 (39.0%) | $111,094 |
| 2 Earners | 384 (34.6%) | $108,214 |
| 3+ Earners | 110 (9.9%) | $207,984 |
| Total | 1,111 (100.0%) | $106,701 |
Household Income in Northlake
Household Income Brackets in Northlake
With 386 households falling in the category, the $100,000 to $149,999 income range is the most frequent in Northlake, accounting for 23.8% of all households. In contrast, only 21 households (1.3%) fall into the $10,000 to $14,999 income bracket, making it the least populous group.
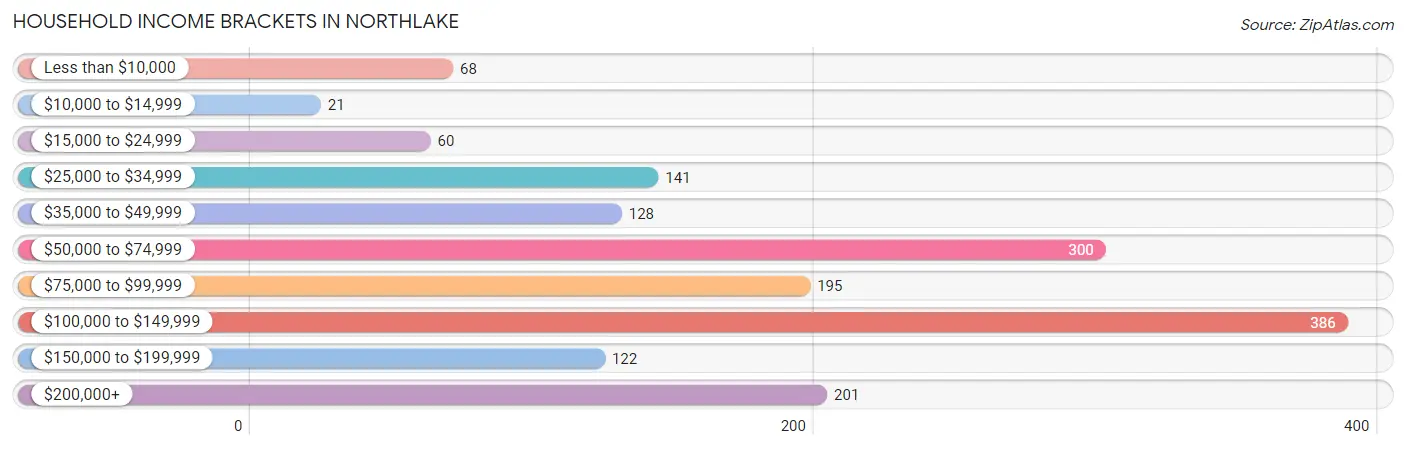
| Income Bracket | # Households | % Households |
| Less than $10,000 | 68 | 4.2% |
| $10,000 to $14,999 | 21 | 1.3% |
| $15,000 to $24,999 | 60 | 3.7% |
| $25,000 to $34,999 | 141 | 8.7% |
| $35,000 to $49,999 | 128 | 7.9% |
| $50,000 to $74,999 | 300 | 18.5% |
| $75,000 to $99,999 | 195 | 12.0% |
| $100,000 to $149,999 | 386 | 23.8% |
| $150,000 to $199,999 | 122 | 7.5% |
| $200,000+ | 201 | 12.4% |
Household Income by Householder Age in Northlake
The median household income in Northlake is $93,271, with the highest median household income of $111,719 found in the 25 to 44 years age bracket for the primary householder. A total of 379 households (23.4%) fall into this category. Meanwhile, the 15 to 24 years age bracket for the primary householder has the lowest median household income of $0, with 37 households (2.3%) in this group.
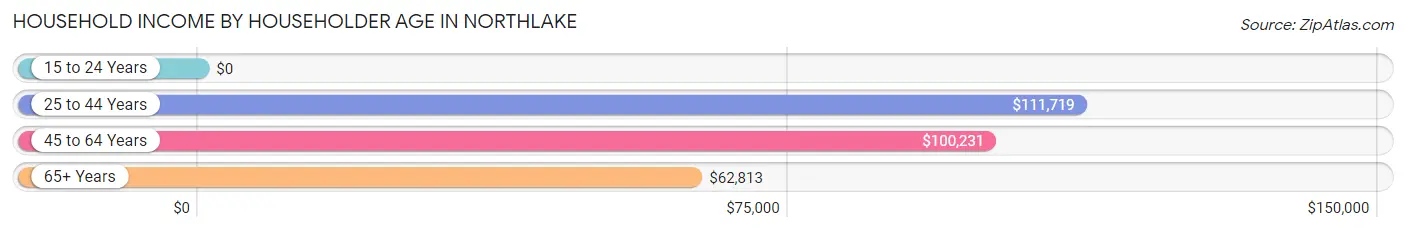
| Income Bracket | # Households | Median Income |
| 15 to 24 Years | 37 (2.3%) | $0 |
| 25 to 44 Years | 379 (23.4%) | $111,719 |
| 45 to 64 Years | 579 (35.7%) | $100,231 |
| 65+ Years | 628 (38.7%) | $62,813 |
| Total | 1,623 (100.0%) | $93,271 |
Poverty in Northlake
Income Below Poverty by Sex and Age in Northlake
With 7.1% poverty level for males and 12.3% for females among the residents of Northlake, 6 to 11 year old males and 12 to 14 year old females are the most vulnerable to poverty, with 80 males (25.8%) and 99 females (97.1%) in their respective age groups living below the poverty level.
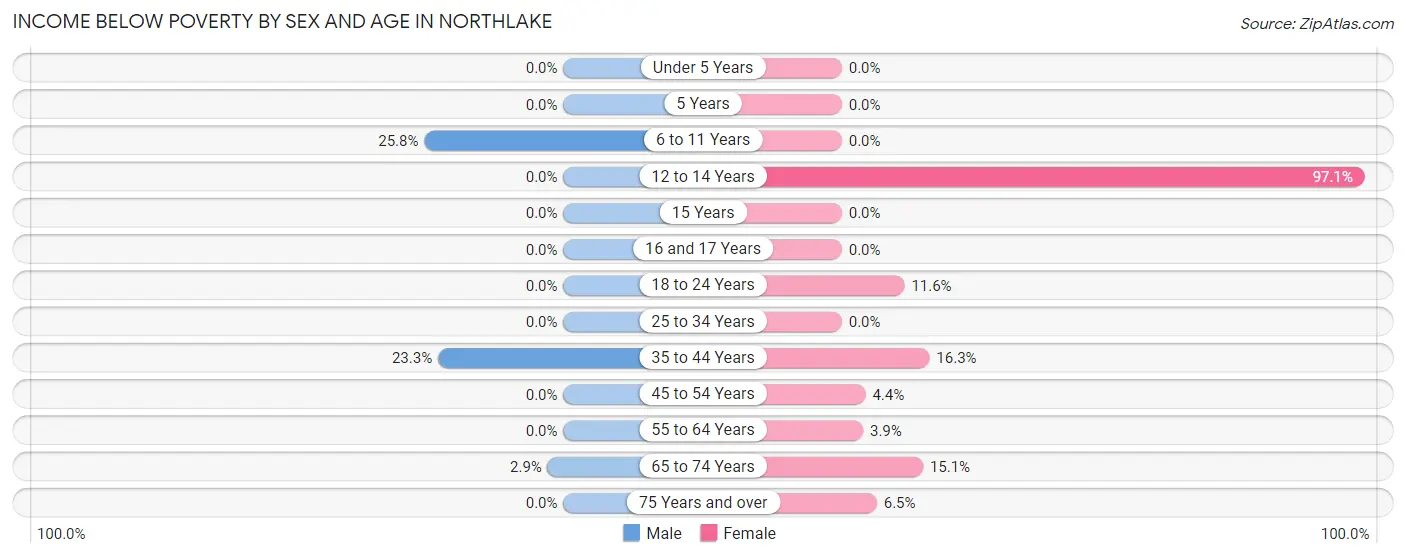
| Age Bracket | Male | Female |
| Under 5 Years | 0 (0.0%) | 0 (0.0%) |
| 5 Years | 0 (0.0%) | 0 (0.0%) |
| 6 to 11 Years | 80 (25.8%) | 0 (0.0%) |
| 12 to 14 Years | 0 (0.0%) | 99 (97.1%) |
| 15 Years | 0 (0.0%) | 0 (0.0%) |
| 16 and 17 Years | 0 (0.0%) | 0 (0.0%) |
| 18 to 24 Years | 0 (0.0%) | 15 (11.6%) |
| 25 to 34 Years | 0 (0.0%) | 0 (0.0%) |
| 35 to 44 Years | 47 (23.3%) | 47 (16.3%) |
| 45 to 54 Years | 0 (0.0%) | 11 (4.4%) |
| 55 to 64 Years | 0 (0.0%) | 10 (3.9%) |
| 65 to 74 Years | 10 (2.9%) | 53 (15.1%) |
| 75 Years and over | 0 (0.0%) | 15 (6.5%) |
| Total | 137 (7.1%) | 250 (12.3%) |
Income Above Poverty by Sex and Age in Northlake
According to the poverty statistics in Northlake, males aged under 5 years and females aged under 5 years are the age groups that are most secure financially, with 100.0% of males and 100.0% of females in these age groups living above the poverty line.
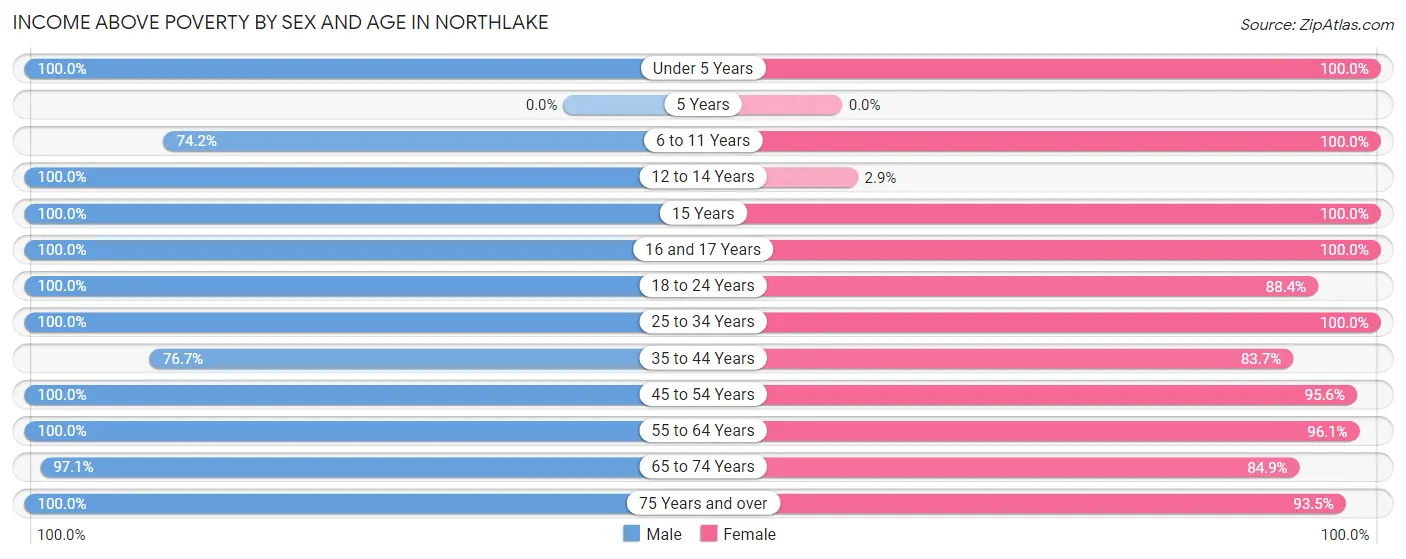
| Age Bracket | Male | Female |
| Under 5 Years | 92 (100.0%) | 93 (100.0%) |
| 5 Years | 0 (0.0%) | 0 (0.0%) |
| 6 to 11 Years | 230 (74.2%) | 65 (100.0%) |
| 12 to 14 Years | 36 (100.0%) | 3 (2.9%) |
| 15 Years | 12 (100.0%) | 10 (100.0%) |
| 16 and 17 Years | 48 (100.0%) | 37 (100.0%) |
| 18 to 24 Years | 93 (100.0%) | 114 (88.4%) |
| 25 to 34 Years | 194 (100.0%) | 218 (100.0%) |
| 35 to 44 Years | 155 (76.7%) | 242 (83.7%) |
| 45 to 54 Years | 215 (100.0%) | 239 (95.6%) |
| 55 to 64 Years | 248 (100.0%) | 244 (96.1%) |
| 65 to 74 Years | 334 (97.1%) | 299 (84.9%) |
| 75 Years and over | 141 (100.0%) | 216 (93.5%) |
| Total | 1,798 (92.9%) | 1,780 (87.7%) |
Income Below Poverty Among Married-Couple Families in Northlake
The poverty statistics for married-couple families in Northlake show that 4.2% or 44 of the total 1,054 families live below the poverty line. Families with 3 or 4 children have the highest poverty rate of 33.3%, comprising of 34 families. On the other hand, families with 1 or 2 children have the lowest poverty rate of 0.0%, which includes 0 families.
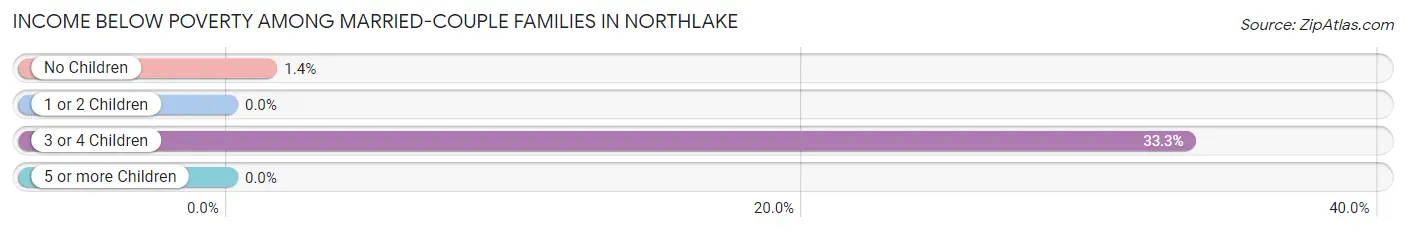
| Children | Above Poverty | Below Poverty |
| No Children | 719 (98.6%) | 10 (1.4%) |
| 1 or 2 Children | 223 (100.0%) | 0 (0.0%) |
| 3 or 4 Children | 68 (66.7%) | 34 (33.3%) |
| 5 or more Children | 0 (0.0%) | 0 (0.0%) |
| Total | 1,010 (95.8%) | 44 (4.2%) |
Income Below Poverty Among Single-Parent Households in Northlake
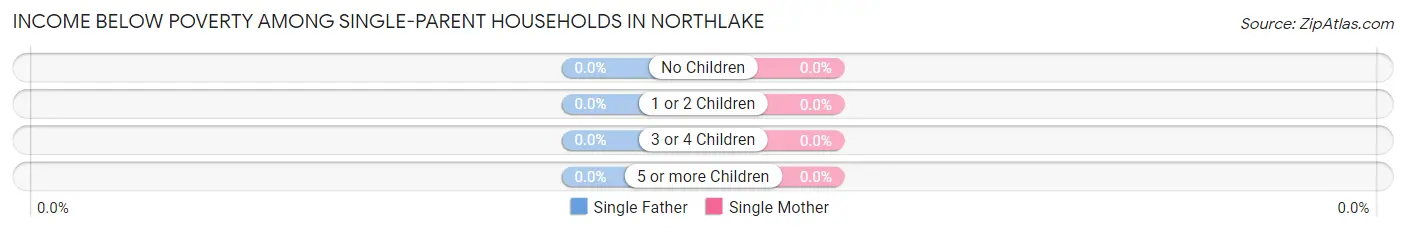
| Children | Single Father | Single Mother |
| No Children | 0 (0.0%) | 0 (0.0%) |
| 1 or 2 Children | 0 (0.0%) | 0 (0.0%) |
| 3 or 4 Children | 0 (0.0%) | 0 (0.0%) |
| 5 or more Children | 0 (0.0%) | 0 (0.0%) |
| Total | 0 (0.0%) | 0 (0.0%) |
Income Below Poverty Among Married-Couple vs Single-Parent Households in Northlake
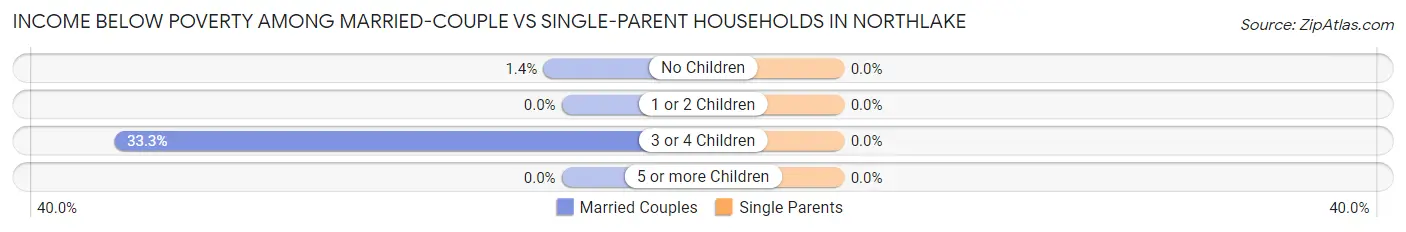
| Children | Married-Couple Families | Single-Parent Households |
| No Children | 10 (1.4%) | 0 (0.0%) |
| 1 or 2 Children | 0 (0.0%) | 0 (0.0%) |
| 3 or 4 Children | 34 (33.3%) | 0 (0.0%) |
| 5 or more Children | 0 (0.0%) | 0 (0.0%) |
| Total | 44 (4.2%) | 0 (0.0%) |
Race in Northlake
The most populous races in Northlake are White / Caucasian (3,316 | 83.1%), Black / African American (486 | 12.2%), and Asian (67 | 1.7%).
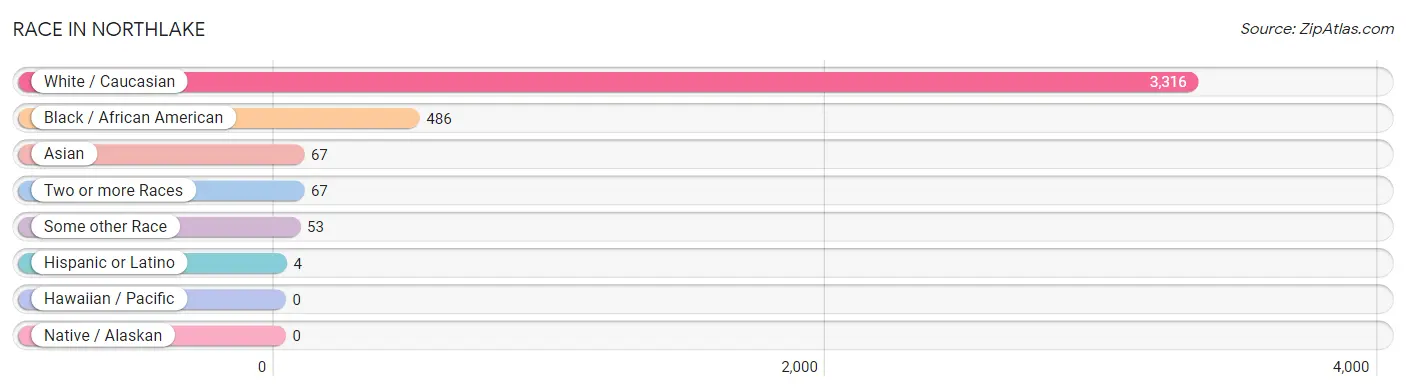
| Race | # Population | % Population |
| Asian | 67 | 1.7% |
| Black / African American | 486 | 12.2% |
| Hawaiian / Pacific | 0 | 0.0% |
| Hispanic or Latino | 4 | 0.1% |
| Native / Alaskan | 0 | 0.0% |
| White / Caucasian | 3,316 | 83.1% |
| Two or more Races | 67 | 1.7% |
| Some other Race | 53 | 1.3% |
| Total | 3,989 | 100.0% |
Ancestry in Northlake
The most populous ancestries reported in Northlake are German (670 | 16.8%), English (604 | 15.1%), Irish (603 | 15.1%), Norwegian (297 | 7.4%), and Polish (229 | 5.7%), together accounting for 60.3% of all Northlake residents.
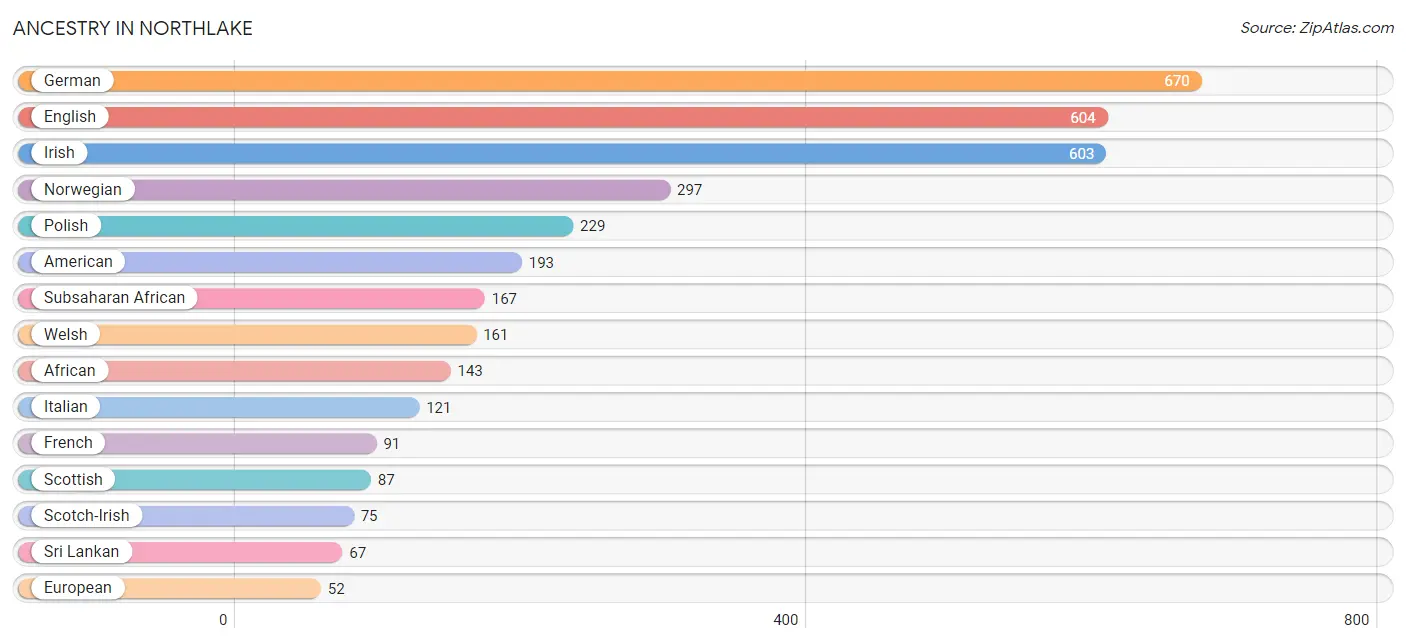
| Ancestry | # Population | % Population |
| African | 143 | 3.6% |
| American | 193 | 4.8% |
| Austrian | 13 | 0.3% |
| Bhutanese | 12 | 0.3% |
| Blackfeet | 24 | 0.6% |
| British | 27 | 0.7% |
| Bulgarian | 11 | 0.3% |
| Cherokee | 9 | 0.2% |
| Chippewa | 3 | 0.1% |
| Czech | 13 | 0.3% |
| Dutch | 6 | 0.2% |
| English | 604 | 15.1% |
| European | 52 | 1.3% |
| French | 91 | 2.3% |
| German | 670 | 16.8% |
| Hungarian | 10 | 0.3% |
| Irish | 603 | 15.1% |
| Italian | 121 | 3.0% |
| Mexican | 4 | 0.1% |
| Norwegian | 297 | 7.4% |
| Polish | 229 | 5.7% |
| Portuguese | 3 | 0.1% |
| Romanian | 28 | 0.7% |
| Russian | 5 | 0.1% |
| Scandinavian | 16 | 0.4% |
| Scotch-Irish | 75 | 1.9% |
| Scottish | 87 | 2.2% |
| Sri Lankan | 67 | 1.7% |
| Subsaharan African | 167 | 4.2% |
| Swedish | 10 | 0.3% |
| Welsh | 161 | 4.0% | View All 31 Rows |
Immigrants in Northlake
The most numerous immigrant groups reported in Northlake came from Europe (53 | 1.3%), Asia (43 | 1.1%), South Eastern Asia (43 | 1.1%), Vietnam (43 | 1.1%), and Africa (42 | 1.1%), together accounting for 5.6% of all Northlake residents.
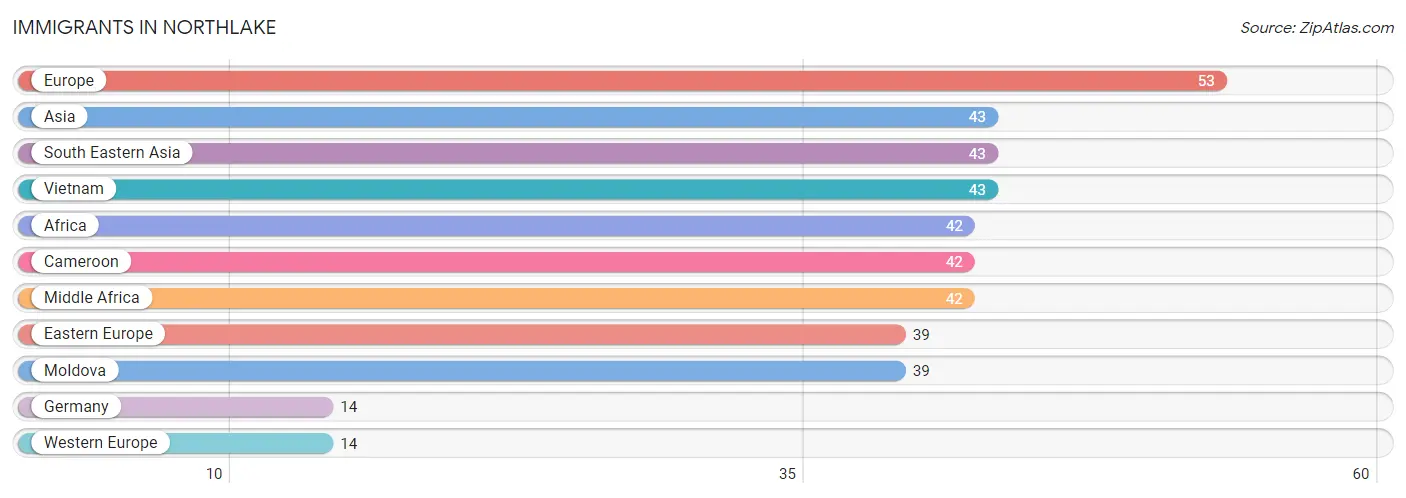
| Immigration Origin | # Population | % Population |
| Africa | 42 | 1.1% |
| Asia | 43 | 1.1% |
| Cameroon | 42 | 1.1% |
| Eastern Europe | 39 | 1.0% |
| Europe | 53 | 1.3% |
| Germany | 14 | 0.4% |
| Middle Africa | 42 | 1.1% |
| Moldova | 39 | 1.0% |
| South Eastern Asia | 43 | 1.1% |
| Vietnam | 43 | 1.1% |
| Western Europe | 14 | 0.4% | View All 11 Rows |
Sex and Age in Northlake
Sex and Age in Northlake
The most populous age groups in Northlake are 5 to 9 Years (269 | 13.8%) for men and 35 to 39 Years (254 | 12.4%) for women.
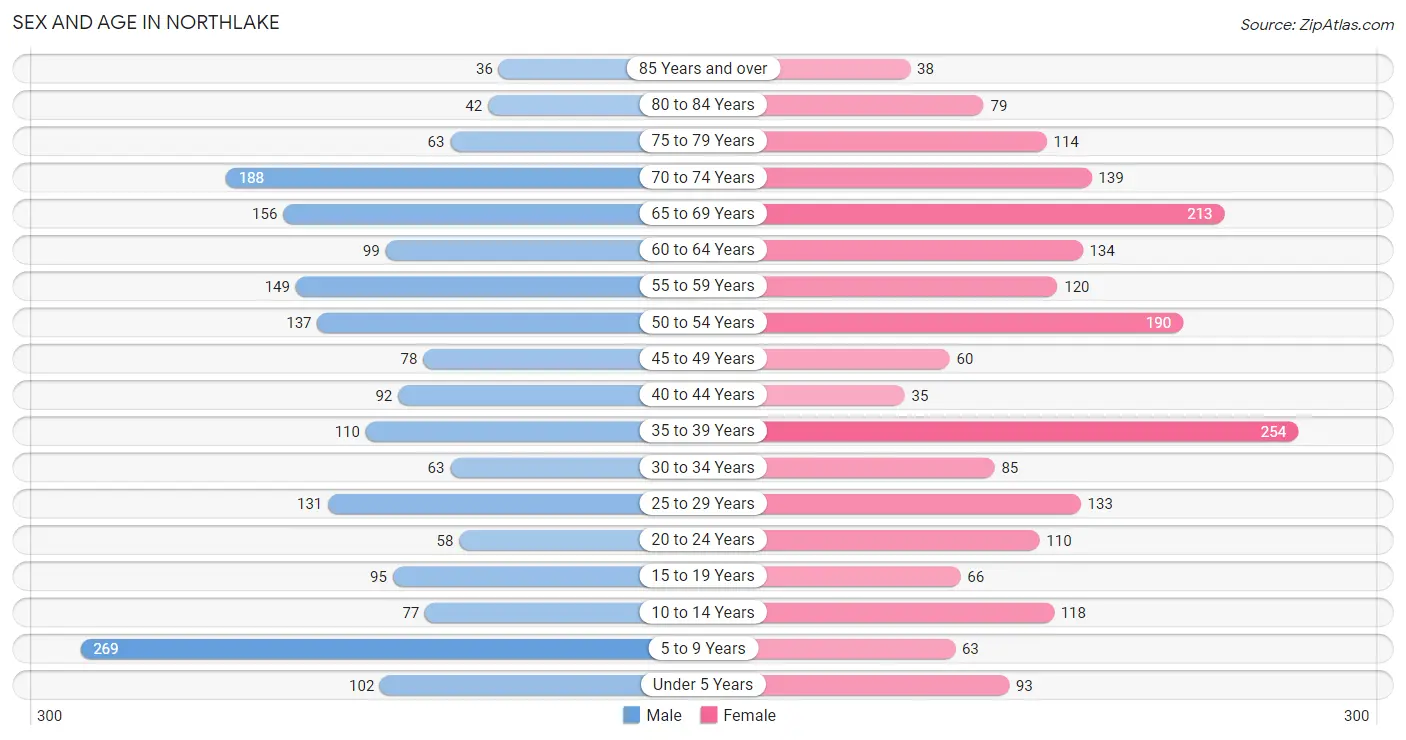
| Age Bracket | Male | Female |
| Under 5 Years | 102 (5.2%) | 93 (4.5%) |
| 5 to 9 Years | 269 (13.8%) | 63 (3.1%) |
| 10 to 14 Years | 77 (4.0%) | 118 (5.8%) |
| 15 to 19 Years | 95 (4.9%) | 66 (3.2%) |
| 20 to 24 Years | 58 (3.0%) | 110 (5.4%) |
| 25 to 29 Years | 131 (6.7%) | 133 (6.5%) |
| 30 to 34 Years | 63 (3.2%) | 85 (4.2%) |
| 35 to 39 Years | 110 (5.7%) | 254 (12.4%) |
| 40 to 44 Years | 92 (4.7%) | 35 (1.7%) |
| 45 to 49 Years | 78 (4.0%) | 60 (2.9%) |
| 50 to 54 Years | 137 (7.0%) | 190 (9.3%) |
| 55 to 59 Years | 149 (7.7%) | 120 (5.9%) |
| 60 to 64 Years | 99 (5.1%) | 134 (6.6%) |
| 65 to 69 Years | 156 (8.0%) | 213 (10.4%) |
| 70 to 74 Years | 188 (9.7%) | 139 (6.8%) |
| 75 to 79 Years | 63 (3.2%) | 114 (5.6%) |
| 80 to 84 Years | 42 (2.2%) | 79 (3.9%) |
| 85 Years and over | 36 (1.8%) | 38 (1.9%) |
| Total | 1,945 (100.0%) | 2,044 (100.0%) |
Families and Households in Northlake
Median Family Size in Northlake
The median family size in Northlake is 3.00 persons per family, with single male/father families (12 | 1.1%) accounting for the largest median family size of 3.83 persons per family. On the other hand, single female/mother families (45 | 4.1%) represent the smallest median family size with 2.78 persons per family.
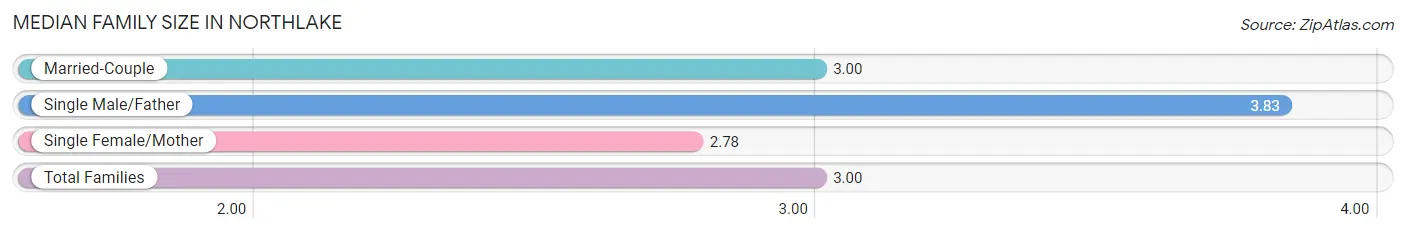
| Family Type | # Families | Family Size |
| Married-Couple | 1,054 (94.9%) | 3.00 |
| Single Male/Father | 12 (1.1%) | 3.83 |
| Single Female/Mother | 45 (4.1%) | 2.78 |
| Total Families | 1,111 (100.0%) | 3.00 |
Median Household Size in Northlake
The median household size in Northlake is 2.46 persons per household, with single male/father households (12 | 0.7%) accounting for the largest median household size of 5 persons per household. non-family households (512 | 31.6%) represent the smallest median household size with 1.25 persons per household.
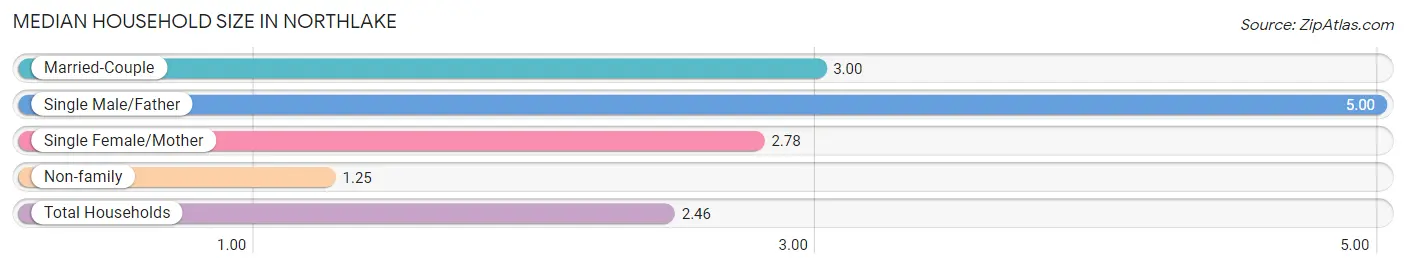
| Household Type | # Households | Household Size |
| Married-Couple | 1,054 (64.9%) | 3.00 |
| Single Male/Father | 12 (0.7%) | 5.00 |
| Single Female/Mother | 45 (2.8%) | 2.78 |
| Non-family | 512 (31.6%) | 1.25 |
| Total Households | 1,623 (100.0%) | 2.46 |
Household Size by Marriage Status in Northlake
Out of a total of 1,623 households in Northlake, 1,111 (68.4%) are family households, while 512 (31.6%) are nonfamily households. The most numerous type of family households are 2-person households, comprising 620, and the most common type of nonfamily households are 1-person households, comprising 451.
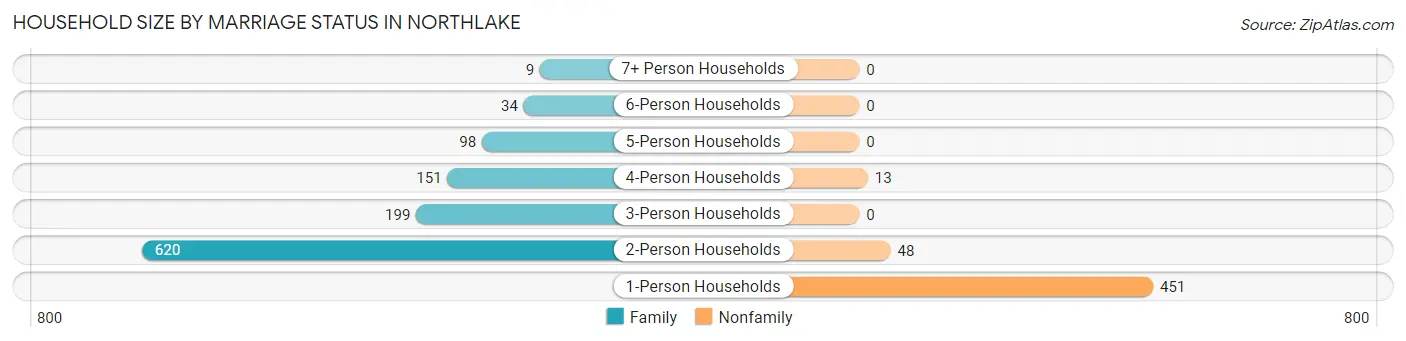
| Household Size | Family Households | Nonfamily Households |
| 1-Person Households | - | 451 (27.8%) |
| 2-Person Households | 620 (38.2%) | 48 (3.0%) |
| 3-Person Households | 199 (12.3%) | 0 (0.0%) |
| 4-Person Households | 151 (9.3%) | 13 (0.8%) |
| 5-Person Households | 98 (6.0%) | 0 (0.0%) |
| 6-Person Households | 34 (2.1%) | 0 (0.0%) |
| 7+ Person Households | 9 (0.5%) | 0 (0.0%) |
| Total | 1,111 (68.4%) | 512 (31.6%) |
Female Fertility in Northlake
Fertility by Age in Northlake
Average fertility rate in Northlake is 50.0 births per 1,000 women. Women in the age bracket of 20 to 34 years have the highest fertility rate with 79.0 births per 1,000 women. Women in the age bracket of 20 to 34 years acount for 70.3% of all women with births.
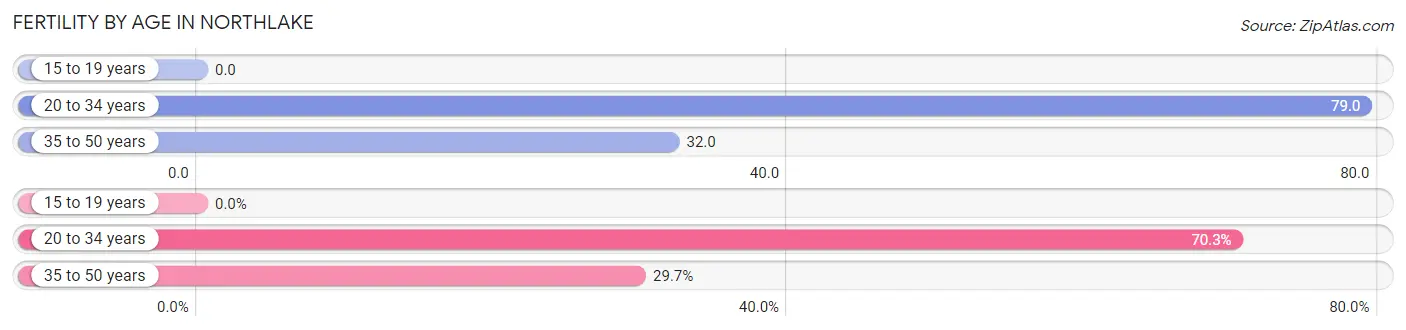
| Age Bracket | Women with Births | Births / 1,000 Women |
| 15 to 19 years | 0 (0.0%) | 0.0 |
| 20 to 34 years | 26 (70.3%) | 79.0 |
| 35 to 50 years | 11 (29.7%) | 32.0 |
| Total | 37 (100.0%) | 50.0 |
Fertility by Age by Marriage Status in Northlake
62.2% of women with births (37) in Northlake are married. The highest percentage of unmarried women with births falls into 20 to 34 years age bracket with 53.8% of them unmarried at the time of birth, while the lowest percentage of unmarried women with births belong to 35 to 50 years age bracket with 0.0% of them unmarried.
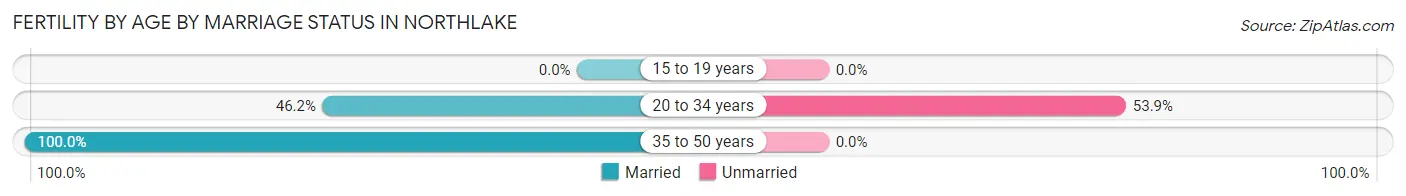
| Age Bracket | Married | Unmarried |
| 15 to 19 years | 0 (0.0%) | 0 (0.0%) |
| 20 to 34 years | 12 (46.2%) | 14 (53.8%) |
| 35 to 50 years | 11 (100.0%) | 0 (0.0%) |
| Total | 23 (62.2%) | 14 (37.8%) |
Fertility by Education in Northlake
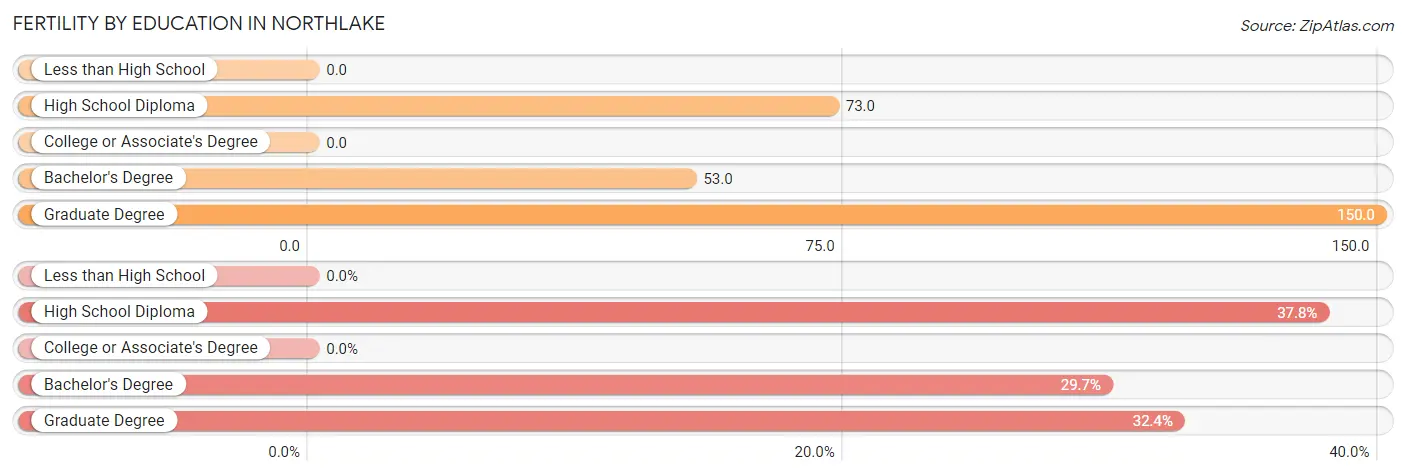
| Educational Attainment | Women with Births | Births / 1,000 Women |
| Less than High School | 0 (0.0%) | 0.0 |
| High School Diploma | 14 (37.8%) | 73.0 |
| College or Associate's Degree | 0 (0.0%) | 0.0 |
| Bachelor's Degree | 11 (29.7%) | 53.0 |
| Graduate Degree | 12 (32.4%) | 150.0 |
| Total | 37 (100.0%) | 50.0 |
Fertility by Education by Marriage Status in Northlake
37.8% of women with births in Northlake are unmarried. Women with the educational attainment of bachelor's degree are most likely to be married with 100.0% of them married at childbirth, while women with the educational attainment of high school diploma are least likely to be married with 100.0% of them unmarried at childbirth.
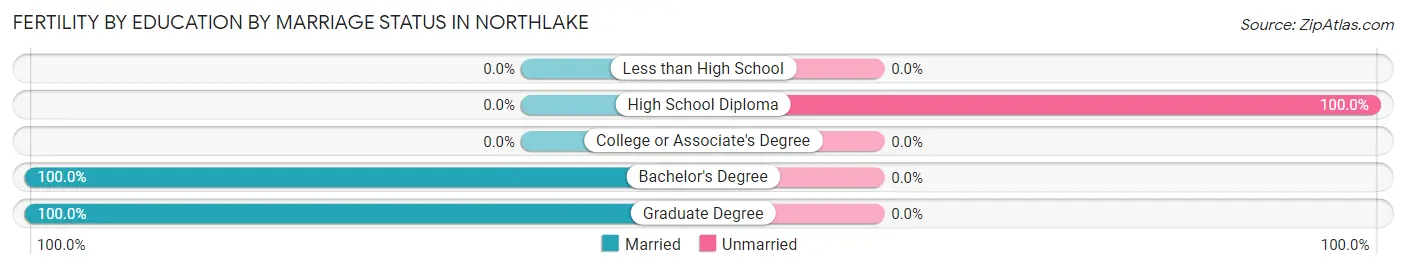
| Educational Attainment | Married | Unmarried |
| Less than High School | 0 (0.0%) | 0 (0.0%) |
| High School Diploma | 0 (0.0%) | 14 (100.0%) |
| College or Associate's Degree | 0 (0.0%) | 0 (0.0%) |
| Bachelor's Degree | 11 (100.0%) | 0 (0.0%) |
| Graduate Degree | 12 (100.0%) | 0 (0.0%) |
| Total | 23 (62.2%) | 14 (37.8%) |
Employment Characteristics in Northlake
Employment by Class of Employer in Northlake
Among the 1,698 employed individuals in Northlake, private company employees (1,069 | 63.0%), not-for-profit organizations (209 | 12.3%), and self-employed (not incorporated) (136 | 8.0%) make up the most common classes of employment.
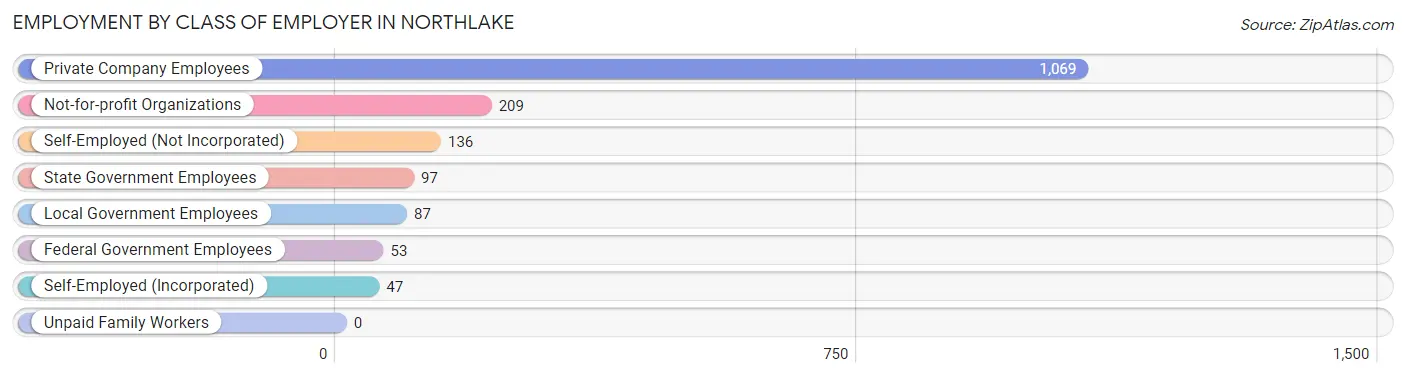
| Employer Class | # Employees | % Employees |
| Private Company Employees | 1,069 | 63.0% |
| Self-Employed (Incorporated) | 47 | 2.8% |
| Self-Employed (Not Incorporated) | 136 | 8.0% |
| Not-for-profit Organizations | 209 | 12.3% |
| Local Government Employees | 87 | 5.1% |
| State Government Employees | 97 | 5.7% |
| Federal Government Employees | 53 | 3.1% |
| Unpaid Family Workers | 0 | 0.0% |
| Total | 1,698 | 100.0% |
Employment Status by Age in Northlake
According to the labor force statistics for Northlake, out of the total population over 16 years of age (3,245), 57.2% or 1,856 individuals are in the labor force, with 5.6% or 104 of them unemployed. The age group with the highest labor force participation rate is 30 to 34 years, with 100.0% or 148 individuals in the labor force. Within the labor force, the 65 to 74 years age range has the highest percentage of unemployed individuals, with 14.4% or 31 of them being unemployed.
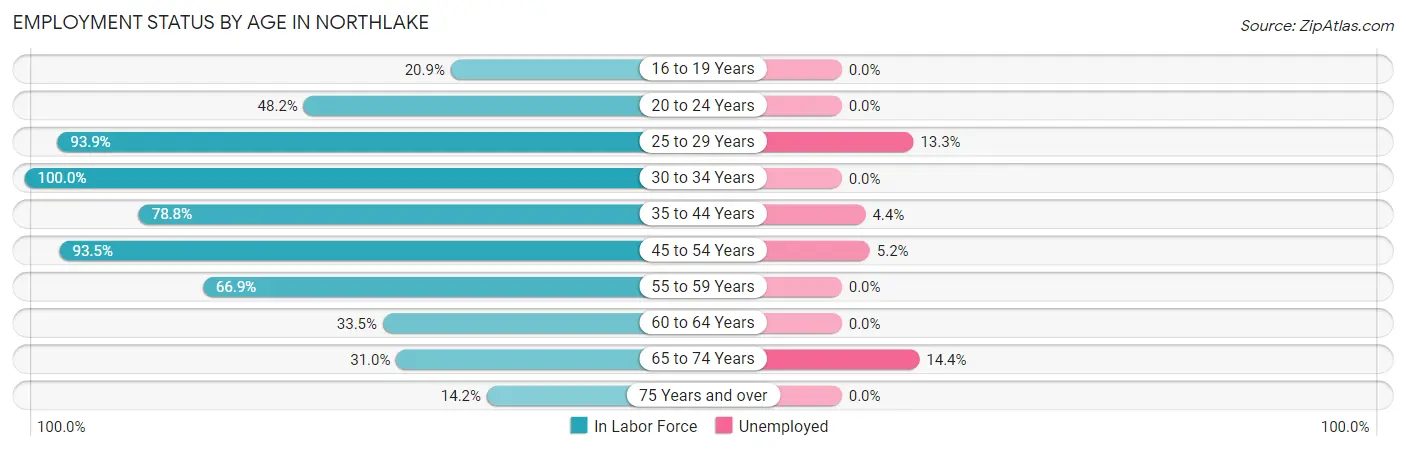
| Age Bracket | In Labor Force | Unemployed |
| 16 to 19 Years | 29 (20.9%) | 0 (0.0%) |
| 20 to 24 Years | 81 (48.2%) | 0 (0.0%) |
| 25 to 29 Years | 248 (93.9%) | 33 (13.3%) |
| 30 to 34 Years | 148 (100.0%) | 0 (0.0%) |
| 35 to 44 Years | 387 (78.8%) | 17 (4.4%) |
| 45 to 54 Years | 435 (93.5%) | 23 (5.2%) |
| 55 to 59 Years | 180 (66.9%) | 0 (0.0%) |
| 60 to 64 Years | 78 (33.5%) | 0 (0.0%) |
| 65 to 74 Years | 216 (31.0%) | 31 (14.4%) |
| 75 Years and over | 53 (14.2%) | 0 (0.0%) |
| Total | 1,856 (57.2%) | 104 (5.6%) |
Employment Status by Educational Attainment in Northlake
According to labor force statistics for Northlake, 78.9% of individuals (1,475) out of the total population between 25 and 64 years of age (1,870) are in the labor force, with 4.9% or 72 of them being unemployed. The group with the highest labor force participation rate are those with the educational attainment of less than high school, with 100.0% or 12 individuals in the labor force. Within the labor force, individuals with college / associate degree education have the highest percentage of unemployment, with 9.5% or 46 of them being unemployed.
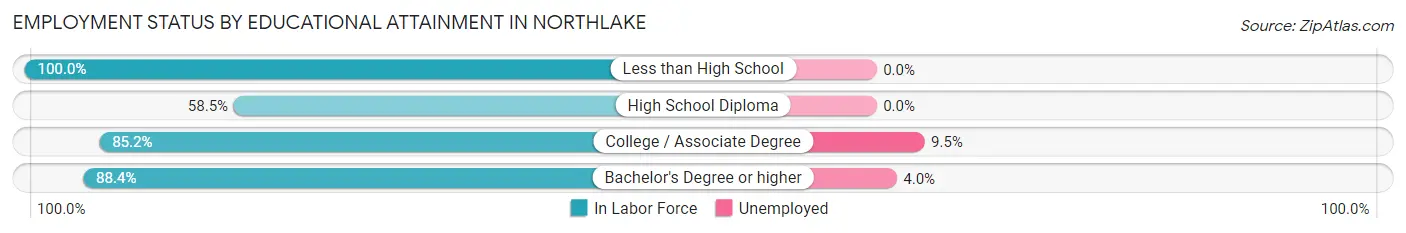
| Educational Attainment | In Labor Force | Unemployed |
| Less than High School | 12 (100.0%) | 0 (0.0%) |
| High School Diploma | 314 (58.5%) | 0 (0.0%) |
| College / Associate Degree | 485 (85.2%) | 54 (9.5%) |
| Bachelor's Degree or higher | 665 (88.4%) | 30 (4.0%) |
| Total | 1,475 (78.9%) | 92 (4.9%) |
Employment Occupations by Sex in Northlake
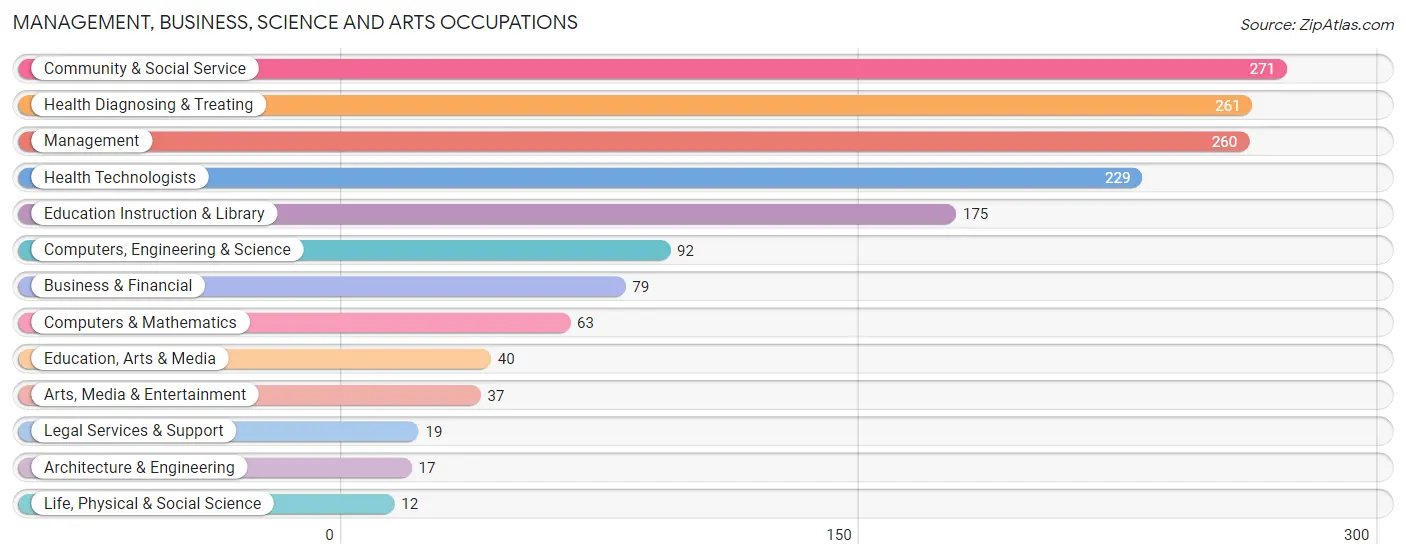
Management, Business, Science and Arts Occupations
The most common Management, Business, Science and Arts occupations in Northlake are Community & Social Service (271 | 15.6%), Health Diagnosing & Treating (261 | 15.0%), Management (260 | 14.9%), Health Technologists (229 | 13.2%), and Education Instruction & Library (175 | 10.1%).
Management, Business, Science and Arts Occupations by Sex
Within the Management, Business, Science and Arts occupations in Northlake, the most male-oriented occupations are Architecture & Engineering (100.0%), Life, Physical & Social Science (100.0%), and Business & Financial (87.3%), while the most female-oriented occupations are Health Diagnosing & Treating (70.9%), Education Instruction & Library (69.1%), and Health Technologists (66.8%).
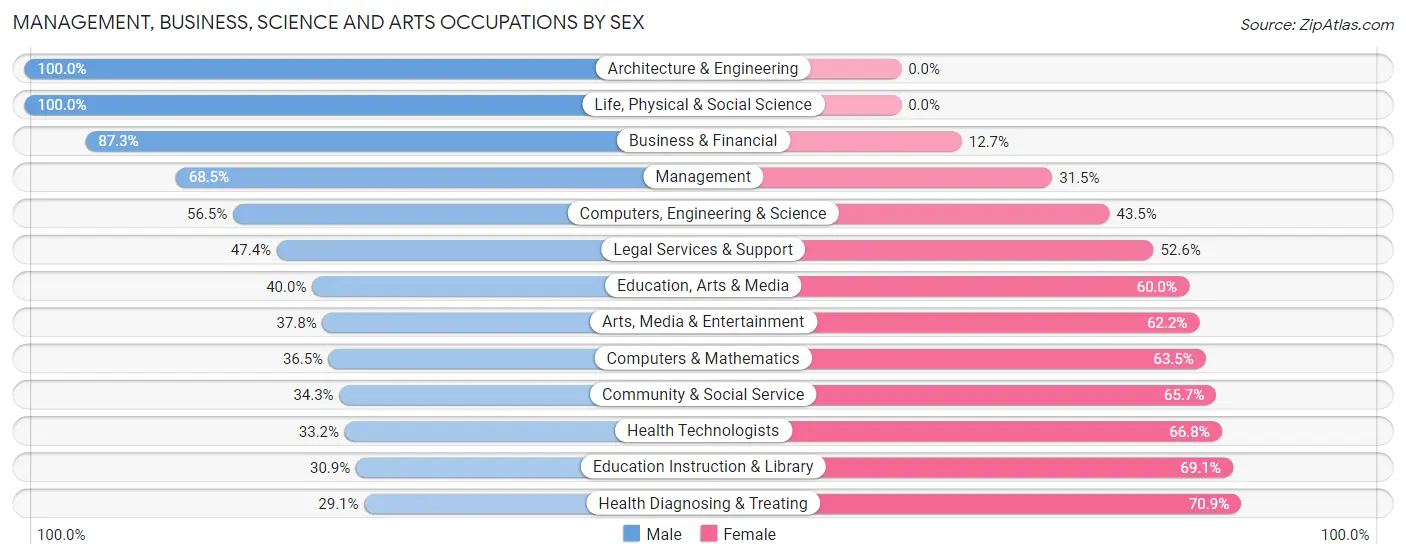
| Occupation | Male | Female |
| Management | 178 (68.5%) | 82 (31.5%) |
| Business & Financial | 69 (87.3%) | 10 (12.7%) |
| Computers, Engineering & Science | 52 (56.5%) | 40 (43.5%) |
| Computers & Mathematics | 23 (36.5%) | 40 (63.5%) |
| Architecture & Engineering | 17 (100.0%) | 0 (0.0%) |
| Life, Physical & Social Science | 12 (100.0%) | 0 (0.0%) |
| Community & Social Service | 93 (34.3%) | 178 (65.7%) |
| Education, Arts & Media | 16 (40.0%) | 24 (60.0%) |
| Legal Services & Support | 9 (47.4%) | 10 (52.6%) |
| Education Instruction & Library | 54 (30.9%) | 121 (69.1%) |
| Arts, Media & Entertainment | 14 (37.8%) | 23 (62.2%) |
| Health Diagnosing & Treating | 76 (29.1%) | 185 (70.9%) |
| Health Technologists | 76 (33.2%) | 153 (66.8%) |
| Total (Category) | 468 (48.6%) | 495 (51.4%) |
| Total (Overall) | 929 (53.4%) | 810 (46.6%) |
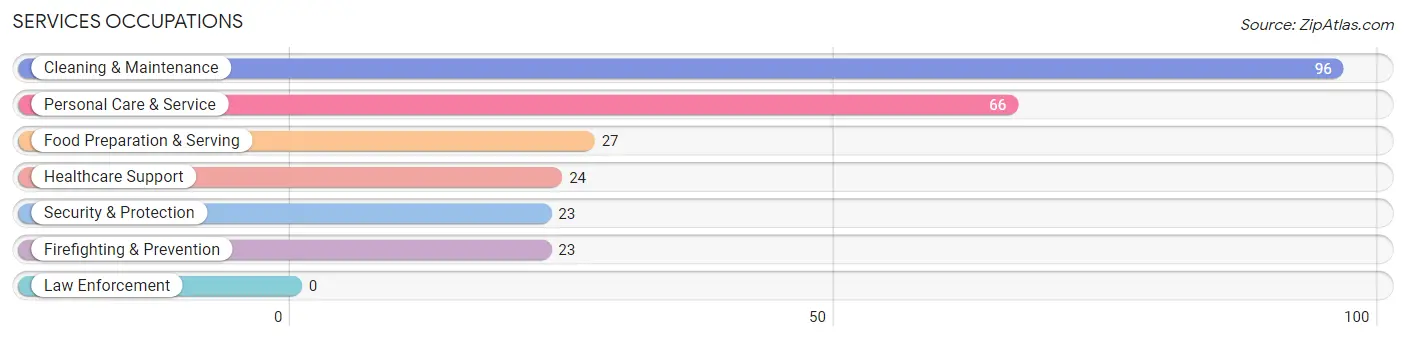
Services Occupations
The most common Services occupations in Northlake are Cleaning & Maintenance (96 | 5.5%), Personal Care & Service (66 | 3.8%), Food Preparation & Serving (27 | 1.5%), Healthcare Support (24 | 1.4%), and Security & Protection (23 | 1.3%).
Services Occupations by Sex
Within the Services occupations in Northlake, the most male-oriented occupations are Security & Protection (100.0%), Firefighting & Prevention (100.0%), and Personal Care & Service (72.7%), while the most female-oriented occupations are Healthcare Support (100.0%), Food Preparation & Serving (88.9%), and Cleaning & Maintenance (60.4%).
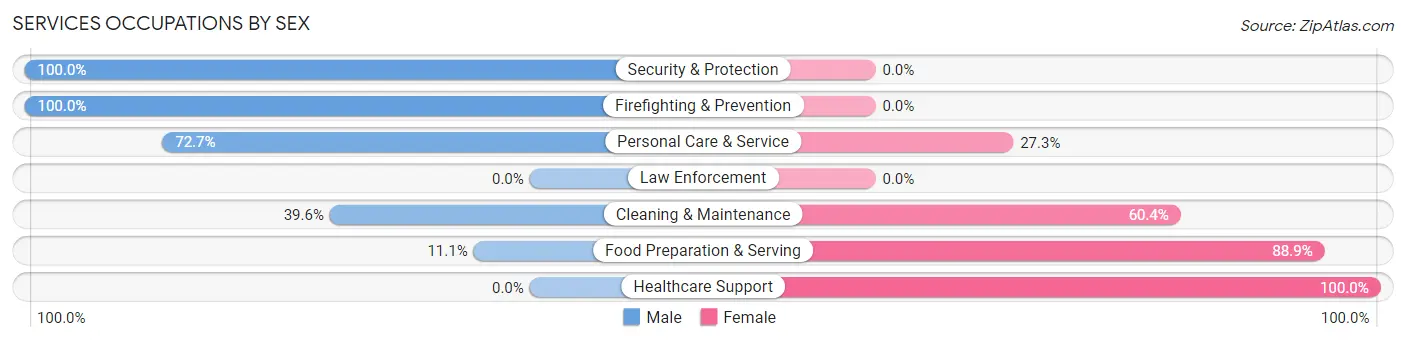
| Occupation | Male | Female |
| Healthcare Support | 0 (0.0%) | 24 (100.0%) |
| Security & Protection | 23 (100.0%) | 0 (0.0%) |
| Firefighting & Prevention | 23 (100.0%) | 0 (0.0%) |
| Law Enforcement | 0 (0.0%) | 0 (0.0%) |
| Food Preparation & Serving | 3 (11.1%) | 24 (88.9%) |
| Cleaning & Maintenance | 38 (39.6%) | 58 (60.4%) |
| Personal Care & Service | 48 (72.7%) | 18 (27.3%) |
| Total (Category) | 112 (47.5%) | 124 (52.5%) |
| Total (Overall) | 929 (53.4%) | 810 (46.6%) |
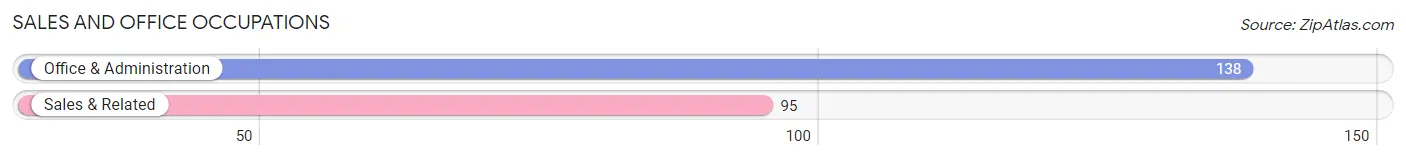
Sales and Office Occupations
The most common Sales and Office occupations in Northlake are Office & Administration (138 | 7.9%), and Sales & Related (95 | 5.5%).
Sales and Office Occupations by Sex
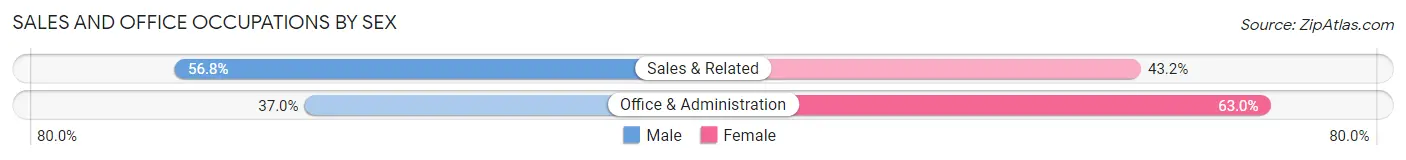
| Occupation | Male | Female |
| Sales & Related | 54 (56.8%) | 41 (43.2%) |
| Office & Administration | 51 (37.0%) | 87 (63.0%) |
| Total (Category) | 105 (45.1%) | 128 (54.9%) |
| Total (Overall) | 929 (53.4%) | 810 (46.6%) |
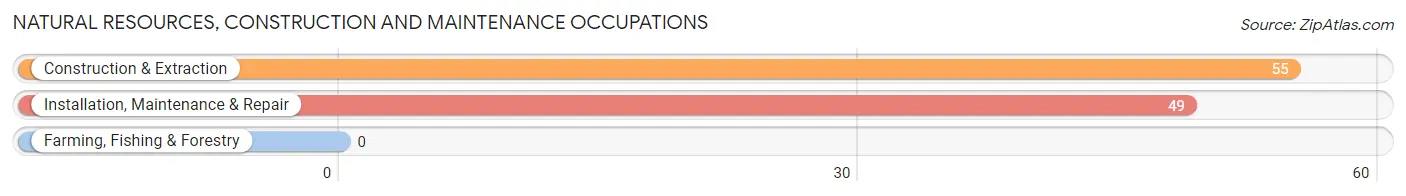
Natural Resources, Construction and Maintenance Occupations
The most common Natural Resources, Construction and Maintenance occupations in Northlake are Construction & Extraction (55 | 3.2%), and Installation, Maintenance & Repair (49 | 2.8%).
Natural Resources, Construction and Maintenance Occupations by Sex
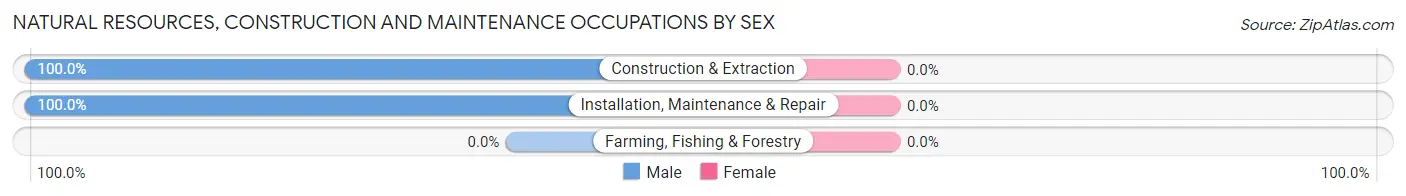
| Occupation | Male | Female |
| Farming, Fishing & Forestry | 0 (0.0%) | 0 (0.0%) |
| Construction & Extraction | 55 (100.0%) | 0 (0.0%) |
| Installation, Maintenance & Repair | 49 (100.0%) | 0 (0.0%) |
| Total (Category) | 104 (100.0%) | 0 (0.0%) |
| Total (Overall) | 929 (53.4%) | 810 (46.6%) |
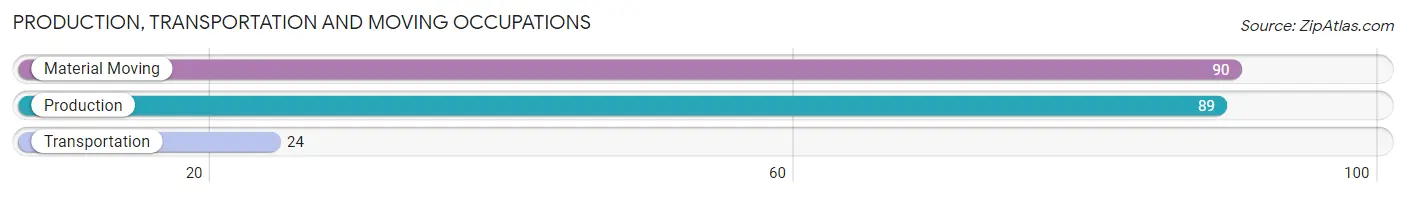
Production, Transportation and Moving Occupations
The most common Production, Transportation and Moving occupations in Northlake are Material Moving (90 | 5.2%), Production (89 | 5.1%), and Transportation (24 | 1.4%).
Production, Transportation and Moving Occupations by Sex
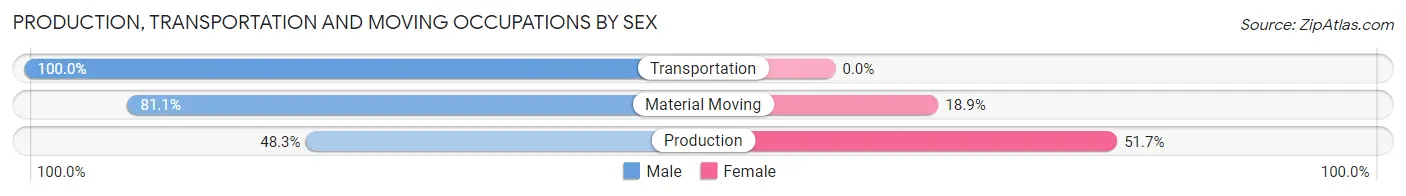
| Occupation | Male | Female |
| Production | 43 (48.3%) | 46 (51.7%) |
| Transportation | 24 (100.0%) | 0 (0.0%) |
| Material Moving | 73 (81.1%) | 17 (18.9%) |
| Total (Category) | 140 (69.0%) | 63 (31.0%) |
| Total (Overall) | 929 (53.4%) | 810 (46.6%) |
Employment Industries by Sex in Northlake
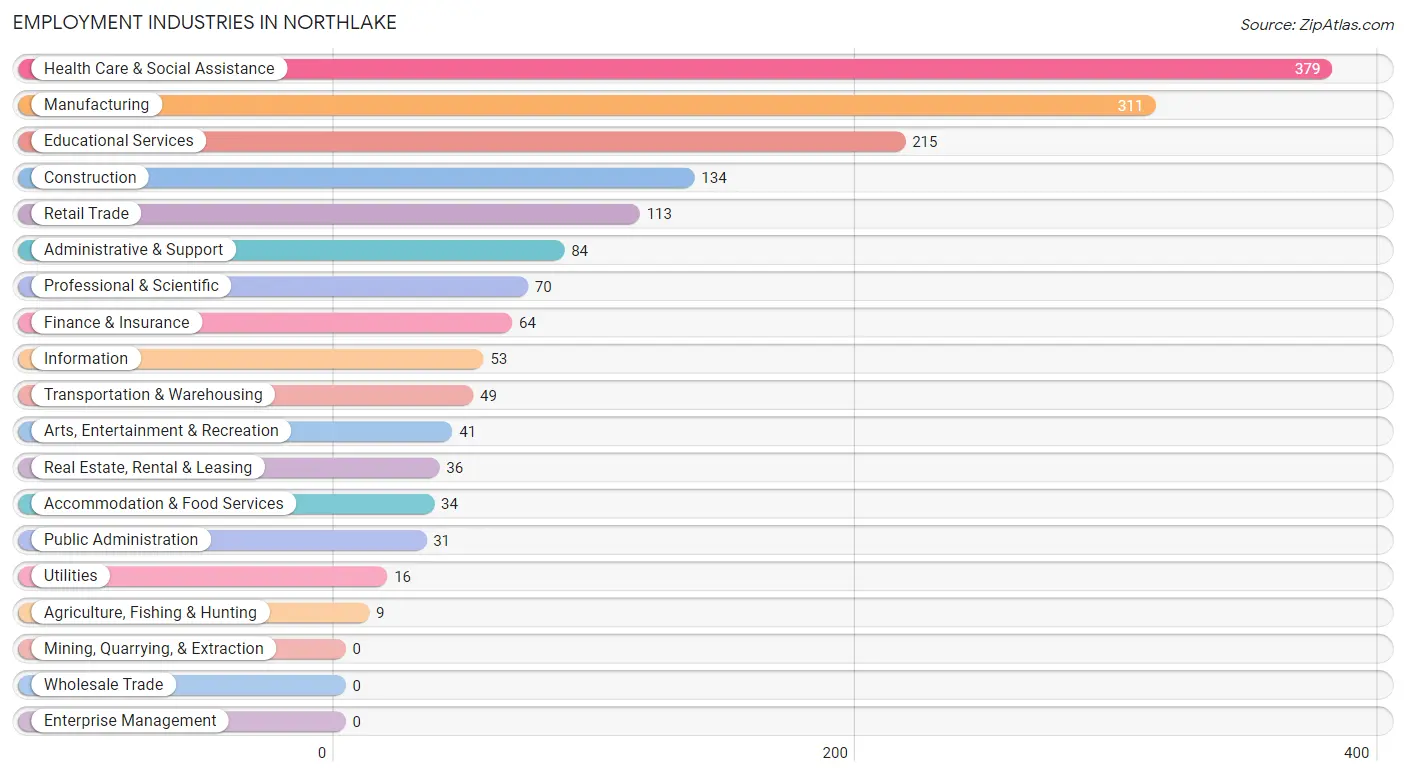
Employment Industries in Northlake
The major employment industries in Northlake include Health Care & Social Assistance (379 | 21.8%), Manufacturing (311 | 17.9%), Educational Services (215 | 12.4%), Construction (134 | 7.7%), and Retail Trade (113 | 6.5%).
Employment Industries by Sex in Northlake
The Northlake industries that see more men than women are Agriculture, Fishing & Hunting (100.0%), Transportation & Warehousing (100.0%), and Utilities (100.0%), whereas the industries that tend to have a higher number of women are Accommodation & Food Services (91.2%), Health Care & Social Assistance (77.6%), and Real Estate, Rental & Leasing (75.0%).
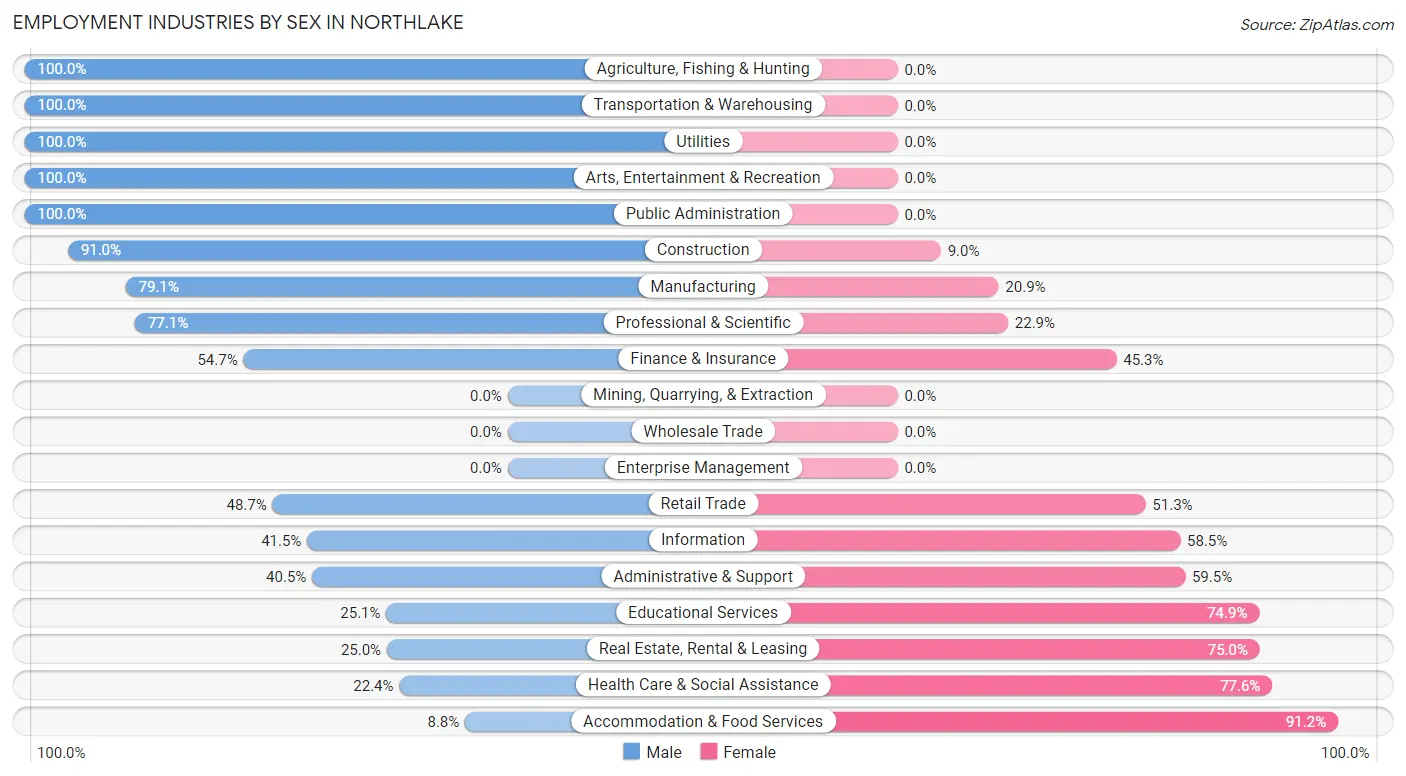
| Industry | Male | Female |
| Agriculture, Fishing & Hunting | 9 (100.0%) | 0 (0.0%) |
| Mining, Quarrying, & Extraction | 0 (0.0%) | 0 (0.0%) |
| Construction | 122 (91.0%) | 12 (9.0%) |
| Manufacturing | 246 (79.1%) | 65 (20.9%) |
| Wholesale Trade | 0 (0.0%) | 0 (0.0%) |
| Retail Trade | 55 (48.7%) | 58 (51.3%) |
| Transportation & Warehousing | 49 (100.0%) | 0 (0.0%) |
| Utilities | 16 (100.0%) | 0 (0.0%) |
| Information | 22 (41.5%) | 31 (58.5%) |
| Finance & Insurance | 35 (54.7%) | 29 (45.3%) |
| Real Estate, Rental & Leasing | 9 (25.0%) | 27 (75.0%) |
| Professional & Scientific | 54 (77.1%) | 16 (22.9%) |
| Enterprise Management | 0 (0.0%) | 0 (0.0%) |
| Administrative & Support | 34 (40.5%) | 50 (59.5%) |
| Educational Services | 54 (25.1%) | 161 (74.9%) |
| Health Care & Social Assistance | 85 (22.4%) | 294 (77.6%) |
| Arts, Entertainment & Recreation | 41 (100.0%) | 0 (0.0%) |
| Accommodation & Food Services | 3 (8.8%) | 31 (91.2%) |
| Public Administration | 31 (100.0%) | 0 (0.0%) |
| Total | 929 (53.4%) | 810 (46.6%) |
Education in Northlake
School Enrollment in Northlake
The most common levels of schooling among the 987 students in Northlake are elementary school (347 | 35.2%), college / undergraduate (207 | 21.0%), and high school (177 | 17.9%).
| School Level | # Students | % Students |
| Nursery / Preschool | 83 | 8.4% |
| Kindergarten | 26 | 2.6% |
| Elementary School | 347 | 35.2% |
| Middle School | 103 | 10.4% |
| High School | 177 | 17.9% |
| College / Undergraduate | 207 | 21.0% |
| Graduate / Professional | 44 | 4.5% |
| Total | 987 | 100.0% |
School Enrollment by Age by Funding Source in Northlake
Out of a total of 987 students who are enrolled in schools in Northlake, 198 (20.1%) attend a private institution, while the remaining 789 (79.9%) are enrolled in public schools. The age group of 35 years and over has the highest likelihood of being enrolled in private schools, with 61 (64.9% in the age bracket) enrolled. Conversely, the age group of 10 to 14 year olds has the lowest likelihood of being enrolled in a private school, with 195 (100.0% in the age bracket) attending a public institution.
| Age Bracket | Public School | Private School |
| 3 to 4 Year Olds | 40 (48.2%) | 43 (51.8%) |
| 5 to 9 Year Old | 290 (87.4%) | 42 (12.7%) |
| 10 to 14 Year Olds | 195 (100.0%) | 0 (0.0%) |
| 15 to 17 Year Olds | 78 (72.9%) | 29 (27.1%) |
| 18 to 19 Year Olds | 49 (100.0%) | 0 (0.0%) |
| 20 to 24 Year Olds | 51 (75.0%) | 17 (25.0%) |
| 25 to 34 Year Olds | 53 (89.8%) | 6 (10.2%) |
| 35 Years and over | 33 (35.1%) | 61 (64.9%) |
| Total | 789 (79.9%) | 198 (20.1%) |
Educational Attainment by Field of Study in Northlake
Business (336 | 27.1%), arts & humanities (182 | 14.7%), education (147 | 11.9%), liberal arts & history (85 | 6.9%), and science & technology (78 | 6.3%) are the most common fields of study among 1,238 individuals in Northlake who have obtained a bachelor's degree or higher.
| Field of Study | # Graduates | % Graduates |
| Computers & Mathematics | 21 | 1.7% |
| Bio, Nature & Agricultural | 53 | 4.3% |
| Physical & Health Sciences | 67 | 5.4% |
| Psychology | 73 | 5.9% |
| Social Sciences | 68 | 5.5% |
| Engineering | 49 | 4.0% |
| Multidisciplinary Studies | 9 | 0.7% |
| Science & Technology | 78 | 6.3% |
| Business | 336 | 27.1% |
| Education | 147 | 11.9% |
| Literature & Languages | 21 | 1.7% |
| Liberal Arts & History | 85 | 6.9% |
| Visual & Performing Arts | 39 | 3.2% |
| Communications | 10 | 0.8% |
| Arts & Humanities | 182 | 14.7% |
| Total | 1,238 | 100.0% |
Transportation & Commute in Northlake
Vehicle Availability by Sex in Northlake
The most prevalent vehicle ownership categories in Northlake are males with 3 vehicles (376, accounting for 40.4%) and females with 3 vehicles (251, making up 49.0%).
| Vehicles Available | Male | Female |
| No Vehicle | 0 (0.0%) | 14 (1.8%) |
| 1 Vehicle | 155 (16.7%) | 149 (19.4%) |
| 2 Vehicles | 350 (37.6%) | 288 (37.6%) |
| 3 Vehicles | 376 (40.4%) | 251 (32.7%) |
| 4 Vehicles | 50 (5.4%) | 65 (8.5%) |
| 5 or more Vehicles | 0 (0.0%) | 0 (0.0%) |
| Total | 931 (100.0%) | 767 (100.0%) |
Commute Time in Northlake
The most frequently occuring commute durations in Northlake are 10 to 14 minutes (471 commuters, 28.5%), 15 to 19 minutes (272 commuters, 16.5%), and 40 to 44 minutes (173 commuters, 10.5%).
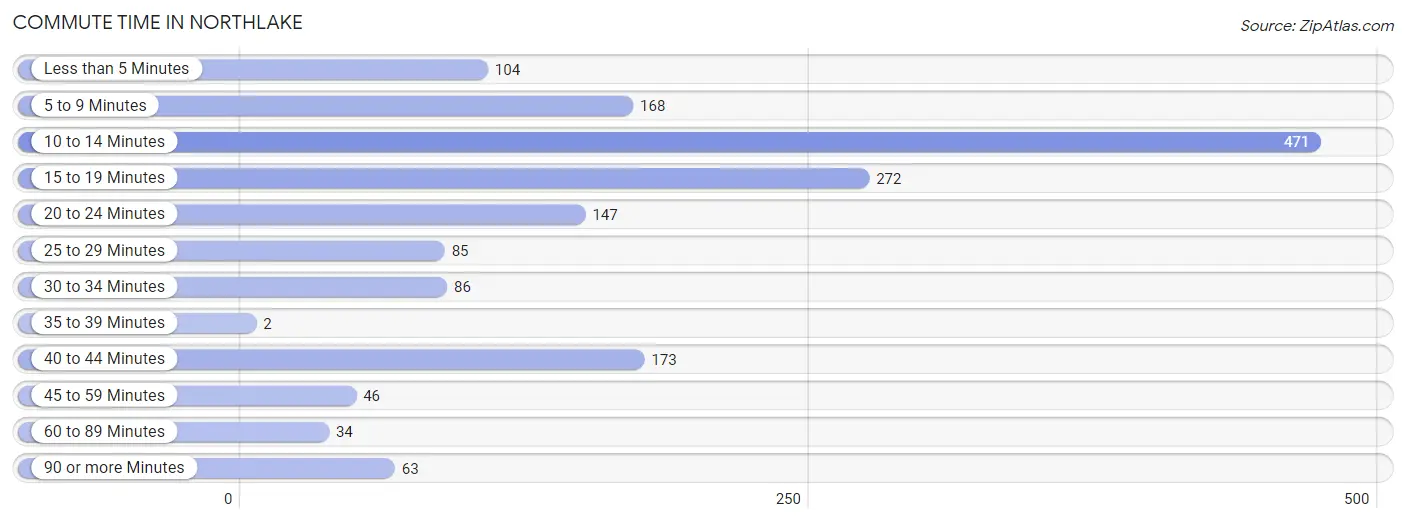
| Commute Time | # Commuters | % Commuters |
| Less than 5 Minutes | 104 | 6.3% |
| 5 to 9 Minutes | 168 | 10.2% |
| 10 to 14 Minutes | 471 | 28.5% |
| 15 to 19 Minutes | 272 | 16.5% |
| 20 to 24 Minutes | 147 | 8.9% |
| 25 to 29 Minutes | 85 | 5.1% |
| 30 to 34 Minutes | 86 | 5.2% |
| 35 to 39 Minutes | 2 | 0.1% |
| 40 to 44 Minutes | 173 | 10.5% |
| 45 to 59 Minutes | 46 | 2.8% |
| 60 to 89 Minutes | 34 | 2.1% |
| 90 or more Minutes | 63 | 3.8% |
Commute Time by Sex in Northlake
The most common commute times in Northlake are 10 to 14 minutes (227 commuters, 25.3%) for males and 10 to 14 minutes (244 commuters, 32.4%) for females.
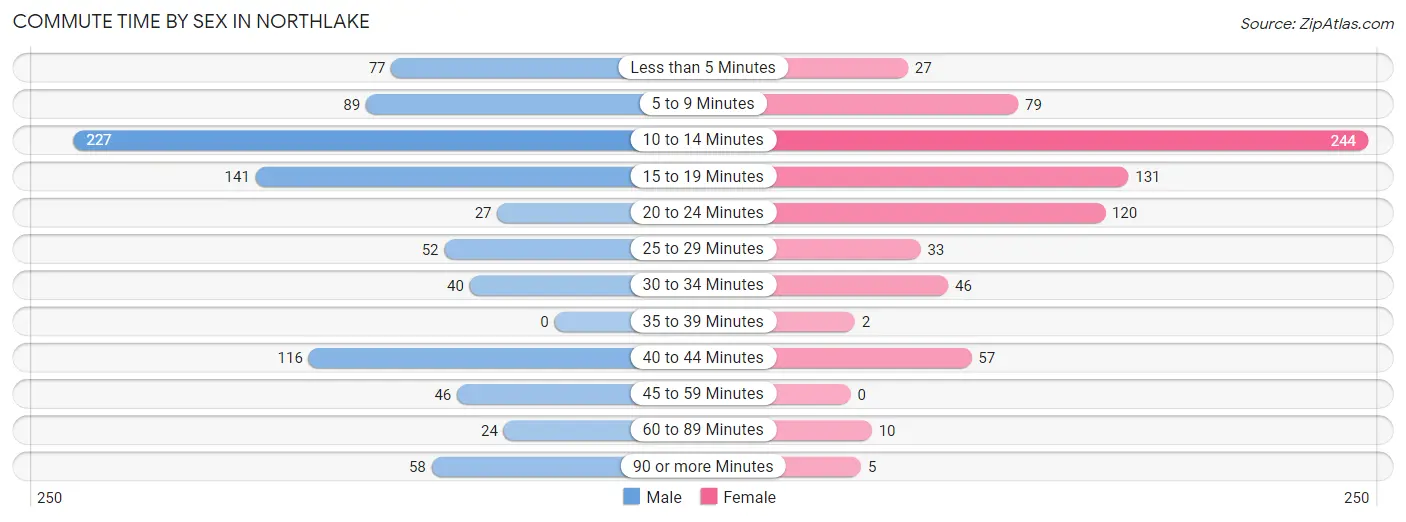
| Commute Time | Male | Female |
| Less than 5 Minutes | 77 (8.6%) | 27 (3.6%) |
| 5 to 9 Minutes | 89 (9.9%) | 79 (10.5%) |
| 10 to 14 Minutes | 227 (25.3%) | 244 (32.4%) |
| 15 to 19 Minutes | 141 (15.7%) | 131 (17.4%) |
| 20 to 24 Minutes | 27 (3.0%) | 120 (15.9%) |
| 25 to 29 Minutes | 52 (5.8%) | 33 (4.4%) |
| 30 to 34 Minutes | 40 (4.5%) | 46 (6.1%) |
| 35 to 39 Minutes | 0 (0.0%) | 2 (0.3%) |
| 40 to 44 Minutes | 116 (12.9%) | 57 (7.6%) |
| 45 to 59 Minutes | 46 (5.1%) | 0 (0.0%) |
| 60 to 89 Minutes | 24 (2.7%) | 10 (1.3%) |
| 90 or more Minutes | 58 (6.5%) | 5 (0.7%) |
Time of Departure to Work by Sex in Northlake
The most frequent times of departure to work in Northlake are 6:30 AM to 6:59 AM (145, 16.2%) for males and 7:30 AM to 7:59 AM (185, 24.5%) for females.
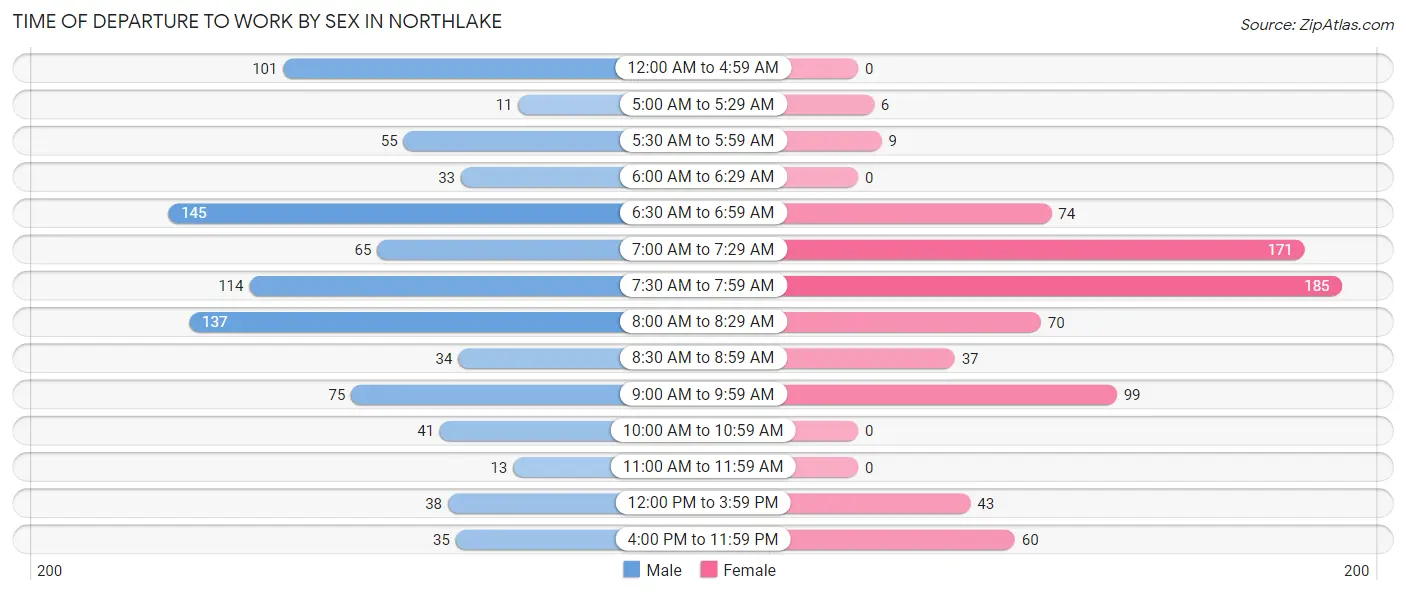
| Time of Departure | Male | Female |
| 12:00 AM to 4:59 AM | 101 (11.3%) | 0 (0.0%) |
| 5:00 AM to 5:29 AM | 11 (1.2%) | 6 (0.8%) |
| 5:30 AM to 5:59 AM | 55 (6.1%) | 9 (1.2%) |
| 6:00 AM to 6:29 AM | 33 (3.7%) | 0 (0.0%) |
| 6:30 AM to 6:59 AM | 145 (16.2%) | 74 (9.8%) |
| 7:00 AM to 7:29 AM | 65 (7.2%) | 171 (22.7%) |
| 7:30 AM to 7:59 AM | 114 (12.7%) | 185 (24.5%) |
| 8:00 AM to 8:29 AM | 137 (15.3%) | 70 (9.3%) |
| 8:30 AM to 8:59 AM | 34 (3.8%) | 37 (4.9%) |
| 9:00 AM to 9:59 AM | 75 (8.4%) | 99 (13.1%) |
| 10:00 AM to 10:59 AM | 41 (4.6%) | 0 (0.0%) |
| 11:00 AM to 11:59 AM | 13 (1.5%) | 0 (0.0%) |
| 12:00 PM to 3:59 PM | 38 (4.2%) | 43 (5.7%) |
| 4:00 PM to 11:59 PM | 35 (3.9%) | 60 (8.0%) |
| Total | 897 (100.0%) | 754 (100.0%) |
Housing Occupancy in Northlake
Occupancy by Ownership in Northlake
Of the total 1,623 dwellings in Northlake, owner-occupied units account for 1,363 (84.0%), while renter-occupied units make up 260 (16.0%).
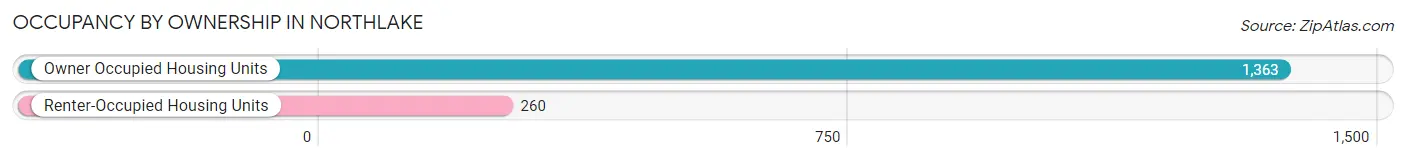
| Occupancy | # Housing Units | % Housing Units |
| Owner Occupied Housing Units | 1,363 | 84.0% |
| Renter-Occupied Housing Units | 260 | 16.0% |
| Total Occupied Housing Units | 1,623 | 100.0% |
Occupancy by Household Size in Northlake
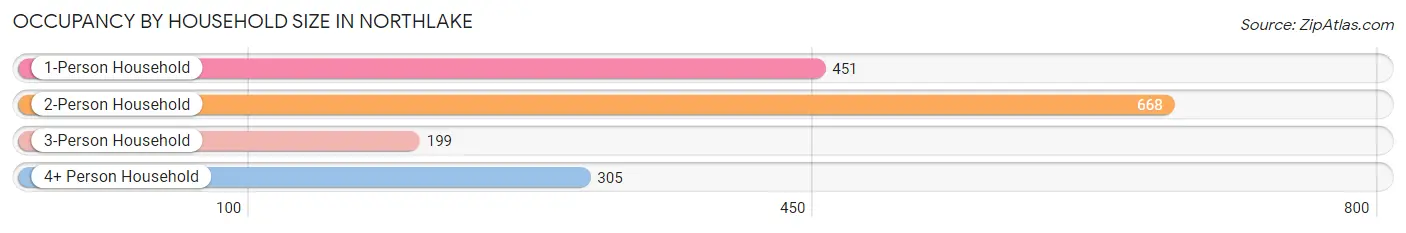
| Household Size | # Housing Units | % Housing Units |
| 1-Person Household | 451 | 27.8% |
| 2-Person Household | 668 | 41.2% |
| 3-Person Household | 199 | 12.3% |
| 4+ Person Household | 305 | 18.8% |
| Total Housing Units | 1,623 | 100.0% |
Occupancy by Ownership by Household Size in Northlake
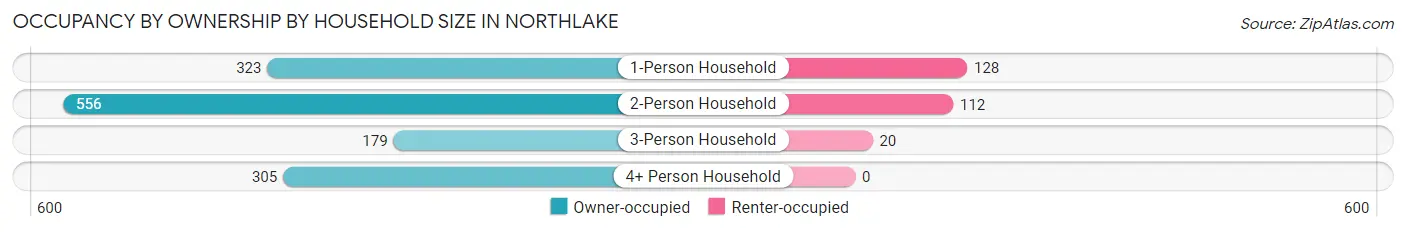
| Household Size | Owner-occupied | Renter-occupied |
| 1-Person Household | 323 (71.6%) | 128 (28.4%) |
| 2-Person Household | 556 (83.2%) | 112 (16.8%) |
| 3-Person Household | 179 (89.9%) | 20 (10.1%) |
| 4+ Person Household | 305 (100.0%) | 0 (0.0%) |
| Total Housing Units | 1,363 (84.0%) | 260 (16.0%) |
Occupancy by Educational Attainment in Northlake
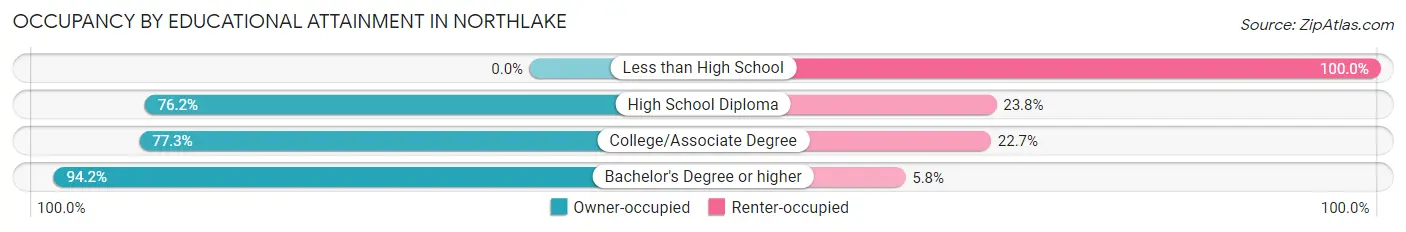
| Household Size | Owner-occupied | Renter-occupied |
| Less than High School | 0 (0.0%) | 10 (100.0%) |
| High School Diploma | 259 (76.2%) | 81 (23.8%) |
| College/Associate Degree | 435 (77.3%) | 128 (22.7%) |
| Bachelor's Degree or higher | 669 (94.2%) | 41 (5.8%) |
Occupancy by Age of Householder in Northlake
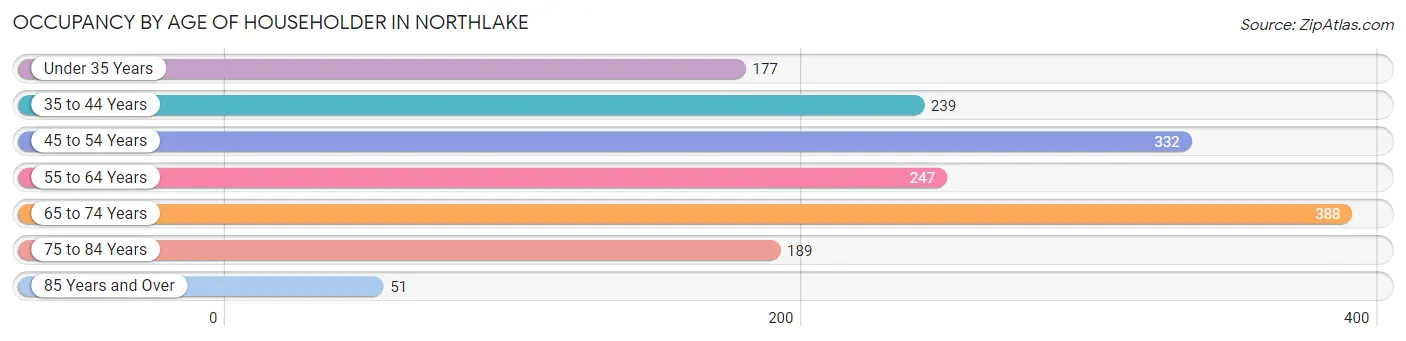
| Age Bracket | # Households | % Households |
| Under 35 Years | 177 | 10.9% |
| 35 to 44 Years | 239 | 14.7% |
| 45 to 54 Years | 332 | 20.5% |
| 55 to 64 Years | 247 | 15.2% |
| 65 to 74 Years | 388 | 23.9% |
| 75 to 84 Years | 189 | 11.7% |
| 85 Years and Over | 51 | 3.1% |
| Total | 1,623 | 100.0% |
Housing Finances in Northlake
Median Income by Occupancy in Northlake
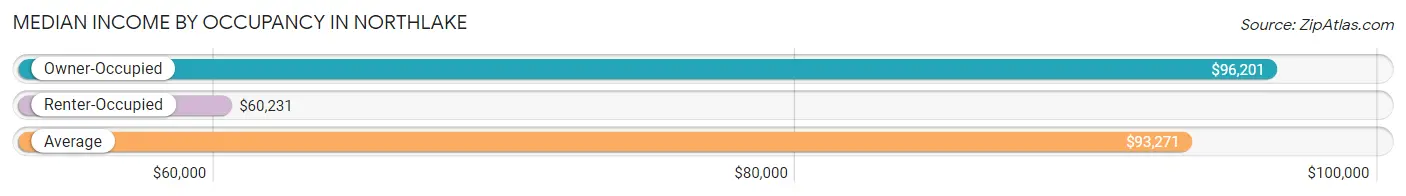
| Occupancy Type | # Households | Median Income |
| Owner-Occupied | 1,363 (84.0%) | $96,201 |
| Renter-Occupied | 260 (16.0%) | $60,231 |
| Average | 1,623 (100.0%) | $93,271 |
Occupancy by Householder Income Bracket in Northlake
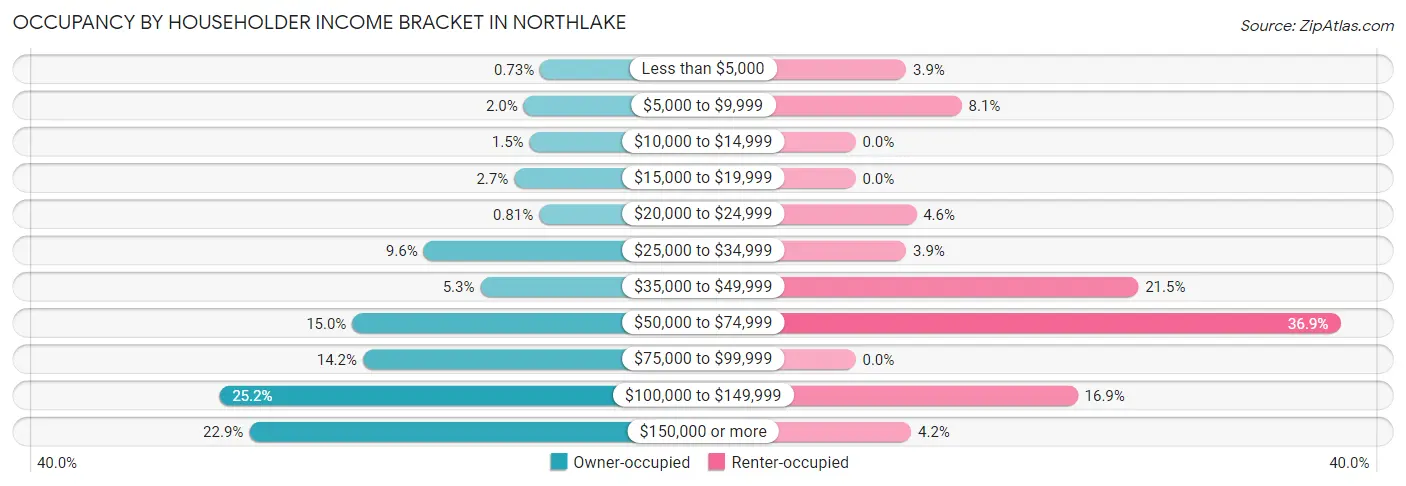
| Income Bracket | Owner-occupied | Renter-occupied |
| Less than $5,000 | 10 (0.7%) | 10 (3.8%) |
| $5,000 to $9,999 | 27 (2.0%) | 21 (8.1%) |
| $10,000 to $14,999 | 21 (1.5%) | 0 (0.0%) |
| $15,000 to $19,999 | 37 (2.7%) | 0 (0.0%) |
| $20,000 to $24,999 | 11 (0.8%) | 12 (4.6%) |
| $25,000 to $34,999 | 131 (9.6%) | 10 (3.8%) |
| $35,000 to $49,999 | 72 (5.3%) | 56 (21.5%) |
| $50,000 to $74,999 | 205 (15.0%) | 96 (36.9%) |
| $75,000 to $99,999 | 194 (14.2%) | 0 (0.0%) |
| $100,000 to $149,999 | 343 (25.2%) | 44 (16.9%) |
| $150,000 or more | 312 (22.9%) | 11 (4.2%) |
| Total | 1,363 (100.0%) | 260 (100.0%) |
Monthly Housing Cost Tiers in Northlake
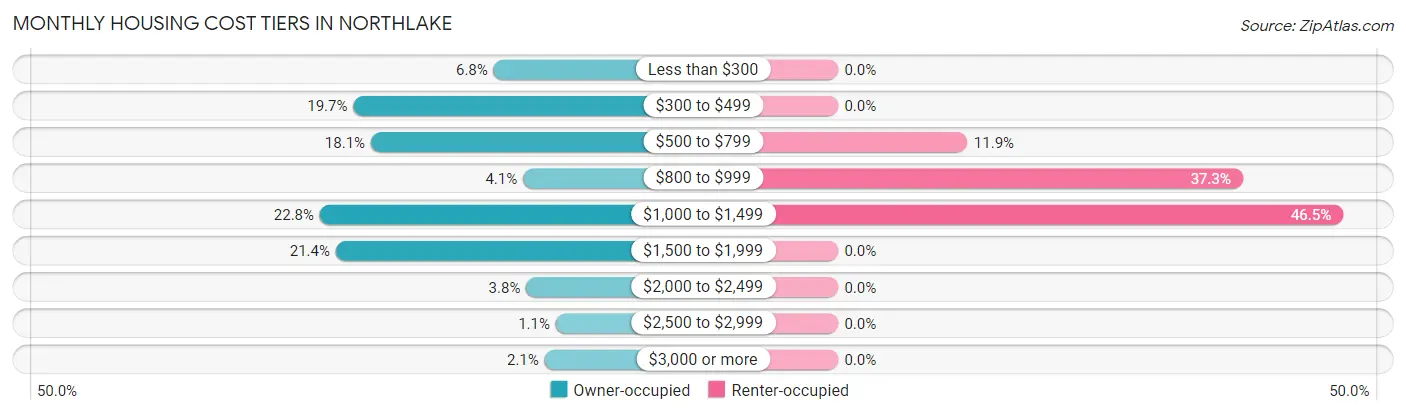
| Monthly Cost | Owner-occupied | Renter-occupied |
| Less than $300 | 93 (6.8%) | 0 (0.0%) |
| $300 to $499 | 269 (19.7%) | 0 (0.0%) |
| $500 to $799 | 247 (18.1%) | 31 (11.9%) |
| $800 to $999 | 56 (4.1%) | 97 (37.3%) |
| $1,000 to $1,499 | 311 (22.8%) | 121 (46.5%) |
| $1,500 to $1,999 | 291 (21.3%) | 0 (0.0%) |
| $2,000 to $2,499 | 52 (3.8%) | 0 (0.0%) |
| $2,500 to $2,999 | 15 (1.1%) | 0 (0.0%) |
| $3,000 or more | 29 (2.1%) | 0 (0.0%) |
| Total | 1,363 (100.0%) | 260 (100.0%) |
Physical Housing Characteristics in Northlake
Housing Structures in Northlake
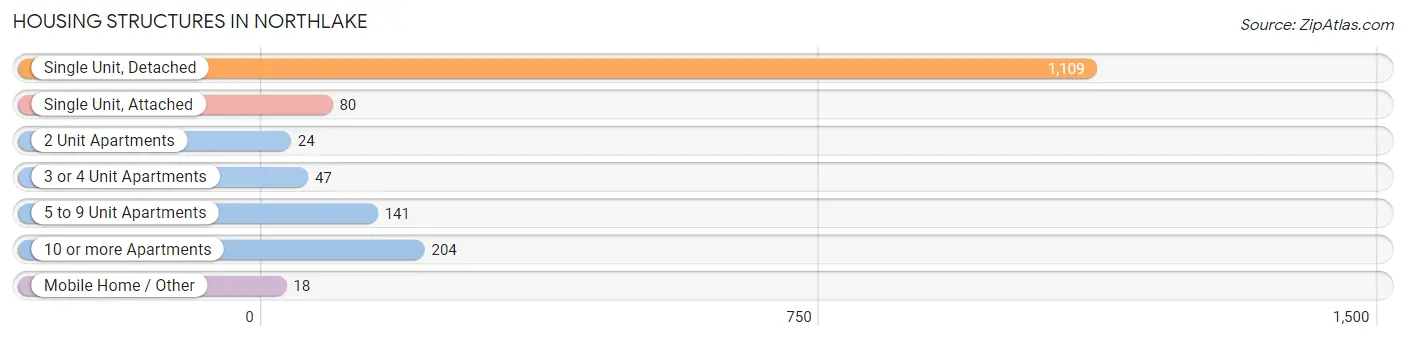
| Structure Type | # Housing Units | % Housing Units |
| Single Unit, Detached | 1,109 | 68.3% |
| Single Unit, Attached | 80 | 4.9% |
| 2 Unit Apartments | 24 | 1.5% |
| 3 or 4 Unit Apartments | 47 | 2.9% |
| 5 to 9 Unit Apartments | 141 | 8.7% |
| 10 or more Apartments | 204 | 12.6% |
| Mobile Home / Other | 18 | 1.1% |
| Total | 1,623 | 100.0% |
Housing Structures by Occupancy in Northlake
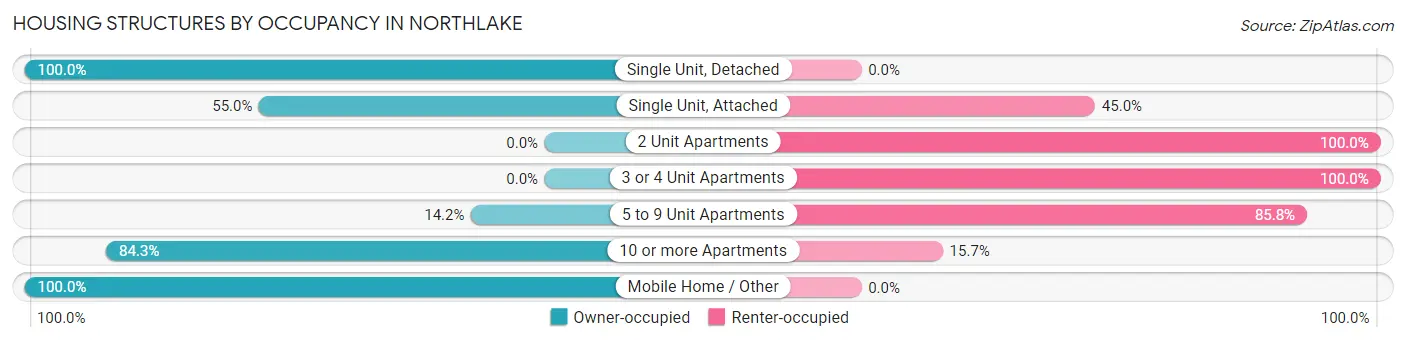
| Structure Type | Owner-occupied | Renter-occupied |
| Single Unit, Detached | 1,109 (100.0%) | 0 (0.0%) |
| Single Unit, Attached | 44 (55.0%) | 36 (45.0%) |
| 2 Unit Apartments | 0 (0.0%) | 24 (100.0%) |
| 3 or 4 Unit Apartments | 0 (0.0%) | 47 (100.0%) |
| 5 to 9 Unit Apartments | 20 (14.2%) | 121 (85.8%) |
| 10 or more Apartments | 172 (84.3%) | 32 (15.7%) |
| Mobile Home / Other | 18 (100.0%) | 0 (0.0%) |
| Total | 1,363 (84.0%) | 260 (16.0%) |
Housing Structures by Number of Rooms in Northlake
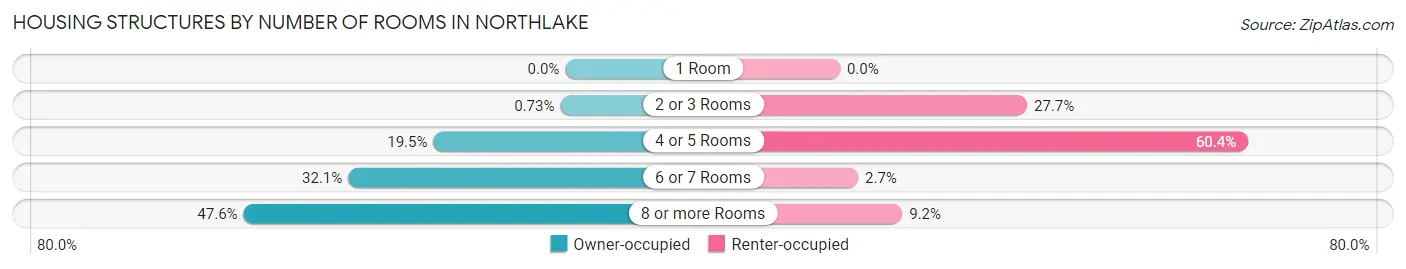
| Number of Rooms | Owner-occupied | Renter-occupied |
| 1 Room | 0 (0.0%) | 0 (0.0%) |
| 2 or 3 Rooms | 10 (0.7%) | 72 (27.7%) |
| 4 or 5 Rooms | 266 (19.5%) | 157 (60.4%) |
| 6 or 7 Rooms | 438 (32.1%) | 7 (2.7%) |
| 8 or more Rooms | 649 (47.6%) | 24 (9.2%) |
| Total | 1,363 (100.0%) | 260 (100.0%) |
Housing Structure by Heating Type in Northlake
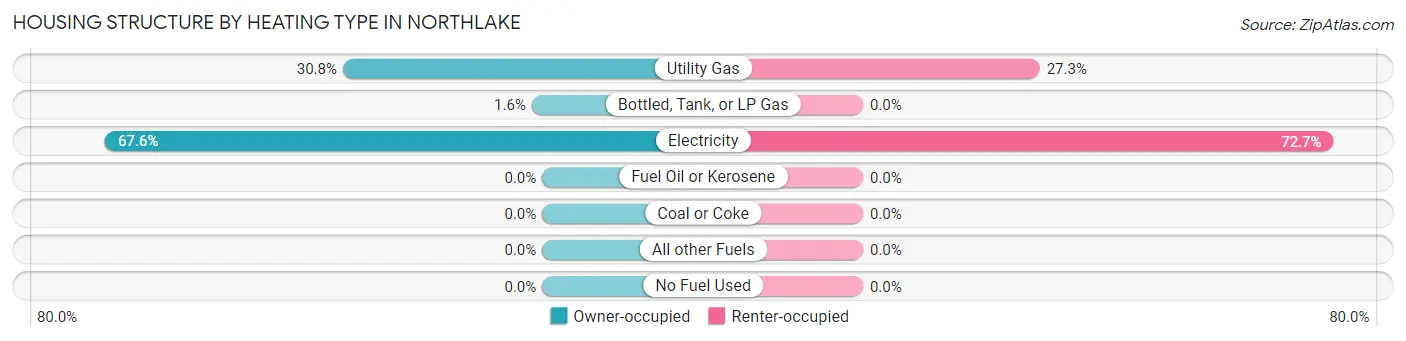
| Heating Type | Owner-occupied | Renter-occupied |
| Utility Gas | 420 (30.8%) | 71 (27.3%) |
| Bottled, Tank, or LP Gas | 22 (1.6%) | 0 (0.0%) |
| Electricity | 921 (67.6%) | 189 (72.7%) |
| Fuel Oil or Kerosene | 0 (0.0%) | 0 (0.0%) |
| Coal or Coke | 0 (0.0%) | 0 (0.0%) |
| All other Fuels | 0 (0.0%) | 0 (0.0%) |
| No Fuel Used | 0 (0.0%) | 0 (0.0%) |
| Total | 1,363 (100.0%) | 260 (100.0%) |
Household Vehicle Usage in Northlake
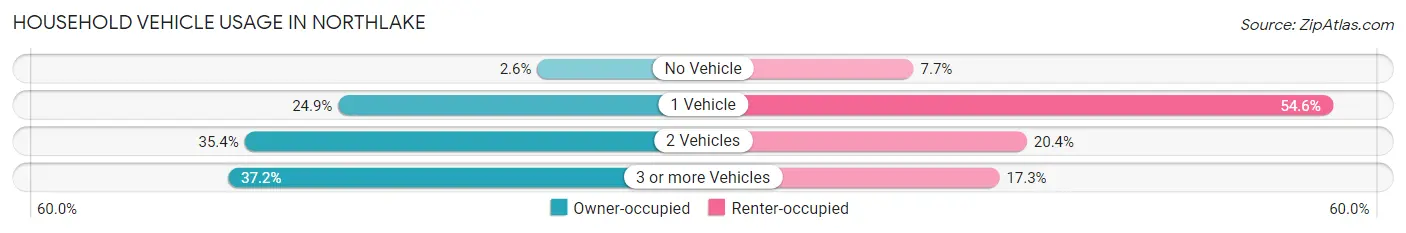
| Vehicles per Household | Owner-occupied | Renter-occupied |
| No Vehicle | 35 (2.6%) | 20 (7.7%) |
| 1 Vehicle | 339 (24.9%) | 142 (54.6%) |
| 2 Vehicles | 482 (35.4%) | 53 (20.4%) |
| 3 or more Vehicles | 507 (37.2%) | 45 (17.3%) |
| Total | 1,363 (100.0%) | 260 (100.0%) |
Real Estate & Mortgages in Northlake
Real Estate and Mortgage Overview in Northlake
| Characteristic | Without Mortgage | With Mortgage |
| Housing Units | 556 | 807 |
| Median Property Value | $232,800 | $231,800 |
| Median Household Income | $100,909 | $204 |
| Monthly Housing Costs | $450 | $29 |
| Real Estate Taxes | $924 | $0 |
Property Value by Mortgage Status in Northlake
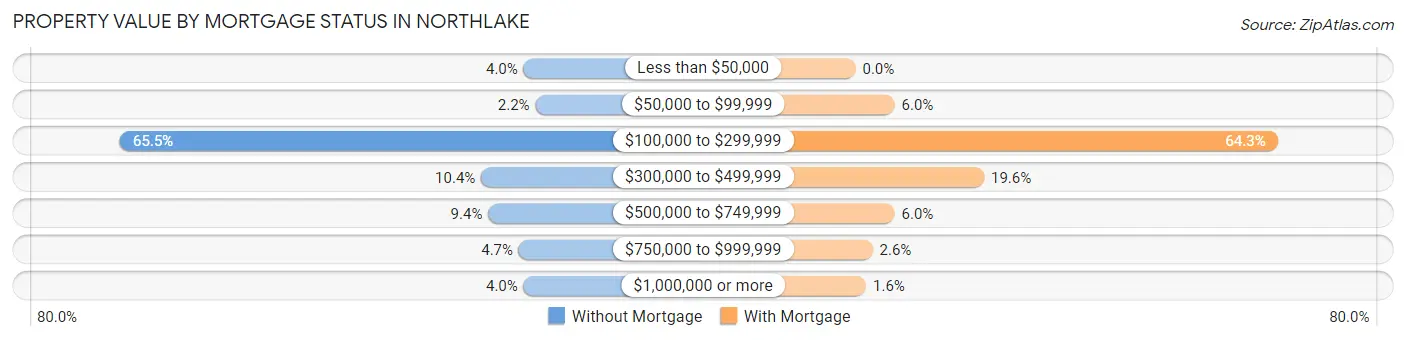
| Property Value | Without Mortgage | With Mortgage |
| Less than $50,000 | 22 (4.0%) | 0 (0.0%) |
| $50,000 to $99,999 | 12 (2.2%) | 48 (5.9%) |
| $100,000 to $299,999 | 364 (65.5%) | 519 (64.3%) |
| $300,000 to $499,999 | 58 (10.4%) | 158 (19.6%) |
| $500,000 to $749,999 | 52 (9.3%) | 48 (5.9%) |
| $750,000 to $999,999 | 26 (4.7%) | 21 (2.6%) |
| $1,000,000 or more | 22 (4.0%) | 13 (1.6%) |
| Total | 556 (100.0%) | 807 (100.0%) |
Household Income by Mortgage Status in Northlake
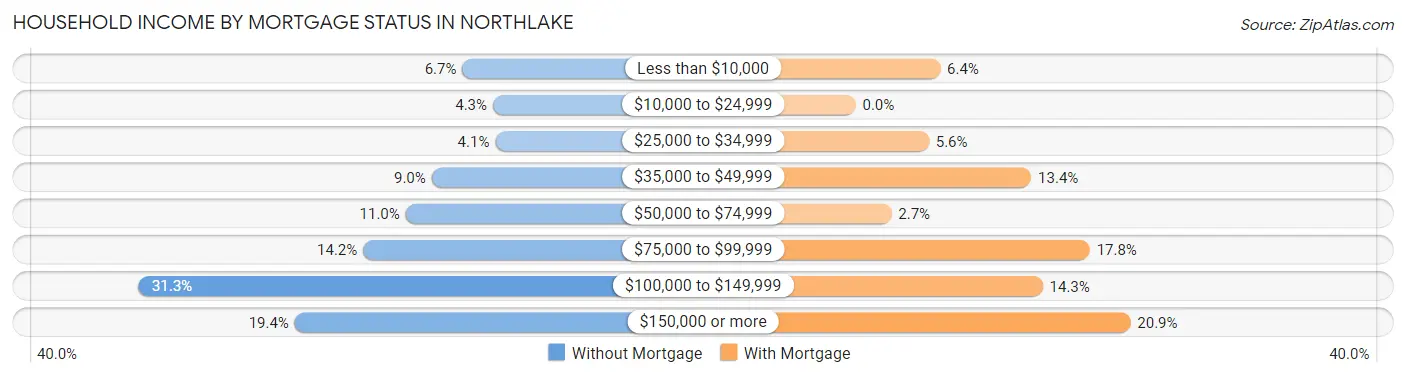
| Household Income | Without Mortgage | With Mortgage |
| Less than $10,000 | 37 (6.7%) | 52 (6.4%) |
| $10,000 to $24,999 | 24 (4.3%) | 0 (0.0%) |
| $25,000 to $34,999 | 23 (4.1%) | 45 (5.6%) |
| $35,000 to $49,999 | 50 (9.0%) | 108 (13.4%) |
| $50,000 to $74,999 | 61 (11.0%) | 22 (2.7%) |
| $75,000 to $99,999 | 79 (14.2%) | 144 (17.8%) |
| $100,000 to $149,999 | 174 (31.3%) | 115 (14.2%) |
| $150,000 or more | 108 (19.4%) | 169 (20.9%) |
| Total | 556 (100.0%) | 807 (100.0%) |
Property Value to Household Income Ratio in Northlake
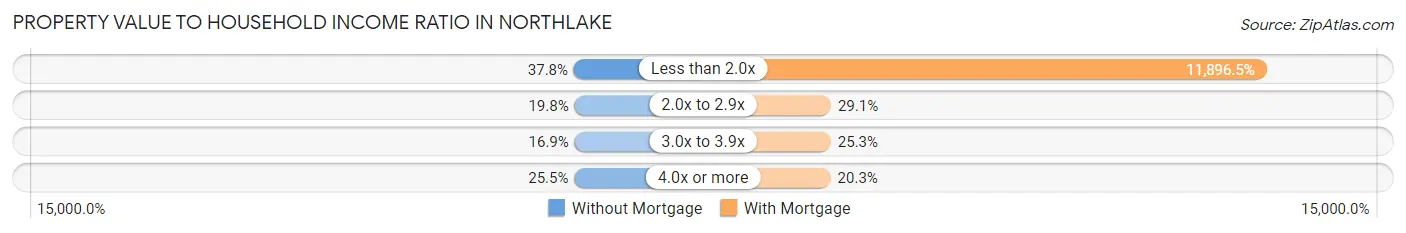
| Value-to-Income Ratio | Without Mortgage | With Mortgage |
| Less than 2.0x | 210 (37.8%) | 96,005 (11,896.5%) |
| 2.0x to 2.9x | 110 (19.8%) | 235 (29.1%) |
| 3.0x to 3.9x | 94 (16.9%) | 204 (25.3%) |
| 4.0x or more | 142 (25.5%) | 164 (20.3%) |
| Total | 556 (100.0%) | 807 (100.0%) |
Real Estate Taxes by Mortgage Status in Northlake
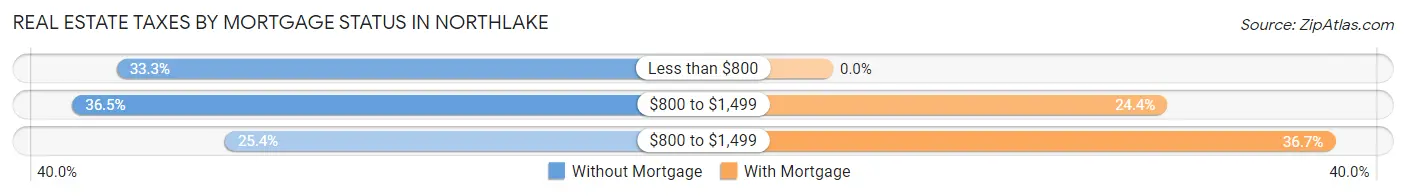
| Property Taxes | Without Mortgage | With Mortgage |
| Less than $800 | 185 (33.3%) | 0 (0.0%) |
| $800 to $1,499 | 203 (36.5%) | 197 (24.4%) |
| $800 to $1,499 | 141 (25.4%) | 296 (36.7%) |
| Total | 556 (100.0%) | 807 (100.0%) |
Health & Disability in Northlake
Health Insurance Coverage by Age in Northlake
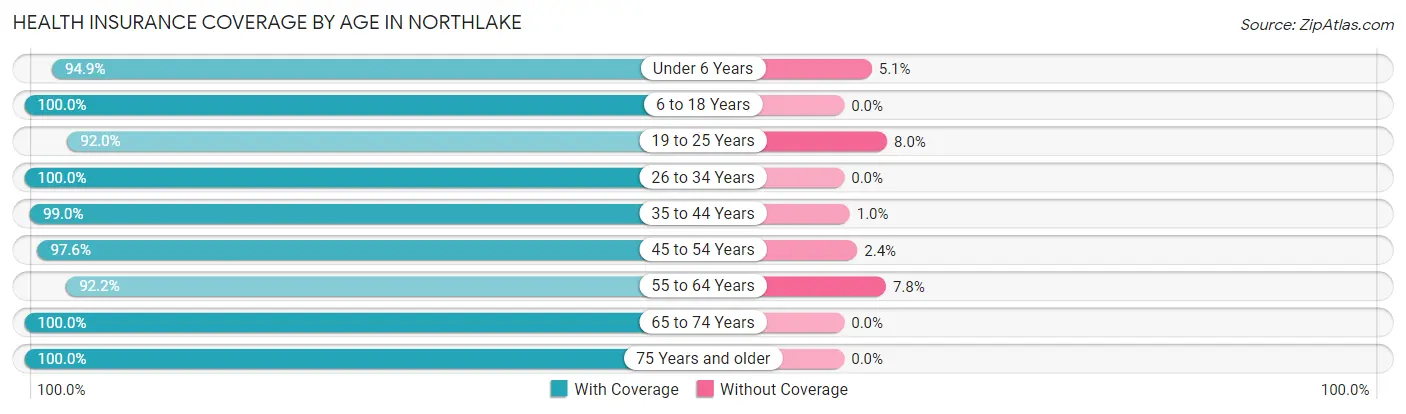
| Age Bracket | With Coverage | Without Coverage |
| Under 6 Years | 185 (94.9%) | 10 (5.1%) |
| 6 to 18 Years | 675 (100.0%) | 0 (0.0%) |
| 19 to 25 Years | 242 (92.0%) | 21 (8.0%) |
| 26 to 34 Years | 330 (100.0%) | 0 (0.0%) |
| 35 to 44 Years | 486 (99.0%) | 5 (1.0%) |
| 45 to 54 Years | 441 (97.6%) | 11 (2.4%) |
| 55 to 64 Years | 463 (92.2%) | 39 (7.8%) |
| 65 to 74 Years | 696 (100.0%) | 0 (0.0%) |
| 75 Years and older | 372 (100.0%) | 0 (0.0%) |
| Total | 3,890 (97.8%) | 86 (2.2%) |
Health Insurance Coverage by Citizenship Status in Northlake
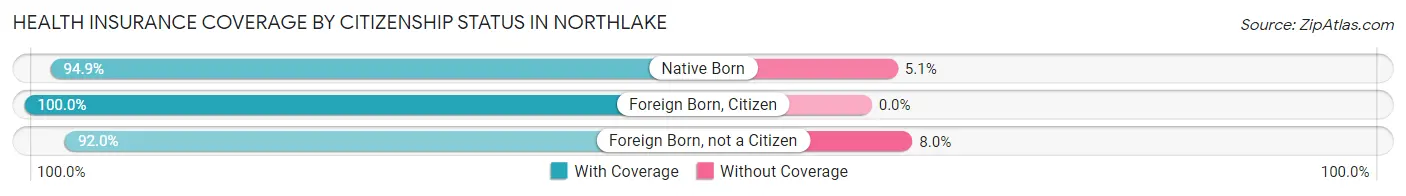
| Citizenship Status | With Coverage | Without Coverage |
| Native Born | 185 (94.9%) | 10 (5.1%) |
| Foreign Born, Citizen | 675 (100.0%) | 0 (0.0%) |
| Foreign Born, not a Citizen | 242 (92.0%) | 21 (8.0%) |
Health Insurance Coverage by Household Income in Northlake
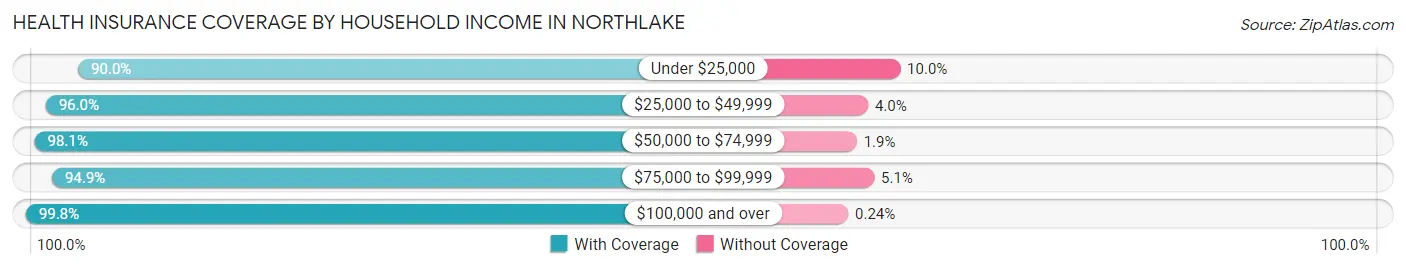
| Household Income | With Coverage | Without Coverage |
| Under $25,000 | 189 (90.0%) | 21 (10.0%) |
| $25,000 to $49,999 | 581 (96.0%) | 24 (4.0%) |
| $50,000 to $74,999 | 527 (98.1%) | 10 (1.9%) |
| $75,000 to $99,999 | 482 (94.9%) | 26 (5.1%) |
| $100,000 and over | 2,111 (99.8%) | 5 (0.2%) |
Public vs Private Health Insurance Coverage by Age in Northlake
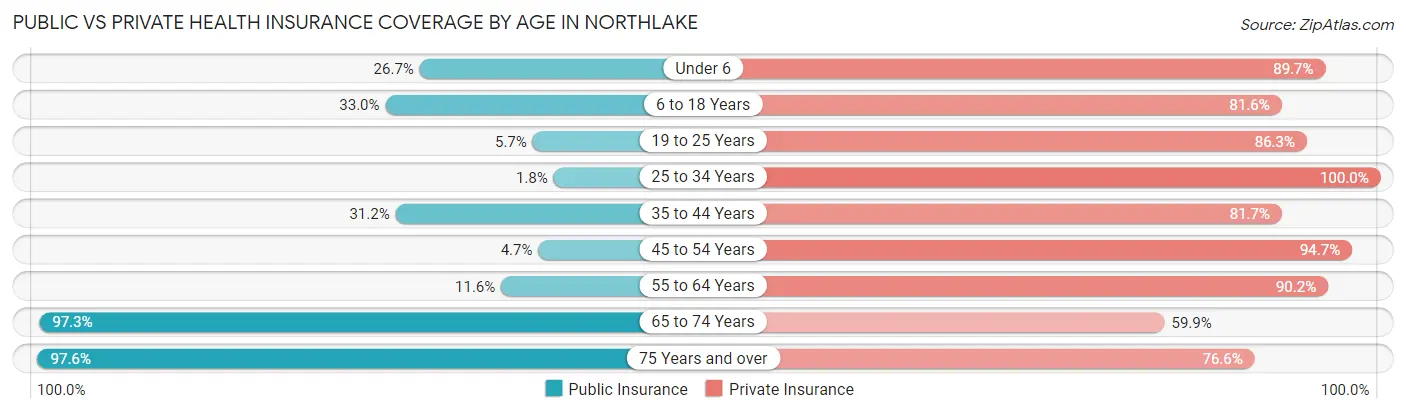
| Age Bracket | Public Insurance | Private Insurance |
| Under 6 | 52 (26.7%) | 175 (89.7%) |
| 6 to 18 Years | 223 (33.0%) | 551 (81.6%) |
| 19 to 25 Years | 15 (5.7%) | 227 (86.3%) |
| 25 to 34 Years | 6 (1.8%) | 330 (100.0%) |
| 35 to 44 Years | 153 (31.2%) | 401 (81.7%) |
| 45 to 54 Years | 21 (4.6%) | 428 (94.7%) |
| 55 to 64 Years | 58 (11.6%) | 453 (90.2%) |
| 65 to 74 Years | 677 (97.3%) | 417 (59.9%) |
| 75 Years and over | 363 (97.6%) | 285 (76.6%) |
| Total | 1,568 (39.4%) | 3,267 (82.2%) |
Disability Status by Sex by Age in Northlake
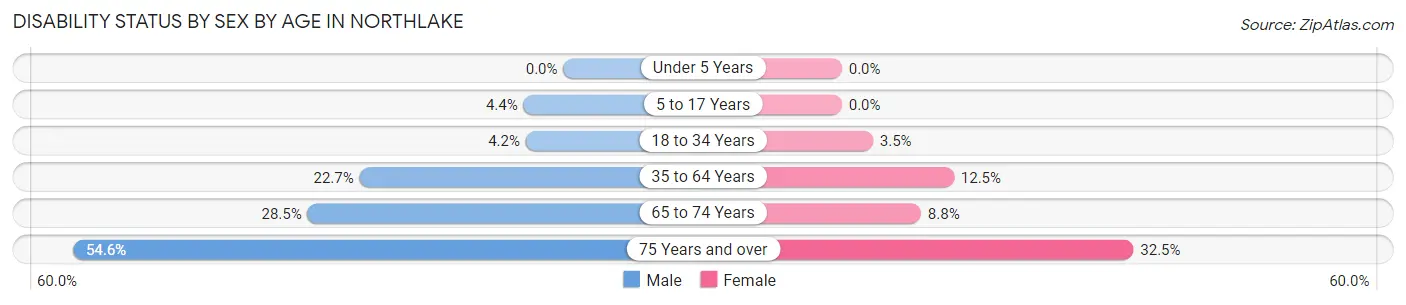
| Age Bracket | Male | Female |
| Under 5 Years | 0 (0.0%) | 0 (0.0%) |
| 5 to 17 Years | 18 (4.4%) | 0 (0.0%) |
| 18 to 34 Years | 12 (4.2%) | 12 (3.5%) |
| 35 to 64 Years | 148 (22.7%) | 99 (12.5%) |
| 65 to 74 Years | 98 (28.5%) | 31 (8.8%) |
| 75 Years and over | 77 (54.6%) | 75 (32.5%) |
Disability Class by Sex by Age in Northlake
Disability Class: Hearing Difficulty
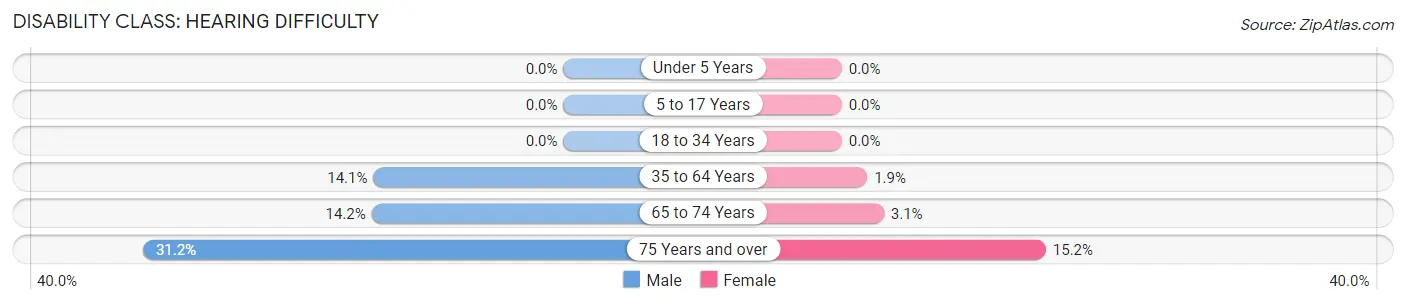
| Age Bracket | Male | Female |
| Under 5 Years | 0 (0.0%) | 0 (0.0%) |
| 5 to 17 Years | 0 (0.0%) | 0 (0.0%) |
| 18 to 34 Years | 0 (0.0%) | 0 (0.0%) |
| 35 to 64 Years | 92 (14.1%) | 15 (1.9%) |
| 65 to 74 Years | 49 (14.2%) | 11 (3.1%) |
| 75 Years and over | 44 (31.2%) | 35 (15.1%) |
Disability Class: Vision Difficulty
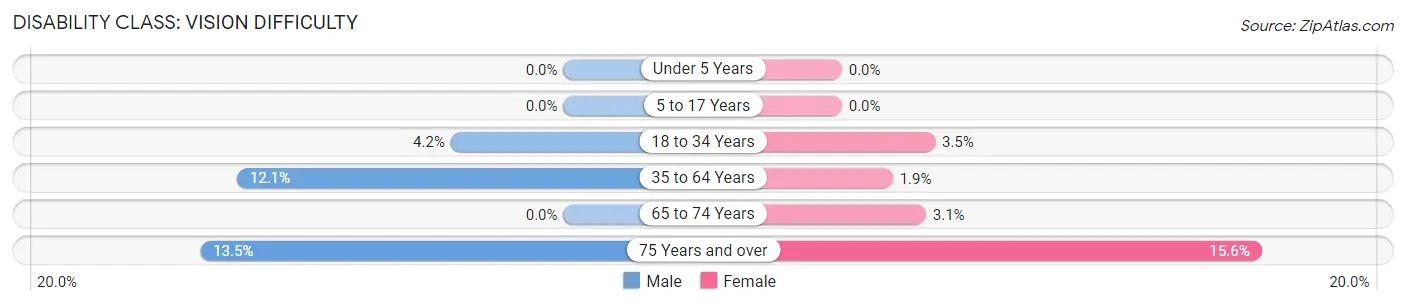
| Age Bracket | Male | Female |
| Under 5 Years | 0 (0.0%) | 0 (0.0%) |
| 5 to 17 Years | 0 (0.0%) | 0 (0.0%) |
| 18 to 34 Years | 12 (4.2%) | 12 (3.5%) |
| 35 to 64 Years | 79 (12.1%) | 15 (1.9%) |
| 65 to 74 Years | 0 (0.0%) | 11 (3.1%) |
| 75 Years and over | 19 (13.5%) | 36 (15.6%) |
Disability Class: Cognitive Difficulty
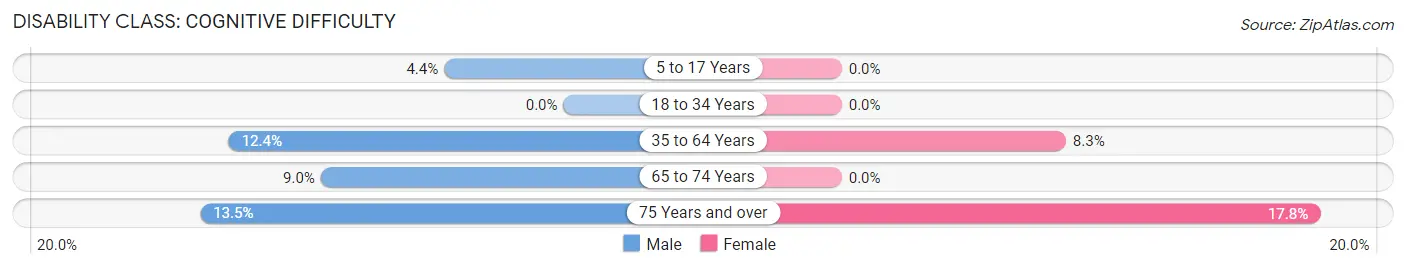
| Age Bracket | Male | Female |
| 5 to 17 Years | 18 (4.4%) | 0 (0.0%) |
| 18 to 34 Years | 0 (0.0%) | 0 (0.0%) |
| 35 to 64 Years | 81 (12.4%) | 66 (8.3%) |
| 65 to 74 Years | 31 (9.0%) | 0 (0.0%) |
| 75 Years and over | 19 (13.5%) | 41 (17.7%) |
Disability Class: Ambulatory Difficulty
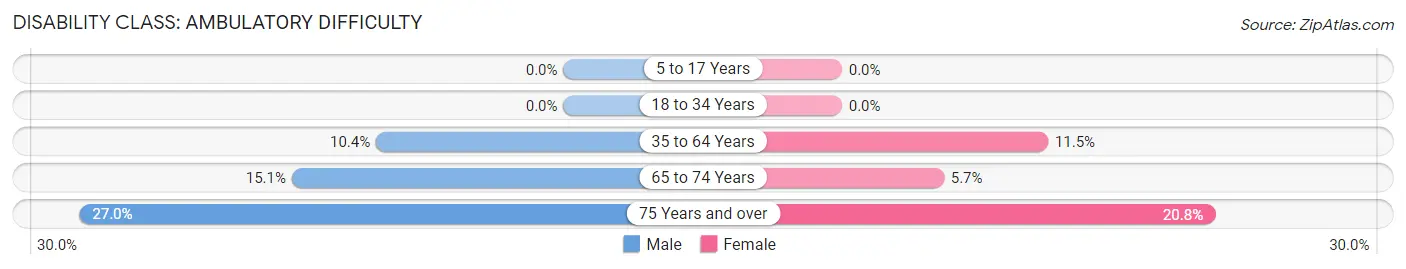
| Age Bracket | Male | Female |
| 5 to 17 Years | 0 (0.0%) | 0 (0.0%) |
| 18 to 34 Years | 0 (0.0%) | 0 (0.0%) |
| 35 to 64 Years | 68 (10.4%) | 91 (11.5%) |
| 65 to 74 Years | 52 (15.1%) | 20 (5.7%) |
| 75 Years and over | 38 (27.0%) | 48 (20.8%) |
Disability Class: Self-Care Difficulty
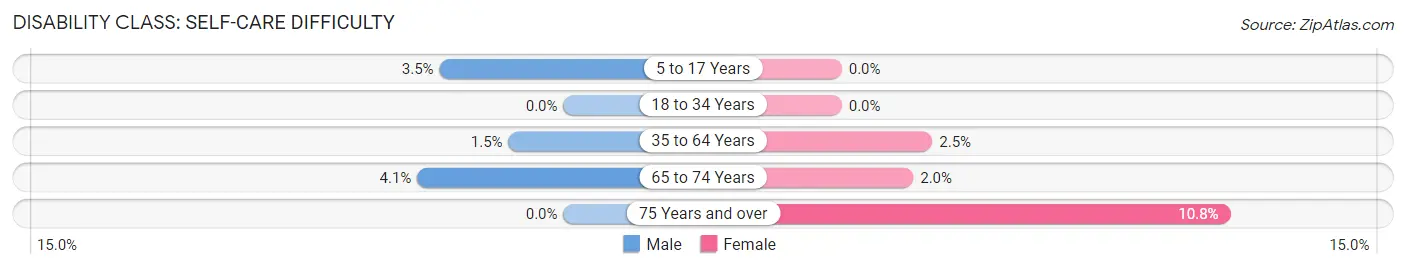
| Age Bracket | Male | Female |
| 5 to 17 Years | 14 (3.5%) | 0 (0.0%) |
| 18 to 34 Years | 0 (0.0%) | 0 (0.0%) |
| 35 to 64 Years | 10 (1.5%) | 20 (2.5%) |
| 65 to 74 Years | 14 (4.1%) | 7 (2.0%) |
| 75 Years and over | 0 (0.0%) | 25 (10.8%) |
Technology Access in Northlake
Computing Device Access in Northlake
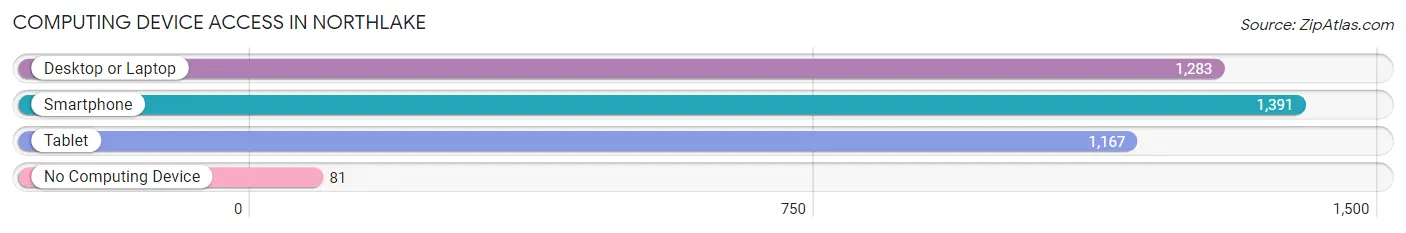
| Device Type | # Households | % Households |
| Desktop or Laptop | 1,283 | 79.0% |
| Smartphone | 1,391 | 85.7% |
| Tablet | 1,167 | 71.9% |
| No Computing Device | 81 | 5.0% |
| Total | 1,623 | 100.0% |
Internet Access in Northlake
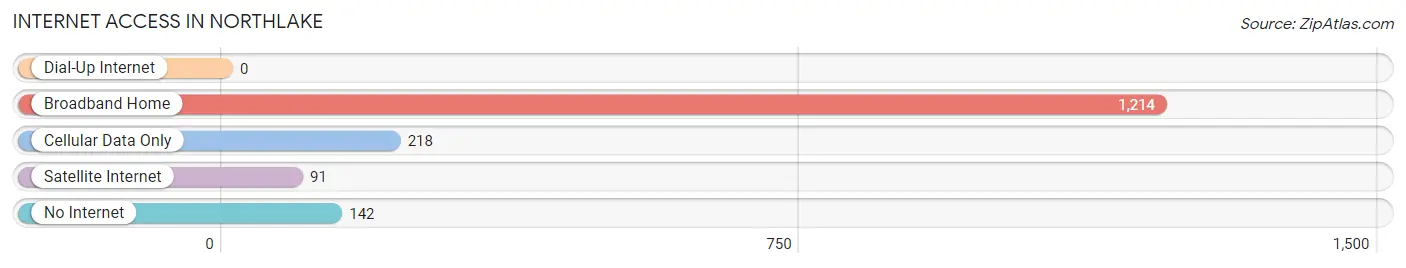
| Internet Type | # Households | % Households |
| Dial-Up Internet | 0 | 0.0% |
| Broadband Home | 1,214 | 74.8% |
| Cellular Data Only | 218 | 13.4% |
| Satellite Internet | 91 | 5.6% |
| No Internet | 142 | 8.7% |
| Total | 1,623 | 100.0% |
Northlake Summary
Lake Northlake is a small town located in the Upstate region of South Carolina. It is situated in the foothills of the Blue Ridge Mountains, approximately 30 miles northwest of Greenville. The town is home to a population of just over 1,000 people, and is known for its rural charm and small-town atmosphere.
History
The area that is now Northlake was first settled in the late 1700s by a group of settlers from North Carolina. The town was originally known as “North Carolina”, but was later changed to “Northlake” in 1820. The town was officially incorporated in 1887.
The town was originally a farming community, with the main crops being cotton, corn, and tobacco. In the early 1900s, the town began to experience a period of growth and development. The first bank was established in 1906, and the first post office was opened in 1908.
In the 1920s, the town began to experience a period of decline. The Great Depression caused many of the town’s businesses to close, and the population began to decline. The town was able to recover in the 1940s, when the textile industry began to move into the area. The town experienced a period of growth and prosperity in the 1950s and 1960s, and the population began to increase.
Geography
Northlake is located in the foothills of the Blue Ridge Mountains, approximately 30 miles northwest of Greenville. The town is situated on the banks of the Northlake River, which flows through the town and provides a source of recreation for the residents. The town is surrounded by rolling hills and forests, and is home to a variety of wildlife.
The climate in Northlake is mild and temperate, with warm summers and cool winters. The average temperature in the summer is around 80 degrees Fahrenheit, and the average temperature in the winter is around 40 degrees Fahrenheit.
Economy
The economy of Northlake is largely based on agriculture and tourism. The town is home to several farms, which produce a variety of crops, including corn, cotton, and tobacco. The town is also home to several small businesses, including restaurants, shops, and other services.
Tourism is an important part of the economy of Northlake. The town is home to several attractions, including the Northlake River, which provides a source of recreation for the residents. The town is also home to several historic sites, including the Northlake Historic District, which is listed on the National Register of Historic Places.
Demographics
As of the 2010 census, the population of Northlake was 1,072. The racial makeup of the town was 94.3% White, 3.2% African American, 0.3% Native American, 0.2% Asian, 0.1% Pacific Islander, 0.7% from other races, and 1.3% from two or more races. Hispanic or Latino of any race were 1.7% of the population.
The median income for a household in Northlake was $37,500, and the median income for a family was $45,000. The per capita income for the town was $19,000. About 11.2% of families and 14.2% of the population were below the poverty line, including 18.2% of those under age 18 and 8.3% of those age 65 or over.
Common Questions
What is Per Capita Income in Northlake?
Per Capita income in Northlake is $50,051.
What is the Median Family Income in Northlake?
Median Family Income in Northlake is $106,701.
What is the Median Household income in Northlake?
Median Household Income in Northlake is $93,271.
What is Income or Wage Gap in Northlake?
Income or Wage Gap in Northlake is 44.9%.
Women in Northlake earn 55.1 cents for every dollar earned by a man.
What is Inequality or Gini Index in Northlake?
Inequality or Gini Index in Northlake is 0.47.
What is the Total Population of Northlake?
Total Population of Northlake is 3,989.
What is the Total Male Population of Northlake?
Total Male Population of Northlake is 1,945.
What is the Total Female Population of Northlake?
Total Female Population of Northlake is 2,044.
What is the Ratio of Males per 100 Females in Northlake?
There are 95.16 Males per 100 Females in Northlake.
What is the Ratio of Females per 100 Males in Northlake?
There are 105.09 Females per 100 Males in Northlake.
What is the Median Population Age in Northlake?
Median Population Age in Northlake is 46.6 Years.
What is the Average Family Size in Northlake
Average Family Size in Northlake is 3.0 People.
What is the Average Household Size in Northlake
Average Household Size in Northlake is 2.5 People.
How Large is the Labor Force in Northlake?
There are 1,856 People in the Labor Forcein in Northlake.
What is the Percentage of People in the Labor Force in Northlake?
57.2% of People are in the Labor Force in Northlake.
What is the Unemployment Rate in Northlake?
Unemployment Rate in Northlake is 5.6%.