Belvedere, SC Map & Demographics
Belvedere Map
Belvedere Overview
$25,247
PER CAPITA INCOME
$63,838
AVG FAMILY INCOME
$46,042
AVG HOUSEHOLD INCOME
24.2%
WAGE / INCOME GAP [ % ]
75.8¢/ $1
WAGE / INCOME GAP [ $ ]
0.41
INEQUALITY / GINI INDEX
5,786
TOTAL POPULATION
2,996
MALE POPULATION
2,790
FEMALE POPULATION
107.38
MALES / 100 FEMALES
93.12
FEMALES / 100 MALES
38.2
MEDIAN AGE
2.8
AVG FAMILY SIZE
2.4
AVG HOUSEHOLD SIZE
2,827
LABOR FORCE [ PEOPLE ]
66.0%
PERCENT IN LABOR FORCE
6.4%
UNEMPLOYMENT RATE
Belvedere Area Codes
Income in Belvedere
Income Overview in Belvedere
Per Capita Income in Belvedere is $25,247, while median incomes of families and households are $63,838 and $46,042 respectively.
| Characteristic | Number | Measure |
| Per Capita Income | 5,786 | $25,247 |
| Median Family Income | 1,598 | $63,838 |
| Mean Family Income | 1,598 | $68,488 |
| Median Household Income | 2,439 | $46,042 |
| Mean Household Income | 2,439 | $57,981 |
| Income Deficit | 1,598 | $0 |
| Wage / Income Gap (%) | 5,786 | 24.22% |
| Wage / Income Gap ($) | 5,786 | 75.78¢ per $1 |
| Gini / Inequality Index | 5,786 | 0.41 |
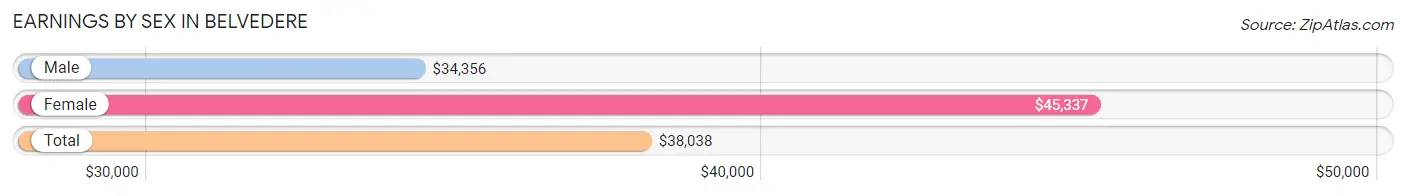
Earnings by Sex in Belvedere
Average Earnings in Belvedere are $38,038, $34,356 for men and $45,337 for women, a difference of 24.2%.
| Sex | Number | Average Earnings |
| Male | 1,626 (56.7%) | $34,356 |
| Female | 1,240 (43.3%) | $45,337 |
| Total | 2,866 (100.0%) | $38,038 |
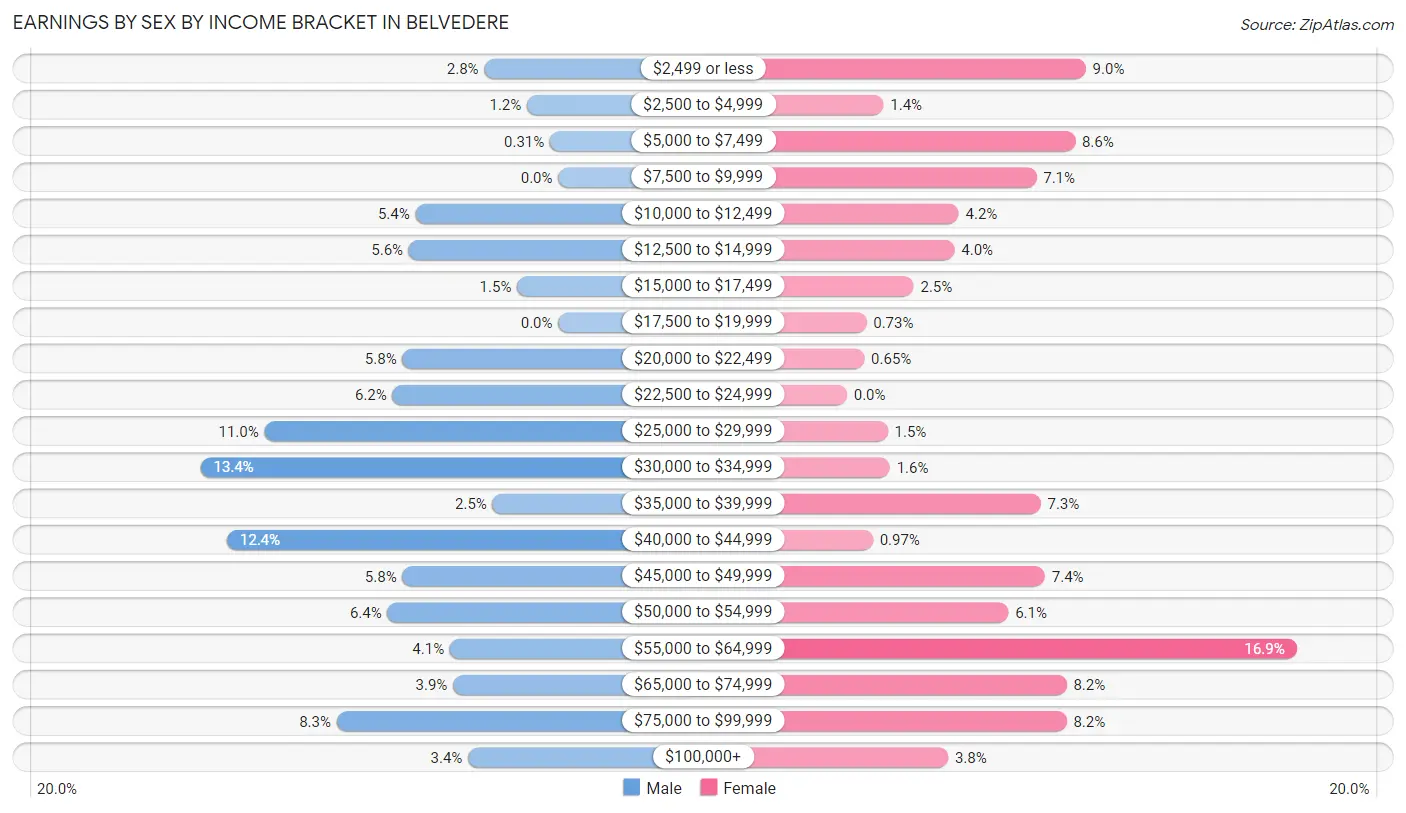
Earnings by Sex by Income Bracket in Belvedere
The most common earnings brackets in Belvedere are $30,000 to $34,999 for men (218 | 13.4%) and $55,000 to $64,999 for women (209 | 16.9%).
| Income | Male | Female |
| $2,499 or less | 45 (2.8%) | 111 (8.9%) |
| $2,500 to $4,999 | 19 (1.2%) | 17 (1.4%) |
| $5,000 to $7,499 | 5 (0.3%) | 106 (8.6%) |
| $7,500 to $9,999 | 0 (0.0%) | 88 (7.1%) |
| $10,000 to $12,499 | 87 (5.3%) | 52 (4.2%) |
| $12,500 to $14,999 | 91 (5.6%) | 50 (4.0%) |
| $15,000 to $17,499 | 25 (1.5%) | 31 (2.5%) |
| $17,500 to $19,999 | 0 (0.0%) | 9 (0.7%) |
| $20,000 to $22,499 | 95 (5.8%) | 8 (0.6%) |
| $22,500 to $24,999 | 101 (6.2%) | 0 (0.0%) |
| $25,000 to $29,999 | 179 (11.0%) | 19 (1.5%) |
| $30,000 to $34,999 | 218 (13.4%) | 20 (1.6%) |
| $35,000 to $39,999 | 40 (2.5%) | 90 (7.3%) |
| $40,000 to $44,999 | 202 (12.4%) | 12 (1.0%) |
| $45,000 to $49,999 | 95 (5.8%) | 92 (7.4%) |
| $50,000 to $54,999 | 104 (6.4%) | 75 (6.0%) |
| $55,000 to $64,999 | 66 (4.1%) | 209 (16.9%) |
| $65,000 to $74,999 | 64 (3.9%) | 102 (8.2%) |
| $75,000 to $99,999 | 135 (8.3%) | 102 (8.2%) |
| $100,000+ | 55 (3.4%) | 47 (3.8%) |
| Total | 1,626 (100.0%) | 1,240 (100.0%) |
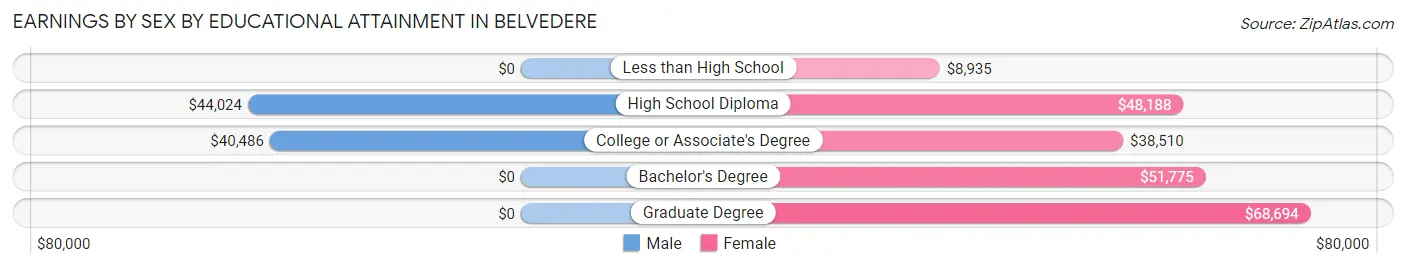
Earnings by Sex by Educational Attainment in Belvedere
Average earnings in Belvedere are $40,347 for men and $50,067 for women, a difference of 19.4%. Men with an educational attainment of high school diploma enjoy the highest average annual earnings of $44,024, while those with college or associate's degree education earn the least with $40,486. Women with an educational attainment of graduate degree earn the most with the average annual earnings of $68,694, while those with less than high school education have the smallest earnings of $8,935.
| Educational Attainment | Male Income | Female Income |
| Less than High School | - | - |
| High School Diploma | $44,024 | $48,188 |
| College or Associate's Degree | $40,486 | $38,510 |
| Bachelor's Degree | - | - |
| Graduate Degree | - | - |
| Total | $40,347 | $50,067 |
Family Income in Belvedere
Family Income Brackets in Belvedere
According to the Belvedere family income data, there are 294 families falling into the $75,000 to $99,999 income range, which is the most common income bracket and makes up 18.4% of all families. Conversely, the $200,000+ income bracket is the least frequent group with only 22 families (1.4%) belonging to this category.
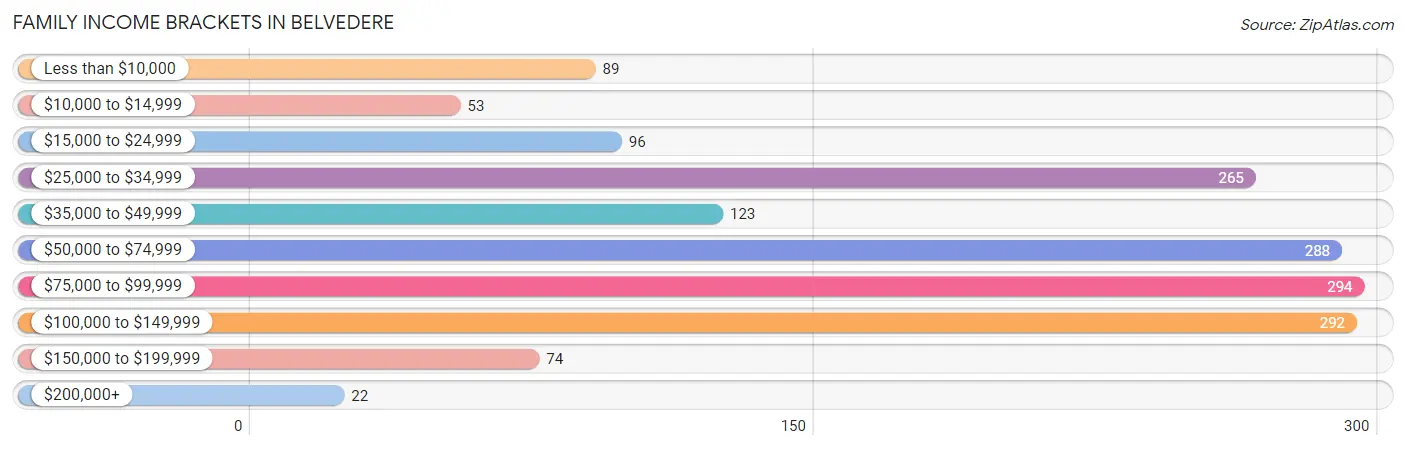
| Income Bracket | # Families | % Families |
| Less than $10,000 | 89 | 5.6% |
| $10,000 to $14,999 | 53 | 3.3% |
| $15,000 to $24,999 | 96 | 6.0% |
| $25,000 to $34,999 | 265 | 16.6% |
| $35,000 to $49,999 | 123 | 7.7% |
| $50,000 to $74,999 | 288 | 18.0% |
| $75,000 to $99,999 | 294 | 18.4% |
| $100,000 to $149,999 | 292 | 18.3% |
| $150,000 to $199,999 | 74 | 4.6% |
| $200,000+ | 22 | 1.4% |
Family Income by Famaliy Size in Belvedere
4-person families (139 | 8.7%) account for the highest median family income in Belvedere with $106,875 per family, while 2-person families (907 | 56.8%) have the highest median income of $32,139 per family member.
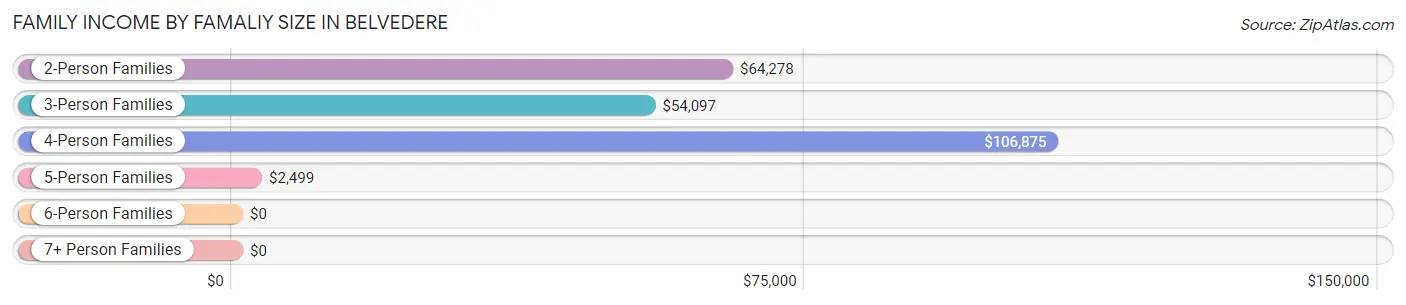
| Income Bracket | # Families | Median Income |
| 2-Person Families | 907 (56.8%) | $64,278 |
| 3-Person Families | 355 (22.2%) | $54,097 |
| 4-Person Families | 139 (8.7%) | $106,875 |
| 5-Person Families | 145 (9.1%) | $2,499 |
| 6-Person Families | 52 (3.3%) | $0 |
| 7+ Person Families | 0 (0.0%) | $0 |
| Total | 1,598 (100.0%) | $63,838 |
Family Income by Number of Earners in Belvedere
The median family income in Belvedere is $63,838, with families comprising 3+ earners (94) having the highest median family income of $121,188, while families with 1 earner (766) have the lowest median family income of $33,907, accounting for 5.9% and 47.9% of families, respectively.
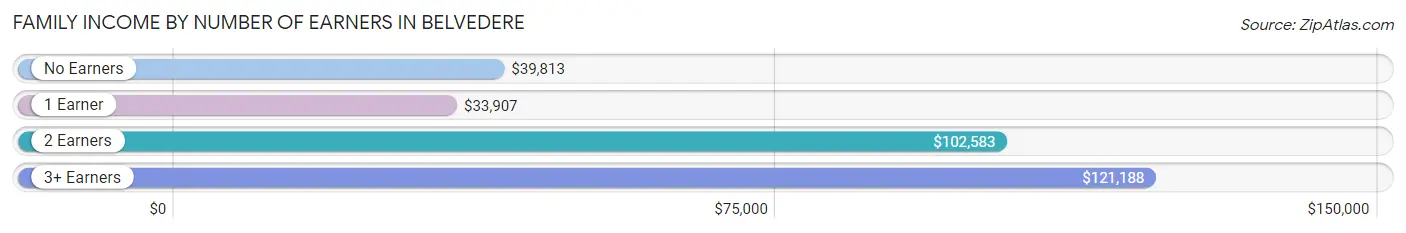
| Number of Earners | # Families | Median Income |
| No Earners | 170 (10.6%) | $39,813 |
| 1 Earner | 766 (47.9%) | $33,907 |
| 2 Earners | 568 (35.5%) | $102,583 |
| 3+ Earners | 94 (5.9%) | $121,188 |
| Total | 1,598 (100.0%) | $63,838 |
Household Income in Belvedere
Household Income Brackets in Belvedere
With 363 households falling in the category, the $50,000 to $74,999 income range is the most frequent in Belvedere, accounting for 14.9% of all households. In contrast, only 22 households (0.9%) fall into the $200,000+ income bracket, making it the least populous group.
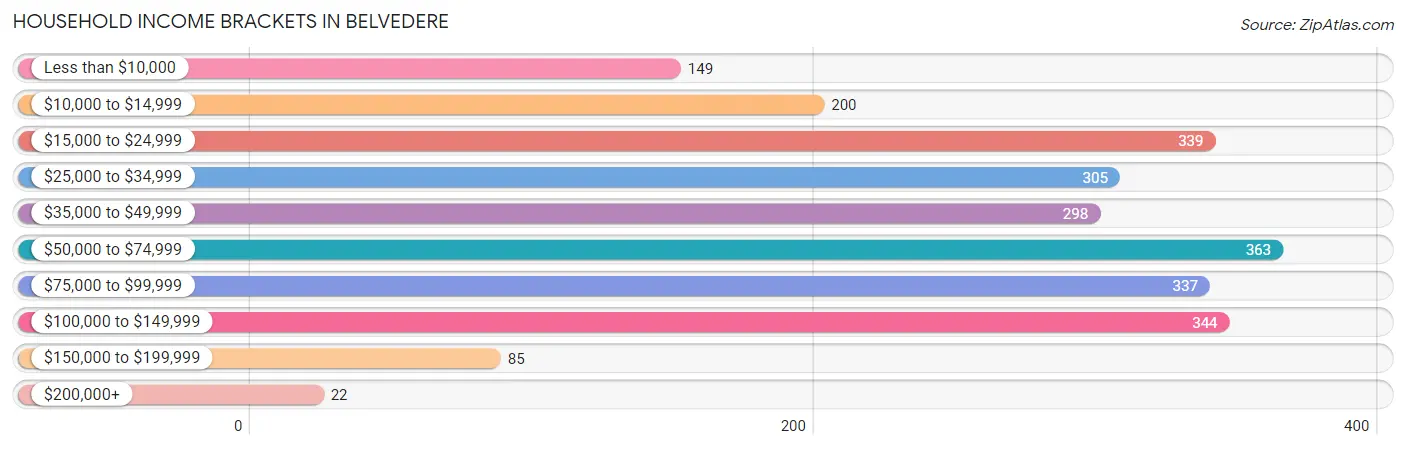
| Income Bracket | # Households | % Households |
| Less than $10,000 | 149 | 6.1% |
| $10,000 to $14,999 | 200 | 8.2% |
| $15,000 to $24,999 | 339 | 13.9% |
| $25,000 to $34,999 | 305 | 12.5% |
| $35,000 to $49,999 | 298 | 12.2% |
| $50,000 to $74,999 | 363 | 14.9% |
| $75,000 to $99,999 | 337 | 13.8% |
| $100,000 to $149,999 | 344 | 14.1% |
| $150,000 to $199,999 | 85 | 3.5% |
| $200,000+ | 22 | 0.9% |
Household Income by Householder Age in Belvedere
The median household income in Belvedere is $46,042, with the highest median household income of $62,767 found in the 45 to 64 years age bracket for the primary householder. A total of 937 households (38.4%) fall into this category. Meanwhile, the 15 to 24 years age bracket for the primary householder has the lowest median household income of $0, with 81 households (3.3%) in this group.
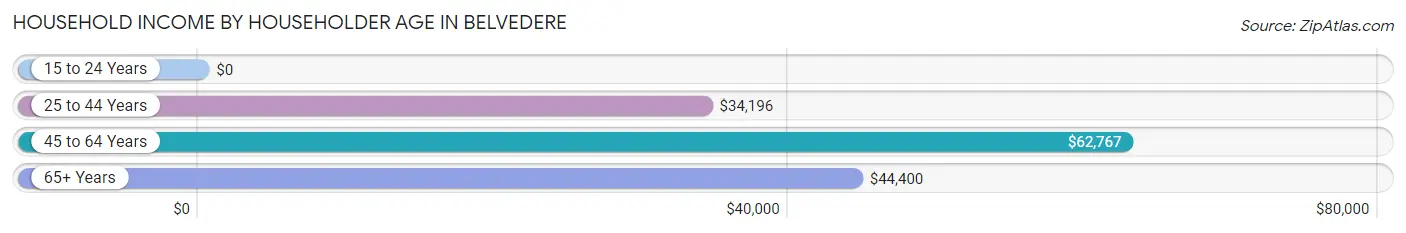
| Income Bracket | # Households | Median Income |
| 15 to 24 Years | 81 (3.3%) | $0 |
| 25 to 44 Years | 879 (36.0%) | $34,196 |
| 45 to 64 Years | 937 (38.4%) | $62,767 |
| 65+ Years | 542 (22.2%) | $44,400 |
| Total | 2,439 (100.0%) | $46,042 |
Poverty in Belvedere
Income Below Poverty by Sex and Age in Belvedere
With 27.9% poverty level for males and 15.0% for females among the residents of Belvedere, 15 year old males and 25 to 34 year old females are the most vulnerable to poverty, with 162 males (100.0%) and 109 females (45.2%) in their respective age groups living below the poverty level.
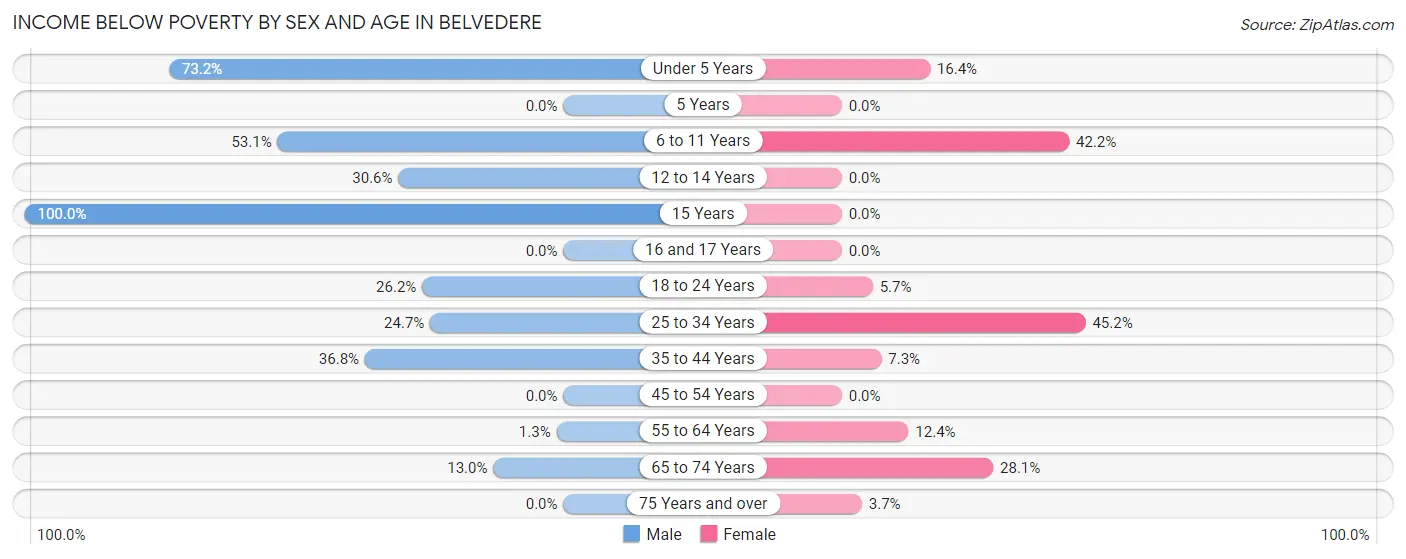
| Age Bracket | Male | Female |
| Under 5 Years | 112 (73.2%) | 27 (16.4%) |
| 5 Years | 0 (0.0%) | 0 (0.0%) |
| 6 to 11 Years | 78 (53.1%) | 100 (42.2%) |
| 12 to 14 Years | 94 (30.6%) | 0 (0.0%) |
| 15 Years | 162 (100.0%) | 0 (0.0%) |
| 16 and 17 Years | 0 (0.0%) | 0 (0.0%) |
| 18 to 24 Years | 65 (26.2%) | 17 (5.7%) |
| 25 to 34 Years | 66 (24.7%) | 109 (45.2%) |
| 35 to 44 Years | 207 (36.8%) | 24 (7.3%) |
| 45 to 54 Years | 0 (0.0%) | 0 (0.0%) |
| 55 to 64 Years | 4 (1.3%) | 55 (12.4%) |
| 65 to 74 Years | 16 (13.0%) | 75 (28.1%) |
| 75 Years and over | 0 (0.0%) | 11 (3.7%) |
| Total | 804 (27.9%) | 418 (15.0%) |
Income Above Poverty by Sex and Age in Belvedere
According to the poverty statistics in Belvedere, males aged 16 and 17 years and females aged 5 years are the age groups that are most secure financially, with 100.0% of males and 100.0% of females in these age groups living above the poverty line.
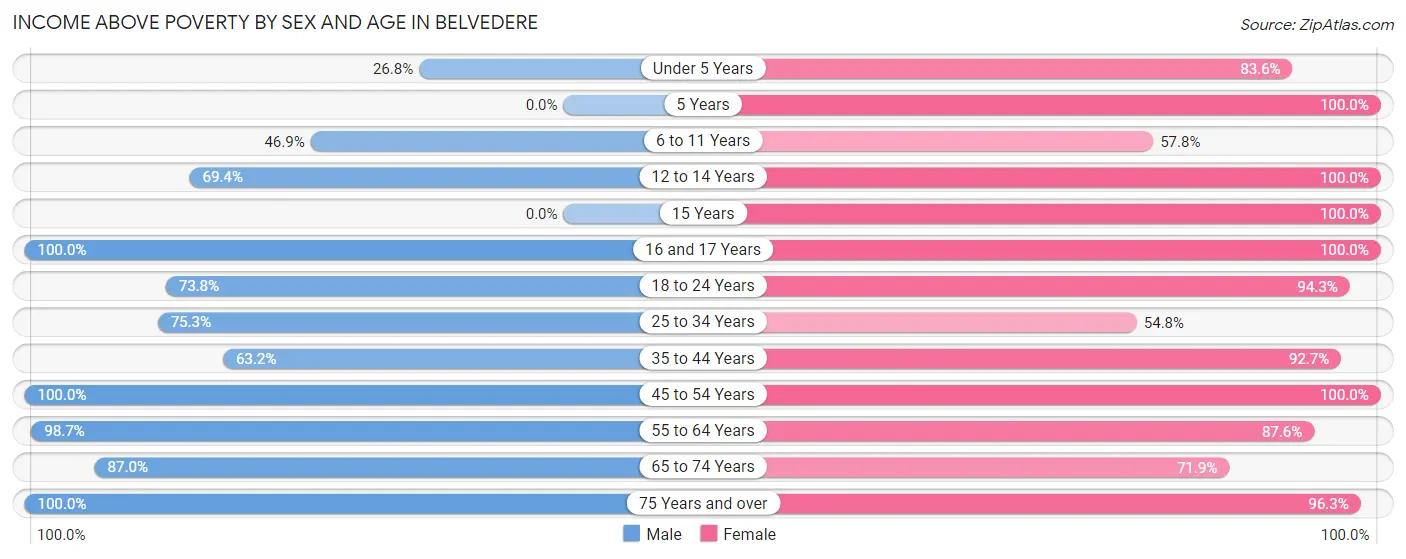
| Age Bracket | Male | Female |
| Under 5 Years | 41 (26.8%) | 138 (83.6%) |
| 5 Years | 0 (0.0%) | 16 (100.0%) |
| 6 to 11 Years | 69 (46.9%) | 137 (57.8%) |
| 12 to 14 Years | 213 (69.4%) | 188 (100.0%) |
| 15 Years | 0 (0.0%) | 17 (100.0%) |
| 16 and 17 Years | 55 (100.0%) | 40 (100.0%) |
| 18 to 24 Years | 183 (73.8%) | 279 (94.3%) |
| 25 to 34 Years | 201 (75.3%) | 132 (54.8%) |
| 35 to 44 Years | 355 (63.2%) | 303 (92.7%) |
| 45 to 54 Years | 439 (100.0%) | 255 (100.0%) |
| 55 to 64 Years | 312 (98.7%) | 390 (87.6%) |
| 65 to 74 Years | 107 (87.0%) | 192 (71.9%) |
| 75 Years and over | 106 (100.0%) | 285 (96.3%) |
| Total | 2,081 (72.1%) | 2,372 (85.0%) |
Income Below Poverty Among Married-Couple Families in Belvedere
The poverty statistics for married-couple families in Belvedere show that 3.0% or 22 of the total 728 families live below the poverty line. Families with 1 or 2 children have the highest poverty rate of 5.7%, comprising of 12 families. On the other hand, families with 3 or 4 children have the lowest poverty rate of 0.0%, which includes 0 families.
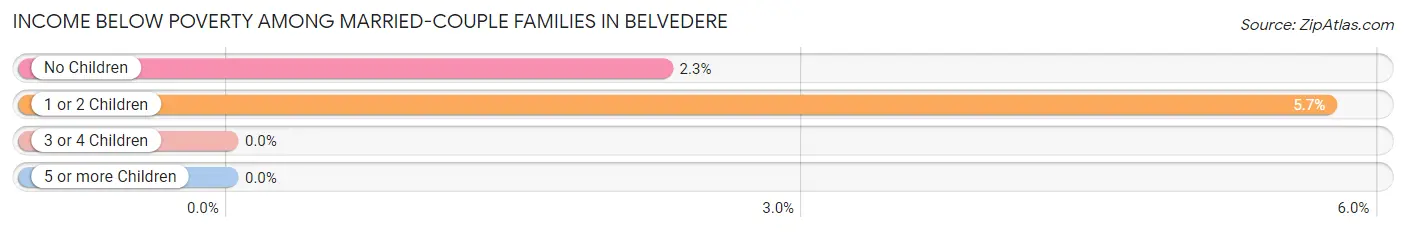
| Children | Above Poverty | Below Poverty |
| No Children | 431 (97.7%) | 10 (2.3%) |
| 1 or 2 Children | 197 (94.3%) | 12 (5.7%) |
| 3 or 4 Children | 78 (100.0%) | 0 (0.0%) |
| 5 or more Children | 0 (0.0%) | 0 (0.0%) |
| Total | 706 (97.0%) | 22 (3.0%) |
Income Below Poverty Among Single-Parent Households in Belvedere
According to the poverty data in Belvedere, 4.5% or 16 single-father households and 23.1% or 118 single-mother households are living below the poverty line. Among single-father households, those with 1 or 2 children have the highest poverty rate, with 16 households (5.2%) experiencing poverty. Likewise, among single-mother households, those with 3 or 4 children have the highest poverty rate, with 74 households (100.0%) falling below the poverty line.
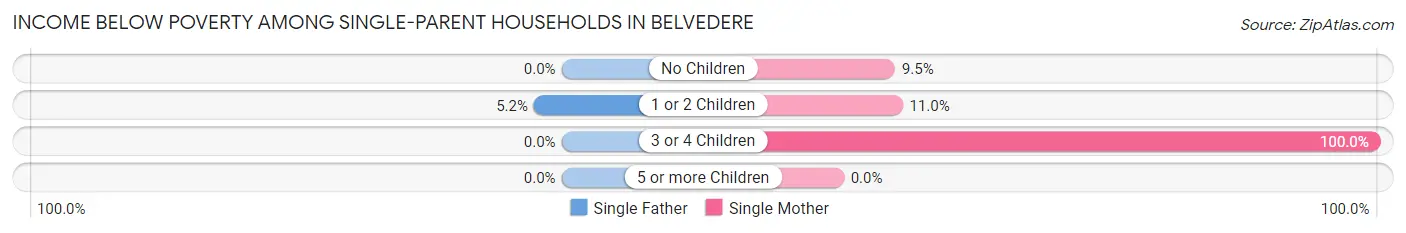
| Children | Single Father | Single Mother |
| No Children | 0 (0.0%) | 27 (9.5%) |
| 1 or 2 Children | 16 (5.2%) | 17 (11.0%) |
| 3 or 4 Children | 0 (0.0%) | 74 (100.0%) |
| 5 or more Children | 0 (0.0%) | 0 (0.0%) |
| Total | 16 (4.5%) | 118 (23.1%) |
Income Below Poverty Among Married-Couple vs Single-Parent Households in Belvedere
The poverty data for Belvedere shows that 22 of the married-couple family households (3.0%) and 134 of the single-parent households (15.4%) are living below the poverty level. Within the married-couple family households, those with 1 or 2 children have the highest poverty rate, with 12 households (5.7%) falling below the poverty line. Among the single-parent households, those with 3 or 4 children have the highest poverty rate, with 74 household (100.0%) living below poverty.
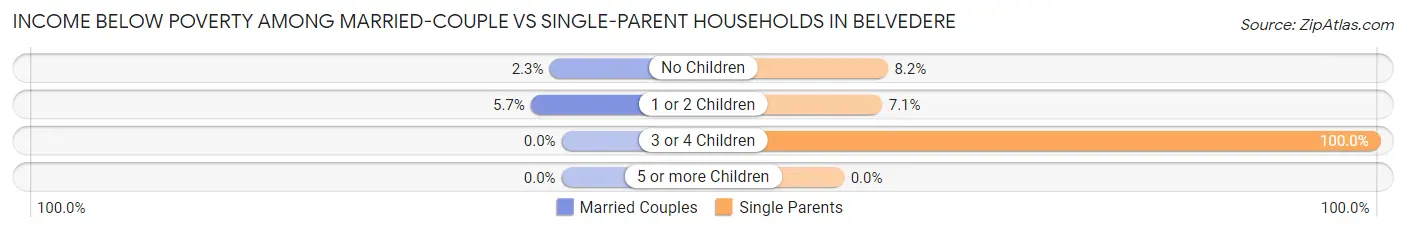
| Children | Married-Couple Families | Single-Parent Households |
| No Children | 10 (2.3%) | 27 (8.2%) |
| 1 or 2 Children | 12 (5.7%) | 33 (7.1%) |
| 3 or 4 Children | 0 (0.0%) | 74 (100.0%) |
| 5 or more Children | 0 (0.0%) | 0 (0.0%) |
| Total | 22 (3.0%) | 134 (15.4%) |
Race in Belvedere
The most populous races in Belvedere are White / Caucasian (3,300 | 57.0%), Black / African American (1,724 | 29.8%), and Two or more Races (512 | 8.8%).
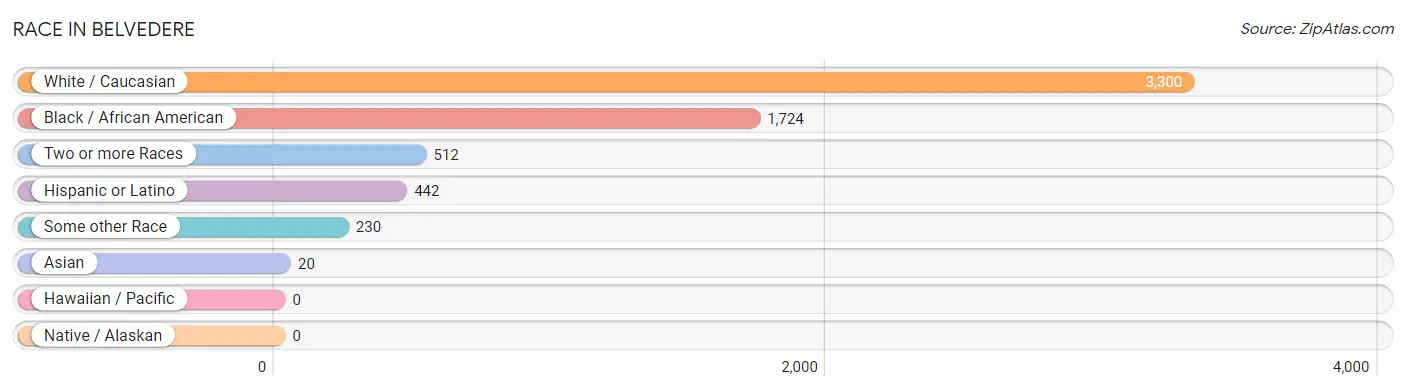
| Race | # Population | % Population |
| Asian | 20 | 0.4% |
| Black / African American | 1,724 | 29.8% |
| Hawaiian / Pacific | 0 | 0.0% |
| Hispanic or Latino | 442 | 7.6% |
| Native / Alaskan | 0 | 0.0% |
| White / Caucasian | 3,300 | 57.0% |
| Two or more Races | 512 | 8.8% |
| Some other Race | 230 | 4.0% |
| Total | 5,786 | 100.0% |
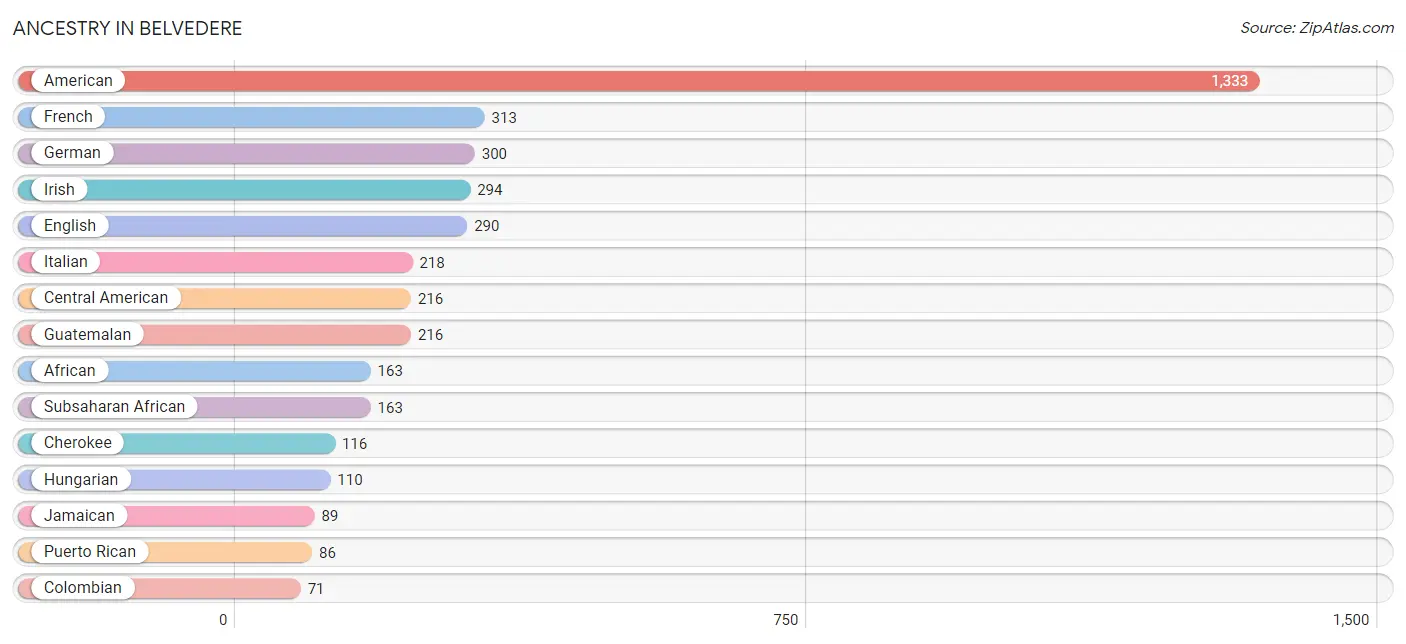
Ancestry in Belvedere
The most populous ancestries reported in Belvedere are American (1,333 | 23.0%), French (313 | 5.4%), German (300 | 5.2%), Irish (294 | 5.1%), and English (290 | 5.0%), together accounting for 43.7% of all Belvedere residents.
| Ancestry | # Population | % Population |
| African | 163 | 2.8% |
| American | 1,333 | 23.0% |
| Bhutanese | 10 | 0.2% |
| British | 28 | 0.5% |
| Central American | 216 | 3.7% |
| Cherokee | 116 | 2.0% |
| Colombian | 71 | 1.2% |
| Cuban | 26 | 0.4% |
| Danish | 1 | 0.0% |
| Eastern European | 37 | 0.6% |
| English | 290 | 5.0% |
| European | 64 | 1.1% |
| French | 313 | 5.4% |
| French Canadian | 52 | 0.9% |
| German | 300 | 5.2% |
| Greek | 18 | 0.3% |
| Guatemalan | 216 | 3.7% |
| Hungarian | 110 | 1.9% |
| Irish | 294 | 5.1% |
| Italian | 218 | 3.8% |
| Jamaican | 89 | 1.5% |
| Korean | 56 | 1.0% |
| Mexican | 43 | 0.7% |
| Norwegian | 18 | 0.3% |
| Polish | 28 | 0.5% |
| Portuguese | 26 | 0.4% |
| Puerto Rican | 86 | 1.5% |
| Scandinavian | 19 | 0.3% |
| Scotch-Irish | 15 | 0.3% |
| Slovene | 10 | 0.2% |
| South American | 71 | 1.2% |
| Subsaharan African | 163 | 2.8% |
| Swiss | 12 | 0.2% |
| Thai | 10 | 0.2% |
| Welsh | 13 | 0.2% | View All 35 Rows |
Immigrants in Belvedere
The most numerous immigrant groups reported in Belvedere came from Latin America (191 | 3.3%), Central America (94 | 1.6%), Guatemala (93 | 1.6%), Colombia (71 | 1.2%), and South America (71 | 1.2%), together accounting for 9.0% of all Belvedere residents.
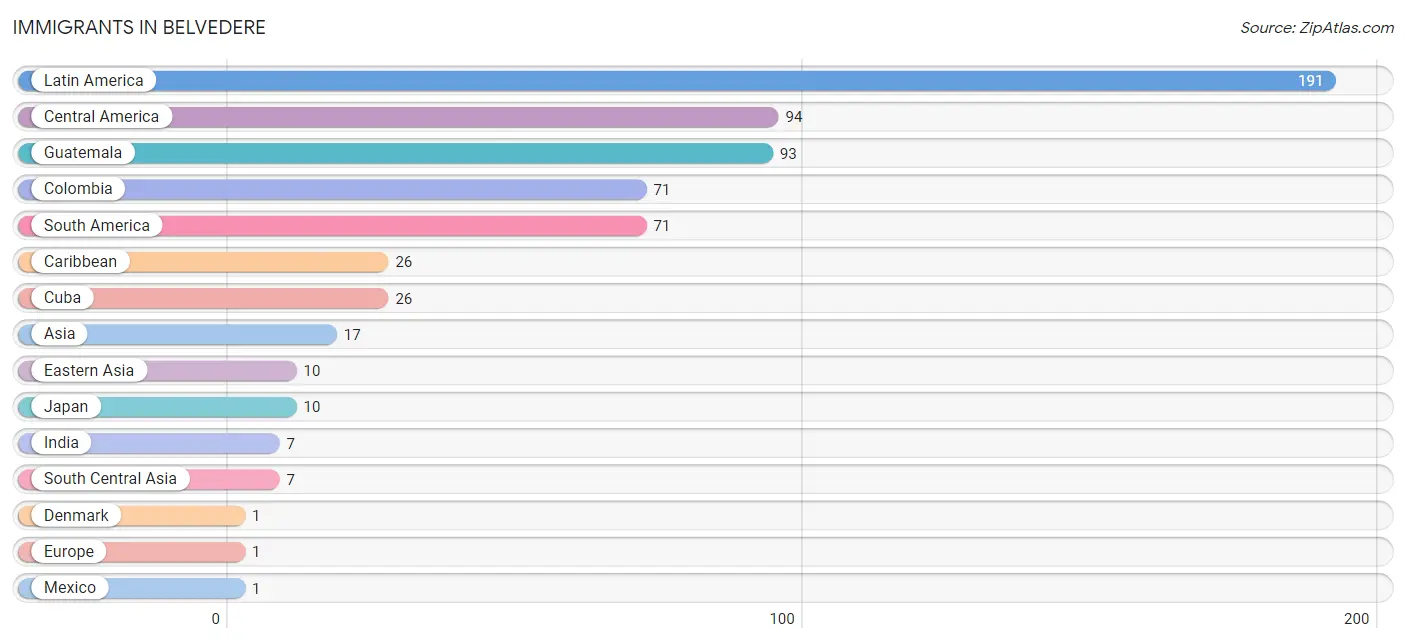
| Immigration Origin | # Population | % Population |
| Asia | 17 | 0.3% |
| Caribbean | 26 | 0.4% |
| Central America | 94 | 1.6% |
| Colombia | 71 | 1.2% |
| Cuba | 26 | 0.4% |
| Denmark | 1 | 0.0% |
| Eastern Asia | 10 | 0.2% |
| Europe | 1 | 0.0% |
| Guatemala | 93 | 1.6% |
| India | 7 | 0.1% |
| Japan | 10 | 0.2% |
| Latin America | 191 | 3.3% |
| Mexico | 1 | 0.0% |
| Northern Europe | 1 | 0.0% |
| South America | 71 | 1.2% |
| South Central Asia | 7 | 0.1% | View All 16 Rows |
Sex and Age in Belvedere
Sex and Age in Belvedere
The most populous age groups in Belvedere are 10 to 14 Years (490 | 16.4%) for men and 10 to 14 Years (266 | 9.5%) for women.
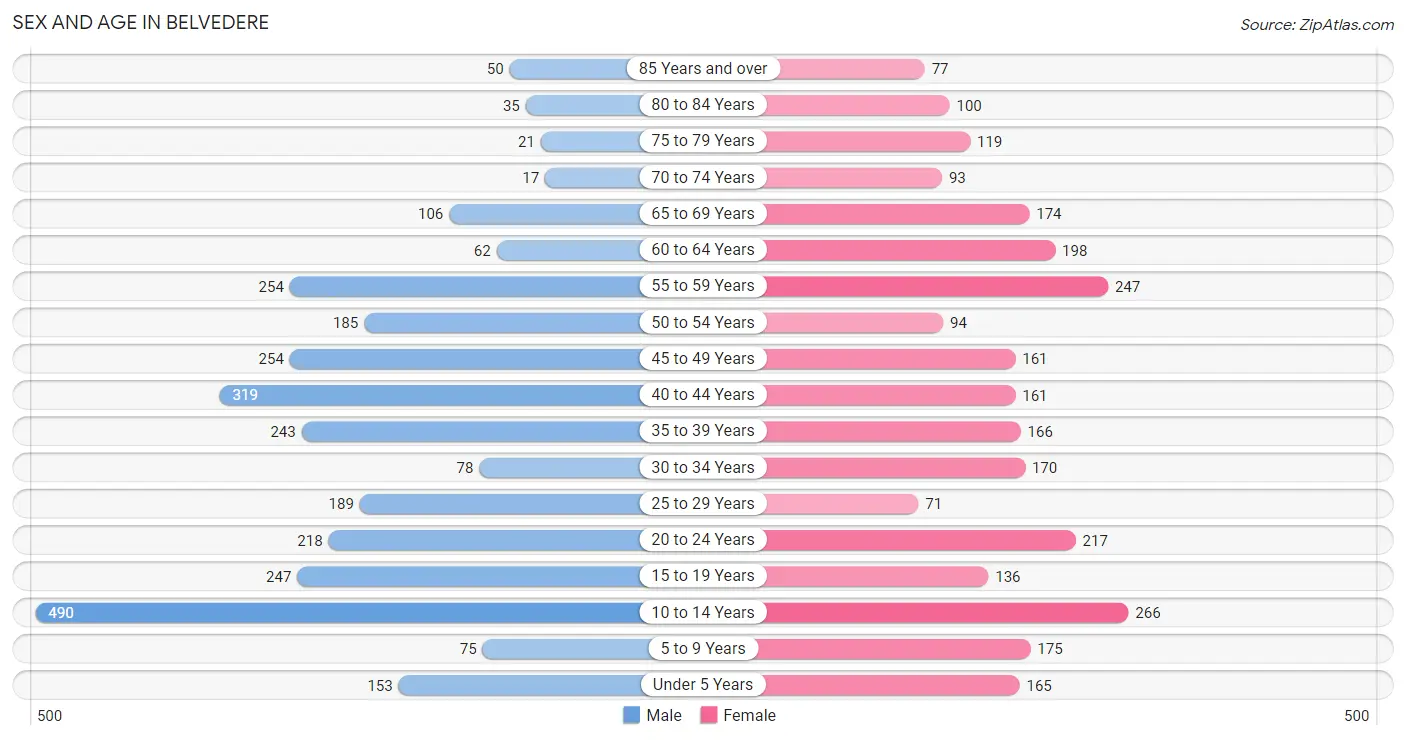
| Age Bracket | Male | Female |
| Under 5 Years | 153 (5.1%) | 165 (5.9%) |
| 5 to 9 Years | 75 (2.5%) | 175 (6.3%) |
| 10 to 14 Years | 490 (16.4%) | 266 (9.5%) |
| 15 to 19 Years | 247 (8.2%) | 136 (4.9%) |
| 20 to 24 Years | 218 (7.3%) | 217 (7.8%) |
| 25 to 29 Years | 189 (6.3%) | 71 (2.5%) |
| 30 to 34 Years | 78 (2.6%) | 170 (6.1%) |
| 35 to 39 Years | 243 (8.1%) | 166 (5.9%) |
| 40 to 44 Years | 319 (10.6%) | 161 (5.8%) |
| 45 to 49 Years | 254 (8.5%) | 161 (5.8%) |
| 50 to 54 Years | 185 (6.2%) | 94 (3.4%) |
| 55 to 59 Years | 254 (8.5%) | 247 (8.8%) |
| 60 to 64 Years | 62 (2.1%) | 198 (7.1%) |
| 65 to 69 Years | 106 (3.5%) | 174 (6.2%) |
| 70 to 74 Years | 17 (0.6%) | 93 (3.3%) |
| 75 to 79 Years | 21 (0.7%) | 119 (4.3%) |
| 80 to 84 Years | 35 (1.2%) | 100 (3.6%) |
| 85 Years and over | 50 (1.7%) | 77 (2.8%) |
| Total | 2,996 (100.0%) | 2,790 (100.0%) |
Families and Households in Belvedere
Median Family Size in Belvedere
The median family size in Belvedere is 2.78 persons per family, with single female/mother families (512 | 32.0%) accounting for the largest median family size of 3 persons per family. On the other hand, single male/father families (358 | 22.4%) represent the smallest median family size with 2.22 persons per family.
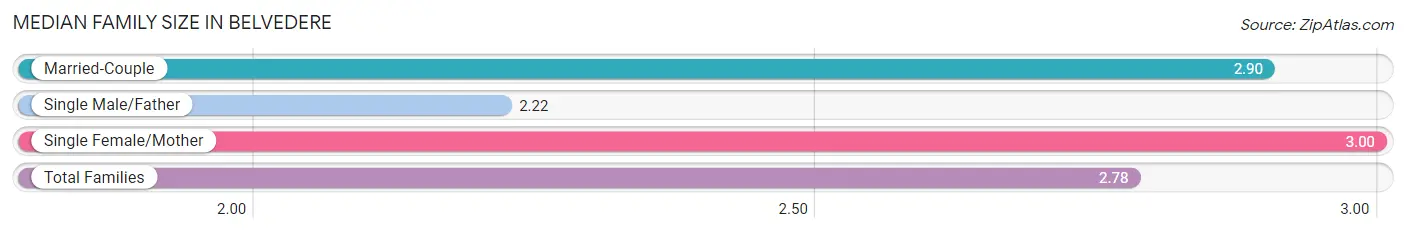
| Family Type | # Families | Family Size |
| Married-Couple | 728 (45.6%) | 2.90 |
| Single Male/Father | 358 (22.4%) | 2.22 |
| Single Female/Mother | 512 (32.0%) | 3.00 |
| Total Families | 1,598 (100.0%) | 2.78 |
Median Household Size in Belvedere
The median household size in Belvedere is 2.36 persons per household, with married-couple households (728 | 29.8%) accounting for the largest median household size of 3.27 persons per household. non-family households (841 | 34.5%) represent the smallest median household size with 1.18 persons per household.
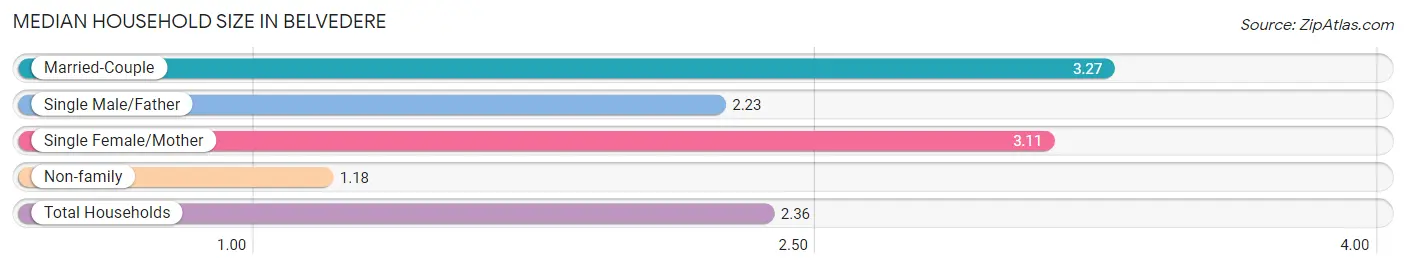
| Household Type | # Households | Household Size |
| Married-Couple | 728 (29.8%) | 3.27 |
| Single Male/Father | 358 (14.7%) | 2.23 |
| Single Female/Mother | 512 (21.0%) | 3.11 |
| Non-family | 841 (34.5%) | 1.18 |
| Total Households | 2,439 (100.0%) | 2.36 |
Household Size by Marriage Status in Belvedere
Out of a total of 2,439 households in Belvedere, 1,598 (65.5%) are family households, while 841 (34.5%) are nonfamily households. The most numerous type of family households are 2-person households, comprising 797, and the most common type of nonfamily households are 1-person households, comprising 682.
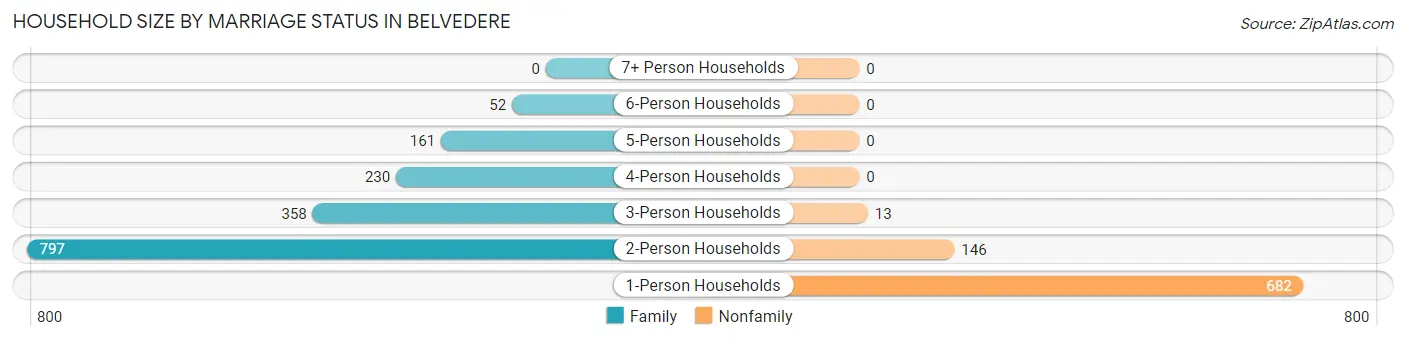
| Household Size | Family Households | Nonfamily Households |
| 1-Person Households | - | 682 (28.0%) |
| 2-Person Households | 797 (32.7%) | 146 (6.0%) |
| 3-Person Households | 358 (14.7%) | 13 (0.5%) |
| 4-Person Households | 230 (9.4%) | 0 (0.0%) |
| 5-Person Households | 161 (6.6%) | 0 (0.0%) |
| 6-Person Households | 52 (2.1%) | 0 (0.0%) |
| 7+ Person Households | 0 (0.0%) | 0 (0.0%) |
| Total | 1,598 (65.5%) | 841 (34.5%) |
Female Fertility in Belvedere
Fertility by Age in Belvedere
Average fertility rate in Belvedere is 71.0 births per 1,000 women. Women in the age bracket of 20 to 34 years have the highest fertility rate with 153.0 births per 1,000 women. Women in the age bracket of 20 to 34 years acount for 86.4% of all women with births.
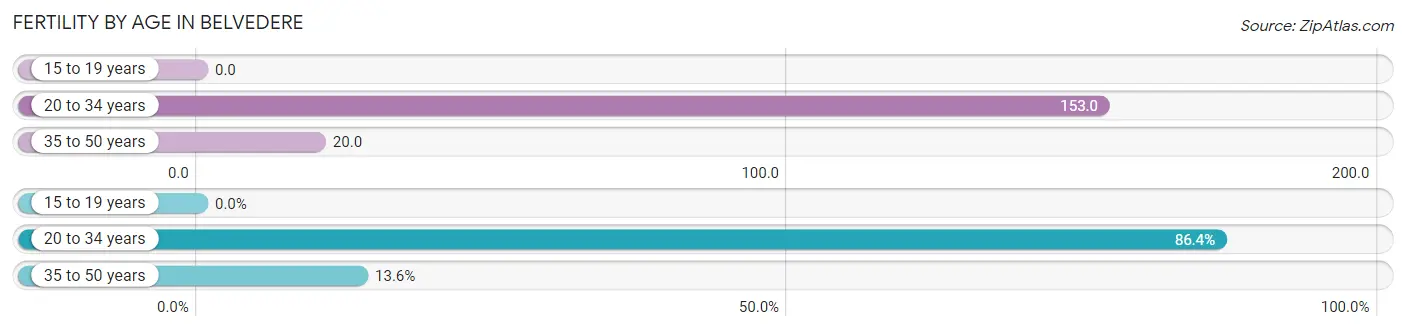
| Age Bracket | Women with Births | Births / 1,000 Women |
| 15 to 19 years | 0 (0.0%) | 0.0 |
| 20 to 34 years | 70 (86.4%) | 153.0 |
| 35 to 50 years | 11 (13.6%) | 20.0 |
| Total | 81 (100.0%) | 71.0 |
Fertility by Age by Marriage Status in Belvedere
66.7% of women with births (81) in Belvedere are married. The highest percentage of unmarried women with births falls into 35 to 50 years age bracket with 100.0% of them unmarried at the time of birth, while the lowest percentage of unmarried women with births belong to 20 to 34 years age bracket with 22.9% of them unmarried.
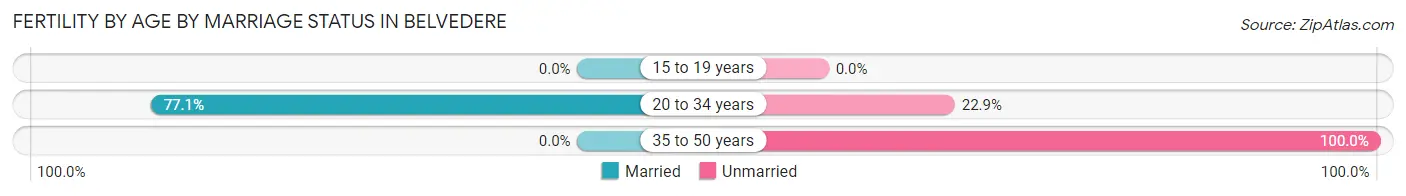
| Age Bracket | Married | Unmarried |
| 15 to 19 years | 0 (0.0%) | 0 (0.0%) |
| 20 to 34 years | 54 (77.1%) | 16 (22.9%) |
| 35 to 50 years | 0 (0.0%) | 11 (100.0%) |
| Total | 54 (66.7%) | 27 (33.3%) |
Fertility by Education in Belvedere
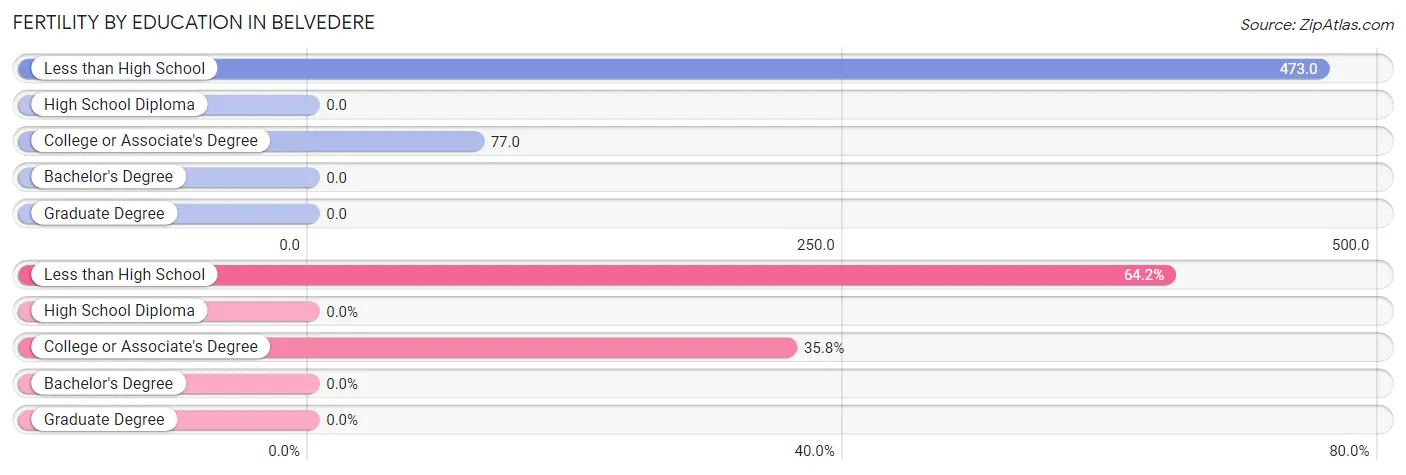
| Educational Attainment | Women with Births | Births / 1,000 Women |
| Less than High School | 52 (64.2%) | 473.0 |
| High School Diploma | 0 (0.0%) | 0.0 |
| College or Associate's Degree | 29 (35.8%) | 77.0 |
| Bachelor's Degree | 0 (0.0%) | 0.0 |
| Graduate Degree | 0 (0.0%) | 0.0 |
| Total | 81 (100.0%) | 71.0 |
Fertility by Education by Marriage Status in Belvedere
33.3% of women with births in Belvedere are unmarried. Women with the educational attainment of less than high school are most likely to be married with 100.0% of them married at childbirth, while women with the educational attainment of college or associate's degree are least likely to be married with 93.1% of them unmarried at childbirth.
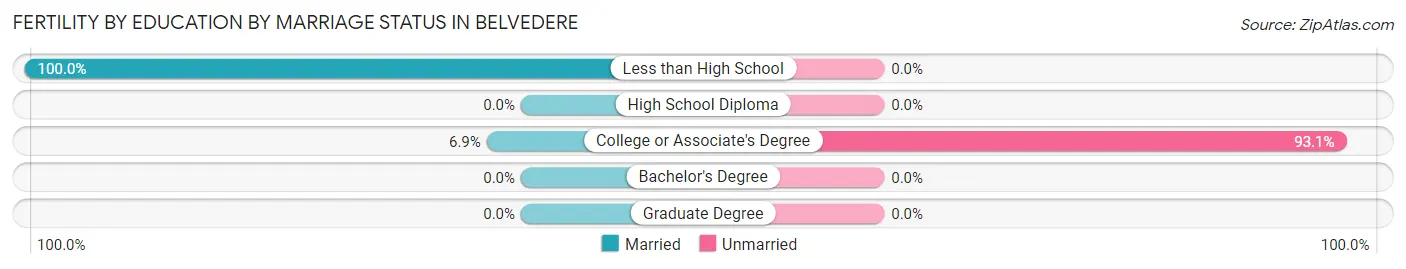
| Educational Attainment | Married | Unmarried |
| Less than High School | 52 (100.0%) | 0 (0.0%) |
| High School Diploma | 0 (0.0%) | 0 (0.0%) |
| College or Associate's Degree | 2 (6.9%) | 27 (93.1%) |
| Bachelor's Degree | 0 (0.0%) | 0 (0.0%) |
| Graduate Degree | 0 (0.0%) | 0 (0.0%) |
| Total | 54 (66.7%) | 27 (33.3%) |
Employment Characteristics in Belvedere
Employment by Class of Employer in Belvedere
Among the 2,559 employed individuals in Belvedere, private company employees (1,902 | 74.3%), state government employees (194 | 7.6%), and not-for-profit organizations (155 | 6.1%) make up the most common classes of employment.
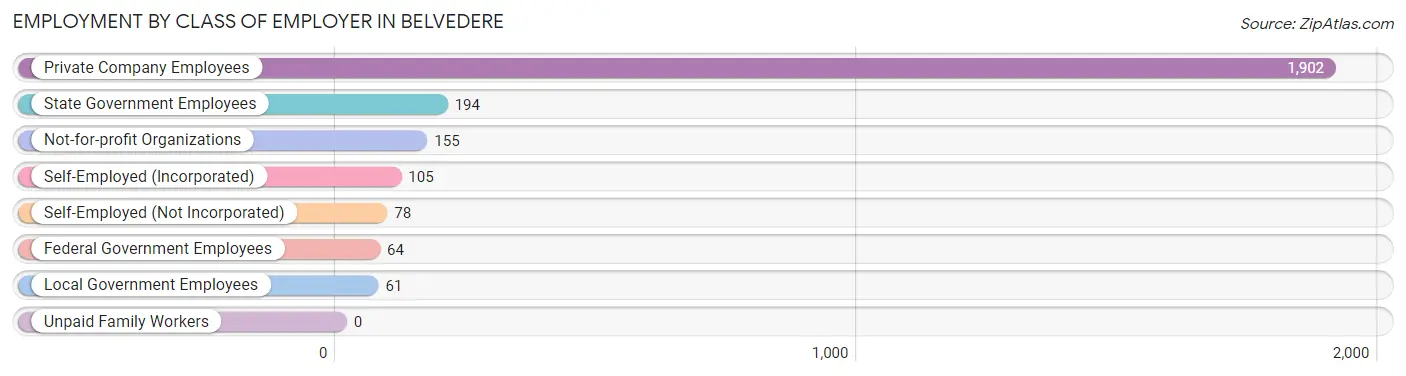
| Employer Class | # Employees | % Employees |
| Private Company Employees | 1,902 | 74.3% |
| Self-Employed (Incorporated) | 105 | 4.1% |
| Self-Employed (Not Incorporated) | 78 | 3.0% |
| Not-for-profit Organizations | 155 | 6.1% |
| Local Government Employees | 61 | 2.4% |
| State Government Employees | 194 | 7.6% |
| Federal Government Employees | 64 | 2.5% |
| Unpaid Family Workers | 0 | 0.0% |
| Total | 2,559 | 100.0% |
Employment Status by Age in Belvedere
According to the labor force statistics for Belvedere, out of the total population over 16 years of age (4,283), 66.0% or 2,827 individuals are in the labor force, with 6.4% or 181 of them unemployed. The age group with the highest labor force participation rate is 45 to 54 years, with 92.4% or 641 individuals in the labor force. Within the labor force, the 35 to 44 years age range has the highest percentage of unemployed individuals, with 19.3% or 146 of them being unemployed.
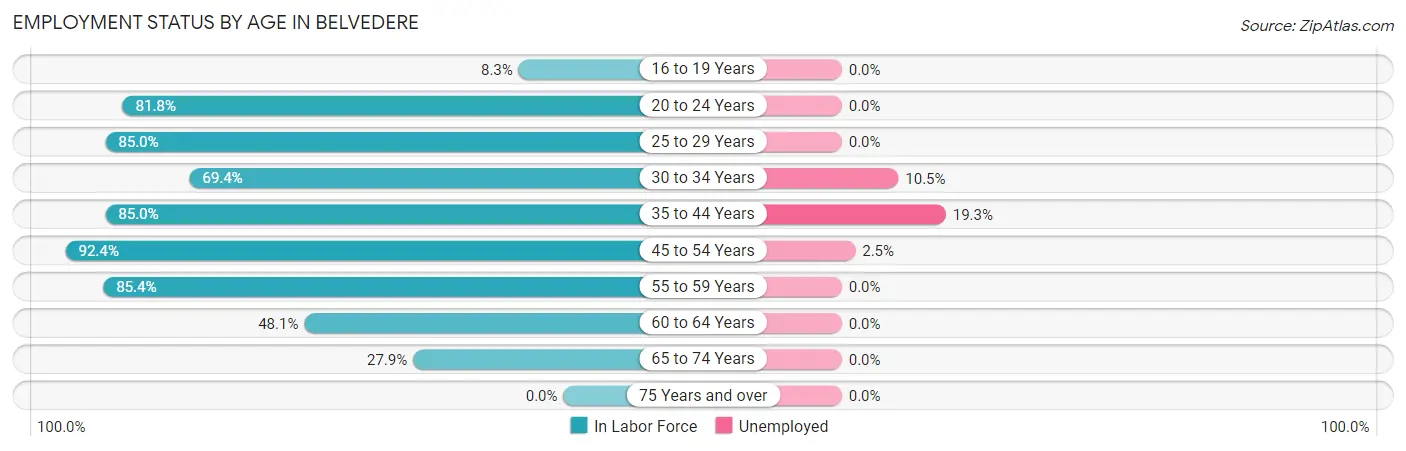
| Age Bracket | In Labor Force | Unemployed |
| 16 to 19 Years | 17 (8.3%) | 0 (0.0%) |
| 20 to 24 Years | 356 (81.8%) | 0 (0.0%) |
| 25 to 29 Years | 221 (85.0%) | 0 (0.0%) |
| 30 to 34 Years | 172 (69.4%) | 18 (10.5%) |
| 35 to 44 Years | 756 (85.0%) | 146 (19.3%) |
| 45 to 54 Years | 641 (92.4%) | 16 (2.5%) |
| 55 to 59 Years | 428 (85.4%) | 0 (0.0%) |
| 60 to 64 Years | 125 (48.1%) | 0 (0.0%) |
| 65 to 74 Years | 109 (27.9%) | 0 (0.0%) |
| 75 Years and over | 0 (0.0%) | 0 (0.0%) |
| Total | 2,827 (66.0%) | 181 (6.4%) |
Employment Status by Educational Attainment in Belvedere
According to labor force statistics for Belvedere, 82.2% of individuals (2,344) out of the total population between 25 and 64 years of age (2,852) are in the labor force, with 7.7% or 180 of them being unemployed. The group with the highest labor force participation rate are those with the educational attainment of bachelor's degree or higher, with 96.7% or 625 individuals in the labor force. Within the labor force, individuals with less than high school education have the highest percentage of unemployment, with 47.2% or 116 of them being unemployed.
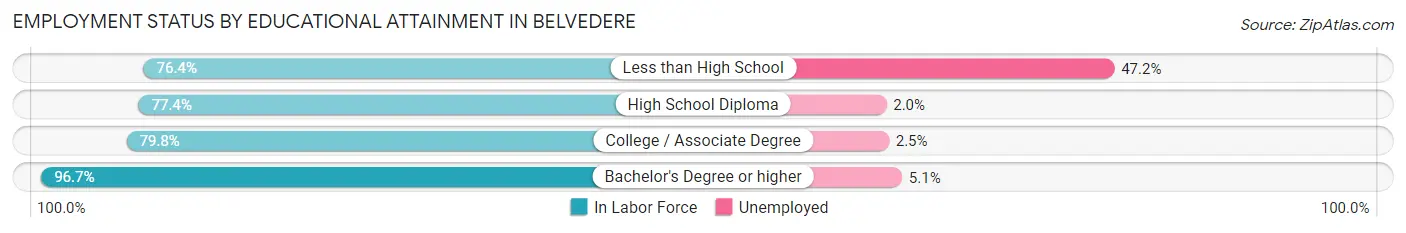
| Educational Attainment | In Labor Force | Unemployed |
| Less than High School | 246 (76.4%) | 152 (47.2%) |
| High School Diploma | 1,026 (77.4%) | 26 (2.0%) |
| College / Associate Degree | 446 (79.8%) | 14 (2.5%) |
| Bachelor's Degree or higher | 625 (96.7%) | 33 (5.1%) |
| Total | 2,344 (82.2%) | 220 (7.7%) |
Employment Occupations by Sex in Belvedere
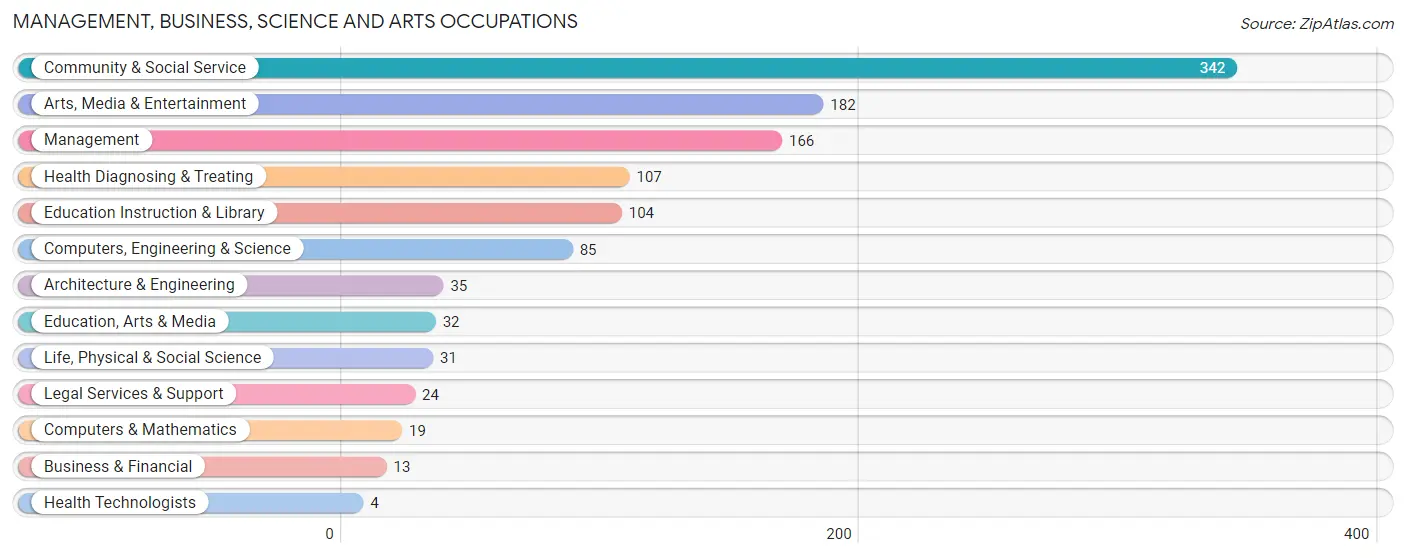
Management, Business, Science and Arts Occupations
The most common Management, Business, Science and Arts occupations in Belvedere are Community & Social Service (342 | 12.9%), Arts, Media & Entertainment (182 | 6.9%), Management (166 | 6.3%), Health Diagnosing & Treating (107 | 4.1%), and Education Instruction & Library (104 | 3.9%).
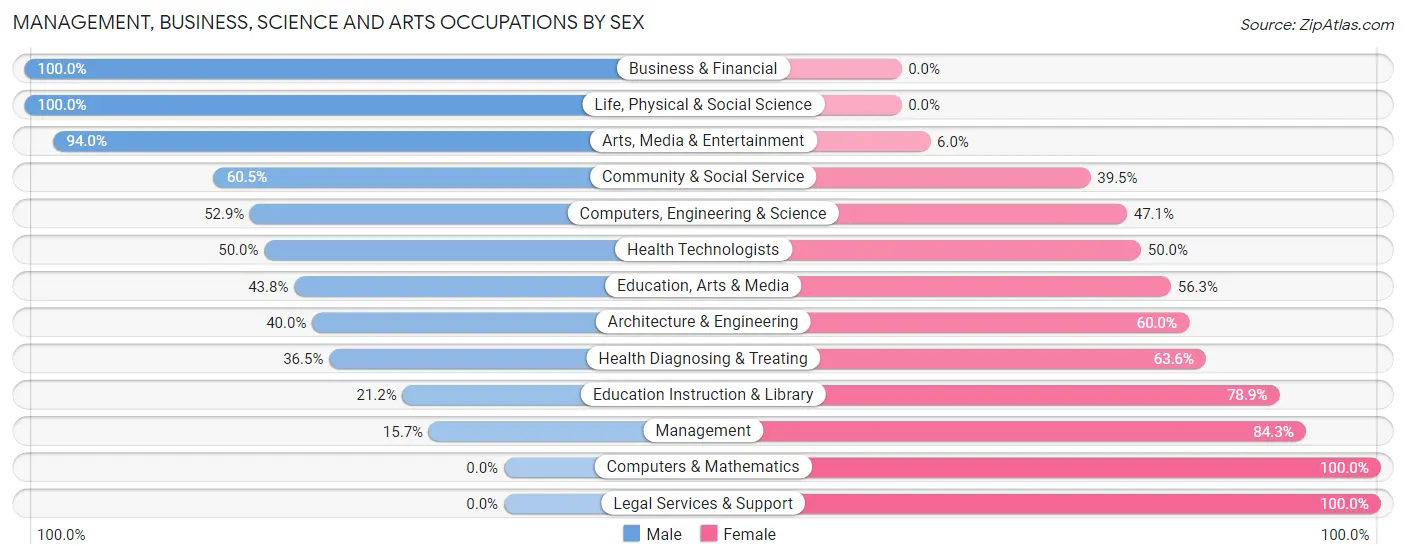
Management, Business, Science and Arts Occupations by Sex
Within the Management, Business, Science and Arts occupations in Belvedere, the most male-oriented occupations are Business & Financial (100.0%), Life, Physical & Social Science (100.0%), and Arts, Media & Entertainment (94.0%), while the most female-oriented occupations are Computers & Mathematics (100.0%), Legal Services & Support (100.0%), and Management (84.3%).
| Occupation | Male | Female |
| Management | 26 (15.7%) | 140 (84.3%) |
| Business & Financial | 13 (100.0%) | 0 (0.0%) |
| Computers, Engineering & Science | 45 (52.9%) | 40 (47.1%) |
| Computers & Mathematics | 0 (0.0%) | 19 (100.0%) |
| Architecture & Engineering | 14 (40.0%) | 21 (60.0%) |
| Life, Physical & Social Science | 31 (100.0%) | 0 (0.0%) |
| Community & Social Service | 207 (60.5%) | 135 (39.5%) |
| Education, Arts & Media | 14 (43.8%) | 18 (56.2%) |
| Legal Services & Support | 0 (0.0%) | 24 (100.0%) |
| Education Instruction & Library | 22 (21.1%) | 82 (78.8%) |
| Arts, Media & Entertainment | 171 (94.0%) | 11 (6.0%) |
| Health Diagnosing & Treating | 39 (36.4%) | 68 (63.5%) |
| Health Technologists | 2 (50.0%) | 2 (50.0%) |
| Total (Category) | 330 (46.3%) | 383 (53.7%) |
| Total (Overall) | 1,548 (58.5%) | 1,097 (41.5%) |
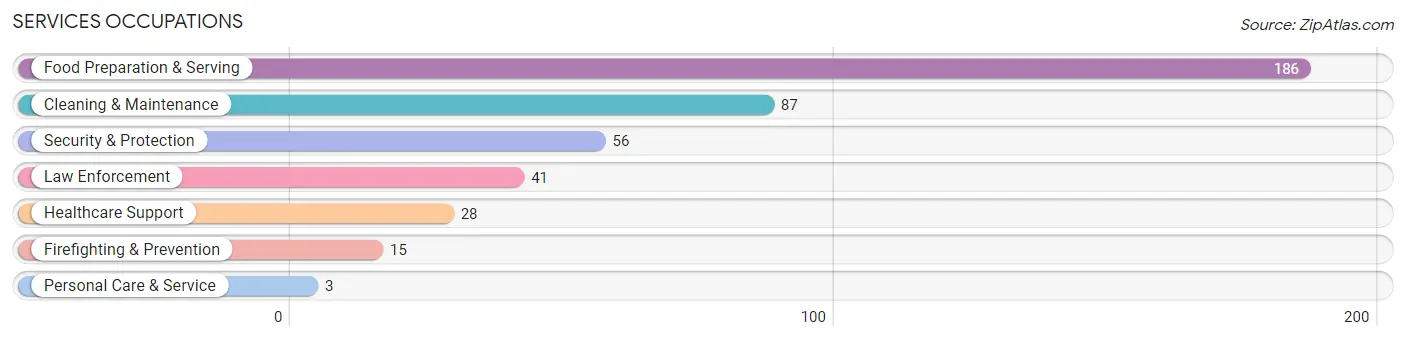
Services Occupations
The most common Services occupations in Belvedere are Food Preparation & Serving (186 | 7.0%), Cleaning & Maintenance (87 | 3.3%), Security & Protection (56 | 2.1%), Law Enforcement (41 | 1.5%), and Healthcare Support (28 | 1.1%).
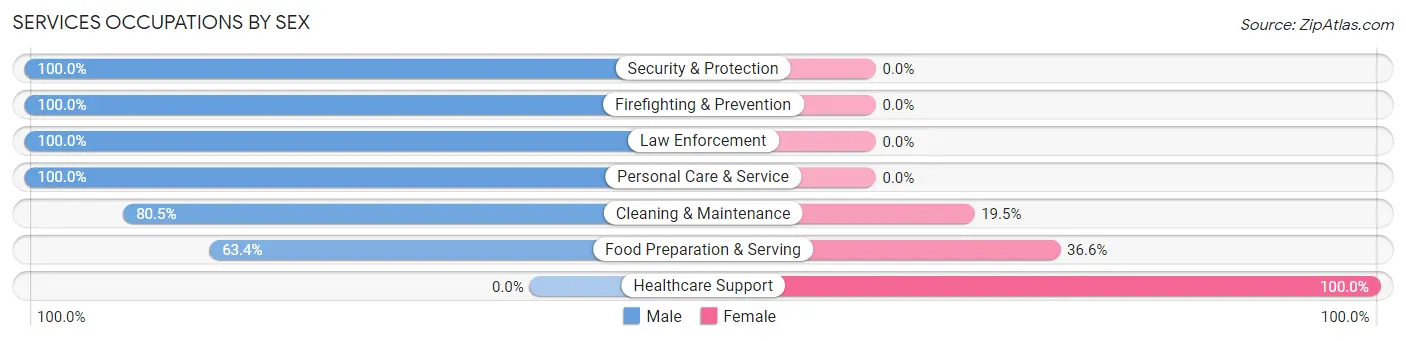
Services Occupations by Sex
Within the Services occupations in Belvedere, the most male-oriented occupations are Security & Protection (100.0%), Firefighting & Prevention (100.0%), and Law Enforcement (100.0%), while the most female-oriented occupations are Healthcare Support (100.0%), Food Preparation & Serving (36.6%), and Cleaning & Maintenance (19.5%).
| Occupation | Male | Female |
| Healthcare Support | 0 (0.0%) | 28 (100.0%) |
| Security & Protection | 56 (100.0%) | 0 (0.0%) |
| Firefighting & Prevention | 15 (100.0%) | 0 (0.0%) |
| Law Enforcement | 41 (100.0%) | 0 (0.0%) |
| Food Preparation & Serving | 118 (63.4%) | 68 (36.6%) |
| Cleaning & Maintenance | 70 (80.5%) | 17 (19.5%) |
| Personal Care & Service | 3 (100.0%) | 0 (0.0%) |
| Total (Category) | 247 (68.6%) | 113 (31.4%) |
| Total (Overall) | 1,548 (58.5%) | 1,097 (41.5%) |
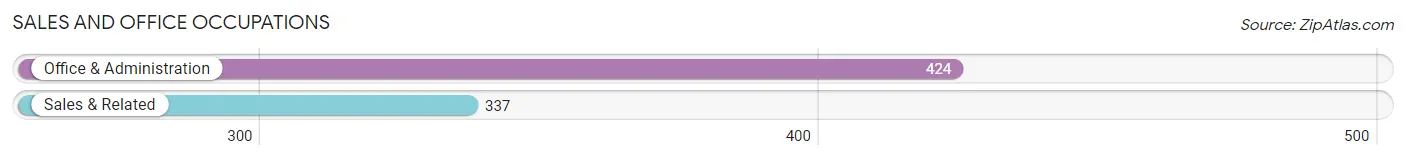
Sales and Office Occupations
The most common Sales and Office occupations in Belvedere are Office & Administration (424 | 16.0%), and Sales & Related (337 | 12.7%).
Sales and Office Occupations by Sex
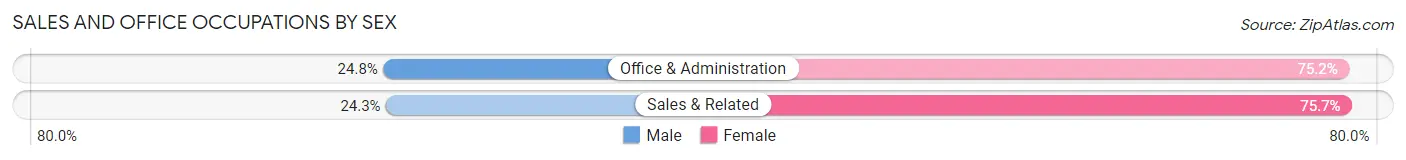
| Occupation | Male | Female |
| Sales & Related | 82 (24.3%) | 255 (75.7%) |
| Office & Administration | 105 (24.8%) | 319 (75.2%) |
| Total (Category) | 187 (24.6%) | 574 (75.4%) |
| Total (Overall) | 1,548 (58.5%) | 1,097 (41.5%) |
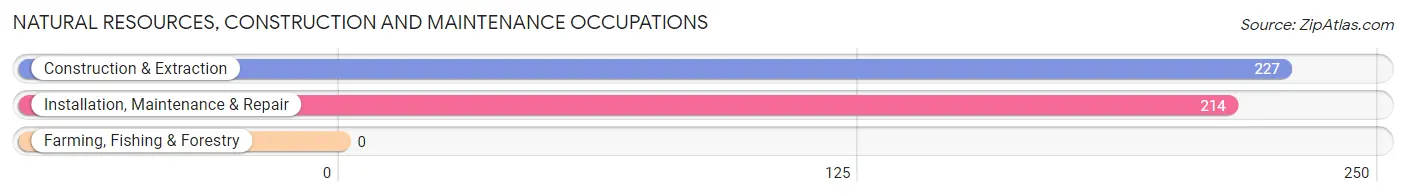
Natural Resources, Construction and Maintenance Occupations
The most common Natural Resources, Construction and Maintenance occupations in Belvedere are Construction & Extraction (227 | 8.6%), and Installation, Maintenance & Repair (214 | 8.1%).
Natural Resources, Construction and Maintenance Occupations by Sex
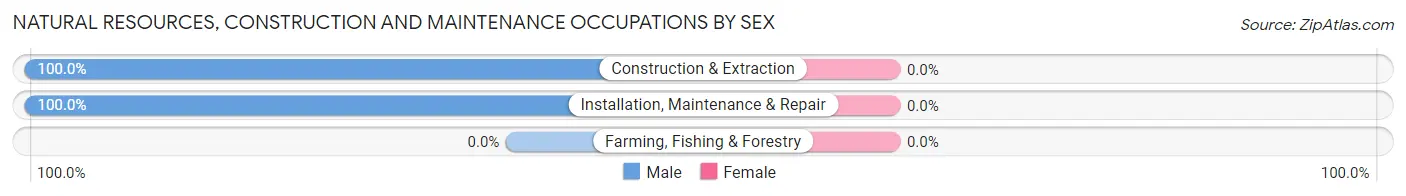
| Occupation | Male | Female |
| Farming, Fishing & Forestry | 0 (0.0%) | 0 (0.0%) |
| Construction & Extraction | 227 (100.0%) | 0 (0.0%) |
| Installation, Maintenance & Repair | 214 (100.0%) | 0 (0.0%) |
| Total (Category) | 441 (100.0%) | 0 (0.0%) |
| Total (Overall) | 1,548 (58.5%) | 1,097 (41.5%) |
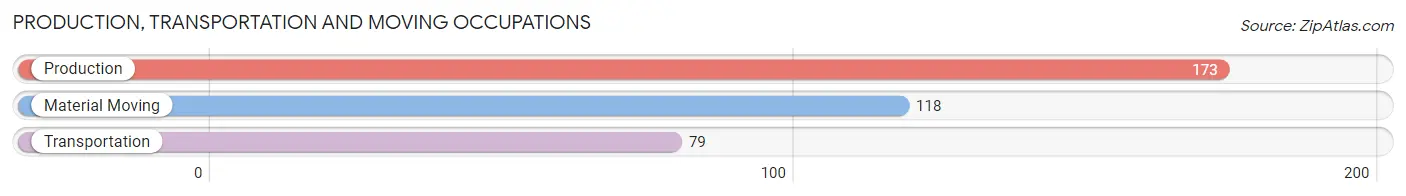
Production, Transportation and Moving Occupations
The most common Production, Transportation and Moving occupations in Belvedere are Production (173 | 6.5%), Material Moving (118 | 4.5%), and Transportation (79 | 3.0%).
Production, Transportation and Moving Occupations by Sex
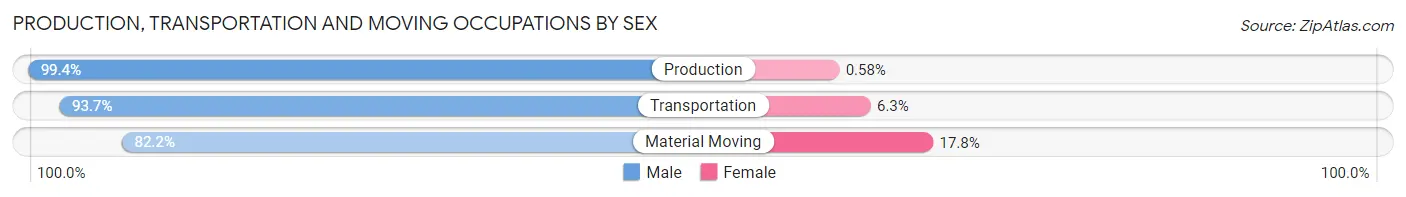
| Occupation | Male | Female |
| Production | 172 (99.4%) | 1 (0.6%) |
| Transportation | 74 (93.7%) | 5 (6.3%) |
| Material Moving | 97 (82.2%) | 21 (17.8%) |
| Total (Category) | 343 (92.7%) | 27 (7.3%) |
| Total (Overall) | 1,548 (58.5%) | 1,097 (41.5%) |
Employment Industries by Sex in Belvedere
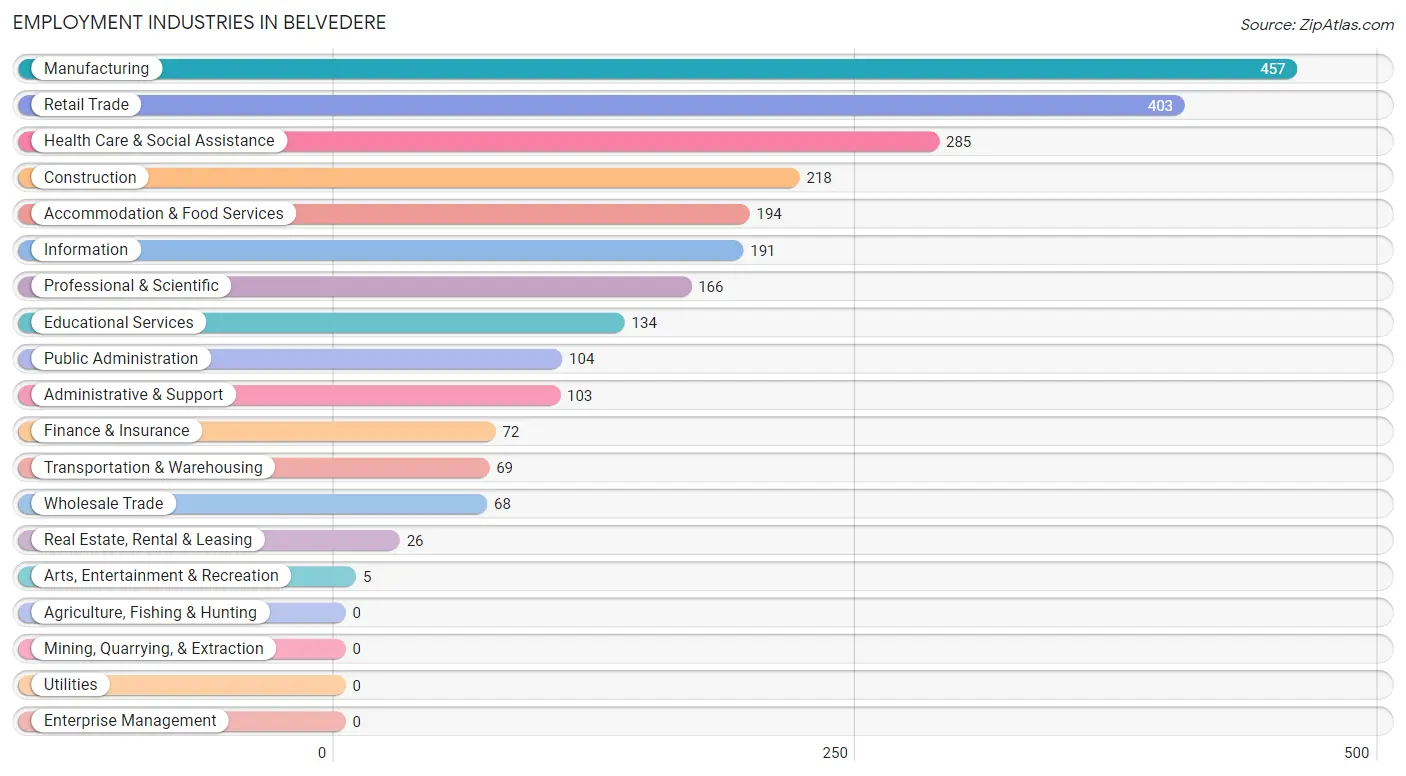
Employment Industries in Belvedere
The major employment industries in Belvedere include Manufacturing (457 | 17.3%), Retail Trade (403 | 15.2%), Health Care & Social Assistance (285 | 10.8%), Construction (218 | 8.2%), and Accommodation & Food Services (194 | 7.3%).
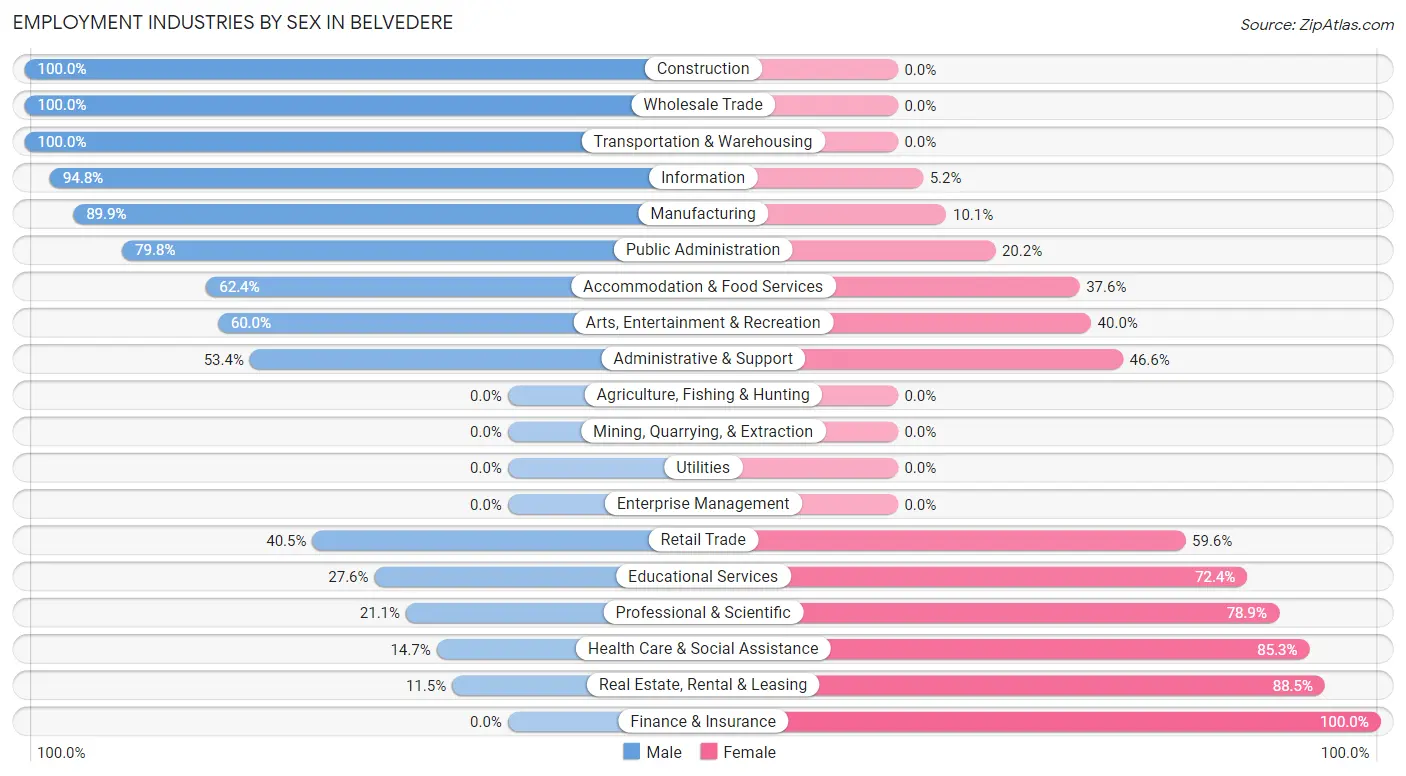
Employment Industries by Sex in Belvedere
The Belvedere industries that see more men than women are Construction (100.0%), Wholesale Trade (100.0%), and Transportation & Warehousing (100.0%), whereas the industries that tend to have a higher number of women are Finance & Insurance (100.0%), Real Estate, Rental & Leasing (88.5%), and Health Care & Social Assistance (85.3%).
| Industry | Male | Female |
| Agriculture, Fishing & Hunting | 0 (0.0%) | 0 (0.0%) |
| Mining, Quarrying, & Extraction | 0 (0.0%) | 0 (0.0%) |
| Construction | 218 (100.0%) | 0 (0.0%) |
| Manufacturing | 411 (89.9%) | 46 (10.1%) |
| Wholesale Trade | 68 (100.0%) | 0 (0.0%) |
| Retail Trade | 163 (40.5%) | 240 (59.6%) |
| Transportation & Warehousing | 69 (100.0%) | 0 (0.0%) |
| Utilities | 0 (0.0%) | 0 (0.0%) |
| Information | 181 (94.8%) | 10 (5.2%) |
| Finance & Insurance | 0 (0.0%) | 72 (100.0%) |
| Real Estate, Rental & Leasing | 3 (11.5%) | 23 (88.5%) |
| Professional & Scientific | 35 (21.1%) | 131 (78.9%) |
| Enterprise Management | 0 (0.0%) | 0 (0.0%) |
| Administrative & Support | 55 (53.4%) | 48 (46.6%) |
| Educational Services | 37 (27.6%) | 97 (72.4%) |
| Health Care & Social Assistance | 42 (14.7%) | 243 (85.3%) |
| Arts, Entertainment & Recreation | 3 (60.0%) | 2 (40.0%) |
| Accommodation & Food Services | 121 (62.4%) | 73 (37.6%) |
| Public Administration | 83 (79.8%) | 21 (20.2%) |
| Total | 1,548 (58.5%) | 1,097 (41.5%) |
Education in Belvedere
School Enrollment in Belvedere
The most common levels of schooling among the 1,600 students in Belvedere are middle school (730 | 45.6%), college / undergraduate (306 | 19.1%), and high school (258 | 16.1%).
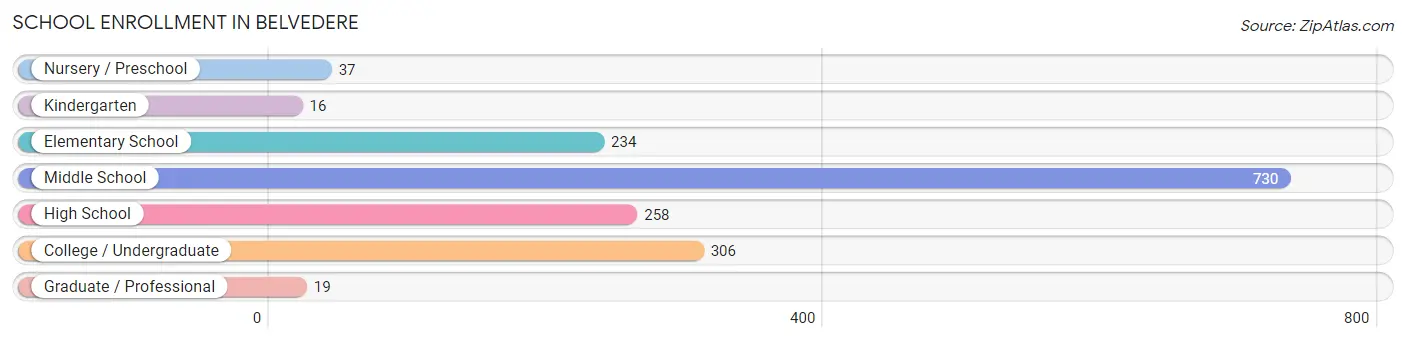
| School Level | # Students | % Students |
| Nursery / Preschool | 37 | 2.3% |
| Kindergarten | 16 | 1.0% |
| Elementary School | 234 | 14.6% |
| Middle School | 730 | 45.6% |
| High School | 258 | 16.1% |
| College / Undergraduate | 306 | 19.1% |
| Graduate / Professional | 19 | 1.2% |
| Total | 1,600 | 100.0% |
School Enrollment by Age by Funding Source in Belvedere
Out of a total of 1,600 students who are enrolled in schools in Belvedere, 51 (3.2%) attend a private institution, while the remaining 1,549 (96.8%) are enrolled in public schools. The age group of 18 to 19 year olds has the highest likelihood of being enrolled in private schools, with 28 (25.7% in the age bracket) enrolled. Conversely, the age group of 3 to 4 year olds has the lowest likelihood of being enrolled in a private school, with 37 (100.0% in the age bracket) attending a public institution.
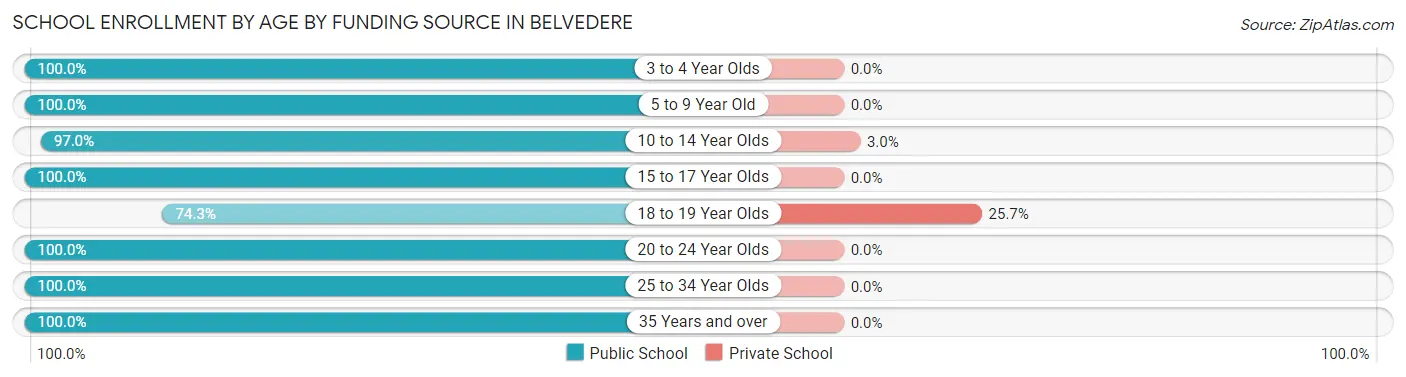
| Age Bracket | Public School | Private School |
| 3 to 4 Year Olds | 37 (100.0%) | 0 (0.0%) |
| 5 to 9 Year Old | 250 (100.0%) | 0 (0.0%) |
| 10 to 14 Year Olds | 733 (97.0%) | 23 (3.0%) |
| 15 to 17 Year Olds | 234 (100.0%) | 0 (0.0%) |
| 18 to 19 Year Olds | 81 (74.3%) | 28 (25.7%) |
| 20 to 24 Year Olds | 178 (100.0%) | 0 (0.0%) |
| 25 to 34 Year Olds | 19 (100.0%) | 0 (0.0%) |
| 35 Years and over | 17 (100.0%) | 0 (0.0%) |
| Total | 1,549 (96.8%) | 51 (3.2%) |
Educational Attainment by Field of Study in Belvedere
Business (232 | 30.4%), visual & performing arts (159 | 20.8%), education (104 | 13.6%), science & technology (71 | 9.3%), and liberal arts & history (45 | 5.9%) are the most common fields of study among 764 individuals in Belvedere who have obtained a bachelor's degree or higher.
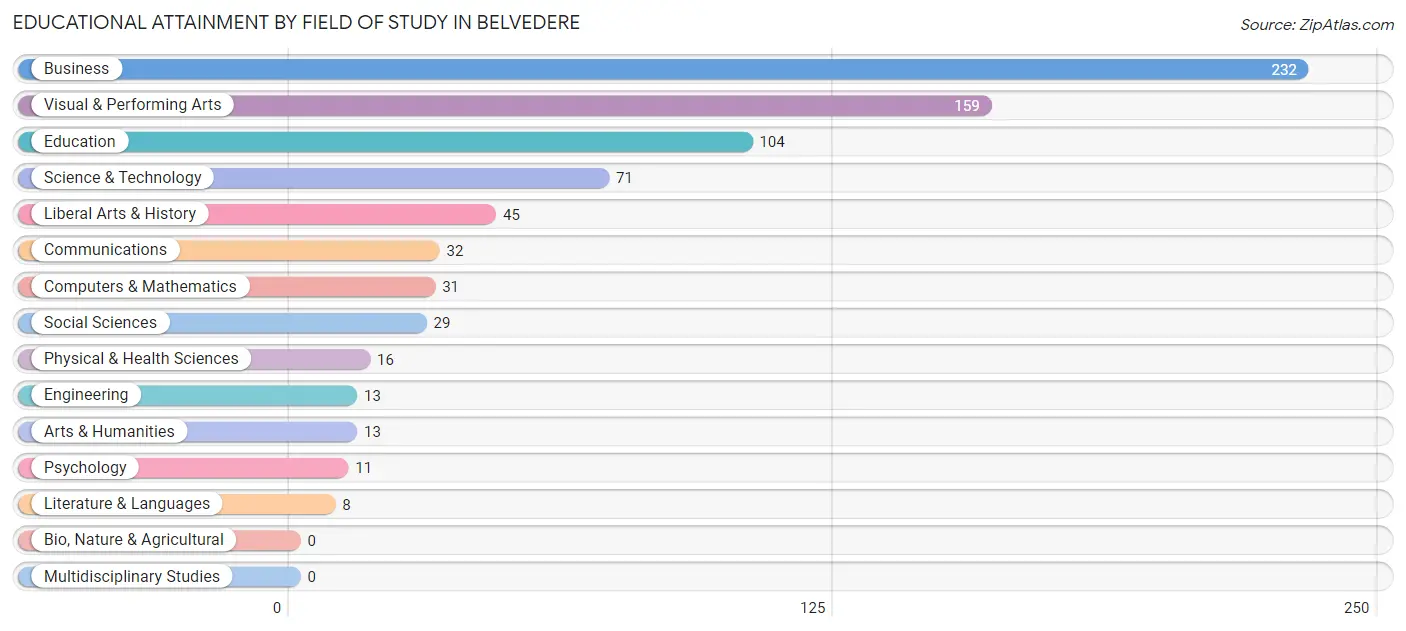
| Field of Study | # Graduates | % Graduates |
| Computers & Mathematics | 31 | 4.1% |
| Bio, Nature & Agricultural | 0 | 0.0% |
| Physical & Health Sciences | 16 | 2.1% |
| Psychology | 11 | 1.4% |
| Social Sciences | 29 | 3.8% |
| Engineering | 13 | 1.7% |
| Multidisciplinary Studies | 0 | 0.0% |
| Science & Technology | 71 | 9.3% |
| Business | 232 | 30.4% |
| Education | 104 | 13.6% |
| Literature & Languages | 8 | 1.1% |
| Liberal Arts & History | 45 | 5.9% |
| Visual & Performing Arts | 159 | 20.8% |
| Communications | 32 | 4.2% |
| Arts & Humanities | 13 | 1.7% |
| Total | 764 | 100.0% |
Transportation & Commute in Belvedere
Vehicle Availability by Sex in Belvedere
The most prevalent vehicle ownership categories in Belvedere are males with 2 vehicles (670, accounting for 43.5%) and females with 2 vehicles (526, making up 66.4%).
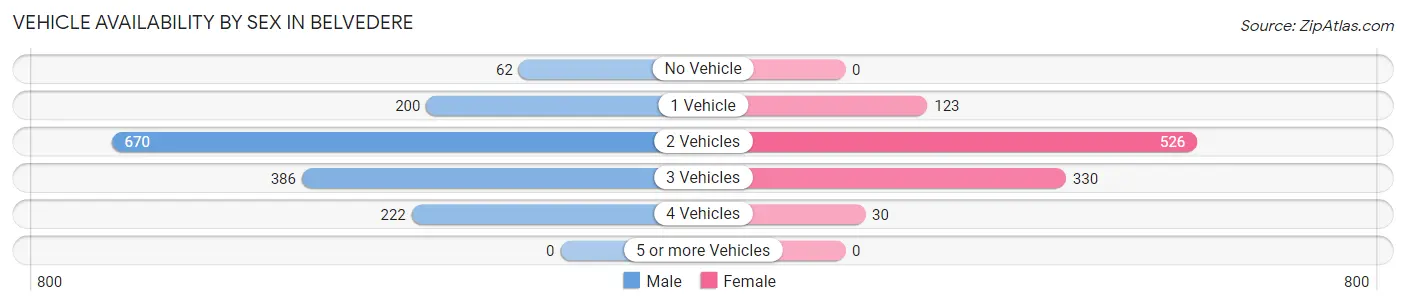
| Vehicles Available | Male | Female |
| No Vehicle | 62 (4.0%) | 0 (0.0%) |
| 1 Vehicle | 200 (13.0%) | 123 (12.2%) |
| 2 Vehicles | 670 (43.5%) | 526 (52.1%) |
| 3 Vehicles | 386 (25.1%) | 330 (32.7%) |
| 4 Vehicles | 222 (14.4%) | 30 (3.0%) |
| 5 or more Vehicles | 0 (0.0%) | 0 (0.0%) |
| Total | 1,540 (100.0%) | 1,009 (100.0%) |
Commute Time in Belvedere
The most frequently occuring commute durations in Belvedere are 20 to 24 minutes (489 commuters, 21.6%), 10 to 14 minutes (442 commuters, 19.6%), and 15 to 19 minutes (433 commuters, 19.2%).
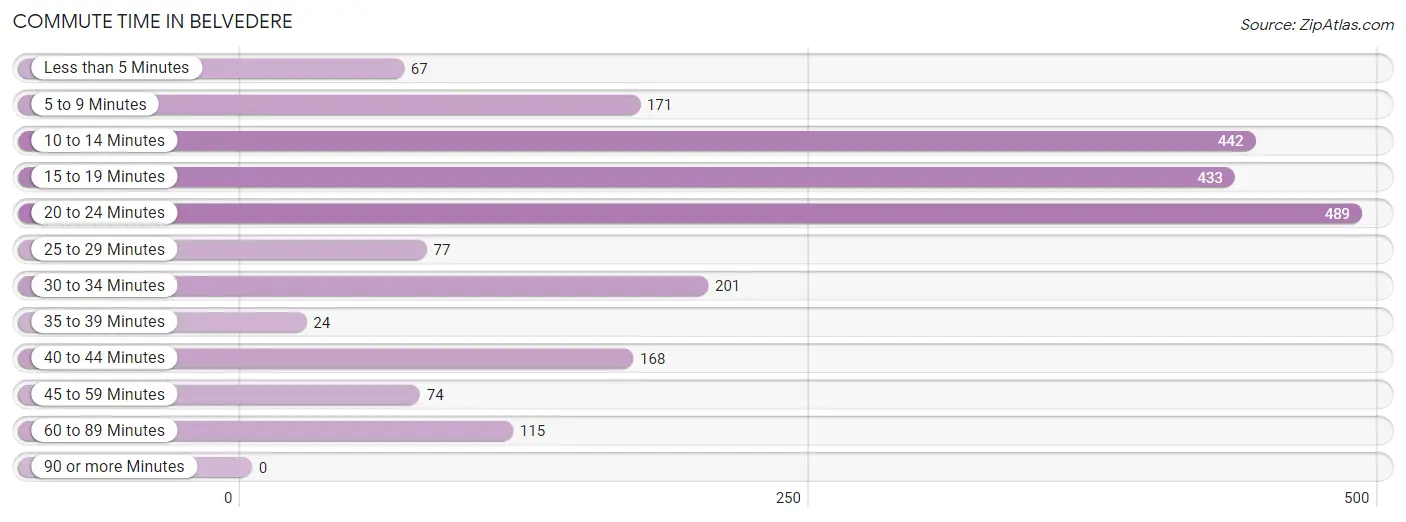
| Commute Time | # Commuters | % Commuters |
| Less than 5 Minutes | 67 | 3.0% |
| 5 to 9 Minutes | 171 | 7.6% |
| 10 to 14 Minutes | 442 | 19.6% |
| 15 to 19 Minutes | 433 | 19.2% |
| 20 to 24 Minutes | 489 | 21.6% |
| 25 to 29 Minutes | 77 | 3.4% |
| 30 to 34 Minutes | 201 | 8.9% |
| 35 to 39 Minutes | 24 | 1.1% |
| 40 to 44 Minutes | 168 | 7.4% |
| 45 to 59 Minutes | 74 | 3.3% |
| 60 to 89 Minutes | 115 | 5.1% |
| 90 or more Minutes | 0 | 0.0% |
Commute Time by Sex in Belvedere
The most common commute times in Belvedere are 10 to 14 minutes (296 commuters, 20.2%) for males and 20 to 24 minutes (228 commuters, 28.6%) for females.
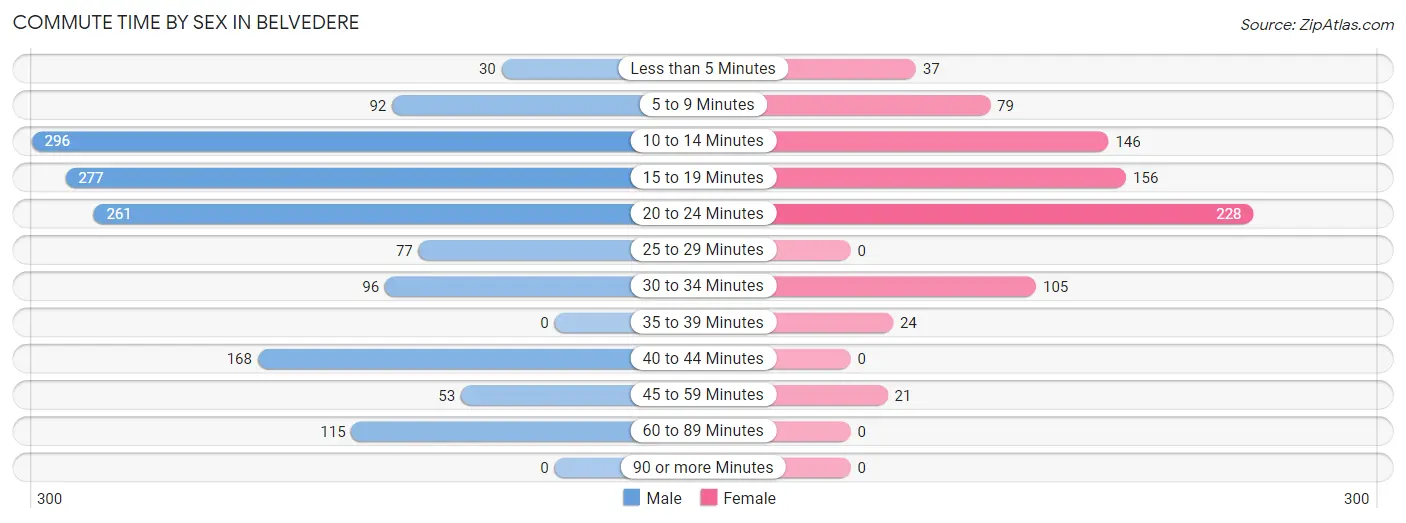
| Commute Time | Male | Female |
| Less than 5 Minutes | 30 (2.1%) | 37 (4.6%) |
| 5 to 9 Minutes | 92 (6.3%) | 79 (9.9%) |
| 10 to 14 Minutes | 296 (20.2%) | 146 (18.3%) |
| 15 to 19 Minutes | 277 (18.9%) | 156 (19.6%) |
| 20 to 24 Minutes | 261 (17.8%) | 228 (28.6%) |
| 25 to 29 Minutes | 77 (5.3%) | 0 (0.0%) |
| 30 to 34 Minutes | 96 (6.6%) | 105 (13.2%) |
| 35 to 39 Minutes | 0 (0.0%) | 24 (3.0%) |
| 40 to 44 Minutes | 168 (11.5%) | 0 (0.0%) |
| 45 to 59 Minutes | 53 (3.6%) | 21 (2.6%) |
| 60 to 89 Minutes | 115 (7.9%) | 0 (0.0%) |
| 90 or more Minutes | 0 (0.0%) | 0 (0.0%) |
Time of Departure to Work by Sex in Belvedere
The most frequent times of departure to work in Belvedere are 5:30 AM to 5:59 AM (239, 16.3%) for males and 6:30 AM to 6:59 AM (182, 22.9%) for females.
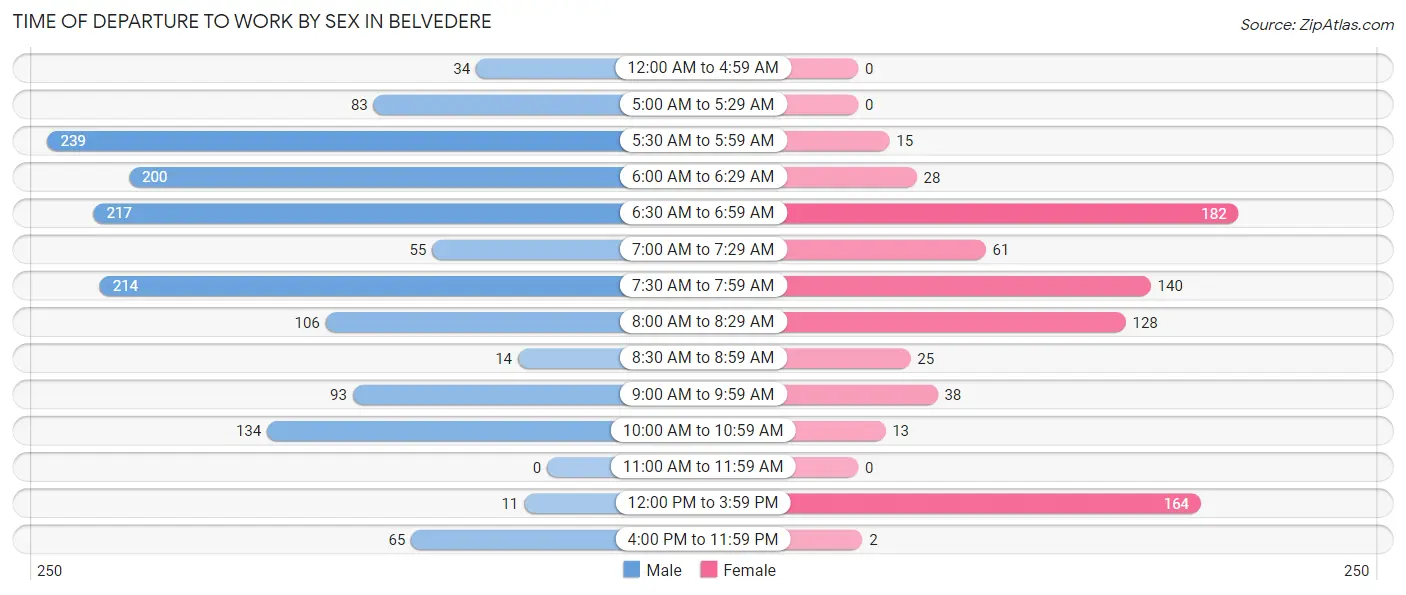
| Time of Departure | Male | Female |
| 12:00 AM to 4:59 AM | 34 (2.3%) | 0 (0.0%) |
| 5:00 AM to 5:29 AM | 83 (5.7%) | 0 (0.0%) |
| 5:30 AM to 5:59 AM | 239 (16.3%) | 15 (1.9%) |
| 6:00 AM to 6:29 AM | 200 (13.7%) | 28 (3.5%) |
| 6:30 AM to 6:59 AM | 217 (14.8%) | 182 (22.9%) |
| 7:00 AM to 7:29 AM | 55 (3.7%) | 61 (7.7%) |
| 7:30 AM to 7:59 AM | 214 (14.6%) | 140 (17.6%) |
| 8:00 AM to 8:29 AM | 106 (7.2%) | 128 (16.1%) |
| 8:30 AM to 8:59 AM | 14 (1.0%) | 25 (3.1%) |
| 9:00 AM to 9:59 AM | 93 (6.4%) | 38 (4.8%) |
| 10:00 AM to 10:59 AM | 134 (9.1%) | 13 (1.6%) |
| 11:00 AM to 11:59 AM | 0 (0.0%) | 0 (0.0%) |
| 12:00 PM to 3:59 PM | 11 (0.7%) | 164 (20.6%) |
| 4:00 PM to 11:59 PM | 65 (4.4%) | 2 (0.3%) |
| Total | 1,465 (100.0%) | 796 (100.0%) |
Housing Occupancy in Belvedere
Occupancy by Ownership in Belvedere
Of the total 2,439 dwellings in Belvedere, owner-occupied units account for 1,570 (64.4%), while renter-occupied units make up 869 (35.6%).
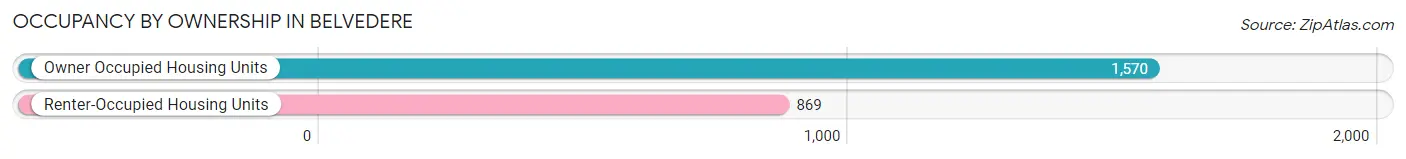
| Occupancy | # Housing Units | % Housing Units |
| Owner Occupied Housing Units | 1,570 | 64.4% |
| Renter-Occupied Housing Units | 869 | 35.6% |
| Total Occupied Housing Units | 2,439 | 100.0% |
Occupancy by Household Size in Belvedere
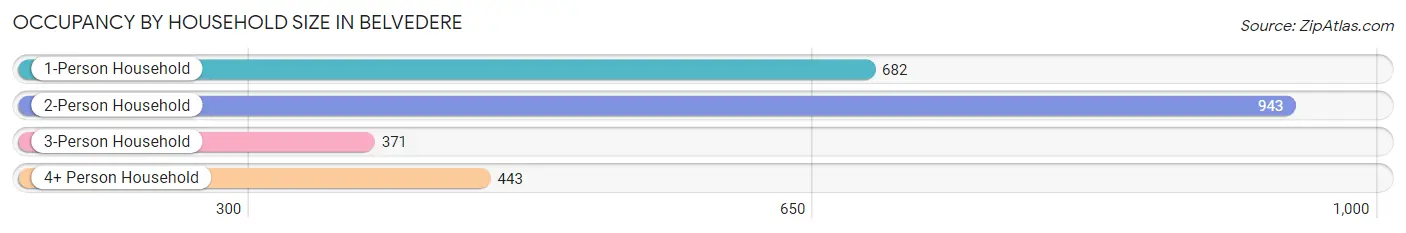
| Household Size | # Housing Units | % Housing Units |
| 1-Person Household | 682 | 28.0% |
| 2-Person Household | 943 | 38.7% |
| 3-Person Household | 371 | 15.2% |
| 4+ Person Household | 443 | 18.2% |
| Total Housing Units | 2,439 | 100.0% |
Occupancy by Ownership by Household Size in Belvedere
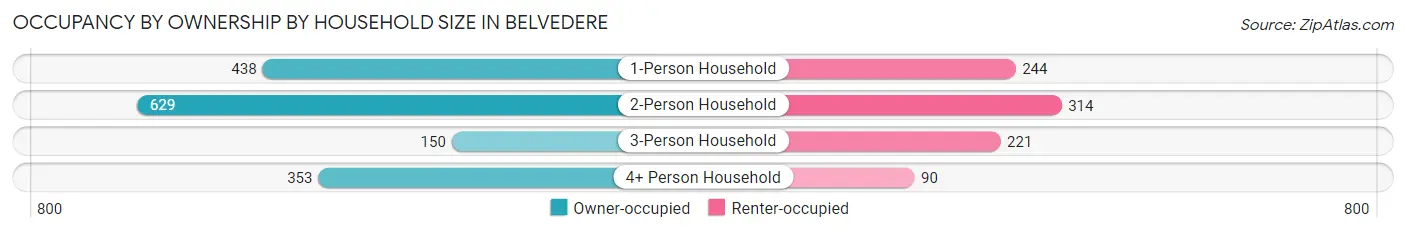
| Household Size | Owner-occupied | Renter-occupied |
| 1-Person Household | 438 (64.2%) | 244 (35.8%) |
| 2-Person Household | 629 (66.7%) | 314 (33.3%) |
| 3-Person Household | 150 (40.4%) | 221 (59.6%) |
| 4+ Person Household | 353 (79.7%) | 90 (20.3%) |
| Total Housing Units | 1,570 (64.4%) | 869 (35.6%) |
Occupancy by Educational Attainment in Belvedere
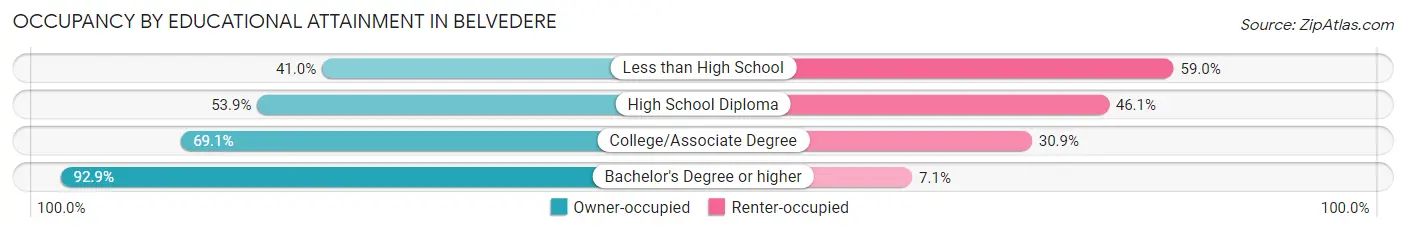
| Household Size | Owner-occupied | Renter-occupied |
| Less than High School | 142 (41.0%) | 204 (59.0%) |
| High School Diploma | 549 (53.9%) | 470 (46.1%) |
| College/Associate Degree | 345 (69.1%) | 154 (30.9%) |
| Bachelor's Degree or higher | 534 (92.9%) | 41 (7.1%) |
Occupancy by Age of Householder in Belvedere
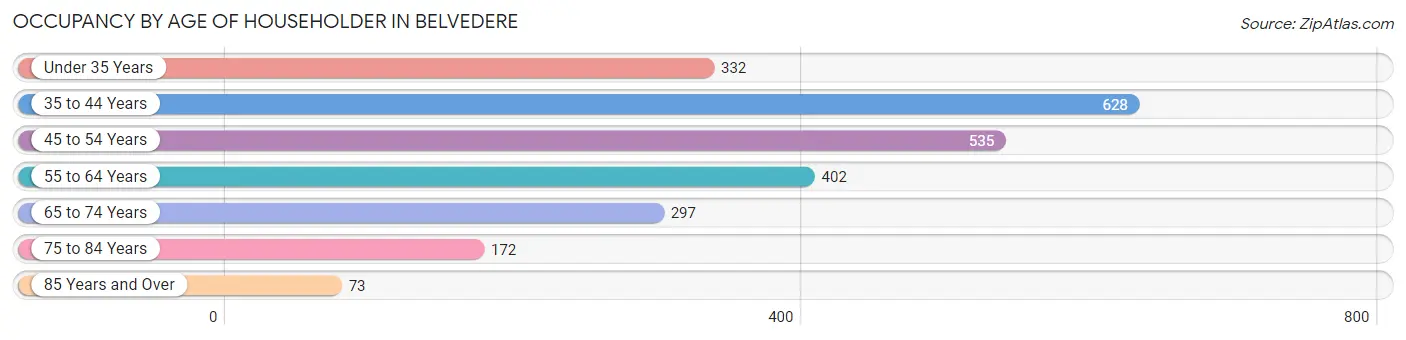
| Age Bracket | # Households | % Households |
| Under 35 Years | 332 | 13.6% |
| 35 to 44 Years | 628 | 25.8% |
| 45 to 54 Years | 535 | 21.9% |
| 55 to 64 Years | 402 | 16.5% |
| 65 to 74 Years | 297 | 12.2% |
| 75 to 84 Years | 172 | 7.0% |
| 85 Years and Over | 73 | 3.0% |
| Total | 2,439 | 100.0% |
Housing Finances in Belvedere
Median Income by Occupancy in Belvedere
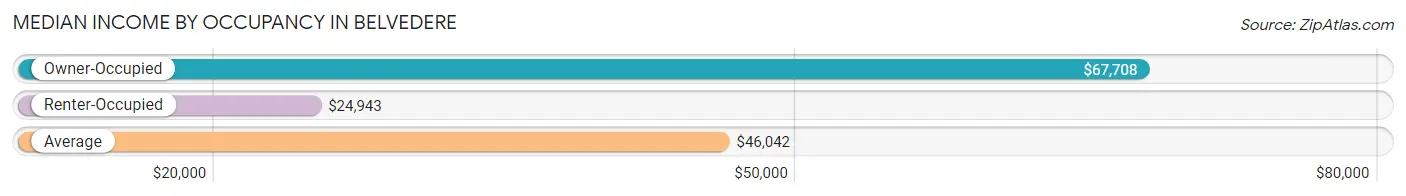
| Occupancy Type | # Households | Median Income |
| Owner-Occupied | 1,570 (64.4%) | $67,708 |
| Renter-Occupied | 869 (35.6%) | $24,943 |
| Average | 2,439 (100.0%) | $46,042 |
Occupancy by Householder Income Bracket in Belvedere
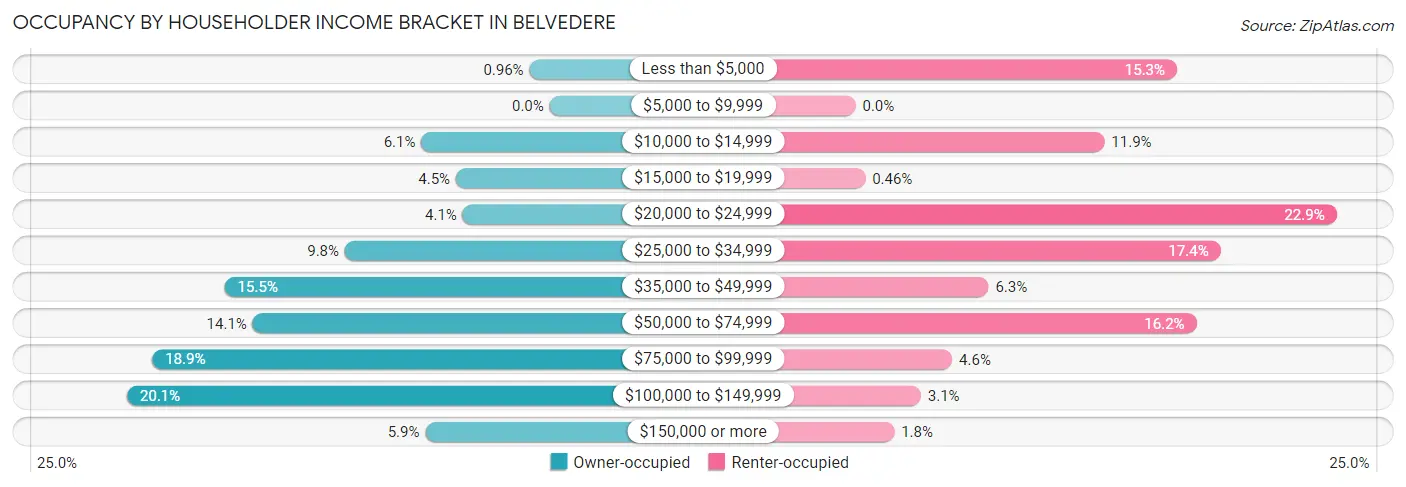
| Income Bracket | Owner-occupied | Renter-occupied |
| Less than $5,000 | 15 (1.0%) | 133 (15.3%) |
| $5,000 to $9,999 | 0 (0.0%) | 0 (0.0%) |
| $10,000 to $14,999 | 96 (6.1%) | 103 (11.8%) |
| $15,000 to $19,999 | 70 (4.5%) | 4 (0.5%) |
| $20,000 to $24,999 | 65 (4.1%) | 199 (22.9%) |
| $25,000 to $34,999 | 153 (9.8%) | 151 (17.4%) |
| $35,000 to $49,999 | 243 (15.5%) | 55 (6.3%) |
| $50,000 to $74,999 | 222 (14.1%) | 141 (16.2%) |
| $75,000 to $99,999 | 297 (18.9%) | 40 (4.6%) |
| $100,000 to $149,999 | 316 (20.1%) | 27 (3.1%) |
| $150,000 or more | 93 (5.9%) | 16 (1.8%) |
| Total | 1,570 (100.0%) | 869 (100.0%) |
Monthly Housing Cost Tiers in Belvedere
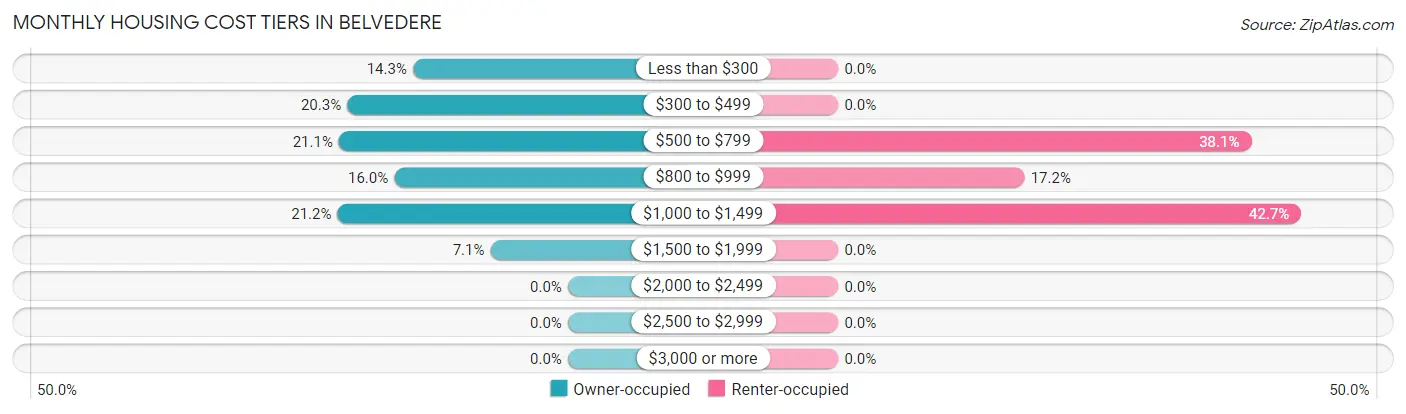
| Monthly Cost | Owner-occupied | Renter-occupied |
| Less than $300 | 224 (14.3%) | 0 (0.0%) |
| $300 to $499 | 319 (20.3%) | 0 (0.0%) |
| $500 to $799 | 331 (21.1%) | 331 (38.1%) |
| $800 to $999 | 251 (16.0%) | 149 (17.2%) |
| $1,000 to $1,499 | 333 (21.2%) | 371 (42.7%) |
| $1,500 to $1,999 | 112 (7.1%) | 0 (0.0%) |
| $2,000 to $2,499 | 0 (0.0%) | 0 (0.0%) |
| $2,500 to $2,999 | 0 (0.0%) | 0 (0.0%) |
| $3,000 or more | 0 (0.0%) | 0 (0.0%) |
| Total | 1,570 (100.0%) | 869 (100.0%) |
Physical Housing Characteristics in Belvedere
Housing Structures in Belvedere
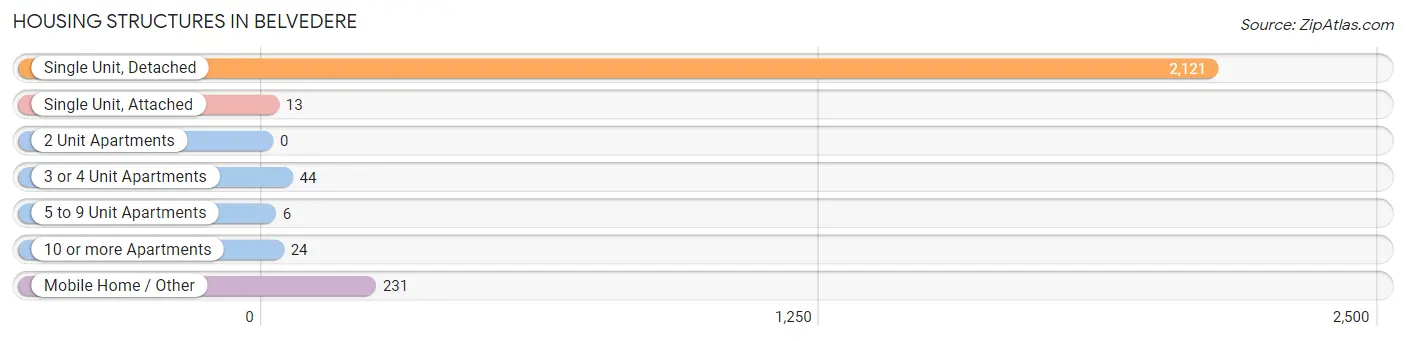
| Structure Type | # Housing Units | % Housing Units |
| Single Unit, Detached | 2,121 | 87.0% |
| Single Unit, Attached | 13 | 0.5% |
| 2 Unit Apartments | 0 | 0.0% |
| 3 or 4 Unit Apartments | 44 | 1.8% |
| 5 to 9 Unit Apartments | 6 | 0.3% |
| 10 or more Apartments | 24 | 1.0% |
| Mobile Home / Other | 231 | 9.5% |
| Total | 2,439 | 100.0% |
Housing Structures by Occupancy in Belvedere
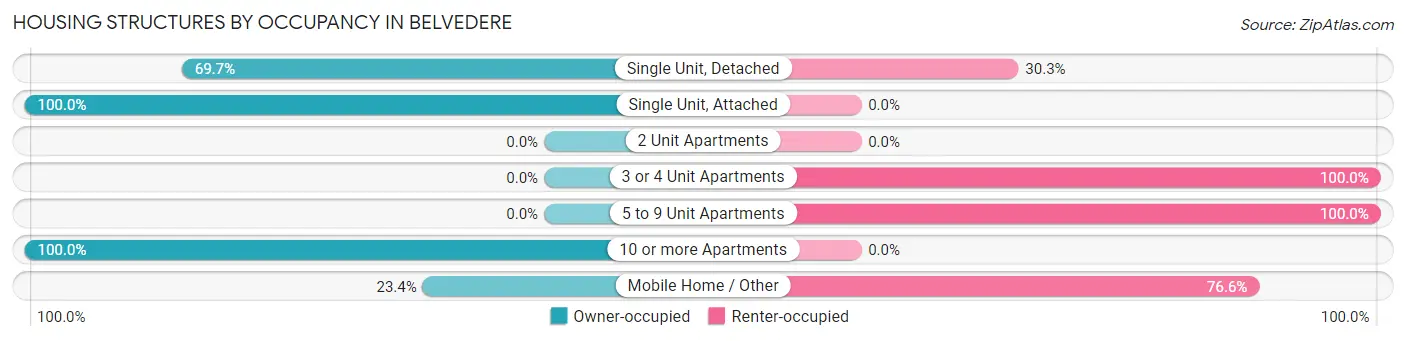
| Structure Type | Owner-occupied | Renter-occupied |
| Single Unit, Detached | 1,479 (69.7%) | 642 (30.3%) |
| Single Unit, Attached | 13 (100.0%) | 0 (0.0%) |
| 2 Unit Apartments | 0 (0.0%) | 0 (0.0%) |
| 3 or 4 Unit Apartments | 0 (0.0%) | 44 (100.0%) |
| 5 to 9 Unit Apartments | 0 (0.0%) | 6 (100.0%) |
| 10 or more Apartments | 24 (100.0%) | 0 (0.0%) |
| Mobile Home / Other | 54 (23.4%) | 177 (76.6%) |
| Total | 1,570 (64.4%) | 869 (35.6%) |
Housing Structures by Number of Rooms in Belvedere
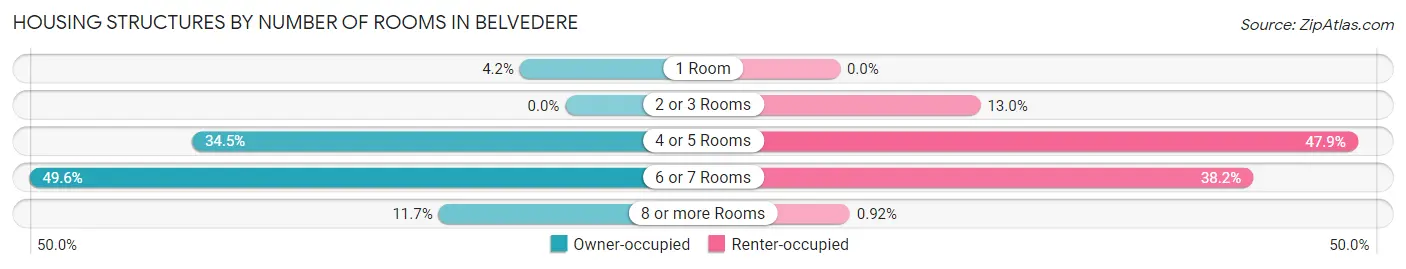
| Number of Rooms | Owner-occupied | Renter-occupied |
| 1 Room | 66 (4.2%) | 0 (0.0%) |
| 2 or 3 Rooms | 0 (0.0%) | 113 (13.0%) |
| 4 or 5 Rooms | 542 (34.5%) | 416 (47.9%) |
| 6 or 7 Rooms | 778 (49.5%) | 332 (38.2%) |
| 8 or more Rooms | 184 (11.7%) | 8 (0.9%) |
| Total | 1,570 (100.0%) | 869 (100.0%) |
Housing Structure by Heating Type in Belvedere
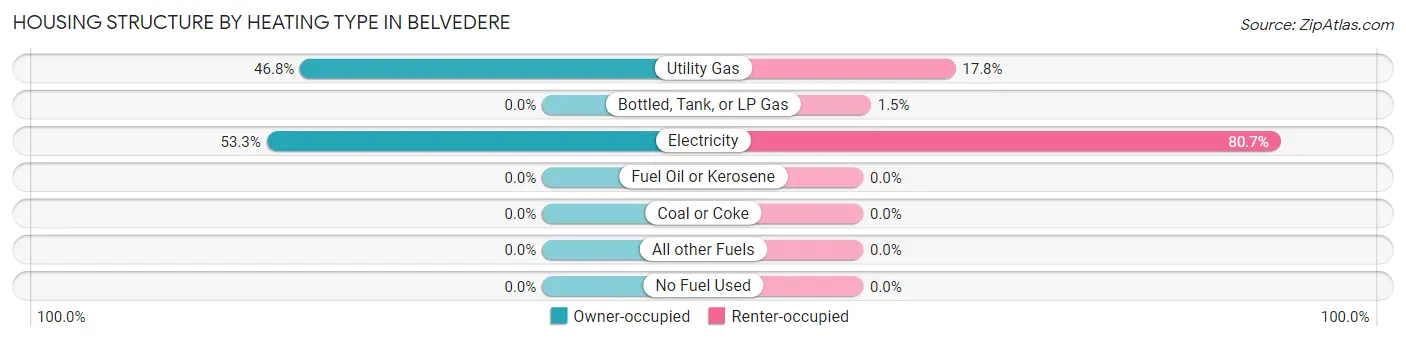
| Heating Type | Owner-occupied | Renter-occupied |
| Utility Gas | 734 (46.8%) | 155 (17.8%) |
| Bottled, Tank, or LP Gas | 0 (0.0%) | 13 (1.5%) |
| Electricity | 836 (53.2%) | 701 (80.7%) |
| Fuel Oil or Kerosene | 0 (0.0%) | 0 (0.0%) |
| Coal or Coke | 0 (0.0%) | 0 (0.0%) |
| All other Fuels | 0 (0.0%) | 0 (0.0%) |
| No Fuel Used | 0 (0.0%) | 0 (0.0%) |
| Total | 1,570 (100.0%) | 869 (100.0%) |
Household Vehicle Usage in Belvedere
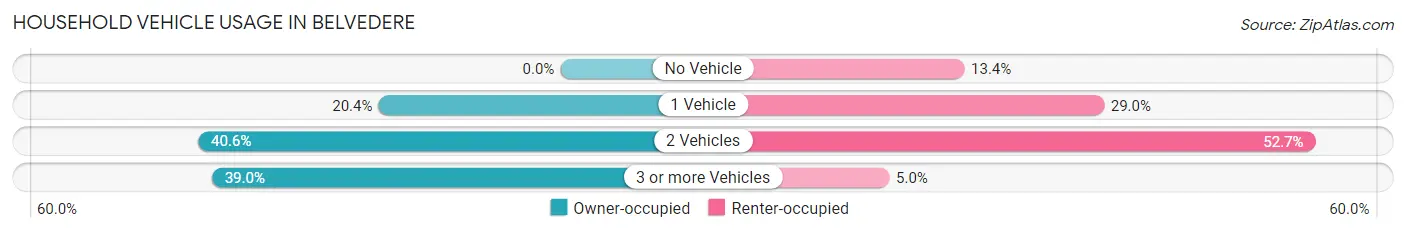
| Vehicles per Household | Owner-occupied | Renter-occupied |
| No Vehicle | 0 (0.0%) | 116 (13.4%) |
| 1 Vehicle | 320 (20.4%) | 252 (29.0%) |
| 2 Vehicles | 637 (40.6%) | 458 (52.7%) |
| 3 or more Vehicles | 613 (39.0%) | 43 (5.0%) |
| Total | 1,570 (100.0%) | 869 (100.0%) |
Real Estate & Mortgages in Belvedere
Real Estate and Mortgage Overview in Belvedere
| Characteristic | Without Mortgage | With Mortgage |
| Housing Units | 634 | 936 |
| Median Property Value | $132,900 | $115,900 |
| Median Household Income | $42,333 | $67 |
| Monthly Housing Costs | $356 | $0 |
| Real Estate Taxes | $623 | $2 |
Property Value by Mortgage Status in Belvedere
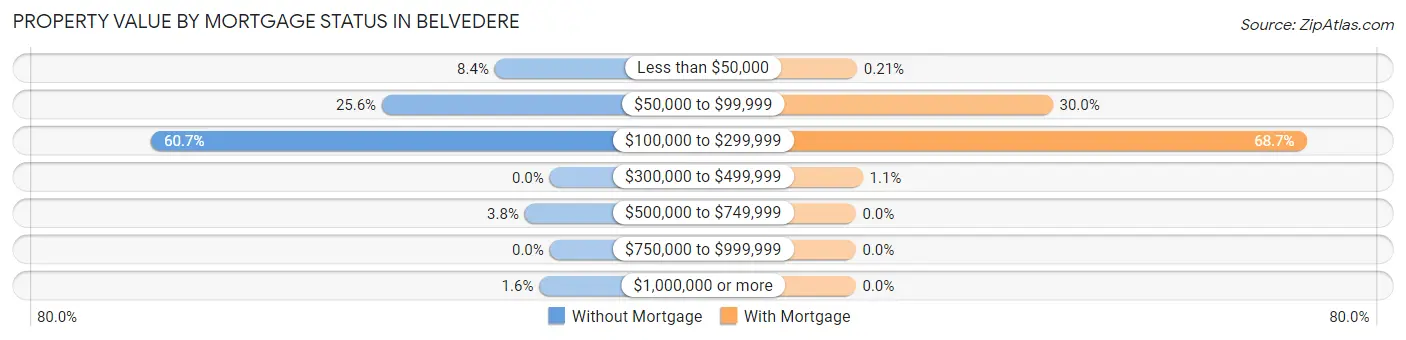
| Property Value | Without Mortgage | With Mortgage |
| Less than $50,000 | 53 (8.4%) | 2 (0.2%) |
| $50,000 to $99,999 | 162 (25.6%) | 281 (30.0%) |
| $100,000 to $299,999 | 385 (60.7%) | 643 (68.7%) |
| $300,000 to $499,999 | 0 (0.0%) | 10 (1.1%) |
| $500,000 to $749,999 | 24 (3.8%) | 0 (0.0%) |
| $750,000 to $999,999 | 0 (0.0%) | 0 (0.0%) |
| $1,000,000 or more | 10 (1.6%) | 0 (0.0%) |
| Total | 634 (100.0%) | 936 (100.0%) |
Household Income by Mortgage Status in Belvedere
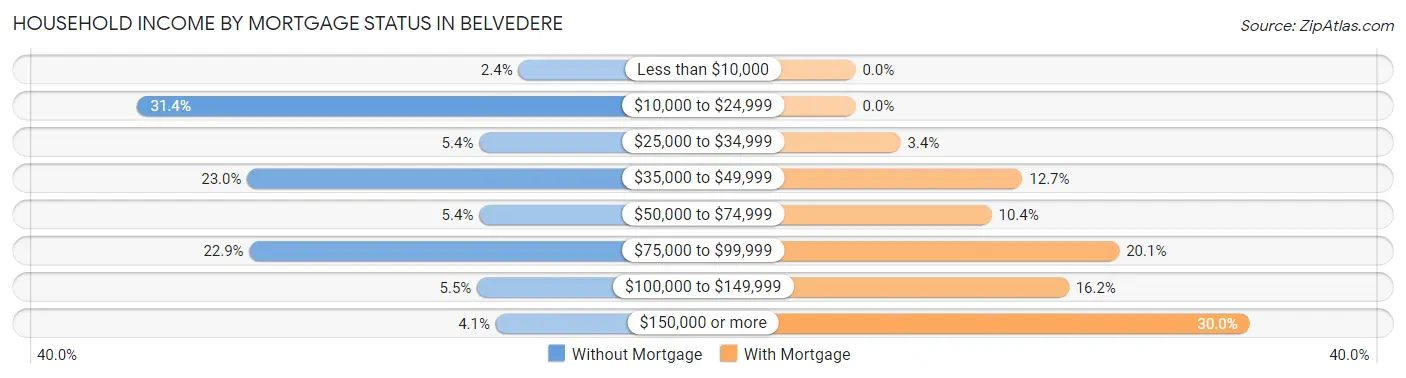
| Household Income | Without Mortgage | With Mortgage |
| Less than $10,000 | 15 (2.4%) | 0 (0.0%) |
| $10,000 to $24,999 | 199 (31.4%) | 0 (0.0%) |
| $25,000 to $34,999 | 34 (5.4%) | 32 (3.4%) |
| $35,000 to $49,999 | 146 (23.0%) | 119 (12.7%) |
| $50,000 to $74,999 | 34 (5.4%) | 97 (10.4%) |
| $75,000 to $99,999 | 145 (22.9%) | 188 (20.1%) |
| $100,000 to $149,999 | 35 (5.5%) | 152 (16.2%) |
| $150,000 or more | 26 (4.1%) | 281 (30.0%) |
| Total | 634 (100.0%) | 936 (100.0%) |
Property Value to Household Income Ratio in Belvedere
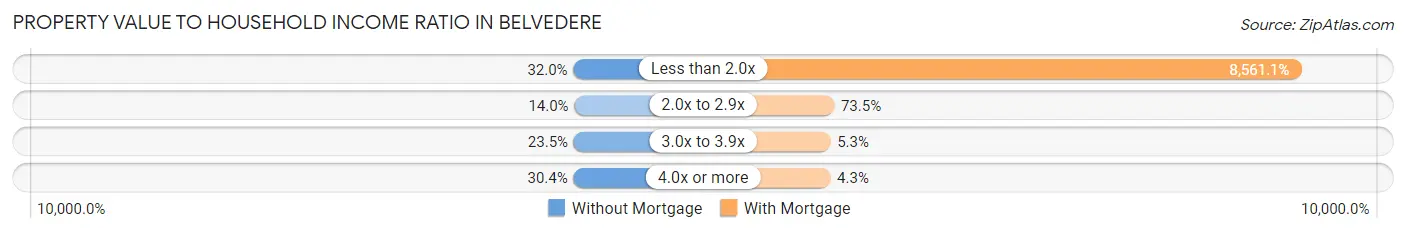
| Value-to-Income Ratio | Without Mortgage | With Mortgage |
| Less than 2.0x | 203 (32.0%) | 80,132 (8,561.1%) |
| 2.0x to 2.9x | 89 (14.0%) | 688 (73.5%) |
| 3.0x to 3.9x | 149 (23.5%) | 50 (5.3%) |
| 4.0x or more | 193 (30.4%) | 40 (4.3%) |
| Total | 634 (100.0%) | 936 (100.0%) |
Real Estate Taxes by Mortgage Status in Belvedere
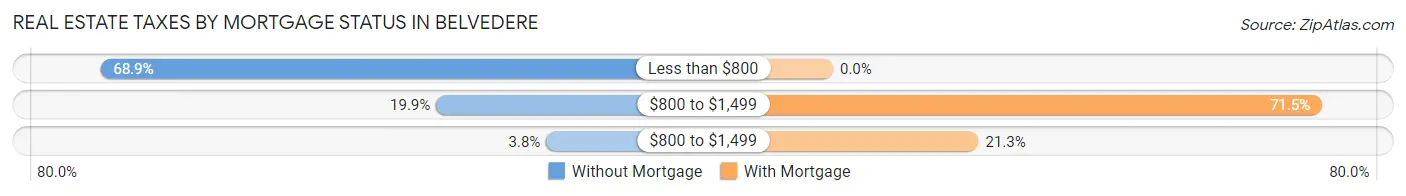
| Property Taxes | Without Mortgage | With Mortgage |
| Less than $800 | 437 (68.9%) | 0 (0.0%) |
| $800 to $1,499 | 126 (19.9%) | 669 (71.5%) |
| $800 to $1,499 | 24 (3.8%) | 199 (21.3%) |
| Total | 634 (100.0%) | 936 (100.0%) |
Health & Disability in Belvedere
Health Insurance Coverage by Age in Belvedere
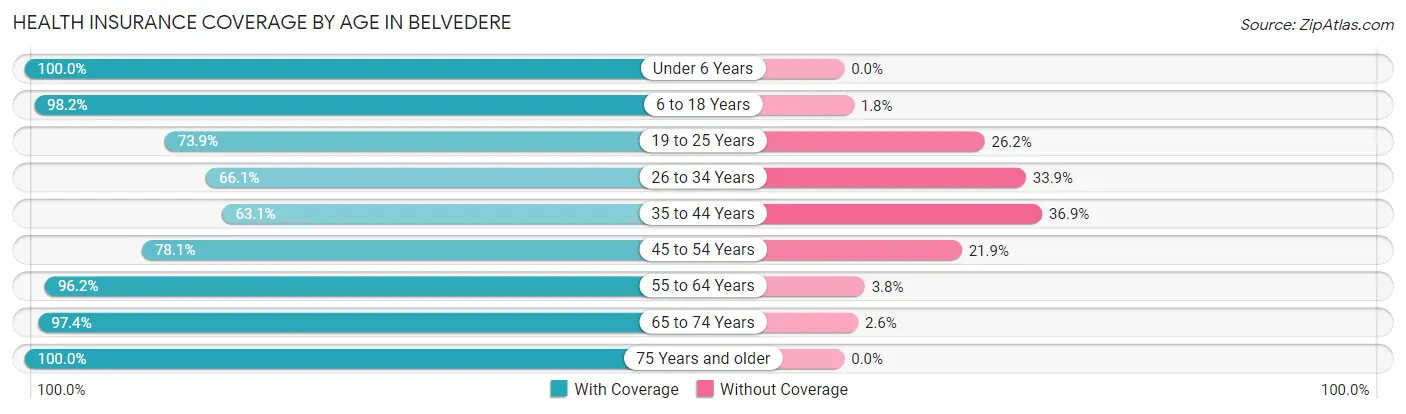
| Age Bracket | With Coverage | Without Coverage |
| Under 6 Years | 334 (100.0%) | 0 (0.0%) |
| 6 to 18 Years | 1,329 (98.2%) | 24 (1.8%) |
| 19 to 25 Years | 384 (73.9%) | 136 (26.2%) |
| 26 to 34 Years | 293 (66.1%) | 150 (33.9%) |
| 35 to 44 Years | 561 (63.1%) | 328 (36.9%) |
| 45 to 54 Years | 542 (78.1%) | 152 (21.9%) |
| 55 to 64 Years | 732 (96.2%) | 29 (3.8%) |
| 65 to 74 Years | 380 (97.4%) | 10 (2.6%) |
| 75 Years and older | 402 (100.0%) | 0 (0.0%) |
| Total | 4,957 (85.7%) | 829 (14.3%) |
Health Insurance Coverage by Citizenship Status in Belvedere
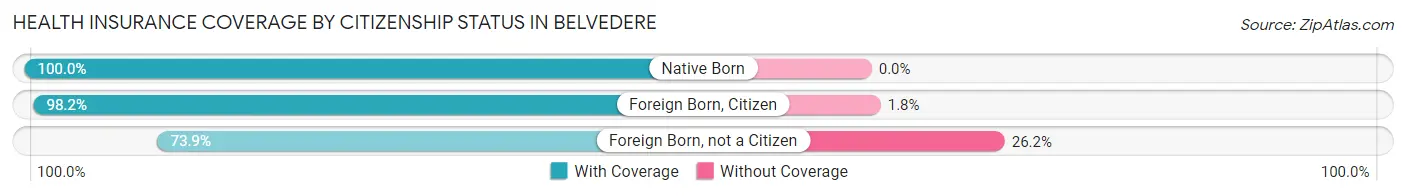
| Citizenship Status | With Coverage | Without Coverage |
| Native Born | 334 (100.0%) | 0 (0.0%) |
| Foreign Born, Citizen | 1,329 (98.2%) | 24 (1.8%) |
| Foreign Born, not a Citizen | 384 (73.9%) | 136 (26.2%) |
Health Insurance Coverage by Household Income in Belvedere
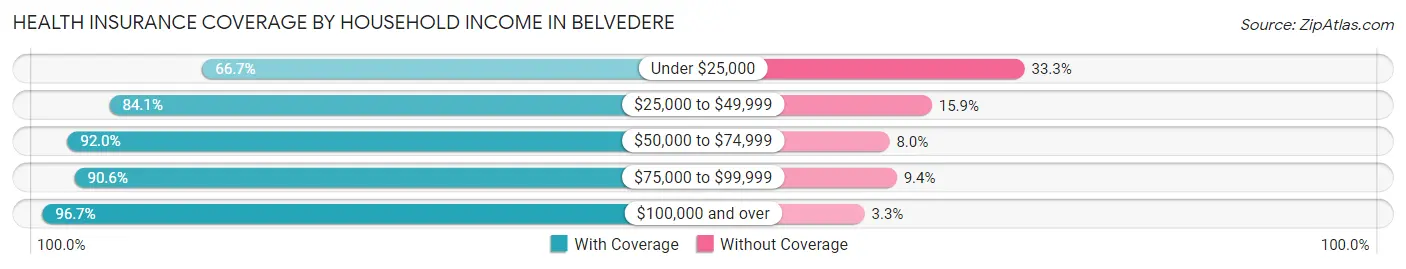
| Household Income | With Coverage | Without Coverage |
| Under $25,000 | 857 (66.7%) | 428 (33.3%) |
| $25,000 to $49,999 | 924 (84.1%) | 175 (15.9%) |
| $50,000 to $74,999 | 817 (92.0%) | 71 (8.0%) |
| $75,000 to $99,999 | 978 (90.6%) | 101 (9.4%) |
| $100,000 and over | 1,365 (96.7%) | 47 (3.3%) |
Public vs Private Health Insurance Coverage by Age in Belvedere
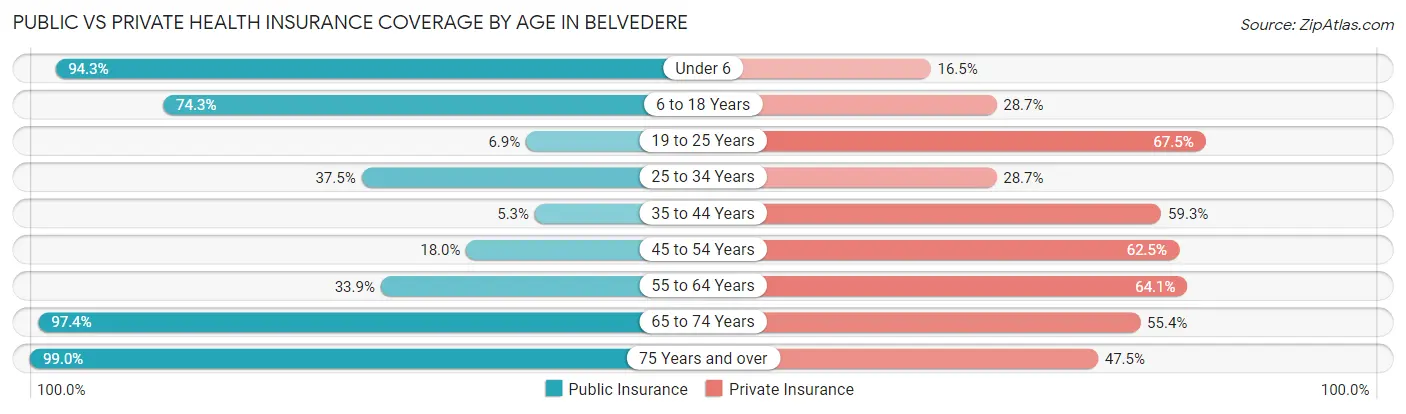
| Age Bracket | Public Insurance | Private Insurance |
| Under 6 | 315 (94.3%) | 55 (16.5%) |
| 6 to 18 Years | 1,005 (74.3%) | 388 (28.7%) |
| 19 to 25 Years | 36 (6.9%) | 351 (67.5%) |
| 25 to 34 Years | 166 (37.5%) | 127 (28.7%) |
| 35 to 44 Years | 47 (5.3%) | 527 (59.3%) |
| 45 to 54 Years | 125 (18.0%) | 434 (62.5%) |
| 55 to 64 Years | 258 (33.9%) | 488 (64.1%) |
| 65 to 74 Years | 380 (97.4%) | 216 (55.4%) |
| 75 Years and over | 398 (99.0%) | 191 (47.5%) |
| Total | 2,730 (47.2%) | 2,777 (48.0%) |
Disability Status by Sex by Age in Belvedere

| Age Bracket | Male | Female |
| Under 5 Years | 0 (0.0%) | 0 (0.0%) |
| 5 to 17 Years | 67 (8.6%) | 99 (19.9%) |
| 18 to 34 Years | 47 (9.1%) | 156 (29.0%) |
| 35 to 64 Years | 158 (12.0%) | 107 (10.4%) |
| 65 to 74 Years | 41 (33.3%) | 43 (16.1%) |
| 75 Years and over | 55 (51.9%) | 98 (33.1%) |
Disability Class by Sex by Age in Belvedere
Disability Class: Hearing Difficulty
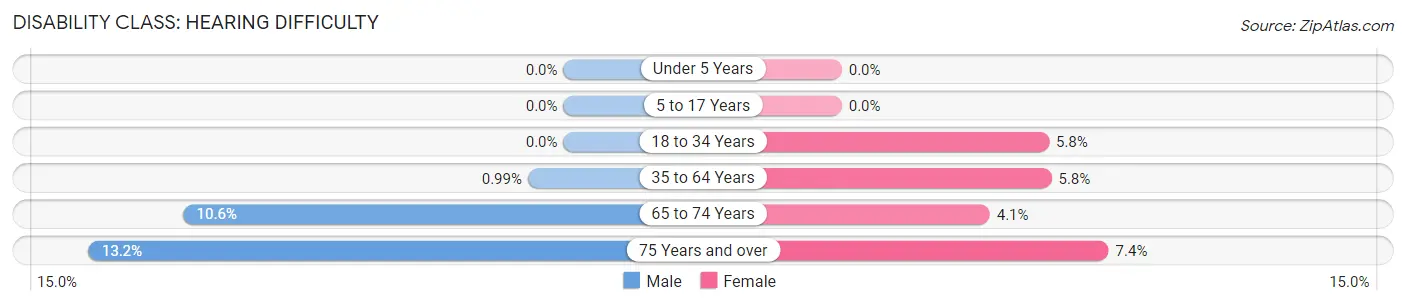
| Age Bracket | Male | Female |
| Under 5 Years | 0 (0.0%) | 0 (0.0%) |
| 5 to 17 Years | 0 (0.0%) | 0 (0.0%) |
| 18 to 34 Years | 0 (0.0%) | 31 (5.8%) |
| 35 to 64 Years | 13 (1.0%) | 60 (5.8%) |
| 65 to 74 Years | 13 (10.6%) | 11 (4.1%) |
| 75 Years and over | 14 (13.2%) | 22 (7.4%) |
Disability Class: Vision Difficulty
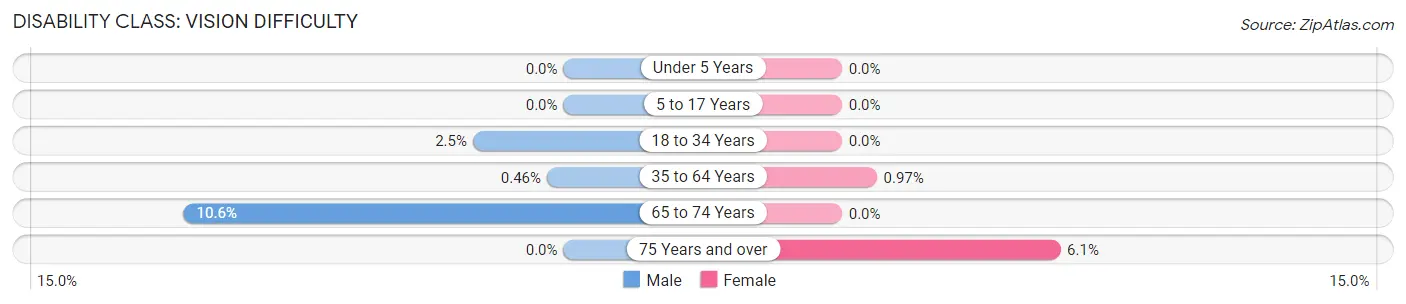
| Age Bracket | Male | Female |
| Under 5 Years | 0 (0.0%) | 0 (0.0%) |
| 5 to 17 Years | 0 (0.0%) | 0 (0.0%) |
| 18 to 34 Years | 13 (2.5%) | 0 (0.0%) |
| 35 to 64 Years | 6 (0.5%) | 10 (1.0%) |
| 65 to 74 Years | 13 (10.6%) | 0 (0.0%) |
| 75 Years and over | 0 (0.0%) | 18 (6.1%) |
Disability Class: Cognitive Difficulty
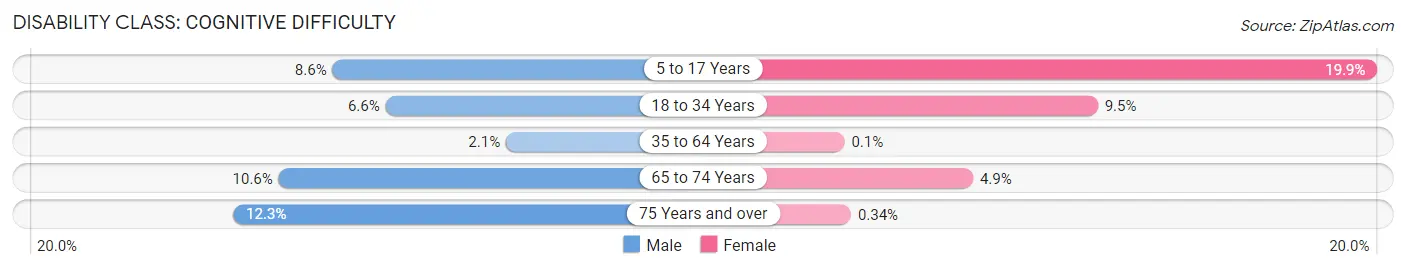
| Age Bracket | Male | Female |
| 5 to 17 Years | 67 (8.6%) | 99 (19.9%) |
| 18 to 34 Years | 34 (6.6%) | 51 (9.5%) |
| 35 to 64 Years | 28 (2.1%) | 1 (0.1%) |
| 65 to 74 Years | 13 (10.6%) | 13 (4.9%) |
| 75 Years and over | 13 (12.3%) | 1 (0.3%) |
Disability Class: Ambulatory Difficulty
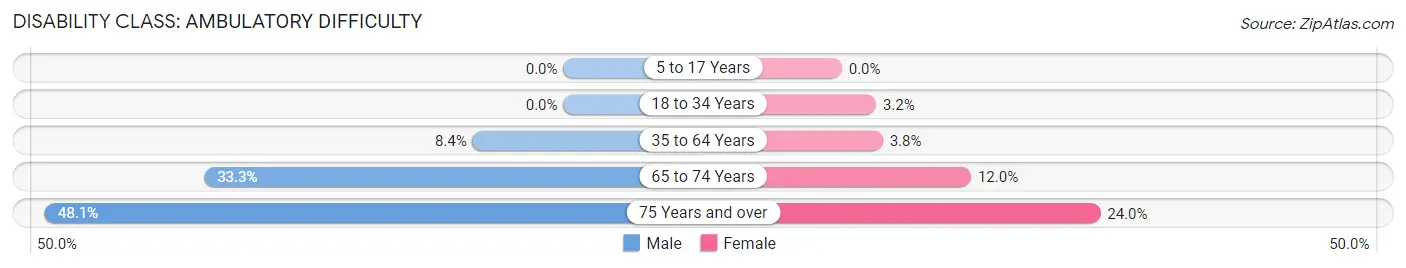
| Age Bracket | Male | Female |
| 5 to 17 Years | 0 (0.0%) | 0 (0.0%) |
| 18 to 34 Years | 0 (0.0%) | 17 (3.2%) |
| 35 to 64 Years | 111 (8.4%) | 39 (3.8%) |
| 65 to 74 Years | 41 (33.3%) | 32 (12.0%) |
| 75 Years and over | 51 (48.1%) | 71 (24.0%) |
Disability Class: Self-Care Difficulty
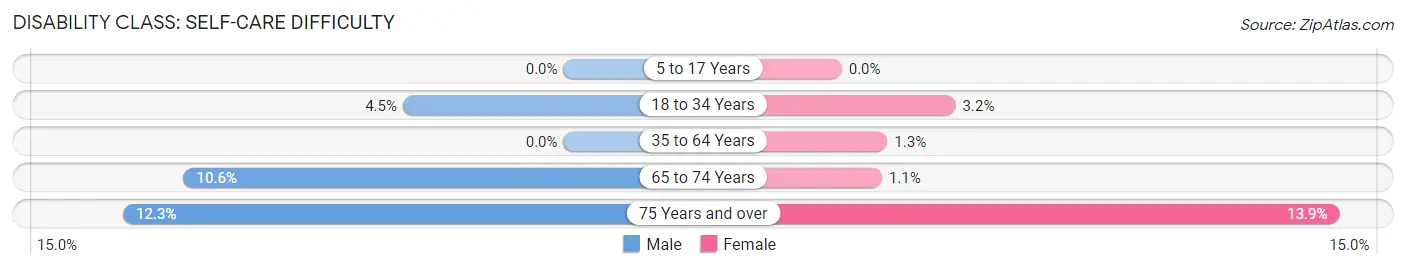
| Age Bracket | Male | Female |
| 5 to 17 Years | 0 (0.0%) | 0 (0.0%) |
| 18 to 34 Years | 23 (4.5%) | 17 (3.2%) |
| 35 to 64 Years | 0 (0.0%) | 13 (1.3%) |
| 65 to 74 Years | 13 (10.6%) | 3 (1.1%) |
| 75 Years and over | 13 (12.3%) | 41 (13.9%) |
Technology Access in Belvedere
Computing Device Access in Belvedere
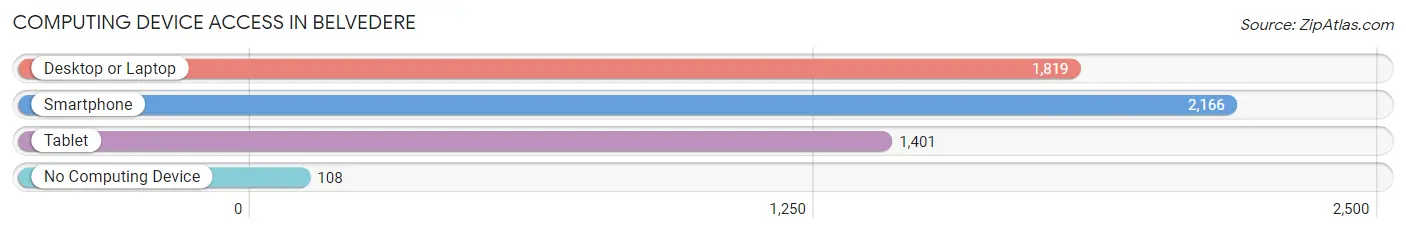
| Device Type | # Households | % Households |
| Desktop or Laptop | 1,819 | 74.6% |
| Smartphone | 2,166 | 88.8% |
| Tablet | 1,401 | 57.4% |
| No Computing Device | 108 | 4.4% |
| Total | 2,439 | 100.0% |
Internet Access in Belvedere
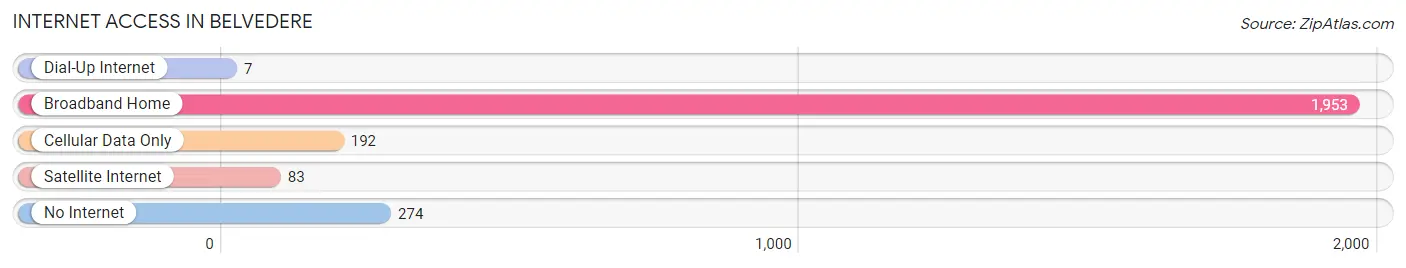
| Internet Type | # Households | % Households |
| Dial-Up Internet | 7 | 0.3% |
| Broadband Home | 1,953 | 80.1% |
| Cellular Data Only | 192 | 7.9% |
| Satellite Internet | 83 | 3.4% |
| No Internet | 274 | 11.2% |
| Total | 2,439 | 100.0% |
Belvedere Summary
Belvedere, South Carolina is a small town located in Aiken County, South Carolina. It is situated on the Savannah River, just south of Augusta, Georgia. The town was founded in 1820 and is named after the Italian word for “beautiful view”. Belvedere is a small, rural community with a population of just over 1,000 people.
Geography
Belvedere is located in the Piedmont region of South Carolina, which is characterized by rolling hills and flat plains. The town is situated on the Savannah River, which forms the border between South Carolina and Georgia. The town is located in the heart of the Aiken County, which is known for its horse farms and equestrian activities. The town is also located near the Savannah River Site, a nuclear power plant.
The climate in Belvedere is mild and humid, with hot summers and mild winters. The average temperature in the summer is around 80 degrees Fahrenheit, and the average temperature in the winter is around 50 degrees Fahrenheit. The town receives an average of 48 inches of rain per year.
Economy
The economy of Belvedere is largely based on agriculture and tourism. The town is home to several horse farms, which attract visitors from all over the world. The town also has a number of small businesses, including restaurants, shops, and other services.
The town is also home to the Savannah River Site, a nuclear power plant. The plant provides jobs for many of the town’s residents.
Demographics
As of the 2010 census, the population of Belvedere was 1,072. The racial makeup of the town was 79.3% White, 16.2% African American, 0.3% Native American, 0.7% Asian, 0.1% Pacific Islander, and 3.4% from other races. The median household income was $37,917, and the median family income was $45,625.
Belvedere is a small, rural town with a close-knit community. The town is known for its friendly atmosphere and its commitment to preserving its history and culture. The town is also home to a number of festivals and events throughout the year, including the Belvedere Festival of Lights and the Belvedere Fall Festival.
Belvedere is a small town with a big heart. It is a place where people come together to celebrate their heritage and enjoy the beauty of the area. Belvedere is a great place to live, work, and play.
Common Questions
What is Per Capita Income in Belvedere?
Per Capita income in Belvedere is $25,247.
What is the Median Family Income in Belvedere?
Median Family Income in Belvedere is $63,838.
What is the Median Household income in Belvedere?
Median Household Income in Belvedere is $46,042.
What is Income or Wage Gap in Belvedere?
Income or Wage Gap in Belvedere is 24.2%.
Women in Belvedere earn 75.8 cents for every dollar earned by a man.
What is Inequality or Gini Index in Belvedere?
Inequality or Gini Index in Belvedere is 0.41.
What is the Total Population of Belvedere?
Total Population of Belvedere is 5,786.
What is the Total Male Population of Belvedere?
Total Male Population of Belvedere is 2,996.
What is the Total Female Population of Belvedere?
Total Female Population of Belvedere is 2,790.
What is the Ratio of Males per 100 Females in Belvedere?
There are 107.38 Males per 100 Females in Belvedere.
What is the Ratio of Females per 100 Males in Belvedere?
There are 93.12 Females per 100 Males in Belvedere.
What is the Median Population Age in Belvedere?
Median Population Age in Belvedere is 38.2 Years.
What is the Average Family Size in Belvedere
Average Family Size in Belvedere is 2.8 People.
What is the Average Household Size in Belvedere
Average Household Size in Belvedere is 2.4 People.
How Large is the Labor Force in Belvedere?
There are 2,827 People in the Labor Forcein in Belvedere.
What is the Percentage of People in the Labor Force in Belvedere?
66.0% of People are in the Labor Force in Belvedere.
What is the Unemployment Rate in Belvedere?
Unemployment Rate in Belvedere is 6.4%.