Yup'ik vs Colville Married-Couple Family Poverty
COMPARE
Yup'ik
Colville
Married-Couple Family Poverty
Married-Couple Family Poverty Comparison
Yup'ik
Colville
13.4%
MARRIED-COUPLE FAMILY POVERTY
0.0/ 100
METRIC RATING
347th/ 347
METRIC RANK
6.3%
MARRIED-COUPLE FAMILY POVERTY
0.1/ 100
METRIC RATING
273rd/ 347
METRIC RANK
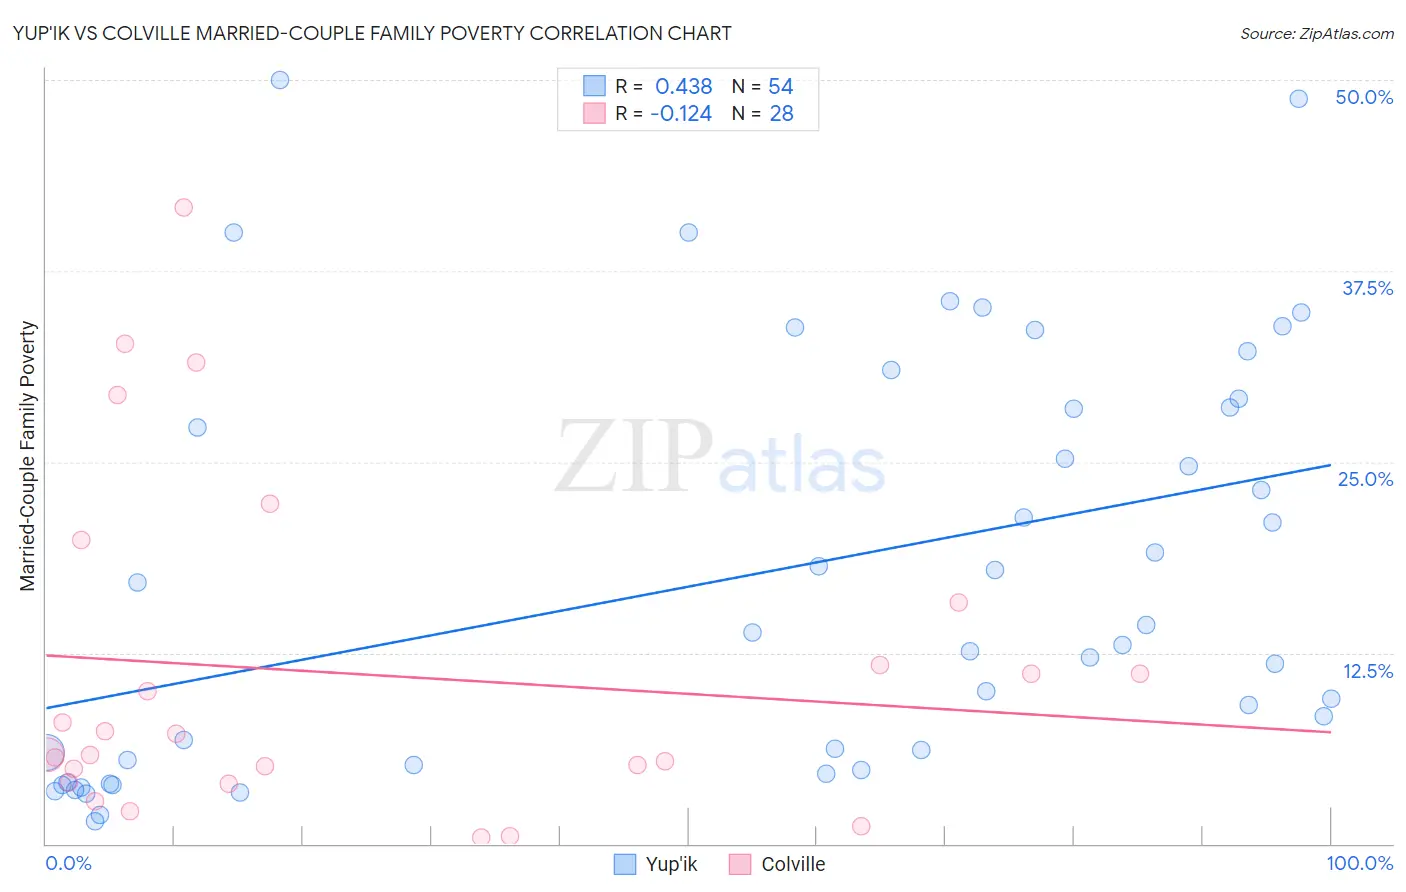
Yup'ik vs Colville Married-Couple Family Poverty Correlation Chart
The statistical analysis conducted on geographies consisting of 39,863,865 people shows a moderate positive correlation between the proportion of Yup'ik and poverty level among married-couple families in the United States with a correlation coefficient (R) of 0.438 and weighted average of 13.4%. Similarly, the statistical analysis conducted on geographies consisting of 34,633,773 people shows a poor negative correlation between the proportion of Colville and poverty level among married-couple families in the United States with a correlation coefficient (R) of -0.124 and weighted average of 6.3%, a difference of 113.2%.
Married-Couple Family Poverty Correlation Summary
| Measurement | Yup'ik | Colville |
| Minimum | 1.5% | 0.42% |
| Maximum | 50.0% | 41.7% |
| Range | 48.5% | 41.2% |
| Mean | 17.5% | 11.2% |
| Median | 13.4% | 6.5% |
| Interquartile 25% (IQ1) | 5.1% | 4.4% |
| Interquartile 75% (IQ3) | 28.6% | 13.7% |
| Interquartile Range (IQR) | 23.4% | 9.3% |
| Standard Deviation (Sample) | 13.4% | 10.9% |
| Standard Deviation (Population) | 13.3% | 10.7% |
Similar Demographics by Married-Couple Family Poverty
Demographics Similar to Yup'ik by Married-Couple Family Poverty
In terms of married-couple family poverty, the demographic groups most similar to Yup'ik are Immigrants from Yemen (12.8%, a difference of 4.6%), Puerto Rican (12.6%, a difference of 6.0%), Navajo (11.9%, a difference of 13.0%), Pima (11.4%, a difference of 17.4%), and Tohono O'odham (11.2%, a difference of 19.3%).
| Demographics | Rating | Rank | Married-Couple Family Poverty |
| Lumbee | 0.0 /100 | #333 | Tragic 8.3% |
| Immigrants | Dominican Republic | 0.0 /100 | #334 | Tragic 8.4% |
| Sioux | 0.0 /100 | #335 | Tragic 8.7% |
| Apache | 0.0 /100 | #336 | Tragic 9.0% |
| Yakama | 0.0 /100 | #337 | Tragic 9.0% |
| Cheyenne | 0.0 /100 | #338 | Tragic 9.4% |
| Crow | 0.0 /100 | #339 | Tragic 9.6% |
| Yuman | 0.0 /100 | #340 | Tragic 9.7% |
| Pueblo | 0.0 /100 | #341 | Tragic 11.1% |
| Tohono O'odham | 0.0 /100 | #342 | Tragic 11.2% |
| Pima | 0.0 /100 | #343 | Tragic 11.4% |
| Navajo | 0.0 /100 | #344 | Tragic 11.9% |
| Puerto Ricans | 0.0 /100 | #345 | Tragic 12.6% |
| Immigrants | Yemen | 0.0 /100 | #346 | Tragic 12.8% |
| Yup'ik | 0.0 /100 | #347 | Tragic 13.4% |
Demographics Similar to Colville by Married-Couple Family Poverty
In terms of married-couple family poverty, the demographic groups most similar to Colville are Barbadian (6.3%, a difference of 0.050%), Choctaw (6.3%, a difference of 0.21%), Yaqui (6.3%, a difference of 0.66%), Trinidadian and Tobagonian (6.2%, a difference of 0.78%), and Indonesian (6.3%, a difference of 0.80%).
| Demographics | Rating | Rank | Married-Couple Family Poverty |
| Creek | 0.2 /100 | #266 | Tragic 6.2% |
| Spanish Americans | 0.2 /100 | #267 | Tragic 6.2% |
| Alaska Natives | 0.2 /100 | #268 | Tragic 6.2% |
| Immigrants | West Indies | 0.1 /100 | #269 | Tragic 6.2% |
| Immigrants | Jamaica | 0.1 /100 | #270 | Tragic 6.2% |
| Immigrants | Bahamas | 0.1 /100 | #271 | Tragic 6.2% |
| Trinidadians and Tobagonians | 0.1 /100 | #272 | Tragic 6.2% |
| Colville | 0.1 /100 | #273 | Tragic 6.3% |
| Barbadians | 0.1 /100 | #274 | Tragic 6.3% |
| Choctaw | 0.1 /100 | #275 | Tragic 6.3% |
| Yaqui | 0.1 /100 | #276 | Tragic 6.3% |
| Indonesians | 0.1 /100 | #277 | Tragic 6.3% |
| Immigrants | Trinidad and Tobago | 0.1 /100 | #278 | Tragic 6.4% |
| Houma | 0.0 /100 | #279 | Tragic 6.4% |
| West Indians | 0.0 /100 | #280 | Tragic 6.4% |