Yup'ik 3 or more Vehicles in Household
COMPARE
Yup'ik
Select to Compare
3 or more Vehicles in Household
Yup'ik 3 or more Vehicles in Household
14.8%
3+ VEHICLES AVAILABLE
0.0/ 100
METRIC RATING
320th/ 347
METRIC RANK
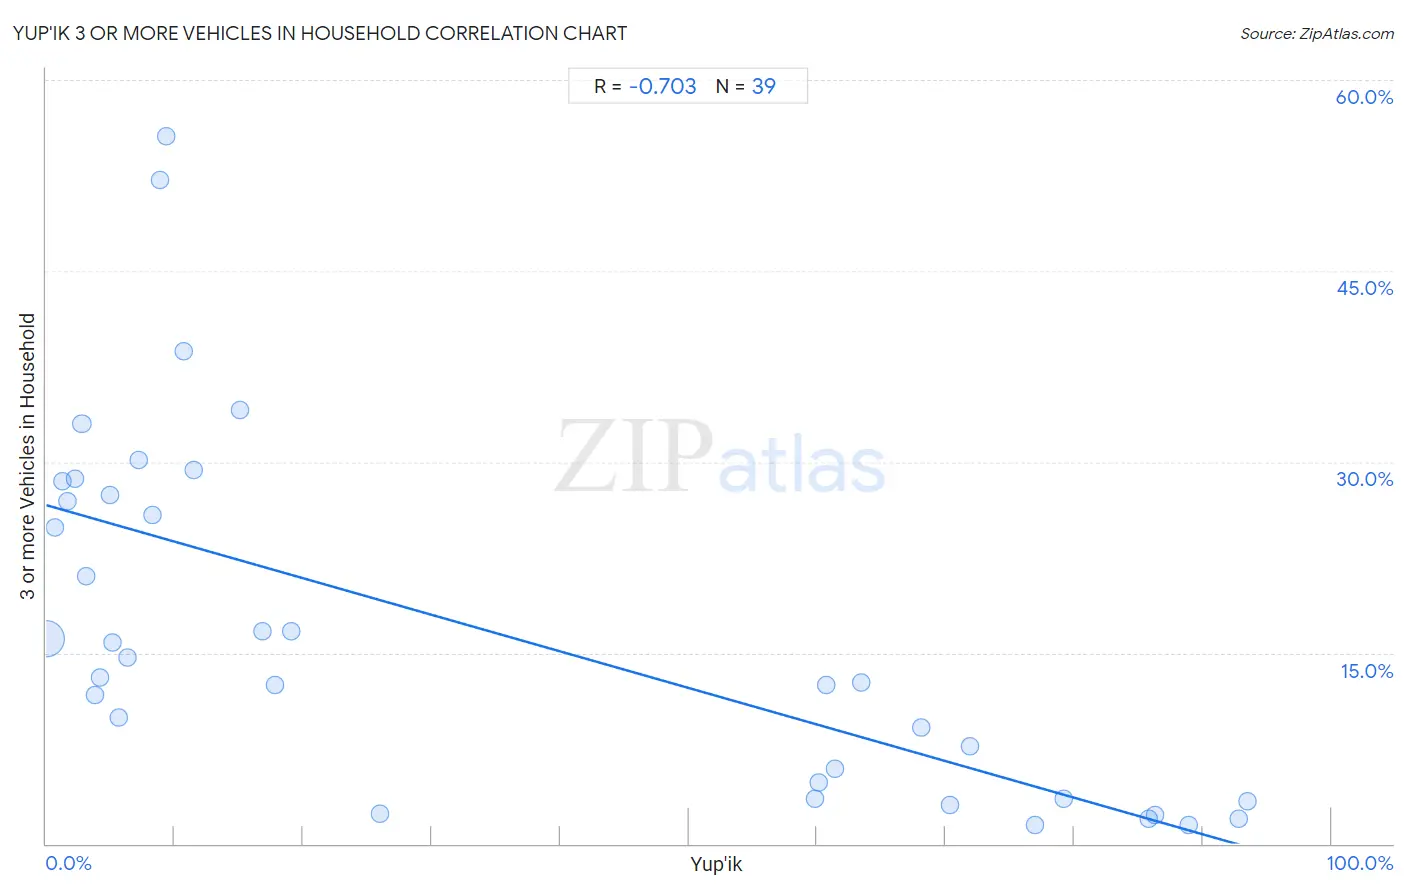
Yup'ik 3 or more Vehicles in Household Correlation Chart
The statistical analysis conducted on geographies consisting of 39,914,717 people shows a strong negative correlation between the proportion of Yup'ik and percentage of households with 3 or more vehicles available in the United States with a correlation coefficient (R) of -0.703 and weighted average of 14.8%. On average, for every 1% (one percent) increase in Yup'ik within a typical geography, there is a decrease of 0.29% in percentage of households with 3 or more vehicles available.
It is essential to understand that the correlation between the percentage of Yup'ik and percentage of households with 3 or more vehicles available does not imply a direct cause-and-effect relationship. It remains uncertain whether the presence of Yup'ik influences an upward or downward trend in the level of percentage of households with 3 or more vehicles available within an area, or if Yup'ik simply ended up residing in those areas with higher or lower levels of percentage of households with 3 or more vehicles available due to other factors.
Demographics Similar to Yup'ik by 3 or more Vehicles in Household
In terms of 3 or more vehicles in household, the demographic groups most similar to Yup'ik are Cape Verdean (15.0%, a difference of 1.1%), Immigrants from Jamaica (14.7%, a difference of 1.1%), Immigrants from West Indies (14.6%, a difference of 1.4%), Immigrants from Caribbean (14.6%, a difference of 1.9%), and Immigrants from Haiti (15.2%, a difference of 2.3%).
| Demographics | Rating | Rank | 3 or more Vehicles in Household |
| Immigrants from Israel | 0.0 /100 | #313 | Tragic 15.6% |
| Immigrants from Belarus | 0.0 /100 | #314 | Tragic 15.5% |
| Haitians | 0.0 /100 | #315 | Tragic 15.5% |
| U.S. Virgin Islanders | 0.0 /100 | #316 | Tragic 15.4% |
| Jamaicans | 0.0 /100 | #317 | Tragic 15.2% |
| Immigrants from Haiti | 0.0 /100 | #318 | Tragic 15.2% |
| Cape Verdeans | 0.0 /100 | #319 | Tragic 15.0% |
| Yup'ik | 0.0 /100 | #320 | Tragic 14.8% |
| Immigrants from Jamaica | 0.0 /100 | #321 | Tragic 14.7% |
| Immigrants from West Indies | 0.0 /100 | #322 | Tragic 14.6% |
| Immigrants from Caribbean | 0.0 /100 | #323 | Tragic 14.6% |
| Immigrants from Yemen | 0.0 /100 | #324 | Tragic 14.2% |
| Senegalese | 0.0 /100 | #325 | Tragic 14.2% |
| Soviet Union | 0.0 /100 | #326 | Tragic 14.2% |
| Ecuadorians | 0.0 /100 | #327 | Tragic 14.1% |
Yup'ik 3 or more Vehicles in Household Correlation Summary
| Measurement | Yup'ik Data | 3 or more Vehicles in Household Data |
| Minimum | 0.022% | 1.4% |
| Maximum | 93.5% | 55.6% |
| Range | 93.5% | 54.1% |
| Mean | 33.6% | 16.9% |
| Median | 15.1% | 13.1% |
| Interquartile 25% (IQ1) | 5.0% | 3.6% |
| Interquartile 75% (IQ3) | 68.1% | 27.4% |
| Interquartile Range (IQR) | 63.2% | 23.9% |
| Standard Deviation (Sample) | 34.1% | 13.9% |
| Standard Deviation (Population) | 33.6% | 13.8% |
Correlation Details
| Yup'ik Percentile | Sample Size | 3 or more Vehicles in Household |
[ 0.0% - 0.5% ] 0.022% | 38,685,806 | 16.2% |
[ 0.5% - 1.0% ] 0.66% | 259,925 | 24.9% |
[ 1.0% - 1.5% ] 1.22% | 181,235 | 28.5% |
[ 1.5% - 2.0% ] 1.66% | 92,710 | 26.9% |
[ 2.0% - 2.5% ] 2.28% | 93,636 | 28.7% |
[ 2.5% - 3.0% ] 2.77% | 56,569 | 33.0% |
[ 3.0% - 3.5% ] 3.10% | 320,587 | 21.0% |
[ 3.5% - 4.0% ] 3.76% | 24,230 | 11.7% |
[ 4.0% - 4.5% ] 4.16% | 27,469 | 13.1% |
[ 4.5% - 5.0% ] 4.96% | 30,662 | 27.4% |
[ 5.0% - 5.5% ] 5.12% | 59,649 | 15.8% |
[ 5.5% - 6.0% ] 5.67% | 3,087 | 9.9% |
[ 6.0% - 6.5% ] 6.33% | 38,572 | 14.6% |
[ 7.0% - 7.5% ] 7.18% | 418 | 30.1% |
[ 8.0% - 8.5% ] 8.26% | 109 | 25.8% |
[ 8.5% - 9.0% ] 8.88% | 439 | 52.1% |
[ 9.0% - 9.5% ] 9.31% | 1,707 | 55.6% |
[ 10.5% - 11.0% ] 10.71% | 2,027 | 38.6% |
[ 11.0% - 11.5% ] 11.49% | 383 | 29.4% |
[ 15.0% - 15.5% ] 15.07% | 836 | 34.1% |
[ 16.5% - 17.0% ] 16.84% | 95 | 16.7% |
[ 17.5% - 18.0% ] 17.78% | 90 | 12.5% |
[ 19.0% - 19.5% ] 19.11% | 450 | 16.7% |
[ 25.5% - 26.0% ] 25.96% | 235 | 2.3% |
[ 59.5% - 60.0% ] 59.78% | 92 | 3.6% |
[ 60.0% - 60.5% ] 60.14% | 715 | 4.8% |
[ 60.5% - 61.0% ] 60.74% | 2,175 | 12.5% |
[ 61.0% - 61.5% ] 61.34% | 551 | 5.9% |
[ 63.0% - 63.5% ] 63.45% | 2,577 | 12.7% |
[ 68.0% - 68.5% ] 68.12% | 6,312 | 9.1% |
[ 70.0% - 70.5% ] 70.36% | 830 | 3.1% |
[ 71.5% - 72.0% ] 71.84% | 8,157 | 7.6% |
[ 76.5% - 77.0% ] 76.99% | 843 | 1.4% |
[ 79.0% - 79.5% ] 79.18% | 1,364 | 3.5% |
[ 85.5% - 86.0% ] 85.85% | 1,088 | 1.9% |
[ 86.0% - 86.5% ] 86.29% | 992 | 2.3% |
[ 88.5% - 89.0% ] 88.91% | 3,389 | 1.5% |
[ 92.5% - 93.0% ] 92.76% | 4,614 | 2.0% |
[ 93.0% - 93.5% ] 93.48% | 92 | 3.3% |