Yup'ik Disability Age 5 to 17

COMPARE

Yup'ik
Race
Ancestry
AfghanAfricanAlaska NativeAlaskan AthabascanAlbanianAleutAlsatianAmericanApacheArabArapahoArgentineanArmenianAssyrian/Chaldean/SyriacAustralianAustrianBahamianBangladeshiBarbadianBasqueBelgianBelizeanBermudanBhutaneseBlackfeetBolivianBrazilianBritishBritish West IndianBulgarianBurmeseCajunCambodianCanadianCape VerdeanCarpatho RusynCelticCentral AmericanCentral American IndianCherokeeCheyenneChickasawChileanChineseChippewaChoctawColombianColvilleComancheCosta RicanCreeCreekCroatianCrowCubanCypriotCzechCzechoslovakianDanishDelawareDominicanDutchDutch West IndianEastern EuropeanEcuadorianEgyptianEnglishEstonianEthiopianEuropeanFijianFilipinoFinnishFrenchFrench American IndianFrench CanadianGermanGerman RussianGhanaianGreekGuamanian/ChamorroGuatemalanGuyaneseHaitianHmongHonduranHopiHoumaHungarianIcelanderIndian (Asian)IndonesianInupiatIranianIraqiIrishIroquoisIsraeliItalianJamaicanJapaneseJordanianKenyanKiowaKoreanLaotianLatvianLebaneseLiberianLithuanianLumbeeLuxembourgerMacedonianMalaysianMalteseMarshalleseMenomineeMexicanMexican American IndianMongolianMoroccanNative HawaiianNavajoNepaleseNew ZealanderNicaraguanNigerianNorthern EuropeanNorwegianOkinawanOsageOttawaPaiutePakistaniPalestinianPanamanianParaguayanPennsylvania GermanPeruvianPimaPolishPortuguesePotawatomiPuebloPuerto RicanPuget Sound SalishRomanianRussianSalvadoranSamoanScandinavianScotch-IrishScottishSeminoleSenegaleseSerbianShoshoneSierra LeoneanSiouxSlavicSlovakSloveneSomaliSouth AfricanSouth AmericanSouth American IndianSoviet UnionSpaniardSpanishSpanish AmericanSpanish American IndianSri LankanSubsaharan AfricanSudaneseSwedishSwissSyrianTaiwaneseThaiTlingit-HaidaTohono O'OdhamTonganTrinidadian and TobagonianTsimshianTurkishU.S. Virgin IslanderUgandanUkrainianUruguayanUteVenezuelanVietnameseWelshWest IndianYakamaYaquiYugoslavianYumanYup'ikZimbabwean
Immigration
NonimmigrantsImmigrantsAfghanistanAfricaAlbaniaArgentinaArmeniaAsiaAustraliaAustriaBahamasBangladeshBarbadosBelarusBelgiumBelizeBoliviaBosnia and HerzegovinaBrazilBulgariaBurma/MyanmarCabo VerdeCambodiaCameroonCanadaCaribbeanCentral AmericaChileChinaColombiaCongoCosta RicaCroatiaCubaCzechoslovakiaDenmarkDominicaDominican RepublicEastern AfricaEastern AsiaEastern EuropeEcuadorEgyptEl SalvadorEnglandEritreaEthiopiaEuropeFijiFranceGermanyGhanaGreeceGrenadaGuatemalaGuyanaHaitiHondurasHong KongHungaryIndiaIndonesiaIranIraqIrelandIsraelItalyJamaicaJapanJordanKazakhstanKenyaKoreaKuwaitLaosLatin AmericaLatviaLebanonLiberiaLithuaniaMalaysiaMexicoMicronesiaMiddle AfricaMoldovaMoroccoNepalNetherlandsNicaraguaNigeriaNorth AmericaNorth MacedoniaNorthern AfricaNorthern EuropeNorwayOceaniaPakistanPanamaPeruPhilippinesPolandPortugalRomaniaRussiaSaudi ArabiaScotlandSenegalSerbiaSierra LeoneSingaporeSomaliaSouth AfricaSouth AmericaSouth Central AsiaSouth Eastern AsiaSouthern EuropeSpainSri LankaSt. Vincent and the GrenadinesSudanSwedenSwitzerlandSyriaTaiwanThailandTrinidad and TobagoTurkeyUgandaUkraineUruguayUzbekistanVenezuelaVietnamWest IndiesWestern AfricaWestern AsiaWestern EuropeYemenZaireZimbabweAzores
Select to Compare
Race
Ancestry
AfghanAfricanAlaska NativeAlaskan AthabascanAlbanianAleutAlsatianAmericanApacheArabArapahoArgentineanArmenianAssyrian/Chaldean/SyriacAustralianAustrianBahamianBangladeshiBarbadianBasqueBelgianBelizeanBermudanBhutaneseBlackfeetBolivianBrazilianBritishBritish West IndianBulgarianBurmeseCajunCambodianCanadianCape VerdeanCarpatho RusynCelticCentral AmericanCentral American IndianCherokeeCheyenneChickasawChileanChineseChippewaChoctawColombianColvilleComancheCosta RicanCreeCreekCroatianCrowCubanCypriotCzechCzechoslovakianDanishDelawareDominicanDutchDutch West IndianEastern EuropeanEcuadorianEgyptianEnglishEstonianEthiopianEuropeanFijianFilipinoFinnishFrenchFrench American IndianFrench CanadianGermanGerman RussianGhanaianGreekGuamanian/ChamorroGuatemalanGuyaneseHaitianHmongHonduranHopiHoumaHungarianIcelanderIndian (Asian)IndonesianInupiatIranianIraqiIrishIroquoisIsraeliItalianJamaicanJapaneseJordanianKenyanKiowaKoreanLaotianLatvianLebaneseLiberianLithuanianLumbeeLuxembourgerMacedonianMalaysianMalteseMarshalleseMenomineeMexicanMexican American IndianMongolianMoroccanNative HawaiianNavajoNepaleseNew ZealanderNicaraguanNigerianNorthern EuropeanNorwegianOkinawanOsageOttawaPaiutePakistaniPalestinianPanamanianParaguayanPennsylvania GermanPeruvianPimaPolishPortuguesePotawatomiPuebloPuerto RicanPuget Sound SalishRomanianRussianSalvadoranSamoanScandinavianScotch-IrishScottishSeminoleSenegaleseSerbianShoshoneSierra LeoneanSiouxSlavicSlovakSloveneSomaliSouth AfricanSouth AmericanSouth American IndianSoviet UnionSpaniardSpanishSpanish AmericanSpanish American IndianSri LankanSubsaharan AfricanSudaneseSwedishSwissSyrianTaiwaneseThaiTlingit-HaidaTohono O'OdhamTonganTrinidadian and TobagonianTsimshianTurkishU.S. Virgin IslanderUgandanUkrainianUruguayanUteVenezuelanVietnameseWelshWest IndianYakamaYaquiYugoslavianYumanZimbabwean
Immigration
NonimmigrantsImmigrantsAfghanistanAfricaAlbaniaArgentinaArmeniaAsiaAustraliaAustriaBahamasBangladeshBarbadosBelarusBelgiumBelizeBoliviaBosnia and HerzegovinaBrazilBulgariaBurma/MyanmarCabo VerdeCambodiaCameroonCanadaCaribbeanCentral AmericaChileChinaColombiaCongoCosta RicaCroatiaCubaCzechoslovakiaDenmarkDominicaDominican RepublicEastern AfricaEastern AsiaEastern EuropeEcuadorEgyptEl SalvadorEnglandEritreaEthiopiaEuropeFijiFranceGermanyGhanaGreeceGrenadaGuatemalaGuyanaHaitiHondurasHong KongHungaryIndiaIndonesiaIranIraqIrelandIsraelItalyJamaicaJapanJordanKazakhstanKenyaKoreaKuwaitLaosLatin AmericaLatviaLebanonLiberiaLithuaniaMalaysiaMexicoMicronesiaMiddle AfricaMoldovaMoroccoNepalNetherlandsNicaraguaNigeriaNorth AmericaNorth MacedoniaNorthern AfricaNorthern EuropeNorwayOceaniaPakistanPanamaPeruPhilippinesPolandPortugalRomaniaRussiaSaudi ArabiaScotlandSenegalSerbiaSierra LeoneSingaporeSomaliaSouth AfricaSouth AmericaSouth Central AsiaSouth Eastern AsiaSouthern EuropeSpainSri LankaSt. Vincent and the GrenadinesSudanSwedenSwitzerlandSyriaTaiwanThailandTrinidad and TobagoTurkeyUgandaUkraineUruguayUzbekistanVenezuelaVietnamWest IndiesWestern AfricaWestern AsiaWestern EuropeYemenZaireZimbabweAzores
Disability Age 5 to 17
Income
Poverty
Unemployment
Labor Participation
Family Structure
Vehicle Availability
Education Level
Disability

Yup'ik Disability Age 5 to 17
Exceptional

4.8%
DISABILITY | AGE 5 TO 17
100.0/ 100
METRIC RATING
21st/ 347
METRIC RANK

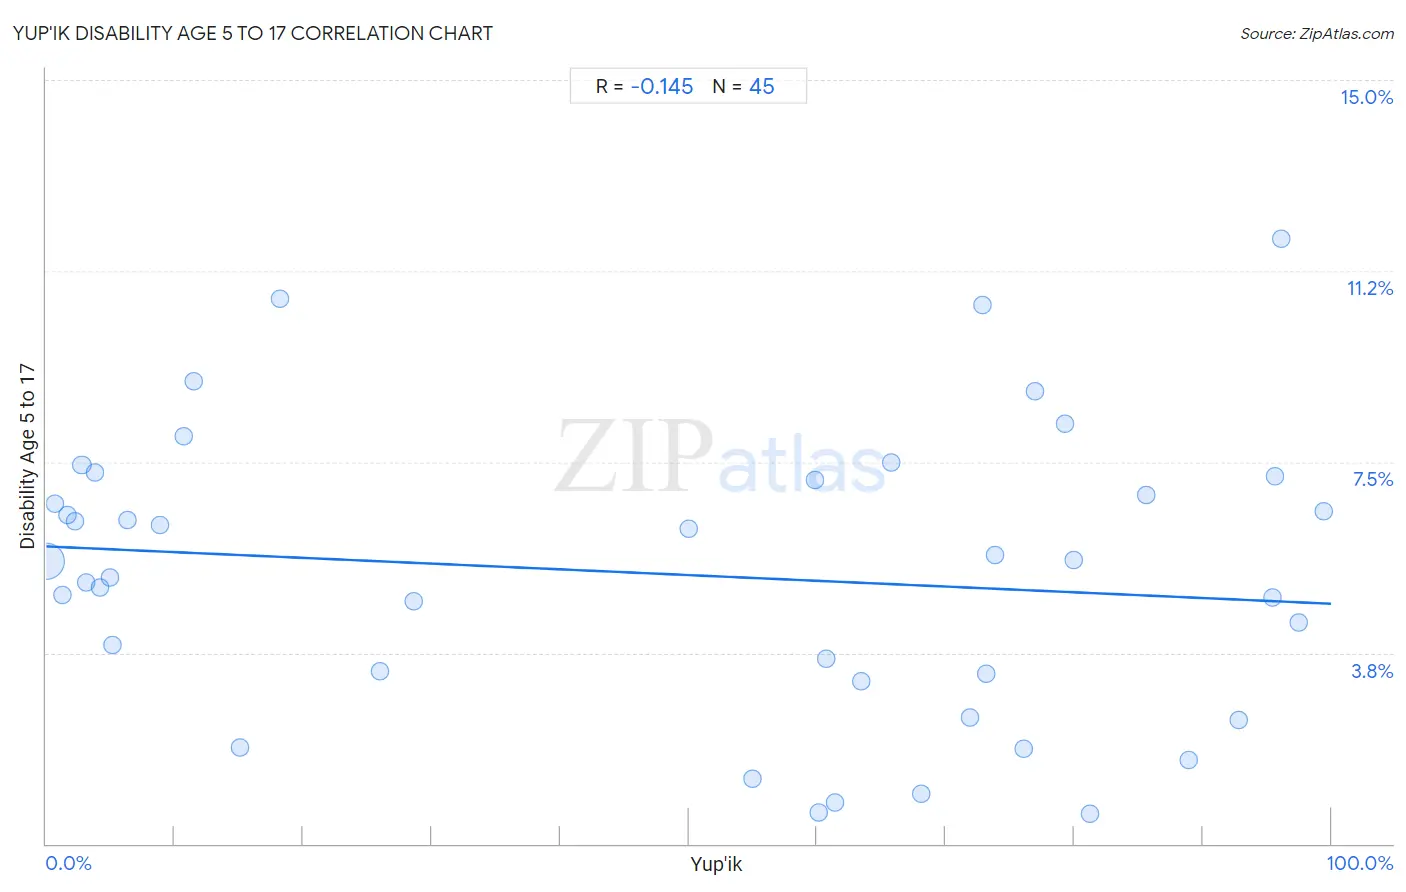
Yup'ik Disability Age 5 to 17 Correlation Chart

The statistical analysis conducted on geographies consisting of 39,814,891 people shows a poor negative correlation between the proportion of Yup'ik and percentage of population with a disability between the ages 5 and 17 in the United States with a correlation coefficient (R) of -0.145 and weighted average of 4.8%. On average, for every 1% (one percent) increase in Yup'ik within a typical geography, there is a decrease of 0.011% in percentage of population with a disability between the ages 5 and 17.
Yup'ik Disability Age 5 to 17
It is essential to understand that the correlation between the percentage of Yup'ik and percentage of population with a disability between the ages 5 and 17 does not imply a direct cause-and-effect relationship. It remains uncertain whether the presence of Yup'ik influences an upward or downward trend in the level of percentage of population with a disability between the ages 5 and 17 within an area, or if Yup'ik simply ended up residing in those areas with higher or lower levels of percentage of population with a disability between the ages 5 and 17 due to other factors.

Demographics Similar to Yup'ik by Disability Age 5 to 17

In terms of disability age 5 to 17, the demographic groups most similar to Yup'ik are Burmese (4.8%, a difference of 0.22%), Asian (4.8%, a difference of 0.34%), Immigrants from Uzbekistan (4.8%, a difference of 0.60%), Immigrants from Bolivia (4.8%, a difference of 1.0%), and Immigrants from South Central Asia (4.7%, a difference of 1.1%).
DemographicsRating | RankDisability Age 5 to 17
Immigrants from Korea
100.0
/100
|
#14
Exceptional
4.7%
Chinese
100.0
/100
|
#15
Exceptional
4.7%
Immigrants from Singapore
100.0
/100
|
#16
Exceptional
4.7%
Arapaho
100.0
/100
|
#17
Exceptional
4.7%
Immigrants from South Central Asia
100.0
/100
|
#18
Exceptional
4.7%
Immigrants from Uzbekistan
100.0
/100
|
#19
Exceptional
4.8%
Burmese
100.0
/100
|
#20
Exceptional
4.8%
Yup'ik
100.0
/100
|
#21
Exceptional
4.8%
Asians
100.0
/100
|
#22
Exceptional
4.8%
Immigrants from Bolivia
100.0
/100
|
#23
Exceptional
4.8%
Immigrants from Lebanon
100.0
/100
|
#24
Exceptional
4.8%
Immigrants from Asia
100.0
/100
|
#25
Exceptional
4.8%
Bhutanese
100.0
/100
|
#26
Exceptional
4.9%
Taiwanese
100.0
/100
|
#27
Exceptional
4.9%
Immigrants from Japan
100.0
/100
|
#28
Exceptional
4.9%

Yup'ik Disability Age 5 to 17 Correlation Summary

MeasurementYup'ik DataDisability Age 5 to 17 Data
Minimum0.021%0.58%
Maximum99.4%11.9%
Range99.4%11.3%
Mean47.5%5.3%
Median60.1%5.6%
Interquartile 25% (IQ1)5.7%3.3%
Interquartile 75% (IQ3)78.1%7.2%
Interquartile Range (IQR)72.4%3.9%
Standard Deviation (Sample)36.1%2.8%
Standard Deviation (Population)35.7%2.8%

Correlation Details

Yup'ik PercentileSample SizeDisability Age 5 to 17
[
0.0%
-
0.5%
]
0.021%
38,590,2805.6%
[
0.5%
-
1.0%
]
0.66%
249,8716.7%
[
1.0%
-
1.5%
]
1.22%
180,0714.9%
[
1.5%
-
2.0%
]
1.66%
90,8186.5%
[
2.0%
-
2.5%
]
2.28%
93,3246.3%
[
2.5%
-
3.0%
]
2.77%
54,7027.4%
[
3.0%
-
3.5%
]
3.10%
319,2865.1%
[
3.5%
-
4.0%
]
3.75%
21,2417.3%
[
4.0%
-
4.5%
]
4.15%
26,5835.0%
[
4.5%
-
5.0%
]
4.96%
30,6625.2%
[
5.0%
-
5.5%
]
5.12%
59,6493.9%
[
6.0%
-
6.5%
]
6.33%
38,6986.4%
[
8.5%
-
9.0%
]
8.88%
4396.2%
[
10.5%
-
11.0%
]
10.70%
1,7758.0%
[
11.0%
-
11.5%
]
11.49%
3839.1%
[
15.0%
-
15.5%
]
15.07%
8361.9%
[
18.0%
-
18.5%
]
18.20%
91210.7%
[
25.5%
-
26.0%
]
25.96%
2353.4%
[
28.5%
-
29.0%
]
28.57%
6304.8%
[
50.0%
-
50.5%
]
50.00%
8646.2%
[
54.5%
-
55.0%
]
54.98%
1,7681.3%
[
59.5%
-
60.0%
]
59.78%
927.1%
[
60.0%
-
60.5%
]
60.14%
7150.63%
[
60.5%
-
61.0%
]
60.74%
2,1753.6%
[
61.0%
-
61.5%
]
61.34%
5510.82%
[
63.0%
-
63.5%
]
63.45%
2,5773.2%
[
65.5%
-
66.0%
]
65.78%
9007.5%
[
68.0%
-
68.5%
]
68.12%
6,3120.98%
[
71.5%
-
72.0%
]
71.84%
8,1572.5%
[
72.5%
-
73.0%
]
72.89%
76010.6%
[
73.0%
-
73.5%
]
73.15%
5963.3%
[
73.5%
-
74.0%
]
73.79%
1,4425.7%
[
76.0%
-
76.5%
]
76.04%
1,8281.9%
[
76.5%
-
77.0%
]
76.99%
8438.9%
[
79.0%
-
79.5%
]
79.27%
2,0748.3%
[
79.5%
-
80.0%
]
79.92%
4,1845.6%
[
81.0%
-
81.5%
]
81.19%
1,3080.58%
[
85.5%
-
86.0%
]
85.61%
4,8526.9%
[
88.5%
-
89.0%
]
88.88%
2,1581.6%
[
92.5%
-
93.0%
]
92.76%
4,5582.4%
[
95.0%
-
95.5%
]
95.43%
2,2764.8%
[
95.5%
-
96.0%
]
95.59%
1,1787.2%
[
96.0%
-
96.5%
]
96.16%
1,19711.9%
[
97.0%
-
97.5%
]
97.43%
7784.3%
[
99.0%
-
99.5%
]
99.43%
3536.5%