Yup'ik College, 1 year or more
COMPARE
Yup'ik
Select to Compare
College, 1 year or more
Yup'ik College, 1 year or more
39.4%
COLLEGE, 1 YEAR OR MORE
0.0/ 100
METRIC RATING
347th/ 347
METRIC RANK
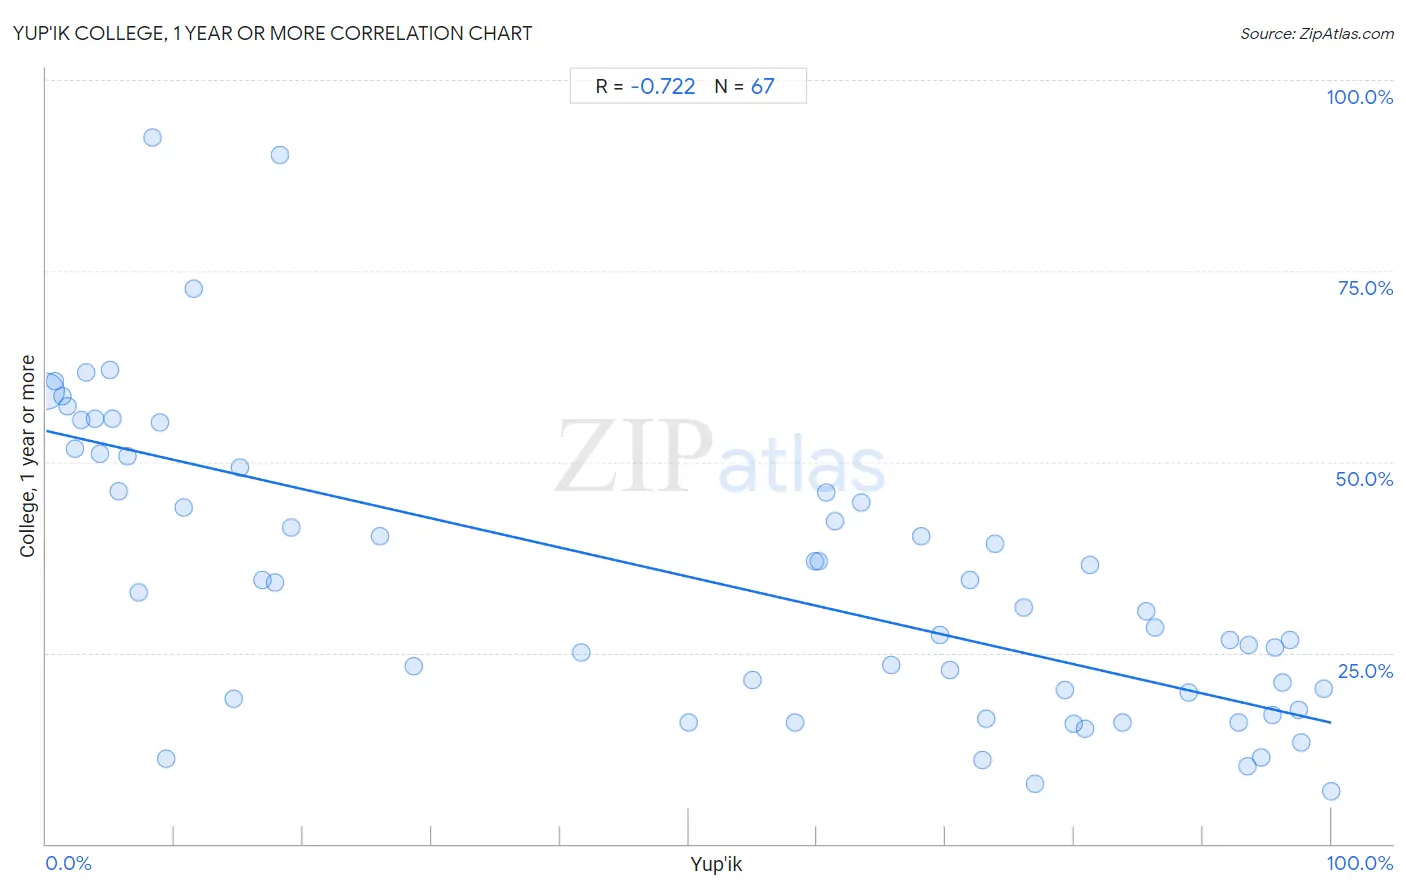
Yup'ik College, 1 year or more Correlation Chart
The statistical analysis conducted on geographies consisting of 39,964,300 people shows a strong negative correlation between the proportion of Yup'ik and percentage of population with at least college, 1 year or more education in the United States with a correlation coefficient (R) of -0.722 and weighted average of 39.4%. On average, for every 1% (one percent) increase in Yup'ik within a typical geography, there is a decrease of 0.38% in percentage of population with at least college, 1 year or more education.
It is essential to understand that the correlation between the percentage of Yup'ik and percentage of population with at least college, 1 year or more education does not imply a direct cause-and-effect relationship. It remains uncertain whether the presence of Yup'ik influences an upward or downward trend in the level of percentage of population with at least college, 1 year or more education within an area, or if Yup'ik simply ended up residing in those areas with higher or lower levels of percentage of population with at least college, 1 year or more education due to other factors.
Demographics Similar to Yup'ik by College, 1 year or more
In terms of college, 1 year or more, the demographic groups most similar to Yup'ik are Houma (41.2%, a difference of 4.5%), Pima (45.6%, a difference of 15.7%), Yakama (46.2%, a difference of 17.2%), Tohono O'odham (47.1%, a difference of 19.5%), and Inupiat (47.2%, a difference of 19.8%).
| Demographics | Rating | Rank | College, 1 year or more |
| Immigrants from Dominican Republic | 0.0 /100 | #333 | Tragic 49.1% |
| Lumbee | 0.0 /100 | #334 | Tragic 48.9% |
| Yuman | 0.0 /100 | #335 | Tragic 48.7% |
| Spanish American Indians | 0.0 /100 | #336 | Tragic 48.5% |
| Pennsylvania Germans | 0.0 /100 | #337 | Tragic 48.5% |
| Immigrants from Central America | 0.0 /100 | #338 | Tragic 48.5% |
| Immigrants from the Azores | 0.0 /100 | #339 | Tragic 48.4% |
| Immigrants from Cabo Verde | 0.0 /100 | #340 | Tragic 48.1% |
| Immigrants from Mexico | 0.0 /100 | #341 | Tragic 47.5% |
| Inupiat | 0.0 /100 | #342 | Tragic 47.2% |
| Tohono O'odham | 0.0 /100 | #343 | Tragic 47.1% |
| Yakama | 0.0 /100 | #344 | Tragic 46.2% |
| Pima | 0.0 /100 | #345 | Tragic 45.6% |
| Houma | 0.0 /100 | #346 | Tragic 41.2% |
| Yup'ik | 0.0 /100 | #347 | Tragic 39.4% |
Yup'ik College, 1 year or more Correlation Summary
| Measurement | Yup'ik Data | College, 1 year or more Data |
| Minimum | 0.022% | 6.9% |
| Maximum | 100.0% | 92.4% |
| Range | 100.0% | 85.5% |
| Mean | 50.6% | 34.7% |
| Median | 60.7% | 30.9% |
| Interquartile 25% (IQ1) | 9.3% | 19.0% |
| Interquartile 75% (IQ3) | 83.8% | 49.2% |
| Interquartile Range (IQR) | 74.5% | 30.2% |
| Standard Deviation (Sample) | 36.5% | 19.3% |
| Standard Deviation (Population) | 36.2% | 19.2% |
Correlation Details
| Yup'ik Percentile | Sample Size | College, 1 year or more |
[ 0.0% - 0.5% ] 0.022% | 38,689,805 | 59.2% |
[ 0.5% - 1.0% ] 0.66% | 263,209 | 60.5% |
[ 1.0% - 1.5% ] 1.22% | 184,613 | 58.5% |
[ 1.5% - 2.0% ] 1.66% | 92,710 | 57.2% |
[ 2.0% - 2.5% ] 2.28% | 95,408 | 51.6% |
[ 2.5% - 3.0% ] 2.77% | 57,473 | 55.4% |
[ 3.0% - 3.5% ] 3.10% | 321,211 | 61.8% |
[ 3.5% - 4.0% ] 3.76% | 24,258 | 55.6% |
[ 4.0% - 4.5% ] 4.16% | 27,609 | 51.0% |
[ 4.5% - 5.0% ] 4.95% | 31,565 | 62.0% |
[ 5.0% - 5.5% ] 5.12% | 59,649 | 55.6% |
[ 5.5% - 6.0% ] 5.67% | 3,087 | 46.1% |
[ 6.0% - 6.5% ] 6.33% | 38,698 | 50.8% |
[ 7.0% - 7.5% ] 7.18% | 1,588 | 32.8% |
[ 8.0% - 8.5% ] 8.26% | 109 | 92.4% |
[ 8.5% - 9.0% ] 8.88% | 439 | 55.2% |
[ 9.0% - 9.5% ] 9.31% | 1,707 | 11.1% |
[ 10.5% - 11.0% ] 10.71% | 2,027 | 44.1% |
[ 11.0% - 11.5% ] 11.49% | 383 | 72.7% |
[ 14.5% - 15.0% ] 14.63% | 41 | 19.0% |
[ 15.0% - 15.5% ] 15.07% | 836 | 49.2% |
[ 16.5% - 17.0% ] 16.84% | 95 | 34.6% |
[ 17.5% - 18.0% ] 17.78% | 90 | 34.2% |
[ 18.0% - 18.5% ] 18.20% | 912 | 90.2% |
[ 19.0% - 19.5% ] 19.11% | 450 | 41.5% |
[ 25.5% - 26.0% ] 25.96% | 235 | 40.3% |
[ 28.5% - 29.0% ] 28.57% | 630 | 23.3% |
[ 41.5% - 42.0% ] 41.67% | 12 | 25.0% |
[ 50.0% - 50.5% ] 50.00% | 870 | 15.8% |
[ 54.5% - 55.0% ] 54.98% | 1,768 | 21.5% |
[ 58.0% - 58.5% ] 58.30% | 1,602 | 15.8% |
[ 59.5% - 60.0% ] 59.78% | 92 | 37.0% |
[ 60.0% - 60.5% ] 60.14% | 715 | 37.1% |
[ 60.5% - 61.0% ] 60.74% | 2,175 | 46.0% |
[ 61.0% - 61.5% ] 61.34% | 551 | 42.2% |
[ 63.0% - 63.5% ] 63.45% | 2,577 | 44.7% |
[ 65.5% - 66.0% ] 65.78% | 900 | 23.4% |
[ 68.0% - 68.5% ] 68.12% | 6,312 | 40.2% |
[ 69.5% - 70.0% ] 69.57% | 46 | 27.3% |
[ 70.0% - 70.5% ] 70.36% | 830 | 22.8% |
[ 71.5% - 72.0% ] 71.84% | 8,157 | 34.5% |
[ 72.5% - 73.0% ] 72.89% | 760 | 11.0% |
[ 73.0% - 73.5% ] 73.15% | 596 | 16.3% |
[ 73.5% - 74.0% ] 73.79% | 1,442 | 39.4% |
[ 76.0% - 76.5% ] 76.04% | 1,828 | 30.9% |
[ 76.5% - 77.0% ] 76.99% | 843 | 7.8% |
[ 79.0% - 79.5% ] 79.27% | 2,316 | 20.1% |
[ 79.5% - 80.0% ] 79.92% | 4,184 | 15.7% |
[ 80.5% - 81.0% ] 80.82% | 146 | 15.0% |
[ 81.0% - 81.5% ] 81.19% | 1,308 | 36.6% |
[ 83.5% - 84.0% ] 83.77% | 616 | 15.9% |
[ 85.5% - 86.0% ] 85.63% | 5,358 | 30.5% |
[ 86.0% - 86.5% ] 86.29% | 992 | 28.3% |
[ 88.5% - 89.0% ] 88.91% | 3,389 | 19.8% |
[ 92.0% - 92.5% ] 92.11% | 190 | 26.7% |
[ 92.5% - 93.0% ] 92.76% | 4,614 | 15.8% |
[ 93.0% - 93.5% ] 93.49% | 614 | 10.2% |
[ 93.5% - 94.0% ] 93.59% | 234 | 26.0% |
[ 94.5% - 95.0% ] 94.53% | 950 | 11.3% |
[ 95.0% - 95.5% ] 95.40% | 3,128 | 16.9% |
[ 95.5% - 96.0% ] 95.59% | 1,178 | 25.7% |
[ 96.0% - 96.5% ] 96.20% | 2,209 | 21.2% |
[ 96.5% - 97.0% ] 96.77% | 62 | 26.7% |
[ 97.0% - 97.5% ] 97.43% | 778 | 17.5% |
[ 97.5% - 98.0% ] 97.67% | 430 | 13.2% |
[ 99.0% - 99.5% ] 99.43% | 353 | 20.2% |
[ 99.5% - 100.0% ] 100.00% | 338 | 6.9% |