Yup'ik vs Assyrian/Chaldean/Syriac Married-Couple Family Poverty
COMPARE
Yup'ik
Assyrian/Chaldean/Syriac
Married-Couple Family Poverty
Married-Couple Family Poverty Comparison
Yup'ik
Assyrians/Chaldeans/Syriacs
13.4%
MARRIED-COUPLE FAMILY POVERTY
0.0/ 100
METRIC RATING
347th/ 347
METRIC RANK
4.9%
MARRIED-COUPLE FAMILY POVERTY
89.4/ 100
METRIC RATING
135th/ 347
METRIC RANK
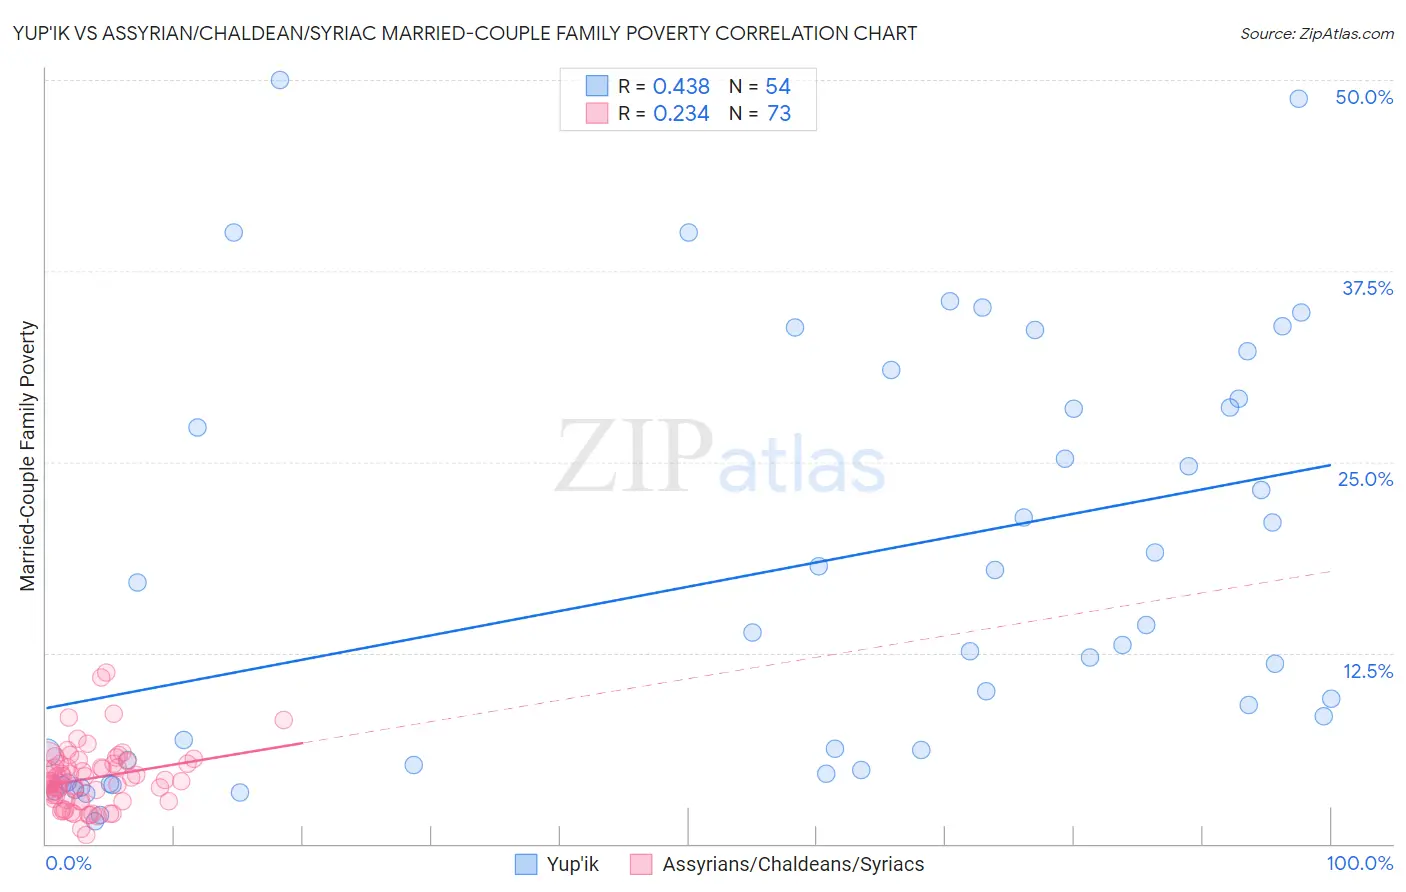
Yup'ik vs Assyrian/Chaldean/Syriac Married-Couple Family Poverty Correlation Chart
The statistical analysis conducted on geographies consisting of 39,863,865 people shows a moderate positive correlation between the proportion of Yup'ik and poverty level among married-couple families in the United States with a correlation coefficient (R) of 0.438 and weighted average of 13.4%. Similarly, the statistical analysis conducted on geographies consisting of 109,936,047 people shows a weak positive correlation between the proportion of Assyrians/Chaldeans/Syriacs and poverty level among married-couple families in the United States with a correlation coefficient (R) of 0.234 and weighted average of 4.9%, a difference of 173.5%.
Married-Couple Family Poverty Correlation Summary
| Measurement | Yup'ik | Assyrian/Chaldean/Syriac |
| Minimum | 1.5% | 0.54% |
| Maximum | 50.0% | 11.2% |
| Range | 48.5% | 10.6% |
| Mean | 17.5% | 4.3% |
| Median | 13.4% | 4.1% |
| Interquartile 25% (IQ1) | 5.1% | 2.8% |
| Interquartile 75% (IQ3) | 28.6% | 5.2% |
| Interquartile Range (IQR) | 23.4% | 2.4% |
| Standard Deviation (Sample) | 13.4% | 2.0% |
| Standard Deviation (Population) | 13.3% | 2.0% |
Similar Demographics by Married-Couple Family Poverty
Demographics Similar to Yup'ik by Married-Couple Family Poverty
In terms of married-couple family poverty, the demographic groups most similar to Yup'ik are Immigrants from Yemen (12.8%, a difference of 4.6%), Puerto Rican (12.6%, a difference of 6.0%), Navajo (11.9%, a difference of 13.0%), Pima (11.4%, a difference of 17.4%), and Tohono O'odham (11.2%, a difference of 19.3%).
| Demographics | Rating | Rank | Married-Couple Family Poverty |
| Lumbee | 0.0 /100 | #333 | Tragic 8.3% |
| Immigrants | Dominican Republic | 0.0 /100 | #334 | Tragic 8.4% |
| Sioux | 0.0 /100 | #335 | Tragic 8.7% |
| Apache | 0.0 /100 | #336 | Tragic 9.0% |
| Yakama | 0.0 /100 | #337 | Tragic 9.0% |
| Cheyenne | 0.0 /100 | #338 | Tragic 9.4% |
| Crow | 0.0 /100 | #339 | Tragic 9.6% |
| Yuman | 0.0 /100 | #340 | Tragic 9.7% |
| Pueblo | 0.0 /100 | #341 | Tragic 11.1% |
| Tohono O'odham | 0.0 /100 | #342 | Tragic 11.2% |
| Pima | 0.0 /100 | #343 | Tragic 11.4% |
| Navajo | 0.0 /100 | #344 | Tragic 11.9% |
| Puerto Ricans | 0.0 /100 | #345 | Tragic 12.6% |
| Immigrants | Yemen | 0.0 /100 | #346 | Tragic 12.8% |
| Yup'ik | 0.0 /100 | #347 | Tragic 13.4% |
Demographics Similar to Assyrians/Chaldeans/Syriacs by Married-Couple Family Poverty
In terms of married-couple family poverty, the demographic groups most similar to Assyrians/Chaldeans/Syriacs are Immigrants from Hungary (4.9%, a difference of 0.22%), Samoan (4.9%, a difference of 0.28%), Immigrants from Kenya (4.9%, a difference of 0.29%), Puget Sound Salish (4.9%, a difference of 0.36%), and Immigrants from Eastern Europe (4.9%, a difference of 0.37%).
| Demographics | Rating | Rank | Married-Couple Family Poverty |
| Palestinians | 91.2 /100 | #128 | Exceptional 4.9% |
| Immigrants | Pakistan | 90.7 /100 | #129 | Exceptional 4.9% |
| Soviet Union | 90.7 /100 | #130 | Exceptional 4.9% |
| Immigrants | Eastern Europe | 90.5 /100 | #131 | Exceptional 4.9% |
| Puget Sound Salish | 90.4 /100 | #132 | Exceptional 4.9% |
| Immigrants | Kenya | 90.2 /100 | #133 | Exceptional 4.9% |
| Samoans | 90.2 /100 | #134 | Exceptional 4.9% |
| Assyrians/Chaldeans/Syriacs | 89.4 /100 | #135 | Excellent 4.9% |
| Immigrants | Hungary | 88.7 /100 | #136 | Excellent 4.9% |
| Guamanians/Chamorros | 86.5 /100 | #137 | Excellent 4.9% |
| Chileans | 86.0 /100 | #138 | Excellent 4.9% |
| German Russians | 85.1 /100 | #139 | Excellent 5.0% |
| Immigrants | Portugal | 84.8 /100 | #140 | Excellent 5.0% |
| Immigrants | Brazil | 84.6 /100 | #141 | Excellent 5.0% |
| Immigrants | China | 84.6 /100 | #142 | Excellent 5.0% |